

Abstract
Evaluation of time trends in dietary quality and their relation to disease burden provides essential feedback for policy making. We used an index titled the Alternate Healthy Eating Index 2010 to evaluate trends in dietary quality among 33,885 US adults. From 1999 to 2012, the index increased from 39.9 to 48.2 (perfect score = 110). Gaps in performance on the index persisted across socioeconomic groups or widened. Using data relating index scores to health outcomes in two large cohorts, we estimated that the improvements in dietary quality from 1999 to 2012 prevented 1,064,840 premature deaths. Also, this improvement in diet quality resulted in 8.6 percent fewer cardiovascular disease cases, 1.3 percent fewer cancer cases, and 12.6 percent fewer type 2 diabetes cases. Although the steady improvement in dietary quality likely accounted for substantial reductions in disease burden from 1999 to 2012, overall dietary quality in the US remains poor. Policy initiatives are needed to ensure further improvements.
Trends of dietary quality over time result from consumers’ dietary behaviors. Consumers’ behaviors, in turn, are influenced by the social, economic, and environmental context of food desirability, affordability, and availability.[1] Knowledge of these trends provides essential feedback for the design of interventions and policy initiatives to promote healthy eating and ultimately achieve the goal of chronic disease prevention. One approach to the evaluation of dietary quality is to calculate a summary index reflecting an individual’s adherence to predefined dietary criteria that predict lower risk of chronic disease. We previously used the Alternate Healthy Eating Index (AHEI) to investigate the temporal trend in dietary quality in the United States and found a modest improvement from 1999 through 2010. The AHEI was developed in 2002 and updated by incorporating the best available evidence on diet and health in 2010.[2] The AHEI includes the key components of healthful diets, including higher consumption of plant sources of fats, fish, nuts, whole grains, fruits, and vegetables, and low consumption of partially hydrogenated fat, red meat, and refined carbohydrates.[3] Previous studies have validated scores on the AHEI as a strong predictor of major chronic disease risk,[2] mortality,[4] and biomarkers of major chronic disease.[5] As the latest cycle of nationwide dietary data has been released recently, an update of the trend in dietary quality measured by the AHEI is warranted.
A substantial body of evidence connects healthful diets to reduced morbidity and mortality from major chronic disease.[3] In the science-based, 10-year national agenda for improving population health-the Healthy People 2020, prevention of chronic disease through healthful diets was highlighted as a national objective.[6] Therefore, determining the changes in population health, what we call avoided disease burden, that can be attributed to the changing trends in dietary quality provides useful information because the analysis of the trends evaluates the impact of current food and nutrition policy and provides guidance for future actions. The change in disease burden related to the trends in overall dietary quality has not been documented, although the disease burden attributable to certain individual dietary factors has been previously reported.[7]
In this study, we used a nationally representative adult population to investigate temporal trends in dietary quality from 1999 to 2012 and to estimate the impact of these trends on chronic disease burden and death.
Study Data And Methods
Alternate Healthy Eating Index 2010
The AHEI was developed from a review of the relevant literature and discussions among nutrition researchers to identify foods and nutrients that have been consistently associated with risk of chronic disease in clinical and epidemiologic investigations.[2] The eleven-dimensional AHEI ranges from 0 (nonadherence) to 110 (perfect adherence); each of the components is scored from 0 to 10. For fruits, vegetables, whole grains, nuts and legumes, long-chain omega-3 fatty acids (mainly from seafood), and polyunsaturated fats, a higher score indicates higher intake. For trans fat, sugar-sweetened beverages and fruit juices, red and processed meat, and sodium, a higher score indicates lower intake. For alcohol, we assigned the highest score to moderate consumption and the lowest score to heavy consumption. Detailed information on the AHEI-2010 and scoring methods can be found in the online Appendix Exhibit A1.[8]
Data Sources
The study population used to evaluate dietary trends consisted of 33,885 adults ages twenty years and older who were included in seven National Health and Nutrition Examination Survey (NHANES) cycles from 1999 through 2012. Each cycle contained a nationally representative sample of the US population. The response rates for the interview portion ranged from 72.6 percent (2011–12) to 83.9 percent (2001–02). Details of study design and operations may be found elsewhere.[9] Dietary data were collected by an interviewer-administered, computer-assisted, twenty-four-hour dietary recall. Twenty-four-hour dietary recall is an in-depth interview conducted by a trained interviewer who solicits detailed information about everything that the participant eats and drinks in the prior twenty-four hours. From 1999 to 2002, one twenty-four-hour dietary recall was collected in person from study participants; from 2003 to 2012, a second recall was administered over the phone. Based on the dietary data, we created six AHEI food groups; the food groups and detailed definitions can be found in Appendix Exhibit A2.[8] The food groups included vegetables (excluding potatoes and juices), fruits (excluding juices), whole grains (including brown rice, popcorn, and any grain food with a carbohydrate-to-fiber ratio ≤ 10:1), sugar-sweetened beverages and fruit juices, nuts and legumes, and red and processed meat, using modified food assignment methods in the Department of Agriculture (USDA) MyPyramid Equivalents Database.[10] Nutrient intakes were calculated using the USDA food composition databases with nutrient contributions from dietary supplements excluded.[11] Data on trans fat intake were not available in the NHANES because the earlier USDA food composition databases did not include trans fat. We, therefore, used published estimates from the Food and Drug Administration.[12] The values for 1999–2000 (4.6 g/day) and 2009–10 (1.3 g/day) were the average consumption of industrially produced trans fat data for the US population in the late 1990s and 2010. We assumed a linear temporal change of trans fat consumption to impute data for each cycle of the NHANES between 1999 and 2010 and extrapolated it to the NHANES 2011–12 cycle. The NHANES 1999–2012 was approved by the National Center for Health Statistics Research Ethics Review Board. Written informed consent of every participant was obtained.
Biological Effects Of Dietary Quality
We used estimates of the biological effects of dietary quality, that is, multivariable-adjusted sex-specific hazard ratio per unit of the AHEI, on incidence of major chronic diseases (coronary heart disease, stroke, cardiovascular disease [including both coronary heart disease and stroke], type 2 diabetes, and cancer) and mortality (all-cause mortality, cardiovascular disease mortality, and cancer mortality) from two ongoing prospective cohorts, the Nurses’ Health Study[13] of 121,700 women and the Health Professionals Follow-Up Study[14] of 51,529 men. Different from the NHANES which measured participants’ risk factors and disease status concurrently, the two prospective cohorts collected information on risk factors and disease status longitudinally over follow-up among participants who were disease-free at baseline. These estimates of the biological effects of dietary quality are likely to represent the best evidence to date on the relationship between long-term dietary intake and health outcomes because of the unique features of the two cohorts, including repeated and detailed measurements of diet and covariates, extended follow-up, and large sample size. We calculated the AHEI from dietary information collected using validated semiquantitative food frequency questionnaires every two or four years over the follow-up of the two cohorts. Nutrient intakes were calculated based on the Harvard University Food Composition Database, which was derived from USDA nutrient databases and other sources. Detailed information on the study design, operation, definitions of disease cases and deaths, and statistical modeling in the Nurses’ Health Study and the Health Professionals Follow-Up Study can be found in Appendix Exhibit A3.[8] The Nurses’ Health Study and the Health Professionals Follow-Up Study were approved by the human research committees at the Harvard T.H. Chan School of Public Health and the Brigham and Women’s Hospital.
Statistical Analysis
We applied the weights from the complex survey sample design of the NHANES to permit generalization to the US population. Using the AHEI calculated for each person from his or her twenty-four-hour recall information, multivariate linear regression was employed to calculate the energy-adjusted means for the AHEI and its component scores. We built other multivariate linear regression models to calculate covariate and energy-adjusted mean AHEI for socioeconomic subgroups defined by income (measured by poverty income ratio), education, race/ethnicity, and body mass index. To quantify time trends in the AHEI, the regression models included the midpoint of each survey time interval as a scored trend variable. The adjusted Wald F test with Bonferroni correction for multiple comparisons was used to test homogeneity of the AHEI across subgroups in each survey cycle. We also tested interactions between socioeconomic variables and temporal trend in the AHEI.
In the Nurses’ Health Study and the Health Professionals Follow-Up Study, we applied Cox proportional hazard models to estimate the biological effects of the AHEI. The models included the AHEI as an exposure variable and incidence of major chronic disease and mortality as outcomes, and simultaneously adjusted for potential confounding variables. For calculation of change in disease burden attributable to the improvement in dietary quality over time, we applied the hazard ratios from the Nurses’ Health Study and the Health Professionals Follow-Up Study to sex-specific distribution of the AHEI at each NHANES cycle to calculate the population-attributable fraction.[15] We also used hazard ratio for total mortality to estimate the number of premature deaths avoided at each NHANES cycle as the difference between the observed number of deaths from the National Vital Statistics System[16, 17] and the number predicted assuming no change in dietary quality from 1999–2000. More details of statistical analysis can be found in Appendix Exhibit A3.[8] All the analyses were conducted with SAS software, version 9.4 or Stata software, version 11.0. All p values were two-tailed (α = 0.05).
Limitations
There were some methodological limitations to our analysis. First, our estimation of time trends in dietary quality was based on data from the twenty-four-hour dietary recall that may not represent long-term usual diet. However, data from the twenty-four-hour dietary recall can provide accurate measures of population mean values. Second, the biological effects of dietary quality were derived from observational cohort studies. Although we carefully adjusted for multiple potential confounding variables, residual confounding could not be excluded. However, the hazard ratios from the Nurses’ Health Study and the Health Professionals Follow-Up Study observational cohort studies were largely consistent with those from randomized controlled trials modifying overall dietary quality, for example, the PREDIMED trial of the Mediterranean diet,[18] suggesting that residual confounding is likely to be minimal. Third, dietary measurement methods in the NHANES and the two cohort studies were different, which may potentially limit the comparability in assessment of dietary quality. However, our analysis adjusted for total energy intake to account for different patterns of measurement error embedded in the two dietary measurement methods.[19] Fourth, the methodology of twenty-four-hour dietary recall changed over the study period, which may influence the accuracy of dietary information. However, the changes in dietary quality were quite linear over time, suggesting that methodological differences were not responsible for our findings. Our assumptions in our calculations are that the health effects of diet occur rapidly; while some benefit will be delayed, dietary intervention studies show rapid reductions in risk of cardiovascular disease and diabetes.[18] Last, we calculated the hazard ratios that quantified the association of the AHEI with major chronic disease and mortality from two cohorts of health professionals, which were not representative of the US population. However, the hazard ratios represent the underlying physiological mechanisms relating dietary quality to health and are similar to those estimated from other cohorts with diverse sociodemographic characteristics, including the National Institutes of Health-AARP Diet and Health Study, the Multiethnic Cohort Study of Diet and Cancer, and the Women’s Health Initiative Observational Study.[4,20]
Study Results
From 1999 to 2012, the mean AHEI significantly increased from 39.9 to 48.2 (Exhibit 1). Reduction in trans fat consumption contributed about half of the improvement in the overall AHEI (Exhibit 2). The AHEI component scores significantly increased by 0.6 for fruits, 0.7 for whole grains, 0.5 for nuts and legumes, 1.0 for polyunsaturated fatty acids (reflecting increased consumption), 1.4 for sugar-sweetened beverages and juice, and 0.4 for red and processed meat (reflecting decreased consumption). However, we observed a significant decrease in the component score for sodium intake, reflecting greater intake over time. Component scores for vegetables, long-chain omega-3 fatty acids, and alcohol barely changed over time. The AHEI significantly increased in most socioeconomic subgroups (Exhibit 3). For full results, see Appendix Exhibit A4.[8] Participants with higher education level and healthier body weight not only showed higher AHEI but also greater improvements over time. While non-Hispanic black participants had the lowest AHEI, they showed significant improvement in dietary quality over time. Mexican Americans had the highest AHEI but showed no significant improvement in dietary quality. After further adjustment for other socioeconomic covariates, the significant differences between non-Hispanic whites and non-Hispanic blacks disappeared in most of the survey cycles, whereas the differences between Mexican Americans and non-Hispanic whites remained significant across all survey cycles.
Exhibit 1.
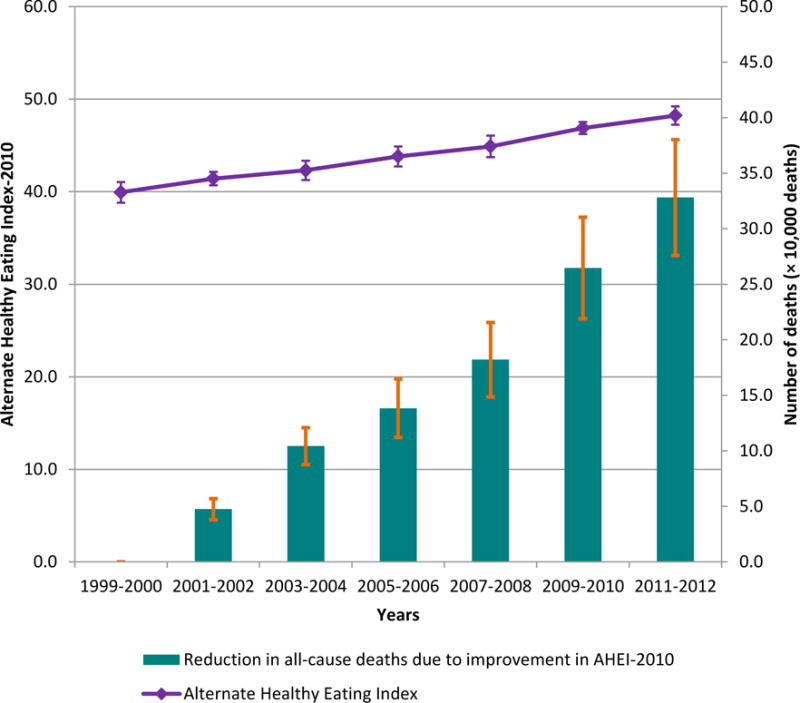
Change In Energy-Adjusted Mean Alternate Healthy Eating Index (AHEI) And Estimated Reduction In All-Cause Premature Deaths As A Result Of Improvement In The AHEI Among Adults Ages Twenty Years And Older From 1999 To 2012
SOURCE National Health and Nutrition Examination Survey 1999–2012.
Exhibit 2.
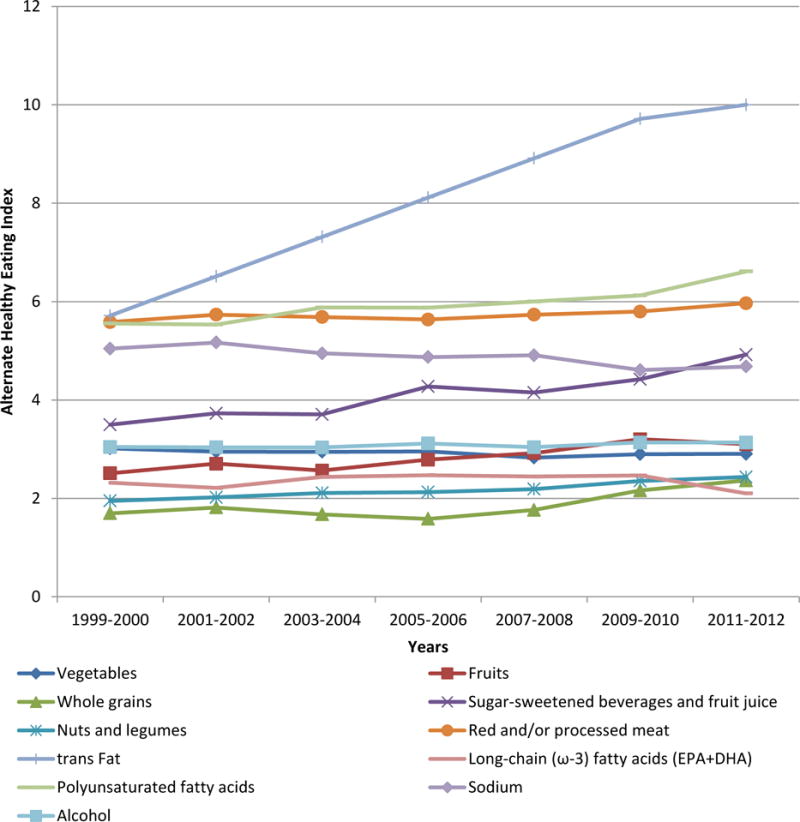
Energy-Adjusted Mean Alternate Healthy Eating Index Component Scores Among Adults Ages Twenty Years And Older By National Health and Nutrition Examination Survey Cycle
SOURCE National Health and Nutrition Examination Survey 1999–2012. NOTES For fruits, vegetables, whole grains, nuts and legumes, long-chain omega-3 fats, and polyunsaturated fatty acids, a higher score corresponded to higher intake. For trans fat, sugar-sweetened beverages, red and processed meat, and sodium, a higher score corresponded to lower intake. For alcohol, the highest score corresponded to moderate consumption and the lowest score to heavy consumption. Nondrinkers received a score of 2.5. DHA is docosahexaenoic acid. EPA is eicosapentaenoic acid. PUFA is polyunsaturated fatty acid.
Exhibit 3.
Time Trends In The Alternate Healthy Eating Index In Subgroups Defined By Education, Income, Race/Ethnicity, And Body Weight Status
| 1999–2000 | 2001–02 | 2003–04 | 2005–06 | 2007–08 | 2009–10 | 2011–12 | |
|---|---|---|---|---|---|---|---|
| Education | |||||||
| Less than high school | 40.1 | 41.1 | 42.0 | 43.0 | 44.2 | 45.3 | 46.4 |
| Graduated high school | 39.1 | 40.5 | 40.6 | 42.2 | 42.8 | 44.0 | 46.2 |
| Some college | 40.0 | 41.3 | 42.7 | 44.0 | 44.6 | 46.3 | 47.2 |
| Completed college | 43.3 | 43.8 | 45.5 | 46.1 | 48.1 | 51.1 | 51.8 |
| Family poverty income ratio | |||||||
| < 1.30 | 41.0 | 41.4 | 42.9 | 44.2 | 44.7 | 45.6 | 46.9 |
| 1.30–3.49 | 40.2 | 41.5 | 43.0 | 43.4 | 45.6 | 46.5 | 48.4 |
| ≥ 3.50 | 41.4 | 42.4 | 43.0 | 44.7 | 45.1 | 48.1 | 48.9 |
| Race/Ethnicity | |||||||
| Non-Hispanic white | 39.9 | 40.7 | 41.8 | 43.1 | 43.9 | 46.0 | 47.4 |
| Non-Hispanic black | 39.2 | 40.2 | 40.1 | 41.3 | 42.8 | 44.4 | 45.0 |
| Mexican American | 42.6 | 44.3 | 44.8 | 46.2 | 47.4 | 47.9 | 49.0 |
| Other | 40.2 | 41.5 | 44.4 | 44.5 | 46.3 | 47.7 | 49.3 |
| Body mass index (kg/m2) | |||||||
| < 25.0 | 40.7 | 42.4 | 43.3 | 44.4 | 45.6 | 47.5 | 49.0 |
| 25.0–29.9 | 41.5 | 41.9 | 43.5 | 44.6 | 45.1 | 48.1 | 49.0 |
| 30.0–34.9 | 39.9 | 41.3 | 41.7 | 43.4 | 44.7 | 46.0 | 47.6 |
| ≥ 35.0 | 40.4 | 40.1 | 42.0 | 42.7 | 44.3 | 45.0 | 45.8 |
SOURCE National Health and Nutrition Examination Survey 1999–2012.
NOTES Values are adjusted mean Alternate Healthy Eating Index estimated by multivariate linear regressions. Adjusted covariates are total energy intake (continuous), sex (male, female), age group (20–39, 40–64, ≥ 65 years), family poverty income ratio (< 1.30, 1.30–3.49, ≥ 3.50), education (less than high school, graduated high school, some college, completed college), and race/ethnicity (non-Hispanic white, non-Hispanic black, Mexican American, other), except for the variable of stratification. Other race/ethnicity group included Asian American, other Hispanic, and multiracial participants.
Exhibit 4 shows reductions in disease burden attributable to the improvements in the AHEI over time, calculated as percentages of incident chronic disease cases and deaths in each NHANES cycle. The difference in dietary quality between 1999–2000 and 2011–12 was responsible for 328,093 fewer all-cause deaths, accounting for 6.6 percent of total deaths in 2011–12 (Exhibits 1 and 4). Cumulatively, the increase in AHEI from 1999 through 2012 was responsible for 1,064,840 fewer all-cause premature deaths. Around one in ten deaths as a result of cardiovascular disease and one in forty deaths as a result of cancer in 2011–12 would have been prevented by the 8.3-point change in the AHEI from 1999 to 2012. The difference in the AHEI between 1999–2000 and 2011–12 was responsible for 8.6 percent fewer cardiovascular disease cases, 10.0 percent fewer coronary heart disease cases, 5.1 percent fewer stroke cases, 1.3 percent fewer cancer cases, and 12.6 percent fewer type 2 diabetes cases in 2011–12.
Exhibit 4.
Percentage Reductions In Incident Cases Of Major Chronic Disease And Deaths As A Result Of The Improvements In The Alternate Healthy Eating Index
| Years
|
||||||
|---|---|---|---|---|---|---|
| 2001–02 | 2003–04 | 2005–06 | 2007–08 | 2009–10 | 2011–12 | |
| Total mortality (%) | ||||||
| Women | 2.3 | 3.1 | 5.2 | 6.0 | 7.8 | 9.0 |
| Men | 0.6 | 1.4 | 1.8 | 2.5 | 3.7 | 4.4 |
| Pooled | 1.0 | 2.2 | 2.9 | 3.8 | 5.5 | 6.6 |
| Cardiovascular disease mortality (%) | ||||||
| Women | 5.0 | 6.7 | 11.0 | 12.6 | 16.2 | 18.5 |
| Men | 0.6 | 1.3 | 1.7 | 2.3 | 3.4 | 4.1 |
| Pooled | 1.2 | 3.0 | 3.8 | 5.3 | 8.0 | 9.8 |
| Cancer mortality | ||||||
| Women | 0.6 | 0.9 | 1.4 | 1.7 | 2.2 | 2.5 |
| Men | 0.4 | 0.8 | 1.0 | 1.4 | 2.1 | 2.5 |
| Pooled | 0.5 | 0.8 | 1.1 | 1.5 | 2.1 | 2.5 |
| Cardiovascular disease incident cases (%) | ||||||
| Women | 3.4 | 4.6 | 7.6 | 8.7 | 11.3 | 13.0 |
| Men | 0.9 | 1.9 | 2.5 | 3.4 | 5.0 | 5.9 |
| Pooled | 1.2 | 2.8 | 3.7 | 5.1 | 7.3 | 8.6 |
| Coronary heart disease incident cases (%) | ||||||
| Women | 4.4 | 5.9 | 9.6 | 11.0 | 14.3 | 16.4 |
| Men | 1.1 | 2.3 | 3.0 | 4.2 | 6.0 | 7.2 |
| Pooled | 1.6 | 3.2 | 4.2 | 5.8 | 8.3 | 10.0 |
| Stroke incident cases (%) | ||||||
| Women | 2.3 | 3.0 | 5.0 | 5.8 | 7.6 | 8.7 |
| Men | 0.2 | 0.4 | 0.5 | 0.7 | 1.1 | 1.3 |
| Pooled | 0.7 | 1.6 | 2.1 | 2.9 | 4.3 | 5.1 |
| Cancer incident cases (%) | ||||||
| Women | 0.3 | 0.4 | 0.7 | 0.8 | 1.0 | 1.2 |
| Men | 0.2 | 0.5 | 0.6 | 0.8 | 1.2 | 1.5 |
| Pooled | 0.2 | 0.4 | 0.7 | 0.8 | 1.1 | 1.3 |
| Type 2 diabetes incident cases (%) | ||||||
| Women | 4.2 | 5.7 | 9.3 | 10.6 | 13.8 | 15.8 |
| Men | 1.2 | 2.6 | 3.3 | 4.6 | 6.6 | 7.9 |
| Pooled | 2.1 | 4.2 | 5.8 | 7.7 | 10.7 | 12.6 |
SOURCE National Health and Nutrition Examination Survey 1999–2012.
NOTES Values were calculated based on comparison in Alternate Healthy Eating Index between each National Health and Nutrition Examination Survey (NHANES) cycle later than 2000 and the NHANES 1999–2000. Results were combined using the fixed-effects model of meta-analysis.
Discussion
We observed a steady improvement in dietary quality in US adults from 1999 through 2012, which accounted for a substantial reduction in disease burden. However, the overall mean AHEI never achieved even 50 points on a scale from 0 to 110, indicating that the quality of the US diet remains far from optimal. We also observed persistent or widening gaps in dietary quality across different socioeconomic subgroups. The quality of diet in non-Hispanic black participants, although significantly improved over time, was still lower than other race/ethnicity groups.
As a result of a series of educational efforts and legislative and regulatory actions from mandatory disclosure of the trans fat on nutrition labels in 2006 to the Food and Drug Administration’s most recent ban on partially hydrogenated oils for any use in human food, reduction in consumption of trans fat (mainly from partially hydrogenated oils) contributed about half of the improvement in dietary quality, which indicates the effectiveness and efficiency of actions aimed at changing the environment to support consumers’ healthy choice of food.[21] The reduction in consumption of sugar-sweetened beverages and juice (by 35.6 percent) was likely a result of a combination of education, voluntary restrictions, and regulations, such as the banning of soda in schools and other public properties in Boston.[22] In comparison to the prominent reductions in consumption of trans fat and sugar-sweetened beverages, other key components of dietary quality were still far short of the optimal goals. Some areas showed limited, albeit encouraging, improvements, such as increasing consumption of fruit, whole grains, nuts and legumes, and polyunsaturated fatty acids, and decreasing consumption of red and processed meat [Exhibit 2]. In contrast, consumption of vegetables and long-chain omega-3 fatty acids did not increase, while sodium intake increased over time. [Exhibit 2]Perhaps current interventions targeting these components, for example, front-of-package labeling systems rating healthfulness of products, have resulted in only moderate behavioral changes because they rely on personal responsibility, that is, to assist consumers to make informed choices. [23] Therefore, collective actions aimed at creating an environment that fosters and supports individuals’ healthful choices should be among the top priorities of policy makers.[23] In addition, we cannot expect trans fat reduction to contribute further improvement in overall dietary quality because it has been almost eliminated from the US food supply. More focused policy initiatives to address other components of healthy eating, for example, expansion of taxation on sugary beverages and mandatory reformulation to reduce salt in processed foods, are needed to maintain and accelerate improvements in diet.
To our knowledge, our study is the first documentation of the disease burden attributed to temporal changes in dietary quality. Even small improvements in dietary quality can lead to substantial reduction in disease burden, providing further justification for legislative and regulatory actions to address food supply more broadly. Our legislatures and governments have been granted the authorities to reduce short-term risk of unhealthful foods, that is, to prevent and control food-borne diseases, through timely and stringent measures.[21] It will be equally appropriate if the long-term risk of unhealthful foods, that is, morbidity and mortality of chronic diseases, is addressed by legislative and regulatory actions.
Despite dramatic expansion of federal food and nutrition assistance programs, gaps in dietary quality across socioeconomic groups have persisted or increased in recent years. Groups with low-socioeconomic status and non-Hispanic blacks generally had poor dietary quality. Current agricultural policy arrangements that channel tax payer subsidies for row crops but do not support fruit and vegetable growers are at odds with a US food supply system designed to deliver an affordable and healthful diet for low-income populations.[24] Also, populations with low-socioeconomic status may have limited access to healthful foods and lack enough nutrition knowledge in making healthy food choices.[25] Our modeling results suggested that the differences in dietary quality between non-Hispanic whites and non-Hispanic blacks were largely explained by socioeconomic inequity, while other factors, such as dietary traditions and cultural differences, may have played a more important role in the differences between non-Hispanic whites and Mexican Americans. Given the complexity of these contributing factors, federal programs that mainly rely on financial assistance are likely insufficient solutions to address these disparities, especially the gap in dietary quality between African-Americans and other ethnicity groups. Additional efforts will be needed to integrate nutrition education and programs that improve access to healthful foods into these federal programs.
Conclusion
We observed a steady improvement in dietary quality of US adults, which has contributed to a substantial reduction in disease burden. Nevertheless, the overall dietary quality of the US population remains poor; disparities across different socioeconomic groups increased throughout the period. Except for trans fat, key components of healthful diets only showed modest or no improvements. The role of government action in reducing trans fats has set a successful precedent. Policy initiatives are urgently needed to address other healthy eating components to maintain and accelerate improvements in diet, in particular to reduce the large and growing disparities between socioeconomic groups that translate directly into greater differences in morbidity and mortality.
Supplementary Material
Acknowledgments
We are indebted to the participants and staff of the National Health and Nutrition Examination Survey for their outstanding contributions.
We would like to thank the participants and staff of the Nurses’ Health Study and the Health Professionals Follow-up Study for their valuable contributions as well as the following state cancer registries for their help: AL, AZ, AR, CA, CO, CT, DE, FL, GA, ID, IL, IN, IA, KY, LA, ME, MD, MA, MI, NE, NH, NJ, NY, NC, ND, OH, OK, OR, PA, RI, SC, TN, TX, VA, WA, WY.
The authors assume full responsibility for analyses and interpretation of these data.
The Nurses’ Health Study and the Health Professionals Follow-up Study were supported by research grants UM1 CA186107, P01 CA87969, R01 HL034594, R01 HL088521, UM1 CA167552 and R01 HL35464 from the National Institutes of Health.
Biographies
Dong D. Wang (dow471@mail.harvard.edu) is a doctoral candidate in the Departments of Nutrition and Epidemiology at the Harvard T.H. Chan School of Public Health, in Boston, Massachusetts.
Yanping Li is a research scientist in the Department of Nutrition at the Harvard T.H. Chan School of Public Health, in Boston, Massachusetts.
Stephanie E. Chiuve is an assistant professor in the Departments of Nutrition and Epidemiology at the Harvard T. H. Chan School of Public Health, and the Division of Preventive Medicine, the Department of Medicine at Harvard Medical School, in Boston, Massachusetts.
Frank B. Hu is a professor in the Departments of Nutrition and Epidemiology at the Harvard T.H. Chan School of Public Health and the Channing Division of Network Medicine, the Department of Medicine at the Brigham and Women’s Hospital and Harvard Medical School, in Boston, Massachusetts.
Walter Willett is a professor in the Departments of Nutrition and Epidemiology at the Harvard T.H. Chan School of Public Health and the Channing Division of Network Medicine, the Department of Medicine at the Brigham and Women’s Hospital and Harvard Medical School, in Boston, Massachusetts.
Contributor Information
Dong D. Wang, Email: dow471@mail.harvard.edu, Departments of Nutrition and Epidemiology, Harvard T.H. Chan School of Public Health, Boston, Massachusetts.
Yanping Li, Department of Nutrition, Harvard T.H. Chan School of Public Health, Boston, Massachusetts.
Stephanie E. Chiuve, Departments of Nutrition and Epidemiology, Harvard T. H. Chan School of Public Health, and Division of Preventive Medicine, Department of Medicine, Harvard Medical School, Boston, Massachusetts
Frank B. Hu, Departments of Nutrition and Epidemiology, Harvard T.H. Chan School of Public Health, Channing Division of Network Medicine, and Department of Medicine, Brigham and Women’s Hospital and Harvard Medical School, Boston, Massachusetts
Walter Willett, Departments of Nutrition and Epidemiology, Harvard T.H. Chan School of Public Health, Channing Division of Network Medicine, and Department of Medicine, Brigham and Women’s Hospital and Harvard Medical School, Boston, Massachusetts.
Notes
- 1.Kumanyika SK. Environmental influences on childhood obesity: ethnic and cultural influences in context. Physiol Behav. 2008;94(1):61–70. doi: 10.1016/j.physbeh.2007.11.019. [DOI] [PubMed] [Google Scholar]
- 2.Chiuve SE, Fung TT, Rimm EB, Hu FB, McCullough ML, Wang M, et al. Alternative dietary indices both strongly predict risk of chronic disease. J Nutr. 2012;142(6):1009–18. doi: 10.3945/jn.111.157222. [DOI] [PMC free article] [PubMed] [Google Scholar]
- 3.Willett WC, Stampfer MJ. Current evidence on healthy eating. Annu Rev Public Health. 2013;34:77–95. doi: 10.1146/annurev-publhealth-031811-124646. [DOI] [PubMed] [Google Scholar]
- 4.Belin RJ, Greenland P, Allison M, Martin L, Shikany JM, Larson J, et al. Diet quality and the risk of cardiovascular disease: the Women’s Health Initiative (WHI) Am J Clin Nutr. 2011;94(1):49–57. doi: 10.3945/ajcn.110.011221. [DOI] [PMC free article] [PubMed] [Google Scholar]
- 5.Fung TT, McCullough ML, Newby PK, Manson JE, Meigs JB, Rifai N, et al. Diet-quality scores and plasma concentrations of markers of inflammation and endothelial dysfunction. Am J Clin Nutr. 2005;82(1):163–73. doi: 10.1093/ajcn.82.1.163. [DOI] [PubMed] [Google Scholar]
- 6.HealthyPeople.gov. Healthy People 2020 Topics and Objectives: Nutrition and Weight Status [Internet] Washington (DC): Department of Health and Human Services; [cited 2015 Sep 30}. Available from: http://www.healthypeople.gov/2020/topics-objectives/topic/nutrition-and-weight-status. [Google Scholar]
- 7.Danaei G, Ding EL, Mozaffarian D, Taylor B, Rehm J, Murray CJ, et al. The preventable causes of death in the United States: comparative risk assessment of dietary, lifestyle, and metabolic risk factors. PLoS Med. 2009;6(4):e1000058. doi: 10.1371/journal.pmed.1000058. [DOI] [PMC free article] [PubMed] [Google Scholar]
- 8.To access the Appendix, click on the Appendix link in the box to the right of the article online.
- 9.Centers for Disease Control and Prevention. National Health and Nutrition Examination Survey [Internet] Atlanta (GA): CDC; [cited 2015 Sep 30]. Available from: http://www.cdc.gov/nchs/nhanes/nhanes_questionnaires.htm. [Google Scholar]
- 10.Bowman SA, Friday JE, Moshfegh AJ. Beltsville (MD): Agricultural Research Service, Department of Agriculture; 2008. Sep, MyPyramid Equivalents Database, 2.0 for USDA survey foods, 2003–2004: documentation and user guide [Internet] [cited 2015 Sep 30]. Available from: http://www.ars.usda.gov/SP2UserFiles/Place/80400530/pdf/mped/mped2_doc.pdf. [Google Scholar]
- 11.Agricultural Research Service. Food and nutrient database for dietary studies [Internet] Beltsville (MD): Agricultural Research Service, Department of Agriculture; 2014. [cited 2015 Sep 30]. Available from: http://www.ars.usda.gov/Services/docs.htm?docid=12089. [Google Scholar]
- 12.Doell D, Folmer D, Lee H, Honigfort M, Carberry S. Updated estimate of trans fat intake by the US population. Food Addit Contam Part A Chem Anal Control Expo Risk Assess. 2012;29(6):861–74. doi: 10.1080/19440049.2012.664570. [DOI] [PubMed] [Google Scholar]
- 13.Harvard Medical School. Nurses’ Health Study [Internet] Boston (MA): Brigham and Women’s Hospital; [cited 2015 Sep 30]. Available from: http://www.channing.harvard.edu/nhs/ [Google Scholar]
- 14.Harvard T.H. Chan School of Public Health. Health Professionals Follow-Up Study [Internet] Boston (MA): Harvard T.H. Chan School of Public Health; [cited 2015 Sep 30]. Available from: https://www.hsph.harvard.edu/hpfs/ [Google Scholar]
- 15.Murray CJ, Lopez AD. On the comparable quantification of health risks: lessons from the Global Burden of Disease Study. Epidemiology. 1999;10(5):594–605. [PubMed] [Google Scholar]
- 16.Hoyert DL, Arias E, Smith BL, Murphy SL, Kochanek KD. Deaths: preliminary data for 1999. National Vital Statistics Reports. 2001;49(8):1–113. [PubMed] [Google Scholar]
- 17.Miniño AM, Arias E, Kochanek KD, Murphy SL, Smith BL. Deaths: preliminary data for 2000. National Vital Statistics Reports. 2002;50(15):1–120. [PubMed] [Google Scholar]
- 18.Estruch R, Ros E, Salas-Salvadó J, Covas MI, Corella D, Arós F, et al. Primary prevention of cardiovascular disease with a Mediterranean diet. N Engl J Med. 2013;368(14):1279–90. doi: 10.1056/NEJMoa1200303. [DOI] [PubMed] [Google Scholar]
- 19.Willett WC, Howe GR, Kushi LH. Adjustment for total energy intake in epidemiologic studies. Am J Clin Nutr. 1997;65(4 Suppl):1220S–8S. doi: 10.1093/ajcn/65.4.1220S. [DOI] [PubMed] [Google Scholar]
- 20.Liese AD, Krebs-Smith SM, Subar AF, George SM, Harmon BE, Neuhouser ML, et al. The Dietary Patterns Methods Project: synthesis of findings across cohorts and relevance to dietary guidance. J Nutr. 2015;145(3):393–402. doi: 10.3945/jn.114.205336. [DOI] [PMC free article] [PubMed] [Google Scholar]
- 21.Brownell KD, Pomeranz JL. The trans-fat ban–food regulation and long-term health. N Engl J Med. 2014;370(19):1773–5. doi: 10.1056/NEJMp1314072. [DOI] [PubMed] [Google Scholar]
- 22.Executive Order of Mayor Thomas M. Menino. An order relative to healthy beverage options [Internet] Boston (MA): CityofBoston.gov; 2011. Apr 7, [cited 2015 Sep 30]. Available from: http://www.cityofboston.gov/news/uploads/5742_40_7_25.pdf. [Google Scholar]
- 23.Brownell KD, Kersh R, Ludwig DS, Post RC, Puhl RM, Schwartz MB, et al. Personal Responsibility And Obesity: A Constructive Approach To A Controversial Issue. Health Affairs. 2010;29(3):379–387. doi: 10.1377/hlthaff.2009.0739. [DOI] [PubMed] [Google Scholar]
- 24.Krebs-Smith SM, Reedy J, Bosire C. Healthfulness of the U.S. food supply: little improvement despite decades of dietary guidance. Am J Prev Med. 2010;38(5):472–7. doi: 10.1016/j.amepre.2010.01.016. [DOI] [PMC free article] [PubMed] [Google Scholar]
- 25.Wardle J, Parmenter K, Waller J. Nutrition knowledge and food intake. Appetite. 2000;34(3):269–75. doi: 10.1006/appe.1999.0311. [DOI] [PubMed] [Google Scholar]
Associated Data
This section collects any data citations, data availability statements, or supplementary materials included in this article.