Abstract
Background
Accurate forecasting of cardiovascular disease (CVD) mortality is crucial to guide policy and programming efforts. Prior forecasts have often not incorporated past trends in rates of reduction in CVD mortality. This creates uncertainties about future trends in CVD mortality and disparities.
Methods and Results
To forecast US CVD mortality and disparities to 2030, we developed a hierarchical Bayesian model to determine and incorporate prior age, period and cohort (APC) effects from 1979–2012, stratified by age, gender and race; which we combined with expected demographic shifts to 2030. Data sources included the National Vital Statistics System, SEER single year population estimates, and US Bureau of Statistics 2012 National Population projections. We projected coronary disease and stroke deaths to 2030, first based on constant APC effects at 2012 values, as most commonly done (conventional); and then using more rigorous projections incorporating expected trends in APC effects (trend-based). We primarily evaluated absolute mortality. The conventional model projected total coronary and stroke deaths by 2030 to increase by approximately 18% (67,000 additional coronary deaths/year) and 50% (64,000 additional stroke deaths/year). Conversely, the trend-based model projected that coronary mortality would fall by 2030 by approximately 27% (79,000 fewer deaths/year); and stroke mortality would remain unchanged (200 fewer deaths/year). Health disparities will be improved in stroke deaths, but not coronary deaths.
Conclusions
After accounting for prior mortality trends and expected demographic shifts, total US coronary deaths are expected to decline, while stroke mortality will remain relatively constant. Health disparities in stroke, but not coronary, deaths will be improved but not eliminated. These APC approaches offer more plausible predictions than conventional estimates.
Keywords: Cardiovascular disease mortality, projections, race disparities
Introduction
Age-standardised cardiovascular disease (CVD) mortality rates in the US have declined substantially since the 1970s1, 2. Despite this, CVD still accounts for approximately 6 million hospital admissions and 800,000 deaths each year2. At the same time, massive shifts in population demographics have occurred, especially by age and race/ethnicity. Current projections3 suggest the US adult population (25+) will grow by approximately 19% from 208,000,000 in 2012 to approximately 248,000,000 by 2030. These projections estimate that the population over 75 years old will increase by as much as 78%, from approximately 19,000,000 to 34,000,000.
These trends are expected to continue4, with an 89% increase in the 85 years and older groups predicted by 2030. These combined factors each influence the total national burden of CVD, which is itself highly relevant for determining policies and resource planning. The CVD burden and mortality is also unequally distributed in the population, with substantial disparities by age, sex, and race/ethnicity5. Accurate projections of the future burden of CVD mortality, including corresponding disparities, are consequently of great importance and relevance to inform efficient and equitable policy making.
Several recent projections6–8 of the CVD burden, including one by the American Heart Associationt9 have been reported. These generally incorporate expected population growth and aging, but not past and recent declining trends in CVD mortality rates. Such methods could lead to substantial overestimates of the burden of CVD and CVD mortality in future years. For example, Weinsten et al10 used similar methods in the late 1980s, based on the assumption that current CHD mortality rates would remain relatively constant and predicted that CHD prevalence, incidence and mortality would increase as much as 40–50% by 2010 due to population ageing. These increases, however, were not observed. In reality, CHD deaths decreased by 40%, attributable to both non-medically-related decreases in population level risk factors and progress in clinical management such as primary and secondary drug treatment of risk factors, emergency responses, and hospital care.11 Incorporating past trends in CVD mortality, including differences in these trends by age, time period effect or race/ethnicity and other relevant factors, is crucial for more accurate forecasting.
To address these gaps, we therefore forecast future US CVD mortality to 2030 incorporating prior age, period and cohort trends, stratified by age, gender and race alongside stratified population projections.
Methods
The methodology for our CVD projections has been described elsewhere12 when projecting future CHD trends in England and Wales. Briefly, we used a hierarchical Bayesian Age Period Cohort (BAPC) model which assumes that the logit of risk of death in a particular age group and period is a linear combination of an intercept, an age effect, a period effect and a cohort effect (See supplemental material 2.1, supplemental figures 1–3). This method does not model gender or race effects directly, but we stratified the analysis by these subgroups to allow different CHD and stroke trends by gender and race/ethnicity.
Modelling scenarios
Using this methodology, we modelled two contrasting scenarios to provide projected cardiovascular mortality up to 2030, stratified by age, gender, race and cardiovascular disease subtype (CHD and stroke). The first step was to estimate the age, period and cohort effects between 1979 and 2012. Then in the first scenario, we held each of these components relatively constant at the values in their last year of observation (i.e. 2012). We called these “conventional projections” as this method can be seen as a BAPC version of the indirect standardisation method widely used to forecast mortality6–8.
In the second scenario, the ‘trend-based’ projections, we allowed the age, period and cohort effects to continue along their last observed trends (from 1979 to 2012), and extrapolated the resulting trajectory to 2030. We then multiplied the resulting mortality rates from both scenarios by age and gender specific population projections from census data to give number of deaths.
Data Sources
CVD Mortality
We obtained data on the number of annual CVD deaths (ICD codes: I00-09, I11, I13, I20-I51, I60-69) from 1979 to 2012 from the United States National Vital Statistics System13, with consistent use of coding system throughout this period. These data are available and were evaluated stratified by sex and 10-year age groups (25–34, 35–44, etc. until 85+ years). Data stratified by sex, age and race/ethnicity i.e. non-Hispanic white, non-Hispanic black, and Hispanic was available from 1990.
Population Demographics
Midyear estimates of the US population size were obtained from SEER single year population estimates.3 Projections of the population size to 2030, stratified by age, gender and race, were derived from the US Bureau 2012 National Population Projections14.
We also used the 2012 US population by age and gender as standard population to calculate age and gender adjusted mortality projections for both scenarios
Implementation and validation
Both model scenarios were implemented in the Bayesian Age-Period-Cohort Modelling Prediction software (BAMP)15. This software uses Markov Chain Monte Carlo (MCMC) processes for the model estimation. We compared both scenarios, by re-estimating the models using past data (1979–2001) to project mortality from 2002–2011 and compare these projections with observed data in terms of their predictive deviance (i.e. lower values of predictive deviance indicate a better fit, see supplemental table 1)
Race Analysis
We also estimated conventional and trend-based projections and generated mortality projections up to 2030 for each race group individually: non-Hispanic blacks, non-Hispanic whites and Hispanics. Racial CVD mortality disparities between the three groups were estimated using population-adjusted and age-adjusted rate ratios comparing non-Hispanic blacks and Hispanic with non-Hispanic whites in 2012 and 2030.
Age-Period and Cohort Analysis
Finally, using the parameter estimates from conventional projections model, we provided a descriptive analysis of the age, period and cohort effects on CVD mortality. Parameters from the trend-based projections cannot be interpreted in similar manner due to the imposed constraints (see supplemental material). Age is a strong determinant of CHD mortality; cohort effects could capture generational differences in life-course factors by year of birth and period effects capture temporal change in factors associated with development. For more details about the BAPC methodology, please see supplemental material. For more details about the software, please see Schmid et al.15
Results
CVD Mortality Projections
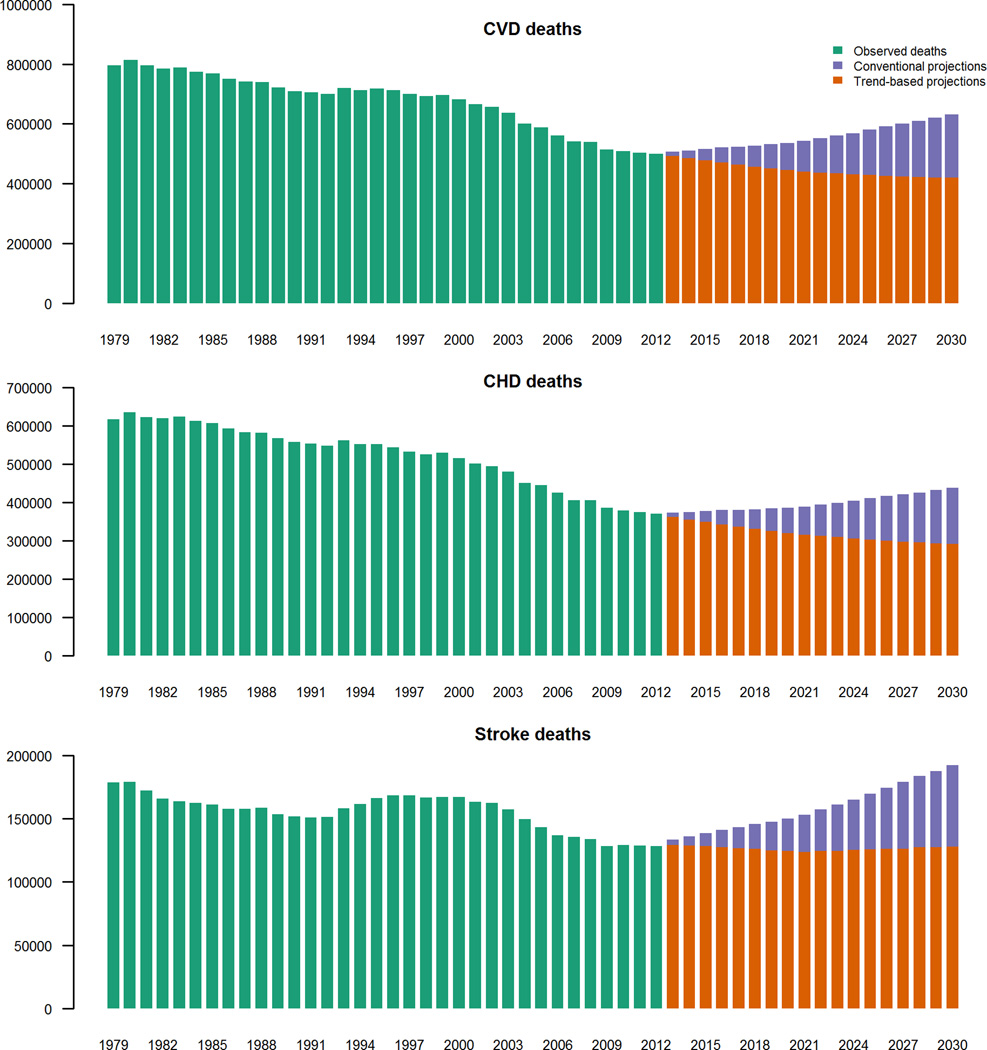
Due to population growth and increased ageing, the conventional model projected increases from 2012 to 2030 in total US CHD and stroke deaths by approximately 18% and 50% respectively, from 371,000 to 438,000 CHD deaths/year (95% credible intervals(CrI) 353,000–551,000) and from 128,000 to 192,000 stroke deaths/year (148,000–250,000) (figure 1, table 1). This equated to 67,000 and 64,000 additional CHD and stroke deaths per year respectively.
Figure 1.
Total number of CVD Deaths 1979–2030. Observed deaths 1979–2012, conventional projections and trend-based projections 2013–2030. Crude number of deaths, stratified by CVD subtype.
Table 1.
CHD and Stroke mortality projections in 2030, crude deaths stratified by age and gender with 95% lower (LCrI) and upper (UCrI) credible intervals. 1a, Conventional projections 1b, Trend-based projections.
| 1a. | ||||||
|---|---|---|---|---|---|---|
| CHD | Stroke | |||||
| Age | Mean | LCrI | UCrI | Mean | LCrI | UCrI |
| M 25–34 | 838 | 638 | 1114 | 303 | 220 | 421 |
| M 35–44 | 6083 | 4757 | 7816 | 1146 | 848 | 1534 |
| M 45–54 | 19278 | 15404 | 24233 | 2891 | 2153 | 3849 |
| M 55–64 | 31065 | 24880 | 39104 | 6347 | 4756 | 8452 |
| M 65–74 | 56973 | 45846 | 71209 | 17796 | 13239 | 23468 |
| M 75–84 | 73334 | 59310 | 91619 | 31810 | 23878 | 42297 |
| M 85+ | 62055 | 50365 | 77951 | 25048 | 18988 | 33650 |
| F 25–34 | 259 | 189 | 355 | 251 | 187 | 327 |
| F 35–44 | 1765 | 1368 | 2286 | 879 | 680 | 1133 |
| F 45–54 | 6631 | 5286 | 8404 | 2110 | 1661 | 2692 |
| F 55–64 | 15897 | 12749 | 20158 | 4695 | 3656 | 5927 |
| F 65–74 | 35054 | 28051 | 44261 | 15178 | 11905 | 19258 |
| F 75–84 | 52931 | 42599 | 67393 | 34722 | 27197 | 44596 |
| F 85+ | 75996 | 61086 | 95429 | 49103 | 38500 | 62479 |
| Totals | 438159 | 352528 | 551332 | 192279 | 147868 | 250083 |
| CVD Total | 630438 | 500396 | 801415 | |||
| 1b. | ||||||
|---|---|---|---|---|---|---|
| CHD | Stroke | |||||
| Age | Mean | LCrI | UCrI | Mean | LCrI | UCrI |
| M 25–34 | 856 | 468 | 1657 | 268 | 111 | 683 |
| M 35–44 | 5031 | 3167 | 8141 | 868 | 423 | 1955 |
| M 45–54 | 13166 | 8685 | 21225 | 2003 | 971 | 4260 |
| M 55–64 | 21548 | 14211 | 34330 | 4311 | 2117 | 9192 |
| M 65–74 | 38567 | 25202 | 61328 | 12070 | 5944 | 25614 |
| M 75–84 | 50084 | 32783 | 79061 | 21531 | 10469 | 45754 |
| M 85+ | 41882 | 27517 | 66348 | 16921 | 8295 | 35737 |
| F 25–34 | 255 | 122 | 547 | 185 | 73 | 463 |
| F 35–44 | 1382 | 761 | 2605 | 603 | 273 | 1384 |
| F 45–54 | 4237 | 2415 | 7726 | 1370 | 636 | 3039 |
| F 55–64 | 10294 | 5857 | 18647 | 3055 | 1396 | 6673 |
| F 65–74 | 22480 | 12886 | 40508 | 9920 | 4586 | 22151 |
| F 75–84 | 33931 | 19378 | 61279 | 22680 | 10400 | 50355 |
| F 85+ | 47978 | 27368 | 85627 | 32148 | 14568 | 70044 |
| Totals | 291691 | 180820 | 489029 | 127933 | 60262 | 277304 |
| CVD Total | 419624 | 241082 | 766333 | |||
In comparison, in the ‘trend based’ model, total US CHD mortality (figure 1) declined by approximately 27% to 292,000 CHD (95% CrI 181,000–489,000) (figure 1, table 1). These declines were predicted despite the growing as well as ageing population, and this equates to some 79,000fewer annual deaths by 2030. Declines in stroke mortality were non-significant (approximately 200 fewer deaths) suggesting stroke mortality might follow a constant trend.
CVD Mortality by Age and Sex
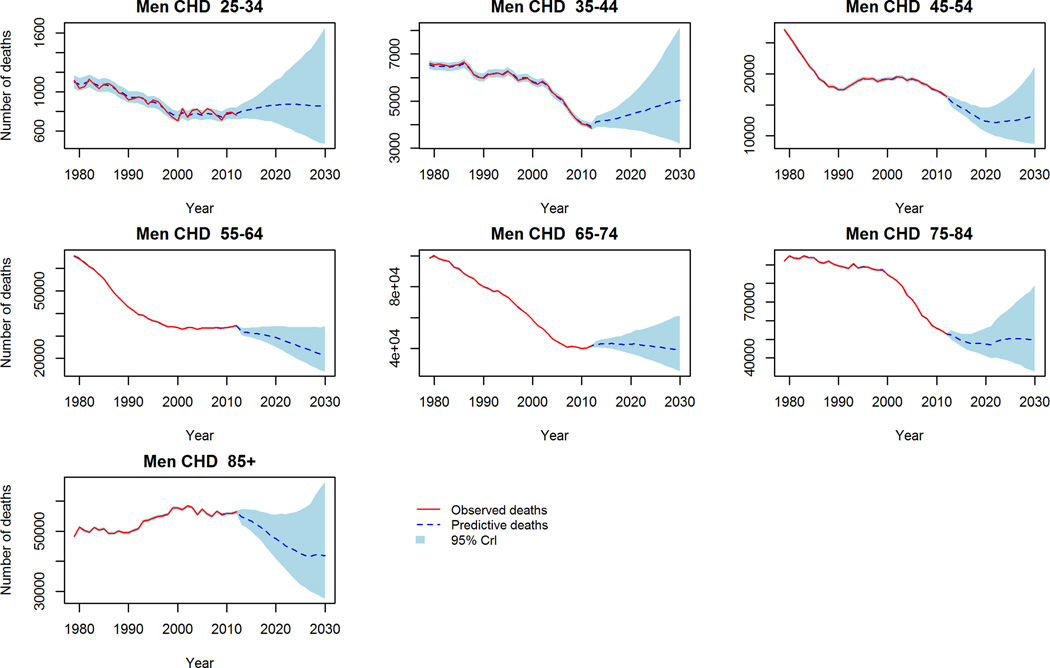
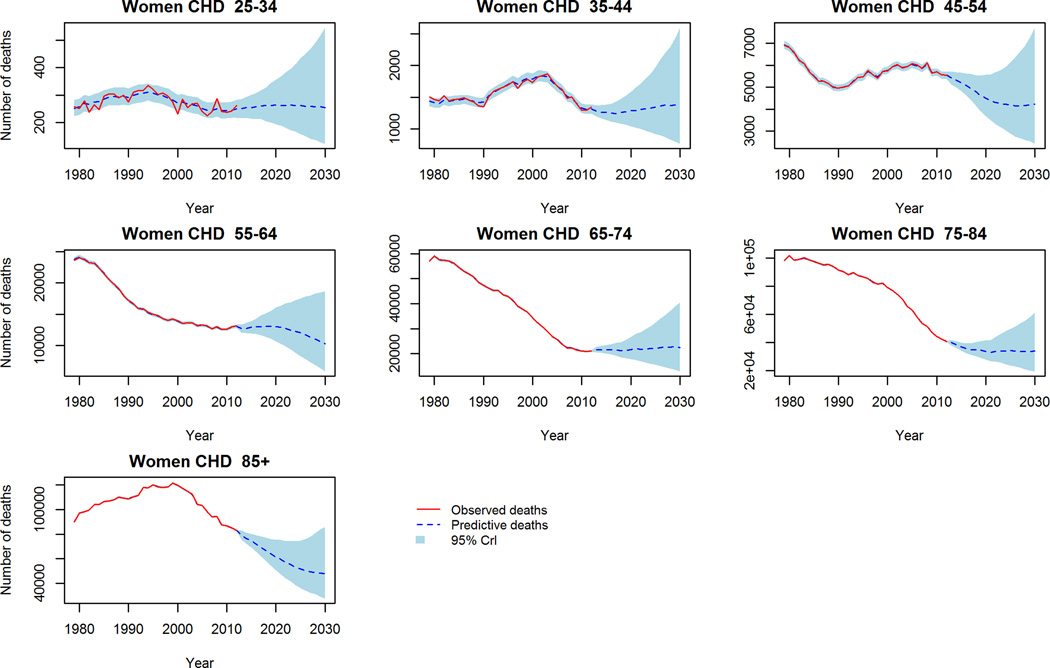
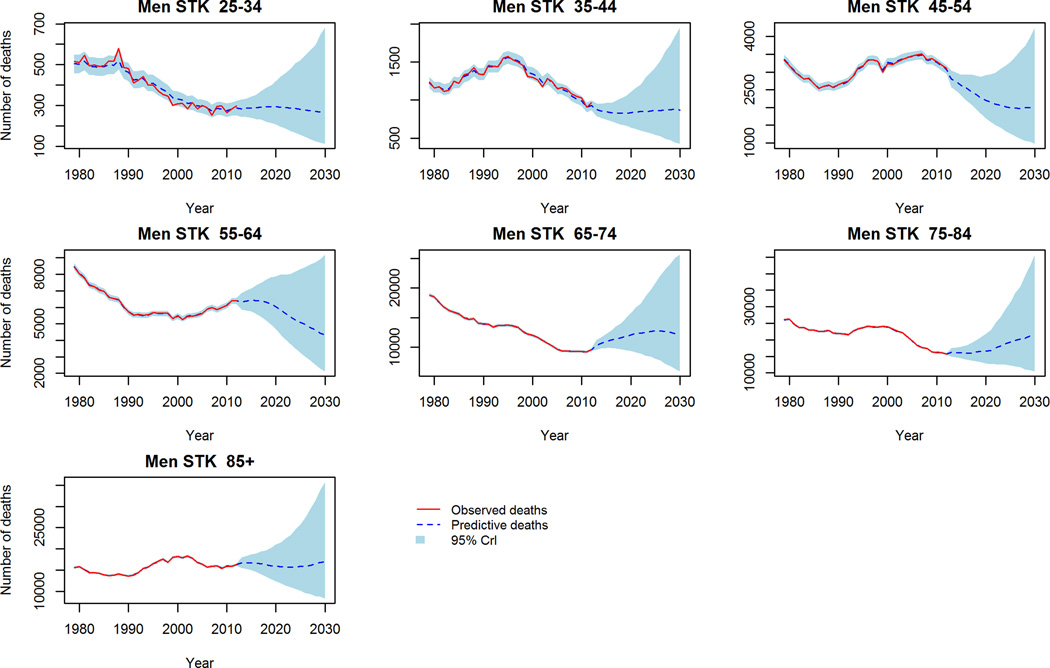
In contrast to aggregate reductions in mortality in the trend-based projections, worryingly CHD mortality is projected to increase in middle aged (45–54 years) men and women (figure 2). Further, stroke crude mortality is projected to persist, and in some cases increase in the 65+ population (figure 3). Comparing the projections to 2030 of the two models, the ‘trend-based’ method projects fewer deaths in each age and gender group except for CHD deaths in young (25–34) men and women, where 3% and 8% more deaths are projected compared to the conventional method. The largest differences in projected mortality between the two methods were in elderly women (85+) for CHD; projecting approximately 28,000 fewer deaths in the trend based projections. Whilst the largest difference in projected stroke deaths is in elderly men (75–84) whereby the ‘trend-based’ method projects some 10,000 (32%) fewer deaths than the conventional projections.
Figure 2.
CHD Mortality: Observed crude deaths 1979–2012 and trend-based projections 2013–2030. 2a Men, 2b Women.
Figure 3.
Stroke Mortality: Observed crude deaths 1979–2012 and trend-based projections 2013–2030. 3a Men, 3b Women.
Projected age and gender adjusted CVD mortality for both conventional and trend based projection methods are outlined in supplemental tables 2A–B. Briefly, they demonstrate approximately 95,000 more CHD and 43,000 Stroke deaths in the conventional projections (416,000 (95% CrI 327,000–537,000) total CVD deaths in 2030) when compared with the ‘trend-based’ projections (278,000 (156,000–571,000) total CVD deaths).
Race disparities in CVD mortality
Comparing conventional vs. ‘trend-based’ models, the latter offers a more conservative forecast. Therefore, we focus upon the ‘trend-based’ projections to analyse race disparities. The largest disparity between non-Hispanic black and white exists in CHD (relative risk (RR): 1.40 (95% Confidence intervals, 1.36–1.44) in 1990 persisting, albeit reducing to 2012 (RR, 1.18 (1.16–1.20)) (table 2). Using our trend-based projections to 2030, we project disparities between non-Hispanic blacks and whites to persist to 2030 (RR, 1.31 (0.54–2.70)). The disparities between non-Hispanic black and white stroke deaths continue from 1990 – 2012 (RR, 1.10 (1.08–1.13) but we project this to increase in 2030 to RR 1.30 (0.45–2.44) (table 2b). The Hispanic populations appear to have persistently lower age and gender-standardised CHD and stroke mortality rate-ratios throughout the period 1990–2030 (table 2). Hispanic CHD mortality is projected to continue to be lower than non-Hispanic white CHD mortality worsening slightly from RR 0.42 (0.41–0.42) in 2012 to RR 0.59 (0.19–1.09) in 2030. Stroke disparities between Hispanic and non-Hispanic white population are also projected to persist at similar levels.
Table 2.
Age and gender standardised relative risks for CHD and Stroke mortality rates in Black and Hispanic Americans compared to White Americans using trend-based projections. Point estimate and 95% confidence intervals. 2a. CHD, 2b Stroke.
| 2a. | |||
|---|---|---|---|
| CHD | |||
| 1990 | 2012 | 2030 | |
| Black | 1.40 (1.36–1.44) | 1.18 (1.16–1.20) | 1.31 (0.54–2.70) |
| Hispanic | 0.39 (0.38–0.40) | 0.42 (0.41–0.42) | 0.59 (0.19–1.09) |
| 2b. | |||
|---|---|---|---|
| Stroke | |||
| 1990 | 2012 | 2030 | |
| Black | 1.11 (1.08–1.14) | 1.10 (1.08–1.13) | 1.30 (0.45–2.44) |
| Hispanic | 0.34 (0.33–0.35) | 0.40 (0.39–0.41) | 0.49 (0.18–0.99) |
Population-adjusted rate-ratios
Population adjusted mortality rate ratios between races vary considerably by age. Disparities existed in 2012 throughout all age groups for CHD and stroke, men and women except the elderly (85+) (table 3).
Table 3.
Age-specific Coronary Heart Disease (CHD) and Stroke mortality relative risks in Black and Hispanic Americans compared to White Americans in 2012 and 2030 using trend-based projections. Relative risks and 95% confidence intervals 3a. Women, 3b Men.
| 3a. | |||||||
|---|---|---|---|---|---|---|---|
| CHD | |||||||
| Black | 25–34 | 35–44 | 45–54 | 55–64 | 65–74 | 75–84 | 85+ |
| 2012 | 1.72 (1.44–2.04) | 1.50 (1.38–1.62) | 1.27 (1.22–1.33) | 1.41 (1.37–1.45) | 1.38 (1.34–1.42) | 1.13 (1.09–1.16) | 0.79 (0.76–0.82) |
| 2030 | 0.85 (0.18–1.84) | 2.48 (0.76–4.59) | 2.17 (0.30–5.08) | 1.69 (0.31–4.02) | 0.26 (0.11–0.60) | 0.93 (0.23–2.72) | 0.61 (0.28–1.14) |
| Hispanic | |||||||
| 2012 | 0.46 (0.36–0.59) | 0.44 (0.39–0.49) | 0.50 (0.47–0.53) | 0.68 (0.66–0.71) | 0.79 (0.76–0.83) | 0.79 (0.77–0.82) | 0.71 (0.68–0.74) |
| 2030 | 0.26 (0.03–0.81) | 0.25 (0.10–0.35) | 0.80 (0.15–2.09) | 0.62 (0.06–2.28) | 0.29 (0.06–0.68) | 0.55 (0.29–0.94) | 0.86 (0.41–1.35) |
| Stroke | |||||||
| Black | 25–34 | 35–44 | 45–54 | 55–64 | 65–74 | 75–84 | 85+ |
| 2012 | 2.14 (1.61–2.85) | 2.82 (2.42–3.28) | 3.19 (2.94–3.47) | 2.74 (2.58–2.91) | 2.18 (2.06–2.30) | 1.46 (1.38–1.53) | 0.95 (0.89–1.01) |
| 2030 | 1.79 (0.82–3.24) | 1.27 (0.59–1.96) | 2.27 (0.91–3.98) | 1.61 (0.81–3.5) | 1.09 (0.74–1.57) | 1.35 (0.55–2.58) | 1.14 (0.43–2.02) |
| Hispanic | |||||||
| 2012 | 1.07 (0.79–1.45) | 1.32 (1.11–1.56) | 1.25 (1.12–1.39) | 1.17 (1.07–1.27) | 0.97 (0.90–1.05) | 0.91 (0.86–0.98) | 0.76 (0.71–0.82) |
| 2030 | 0.84 (0.40–1.33) | 1.02 (0.43–2.41) | 0.95 (0.18–1.58) | 0.67 (0.11–2.21) | 0.65 (0.12–2.01) | 1.37 (0.22–4.47) | 1.07 (0.23–2.25) |
| 3b. | |||||||
|---|---|---|---|---|---|---|---|
| CHD | |||||||
| Black | 25–34 | 35–44 | 45–54 | 55–64 | 65–74 | 75–84 | 85+ |
| 2012 | 1.84 (1.39–2.44) | 1.36 (1.19–1.56) | 1.72 (1.61–1.83) | 1.85 (1.77–1.93) | 1.63 (1.57–1.69) | 1.24 (1.21–1.28) | 0.95 (0.93–0.98) |
| 2030 | 1.65 (0.39–4.43) | 1.41 (0.39–3.20) | 1.23 (0.67–2.12) | 1.47 (0.76–2.73) | 2.34 (0.78–4.80) | 2.54 (0.95–4.83) | 1.31 (0.31–2.38) |
| Hispanic | |||||||
| 2012 | 0.37 (0.23–0.59) | 0.33 (0.26–0.41) | 0.48 (0.43–0.63) | 0.74 (0.69–0.79) | 0.79 (0.75–0.83) | 0.87 (0.84–0.91) | 0.82 (0.80–0.85) |
| 2030 | 0.42 (0.27–0.64) | 0.24 (0.14–0.39) | 0.43 (0.31–0.54) | 0.60 (0.25–1.21) | 0.79 (0.36–1.36) | 0.74 (0.29–1.30) | 0.67 (0.28–1.17) |
| Stroke | |||||||
| Black | 25–34 | 35–44 | 45–54 | 55–64 | 65–74 | 75–84 | 85+ |
| 2012 | 1.66 (1.20–2.30) | 2.30 (1.94–2.72) | 2.82 (2.58–3.08) | 2.56 (2.39–2.74) | 1.83 (1.73–1.94) | 1.23 (1.17–1.28) | 0.93 (0.90–0.97) |
| 2030 | 2.17 (0.85–3.72) | 2.78 (1.21–4.27) | 2.74 (1.09–5.67) | 1.00 (0.85–1.24) | 1.39 (0.75–2.11) | 1.49 (0.48–2.86) | 1.50 (0.63–3.32) |
| Hispanic | |||||||
| 2012 | 0.91 (0.64–1.31) | 0.79 (0.63–0.98) | 0.96 (0.84–1.10) | 1.01 (0.91–1.13) | 0.95 (0.88–1.04) | 0.81 (0.77–0.86) | 0.70 (0.67–0.74) |
| 2030 | 1.32 (0.32–3.43) | 1.27 (0.39–2.98) | 1.00 (0.25–2.63) | 1.18 (0.43–2.21) | 0.41 (0.17–0.65) | 0.99 (0.46–1.56) | 0.86 (0.37–1.41) |
The largest disparity in stroke rates between non-Hispanic blacks and whites was seen in the middle aged, 45–54 years old (RR 2.82 (95% CI, 2.58–3.08) in men, 3.19 (2.94–3.47) in women). Whilst persisting, this disparity is projected to lessen, particularly in women by 2030, RR 2.74 (1.09–5.67) and 2.27 (0.91–3.98) in men and women respectively. A similar pattern could be observed across other age and gender groups (except in young Hispanic men). For CHD, disparities are projected to persist in most age groups in men, but improve in elderly women (65+) (table 3). The disparities, specifically between non-Hispanic blacks and whites appear to generally reduce with age (table 3). Hispanic Americans appear to have lower CHD and stroke mortality rates than non-Hispanic whites aggregate throughout all age groups, except in young male stroke mortality. This is projected to persist and in many cases improve further still to 2030 (table 3).
Validation of BAPC model
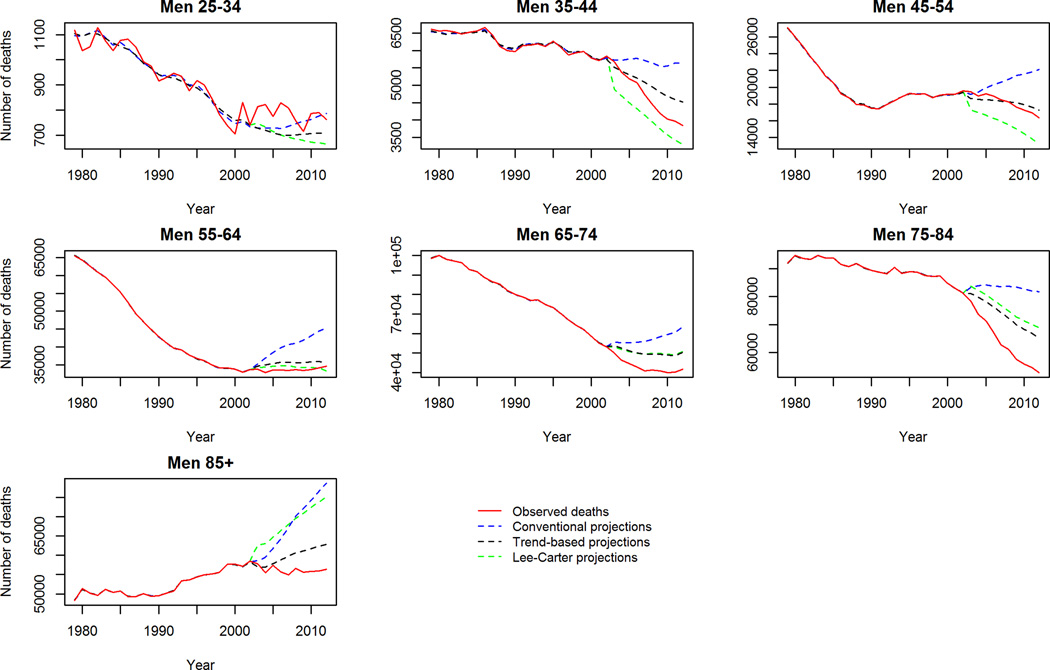
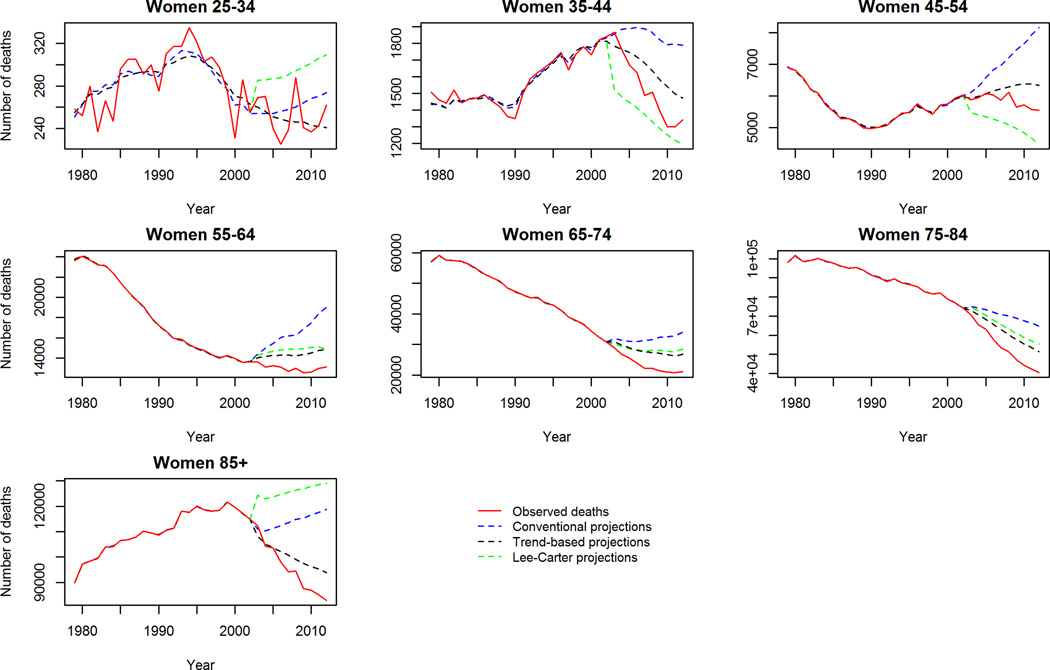
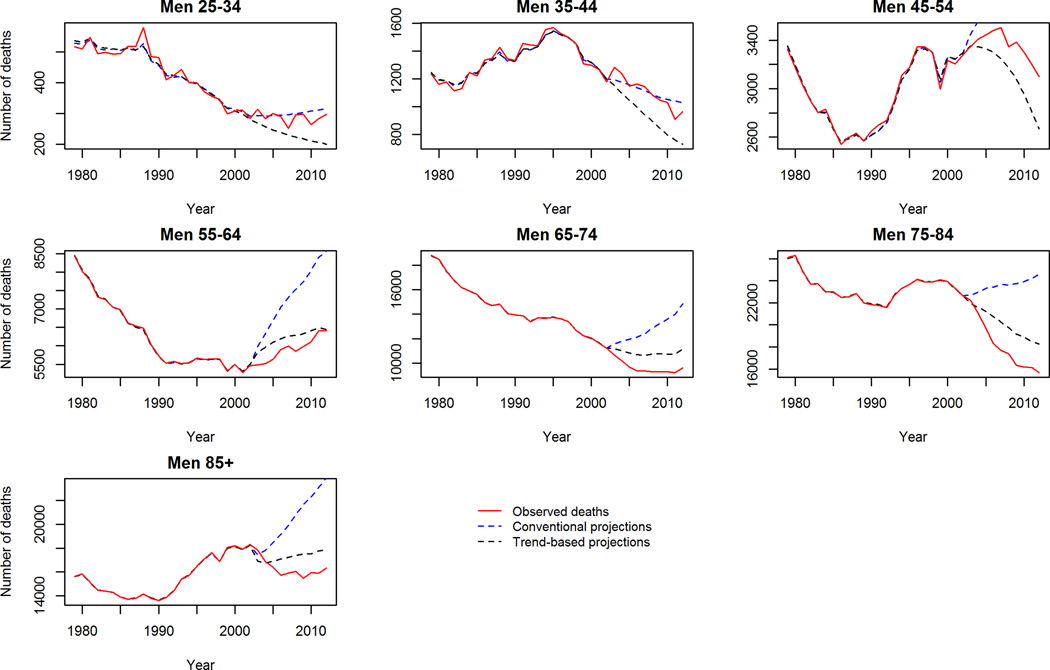
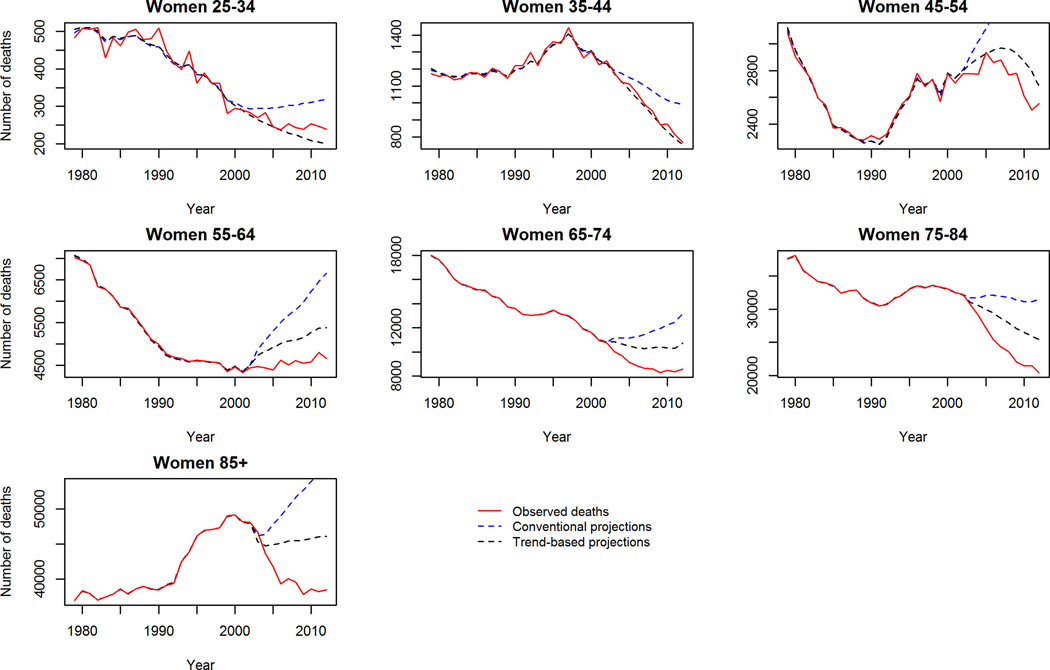
We used observed data from 1979–2002 to project CVD mortality for the period 2003–2012 and calculated predictive deviance. This is demonstrated in figure 4. The figure shows our trend-based projections to be a substantially better fit than conventional projections. Likewise, the predictive deviance values from the trend-based projections are lower compared to the conventional projections throughout the 10-year period (Supp. table B).
Figure 4.
Validation of mortality projections 2003–2012: Observed crude deaths, ‘trend-based’ and conventional projections. 4a CHD Men, 4b, CHD Women, 4c Stroke Men, 4d Stroke Women.
Despite this however, our trend-based method was generally a conservative projection for mortality in some age groups. Specifically, the observed mortality decline between 2003–2012 was steeper in late middle age and elderly men and women (65–74 and 75–84 years old) than the trend-based scenario predicted. To further validate our trend-based projections we ran the model widely used by demographers: the Lee-Carter model16 for this same period to see if a similar phenomenon was observed. Reassuringly, this was also observed with the Lee-Carter model when projecting the period 2003–2012 (supplemental figure 4). The Lee-Carter model was also unable to capture the rapid mortality decline in middle aged groups during this period. This suggests that this recent acceleration of the falling mortality rates could be due to a new phenomenon not observed previously nor incorporated into the age-period and cohort model projections.
Age Period and Cohort Effects
The detailed results of the age, period and cohort effect analysis are outlined in the supplemental tables 3 and 4. Briefly, by far the greatest contribution to CVD mortality was the age effect, followed by the period, and then the cohort effect. This was consistent across races and ethnicities; however the cohort effect was minimal in non-Hispanic blacks and Hispanics. In CHD alone, the cohort effect was found to be equal to the period effect.
Discussion
We evaluated our trend-based projections against more conventional projections for US CVD mortality projection to 2030. The conventional projections, similar to those used in several recent published projections6–9 assumed that mortality rates simply persist unchanged from 2012 to 2030. This conservative projection suggests a substantial increase in CVD deaths by approximately 18% (CHD) and 50% (Stroke) due to population growth and ageing. This is in line with previous projections by Heidenreich9 who using the projected demographic changes, predicted that approximately 40% of the US population will have some form of CVD by 2030. In contrast, our more plausible trends-based projections, accounting for recent declines in CVD mortality rates and assuming a similar trend onwards, predicts that CVD deaths may in fact decrease by 27% for CHD and remain stable for stroke. Our trend-based projections therefore suggest that the potential growing burden of projected population growth and demographic changes forecasted for the US by US Bureau14 could be countered by rapidly declining CVD mortality rates. Our projections further suggest that the future burden of CVD mortality in the US may have been overestimated by conventional methods.
Our trend-based methods project a substantially smaller burden of CVD mortality than recent projections from the American Heart Association9, and other published work that assume a relatively constant mortality rate to 20208 and 20306. Huffman et al8 reported that if trends in risk factors and mortality remained constant, absolute deaths could increase by 12% in 2020, consistent with our ‘conventional’ projections. Similarly, the Coronary Heart Disease Policy Model is a complex Markov Model that simulates incidence, prevalence and mortality7. This model, assuming no significant change in risk factors or treatment, with mortality rates remaining relatively constant, CHD mortality could increase as much as 56% over the coming 30 years. The stark contrast between these previous projections, and our projections can be accredited to our assumption (not unreasonable) that recent mortality rate declines (stratified by age, gender and race) might continue to 2030.
Roth17 et al recently quantified global CVD mortality in 2013, in comparison with 1990. During this period global CVD deaths increased by approximately 41% (36.2–46.4), compared to a non-statistically significant 4.7% increase in high income North America. The global increase in CVD deaths was attributed mainly to population ageing (55%) and also to population growth (25%). These results suggest that whilst population ageing and growth are driving CVD mortality trends globally, in high income North America declining age-specific CVD mortality rates is counteracting these demographic changes. This is consistent with our projections. Further, our projections for US CVD mortality are broadly consistent with previous work by our group projecting CHD mortality for England and Wales to 203012. This analysis by Guzman Castillo et al predicts the declining CHD mortality rate in England and Wales to counteract projected demography changes, whilst also finding the trend-based method to be a better fit than the extensively used Lee-Carter method.
Our trend-based projections were consistently a better fit than conventional projections when projecting CVD mortality from 2003–2012 across the majority of age, gender and race groups and comparing the projections with observed mortality. Despite this, our trend-based projections were unable to capture the accelerating decline of mortality in elderly men during this period. Likewise, the validated and commonly used Lee-Carter method was also unable to capture this accelerating decline in the elderly. This suggests that an unknown factor outside of our model parameters could be driving this accelerated decline in CVD mortality 2003–2012. However, when projecting to 2030 we use all observed data to 2012 so it is likely that this unknown factor is better captured in these projections to 2030 than the validation period.
Further analysis of the rapidly declining mortality rates in the elderly could help inform policy makers as to how best to tackle the projected ageing population. This could be due to period effects as previously seen through dramatic fluctuations in policy and systems change such as alcohol drinking, declining smoking prevalence, or salt or trans-fat intake reduction and other similar improvements in the food supply. Similar period effects such as large increases in diabetes prevalence and obesity might have a corresponding time lag of up to 5–10 years, thus recent rises may not yet be fully realised in CVD mortality. The presence of a cohort effect in white Americans, absent in other racial groups is interesting. APC models developed for Australia18 and New Zealand19 suggested the absence of any cohort effect whilst conversely Singapore20 and Norway21 contrastingly found a cohort effect.
CVD race disparities exist, particularly between non-Hispanic blacks and non-Hispanic whites. From 1990–2000, the non-Hispanic white population has shrunk, whilst non-Hispanic black population has increased by 2% and Hispanics by as much as 58%22. Given disparities in CVD mortality by race, demographic changes could have a substantial effect upon the racial composition of the future CVD cases, with important policy implications. Despite this, previous projections of racial CVD disparities have largely neglected recent trends in mortality rates generally, and specifically by racial groups. Our projections however suggest CVD disparities to persist in most cases (although with a high level of uncertainty as illustrated by the wide confidence intervals), despite aggregate reductions in CVD mortality both in absolute and relative terms, albeit with some improvement in most subgroups. Specifically, age-adjusted stroke mortality rate-ratios are projected to improve across almost all subgroups of non-Hispanic blacks compared with whites, but despite this, a disparity is projected to remain. Worryingly however, disparities in younger males are projected to worsen. Whilst the data suggest the absence of disparities between older (85+) non-Hispanic blacks and whites, this could be due to a ‘natural selection’ or differential survival bias from the underlying demography of the US population whereby a larger proportion of non-Hispanic whites live to older age, and those non-Hispanic blacks who do so may be the more affluent. This highlights the limitations of race as a measure of socio-economic circumstance. Given the large mortality reductions in CVD over the past 3 decades, we would expect this to result in a reduction of absolute disparities, however our projections suggests this may not be the case, and relative CVD disparities to worsen across all subgroups of non-Hispanic blacks except the most elderly. Whilst we should applaud the efforts in reducing aggregate CVD mortality substantially over previous decades, the absence of improvements in racial disparities urgently needs to be addressed by policy makers.
Whilst our results of current and projected disparities between Hispanic and non-Hispanic whites are surprising (substantially lower mortality rates in Hispanics and for this to improve further), these estimates are consistent with the well described ‘Hispanic Paradox23, 24. These previous analyses have demonstrated the difficulties in estimated CVD mortality in this group, showing that Hispanics are significantly under-recorded on death certificates, which leads to un-tangibly high life expectancies within this group when combined with self reported Hispanic ethnicity from population estimates in the census23, 24. The apparently low mortality rates observed and projected in the Hispanic population could also be affected by a healthy migrant effect. Indeed such uncertainty exists regarding the reported mortality rate for Hispanics that they are often excluded from analyses6.
Strengths and limitations
This study and its methods have strengths. The classical Age Period and Cohort model allows mortality to be presented as trends over age at death, year of death and birth cohort whilst also allowing for further heterogeneity to be modelled if required. The Bayesian aspect of the model increases the reliability and interpretability of our results by including prior data such as results of a previous model or expert opinion to guide inference from current data. Using this, the Bayesian method then estimates the probability distribution of the parameters resulting in a full probability model that can be used to generate a probability distribution of possible future outcomes. Further, Bayesian models are unbiased with respect to sample size hence the model still performs well with smaller groups such as younger age groups25.
Our projections also have weaknesses. The projections require use of population estimates (US Bureau 2012), which themselves have inherent assumptions regarding levels of fertility, migration and mortality. These can provide challenges for demographers26. In addition, the short series of data for race stratification (from 1990) is a potential weakness and led to initial noise when initially projecting mortality. To reduce this, we used non-Hispanic white, non-Hispanic black and Hispanic race stratifications only, and excluded the ‘other races’ group. Further, our projections assumed that the age, period and cohort effects components remain unchanged through 2030. Whilst the American Heart Association Policy statement9 we discuss specifically projects CVD prevalence rather than mortality, mortality projections themselves are a key constituent of these projections. These and their methods are in line with the ‘traditional projections’ that we model in our study. Occasional unpredictable high-impact phenomena can dramatically change mortality rates with timings that are retrospectively unpredictable27. Examples include dietary changes in Poland and neighbouring countries in the early 1990s resulting in rapid large decreases in CVD mortality15, 28 and similarly rapid mortality falls in Cuba in the 1990s. Lag times for such diet associated reductions in CVD mortality were consistently less than five years29, 30, echoed by data from the WHO MONICA project31.
Public Health Implications
Our trend forecast suggests that is likely that the gains we obtained in the last four decades will persist well in the 21st century. However, trends are not set in stone and rapid changes can quickly reverse longstanding trends32. Whilst previous work suggested that approximately 44% and 47% of the 50% decline in US CHD mortality rates between 1980 and 200011 were due to changes in risk factors and treatment respectively, we do not project relative contributions to the projected reductions in CVD mortality in our ‘trend-based’ model. As CVD mortality rates decline further, it is likely that the relative contributions of prevention and treatment may change whilst the smaller burden of mortality will mean that existing interventions will have lower absolute effectiveness. Therefore cost-saving interventions such as those fiscal policies at the population level will have increasing importance. To maximise the population exposed to future measures to reduce CVD mortality therefore, population-wide structural policies with universal coverage would likely be more successful than targeted policies33, 34. Furthermore, it will be increasingly difficult to prevent additional deaths when baseline risk is declining. Whilst public health should have the dual purpose of promoting health gains in the population as a whole and reducing health inequalities35, national policies can have varying degrees of coverage across the entire population. Benach et al36 outlined different public health policy approaches to reduce inequalities. ‘Proportionate Universalism’ as highlighted by the UK Marmot Review37 aims to strike the balance of reducing inequalities through population level policies targeting primary risk factors with universal coverage which act to reduce existing inequalities through the baseline gradient of these risk factors. Such policies, could reduce both nominal and relative CVD disparities between racial groups in the US. Further, as CVD mortality rates continue to fall, preventing or delaying each subsequent death using individual-based approaches may become increasingly more difficult, and costly.
Conclusions
The US and many other developed and developing countries are increasingly focusing on strategies to reduce the combined disease and economic burdens of CVD. Accurate projections, incorporating projected demographic changes accounting for recent trends in mortality are thus crucial to better inform policy makers. Our trend-based model potentially provides this through utilising the increasingly detailed understanding of CVD epidemiology.
In contrast to conventional projections, we project CVD mortality to continue to decline and thus counteract the ageing and growing population. However, despite the large reductions in CVD, worrying race and ethnic disparities in mortality are likely to persist.
Supplementary Material
Clinical Perspectives.
Accurate forecasting of cardiovascular disease (CVD) mortality is crucial to guide policy and programming efforts. Prior forecasts have often not incorporated past trends in rates of reduction in CVD mortality. This creates uncertainties about future trends in CVD mortality and disparities. We forecasted US CVD mortality and disparities to 2030. We developed a hierarchical Bayesian model to determine and incorporate prior age, period and cohort (APC) effects from 1979–2012, stratified by age, gender and race; which we combined with expected demographic shifts to 2030.We projected coronary disease and stroke deaths to 2030, first based on constant APC effects at 2012 values, as most commonly done (conventional); and then using more rigorous projections incorporating expected trends in APC effects (trend-based). We primarily evaluated absolute mortality. The conventional model projected total coronary and stroke deaths by 2030 to increase by approximately 18% (67,000 additional coronary deaths/year) and 50% (64,000 additional stroke deaths/year). Conversely, the trend-based model projected that coronary mortality would fall by 2030 by approximately 27% (79,000 fewer deaths/year); and stroke mortality would remain unchanged (200 fewer deaths/year). Health disparities will be improved in stroke deaths, but not coronary deaths. After accounting for prior mortality trends and expected demographic shifts, total US coronary deaths are expected to decline, while stroke mortality will remain relatively constant. Health disparities by race, in stroke, but not coronary, deaths will be improved but not eliminated. These APC approaches offer more plausible predictions than conventional estimates.
Acknowledgments
Funding Sources: This project was funded by a National Institute of Health grant number R01HL115189. The funders had no role in study design, data collection and analysis, decision to publish, or preparation of the manuscript.
Footnotes
Contributors: SC, MoF and DM conceived the idea of the study. MGC and JPS led the analysis supervised by MoF, and generated the results. JPS drafted and finalised the paper with input from all authors. All authors contributed to the analysis, intellectual content, critical revisions to the drafts of the paper and approved the final version. MoF is the guarantor and affirms that the manuscript is an honest, accurate and transparent account of the study being reported.
Disclosures: None.
References
- 1.Morbidity and Mortality: 2012 Chart Book on Cardiovascular, Lung and Blood Diseases. Bethesda, MD: National Heart, Lung and Blood Institute; 2012. [Google Scholar]
- 2.Roger VL, Go AS, Lloyd-Jones DM, Benjamin EJ, Berry JD, Borden WB, Bravata DM, Dai S, Ford ES, Fox CS, Fullerton HJ, Gillespie C, Hailpern SM, Heit JA, Howard VJ, Kissela BM, Kittner SJ, Lackland DT, Lichtman JH, Lisabeth LD, Makuc DM, Marcus GM, Marelli A, Matchar DB, Moy CS, Mozaffarian D, Mussolino ME, Nichol G, Paynter NP, Soliman EZ, Sorlie PD, Sotoodehnia N, Turan TN, Virani SS, Wong ND, Woo D, Turner MB Subcommittee AHASCaSS. Heart disease and stroke statistics--2012 update: A report from the american heart association. Circulation. 2012;125:e2–e220. doi: 10.1161/CIR.0b013e31823ac046. [DOI] [PMC free article] [PubMed] [Google Scholar]
- 3.National Cancer Institute; Surveillance, Epidemiology, and End Results Program. [Accessed 22nd May 2015]; http://seer.Cancer.Gov/popdata/singleages.html.
- 4.Lee R. The outlook for population growth. Science. 2011;333:569–573. doi: 10.1126/science.1208859. [DOI] [PMC free article] [PubMed] [Google Scholar]
- 5.Mensah GA, Mokdad AH, Ford ES, Greenlund KJ, Croft JB. State of disparities in cardiovascular health in the united states. Circulation. 2005;111:1233–1241. doi: 10.1161/01.CIR.0000158136.76824.04. [DOI] [PubMed] [Google Scholar]
- 6.Danaei G, Rimm EB, Oza S, Kulkarni SC, Murray CJ, Ezzati M. The promise of prevention: The effects of four preventable risk factors on national life expectancy and life expectancy disparities by race and county in the united states. PLoS Med. 2010;7:e1000248. doi: 10.1371/journal.pmed.1000248. [DOI] [PMC free article] [PubMed] [Google Scholar]
- 7.Odden MC, Coxson PG, Moran A, Lightwood JM, Goldman L, Bibbins-Domingo K. The impact of the aging population on coronary heart disease in the united states. Am J Med. 2011;124:827–833. e825. doi: 10.1016/j.amjmed.2011.04.010. [DOI] [PMC free article] [PubMed] [Google Scholar]
- 8.Huffman MD, Lloyd-Jones DM, Ning H, Labarthe DR, Guzman Castillo M, O'Flaherty M, Ford ES, Capewell S. Quantifying options for reducing coronary heart disease mortality by 2020. Circulation. 2013;127:2477–2484. doi: 10.1161/CIRCULATIONAHA.112.000769. [DOI] [PMC free article] [PubMed] [Google Scholar]
- 9.Heidenreich PA, Trogdon JG, Khavjou OA, Butler J, Dracup K, Ezekowitz MD, Finkelstein EA, Hong Y, Johnston SC, Khera A, Lloyd-Jones DM, Nelson SA, Nichol G, Orenstein D, Wilson PW, Woo YJ Committee AHAAC, Council S, Intervention CoCRa, Cardiology CoC, Prevention CoEa, Arteriosclerosis Co, Biology TaV, Cardiopulmonary Co, Care C, Resuscitation Pa, Nursing CoC, Disease CotKiC, Council on Cardiovascular Surgery and Anesthesia aICoQoCaOR. Forecasting the future of cardiovascular disease in the united states: A policy statement from the american heart association. Circulation. 2011;123:933–944. doi: 10.1161/CIR.0b013e31820a55f5. [DOI] [PubMed] [Google Scholar]
- 10.Weinstein MC, Coxson PG, Williams LW, Pass TM, Stason WB, Goldman L. Forecasting coronary heart disease incidence, mortality, and cost: The coronary heart disease policy model. Am J Public Health. 1987;77:1417–1426. doi: 10.2105/ajph.77.11.1417. [DOI] [PMC free article] [PubMed] [Google Scholar]
- 11.Ford ES, Ajani UA, Croft JB, Critchley JA, Labarthe DR, Kottke TE, Giles WH, Capewell S. Explaining the decrease in u.S. Deaths from coronary disease, 1980–2000. N Engl J Med. 2007;356:2388–2398. doi: 10.1056/NEJMsa053935. [DOI] [PubMed] [Google Scholar]
- 12.Guzman Castillo M, Gillespie DO, Allen K, Bandosz P, Schmid V, Capewell S, O'Flaherty M. Future declines of coronary heart disease mortality in england and wales could counter the burden of population ageing. PLoS ONE. 2014;9:e99482. doi: 10.1371/journal.pone.0099482. [DOI] [PMC free article] [PubMed] [Google Scholar]
- 13.Centers for Disease Control and Prevention. [accessed 22nd May 2015];National Vital Statistics System. http://www.cdc.gov/nchs/deaths.html.
- 14.US Bureau of Statistics. TUSC. [accessed 22nd May 2015];National population projections. 2012 http://www.census.gov/population/projections/data/national/2012/summarytables.html. [Google Scholar]
- 15.Schmid VJ, Held L. Bayesian age-period-cohort modeling and prediction-bamp. J Stat Software. 2007;21:1–15. [Google Scholar]
- 16.Carter LR, Lee RD. Modeling and forecasting u.S. Sex differentials in mortality. Int J Forecast. 1992;8:393–411. doi: 10.1016/0169-2070(92)90055-e. [DOI] [PubMed] [Google Scholar]
- 17.Roth GA, Forouzanfar MH, Moran AE, Barber R, Nguyen G, Feigin VL, Naghavi M, Mensah GA, Murray CJ. Demographic and epidemiologic drivers of global cardiovascular mortality. N Engl J Med. 2015;372:1333–1341. doi: 10.1056/NEJMoa1406656. [DOI] [PMC free article] [PubMed] [Google Scholar]
- 18.Taylor R, Page A, Danquah J. The australian epidemic of cardiovascular mortality 1935–2005: Effects of period and birth cohort. J Epidemiol Community Health. 2012;66:e18. doi: 10.1136/jech.2010.109538. [DOI] [PubMed] [Google Scholar]
- 19.Tobias M, Sexton K, Mann S, Sharpe N. How low can it go? Projecting ischaemic heart disease mortality in new zealand to 2015. N Z Med J. 2006;119:U1932. [PubMed] [Google Scholar]
- 20.Hughes K. Trends in mortality from ischaemic heart disease in singapore, 1959 to 1983. Int J Epidemiol. 1986;15:44–50. doi: 10.1093/ije/15.1.44. [DOI] [PubMed] [Google Scholar]
- 21.Sverre JM. Secular trends in coronary heart disease mortality in norway, 1966–1986. Am J Epidemiol. 1993;137:301–310. doi: 10.1093/oxfordjournals.aje.a116677. [DOI] [PubMed] [Google Scholar]
- 22.US Census Bureau. [accessed 22nd May 2015];Demographic data by race. http://www.census.gov/topics/population/race.html.
- 23.Franzini L, Ribble JC, Keddie AM. Understanding the hispanic paradox. Ethn Dis. 2001;11:496–518. [PubMed] [Google Scholar]
- 24.Smith DP, Bradshaw BS. Rethinking the hispanic paradox: Death rates and life expectancy for us non-hispanic white and hispanic populations. Am J Public Health. 2006;96:1686–1692. doi: 10.2105/AJPH.2003.035378. [DOI] [PMC free article] [PubMed] [Google Scholar]
- 25.Canadian Partnership Against Cancer. Long-term projection methods: Comparison of age-period-cohort model-based approaches. [accessed 22nd May 2015];2010 www.cancerview.ca/idc/groups/.../cproj_b7_b9_interp_long_term.pdf. [Google Scholar]
- 26.Wood J, Horsfield G, Vickers L. The new subnational population projections model: Methodology and projection scenarios. Popul Trends. 1999:21–28. [PubMed] [Google Scholar]
- 27.Taleb N. The Black Swan: The Impact of the Highly Improbable. New York, NY: Random House Publishing Group; 2007. [Google Scholar]
- 28.Di Cesare M, Murphy M. Forecasting mortality, different approaches fordifferent cause of deaths? The cases of lung cancer; influenza, pneumonia, andbronchitis; motor vehicle accidents. Brit Actuarial J. 2009;15:185. [Google Scholar]
- 29.Franco M, Orduñez P, Caballero B, Tapia Granados JA, Lazo M, Bernal JL, Guallar E, Cooper RS. Impact of energy intake, physical activity, and population-wide weight loss on cardiovascular disease and diabetes mortality in cuba, 1980–2005. Am J Epidemiol. 2007;166:1374–1380. doi: 10.1093/aje/kwm226. [DOI] [PubMed] [Google Scholar]
- 30.Franco M, Bilal U, Ordunez P, Benet M, Morejon A, Caballero B, Kennelly JF, Cooper RS. Population-wide weight loss and regain in relation to diabetes burden and cardiovascular mortality in cuba 1980–2010: Repeated cross sectional surveys and ecological comparison of secular trends. BMJ. 2013;346:f1515. doi: 10.1136/bmj.f1515. [DOI] [PubMed] [Google Scholar]
- 31.Kuulasmaa K, Tunstall-Pedoe H, Dobson A, Fortmann S, Sans S, Tolonen H, Evans A, Ferrario M, Tuomilehto J. Estimation of contribution of changes in classic risk factors to trends in coronary-event rates across the who monica project populations. Lancet. 2000;355:675–687. doi: 10.1016/s0140-6736(99)11180-2. [DOI] [PubMed] [Google Scholar]
- 32.Capewell S, O'Flaherty M. Rapid mortality falls after risk-factor changes in populations. Lancet. 2011;378:752–753. doi: 10.1016/S0140-6736(10)62302-1. [DOI] [PubMed] [Google Scholar]
- 33.Capewell S, Lloyd-Jones DM. Optimal cardiovascular prevention strategies for the 21st century. JAMA. 2010;304:2057–2058. doi: 10.1001/jama.2010.1641. [DOI] [PubMed] [Google Scholar]
- 34.NICE. Prevention of Cardiovascular Disease, NICE Public Health Guidance 25. [accessed Sept 2015];2010 http://www.nice.org.uk/guidance/ph25/resources/guidance-prevention-of-cardiovascular-disease-pdf. [Google Scholar]
- 35.Whitehead M, Dahlgren G. Concepts and principles for tackling social inequities in health: Levelling up part 1. Copenhagen: WHO Regional Office for Europe; 2007. [Google Scholar]
- 36.Benach J, Malmusi D, Yasui Y, Martínez JM. A new typology of policies to tackle health inequalities and scenarios of impact based on rose's population approach. J Epidemiol Community Health. 2013;67:286–291. doi: 10.1136/jech-2011-200363. [DOI] [PubMed] [Google Scholar]
- 37.The Marmot Review. Fair society, healthy lives: strategic review of health inequalities in England post 2010. [accessed 14th June 2015];The Marmot Review. 2010 http://www.instituteofhealthequity.org/projects/fair-society-healthy-lives-the-marmot-review/fair-society-healthy-lives-full-report. [Google Scholar]
Associated Data
This section collects any data citations, data availability statements, or supplementary materials included in this article.


