Abstract
Stationary and nonstationary spatiotemporal pattern formations emerging from the cellular electric activity are a common feature of biological cells and tissues. The nonstationary ones are well explained in the framework of the cable model. Inversely, the formation of the widespread self-organized stationary patterns of transcellular ionic currents remains elusive, despite their importance in cell polarization, apical growth, and morphogenesis. For example, the nature of the breaking symmetry in the Fucus zygote, a model organism for the experimental investigation of embryonic pattern formation, is still an open question. Using an electrodiffusive model, we report here an unexpected property of the cellular electric activity: a phase-space domain that gives rise to stationary patterns of transcellular ionic currents at finite wavelength. The cable model cannot predict this instability. In agreement with experiments, the characteristic time is an ionic diffusive one (<2 min). The critical radius is of the same order of magnitude as the cell radius (30 μm). The generic salient features are a global positive differential conductance, a negative differential conductance for one ion, and a difference between the diffusive coefficients. Although different, this mechanism is reminiscent of Turing instability.
Stationary and nonstationary spatiotemporal pattern formations emerging from the cellular electric activity are a common feature of biological cells and tissues (1, 2). The propagation of an action potential along an excitable cell and cardiac spiral waves are well known examples of bioelectric nonstationary spatiotemporal patterns (3). Patterns of stationary transcellular ionic currents are also widespread. They have been observed in fungi, plants, alga, protozoa, and insects [refs. 2, 4–7; see also www.mbl.edu/labs/BioCurrents/Pub_index.html of the Biocurrents Research Center of the Marine Biological Laboratory (Woods Hole, MA), which contains numerous references on stationary transcellular ionic currents]. These currents enter the cell in one region, flow through the cytoplasm, and exit at a separate location, providing a current loop. They are intriguingly correlated to cell polarization, nutrient acquisition, calcification, apical growth, and morphogenesis, from which comes their importance in cellular biophysics. They are often thought to reflect natural asymmetries, but several experimental evidences indicate that symmetry breaking arises in the absence of any external cues (8). In Fucus, a model organism for the experimental investigation of embryonic pattern formation (6, 8–10), a few minutes after fertilization, the zygote of radius R of ≈30–50 μm exhibits a dipolar circulation of calcium ions ≈0.1–1 μA/cm2 that breaks the initial spherical symmetry (9–12). This circulation is one of the first signs of breaking symmetry. The axis of the dipolar ionic circulation can be fixed initially by any perturbation like sperm entry, chemical gradients, or electric fields (9, 10, 13, 14), a property very reminiscent from dynamical instability mechanism (15, 16). An F-actin patch is present as early as 30 min after fertilization (17). However, the axis is always labile during few hours. This example of pattern formation seems to occur with a characteristic diffusive time T ≈ R2/D, where R is the cellular radius and D is the relevant coefficient of ionic diffusion. It has been suggested previously that a Turing instability (18–21) or a self-aggregation of membrane proteins (22–24) could initiate this self-organized phenomenon. The models of self-aggregation predict the occurrence of transcellular ionic currents on a characteristic time T ≈ R2/Dp, where Dp is a characteristic coefficient of membrane diffusion of proteins. For a usual value of Dp ≈ 10–9 cm2/s in cellular membranes and R ≈ 30 μm, we get T ≈ 9·103 s, which is larger than the characteristic time of actin polymerization in the case of Fucus (17). Moreover, whatever the mechanism, Turing or self-aggregation, experimental evidences supporting these models are still lacking. Another model based on membrane conductances has also been proposed. It is only valid in the unrealistic limit of vanishing permeability and it can neither solve the experimental results of the vibrating probe and nor predict the wavelength domain of occurrence (25). We will show that stationary patterns of transcellular ionic currents arise from an unexpected coupling between bulk ionic diffusion and voltage-dependent ion channels. In the case of voltage-gated ion channels, two results are predicted in the literature: either an electric relaxation for a positive total differential conductance or a wave propagation (action potential) for a negative total differential conductance (1, 3). Here, we will show that a third response occurs when the ions flowing through the membrane diffuse outside the membrane with a significantly different diffusion rates. In response to a local membrane potential fluctuation, the diffusing ions will slowly set up a local electric field (due to the mismatch between diffusion coefficients) that will overcome the fast lateral dissipation along the cell membrane (also called the cable effect). The resulting electric field will enhance the initial membrane potential fluctuation providing a positive feedback response that drives the growth of the pattern around the zygote (see Origin of the Instability and Fig. 7 for a qualitative diagram).
Fig. 7.
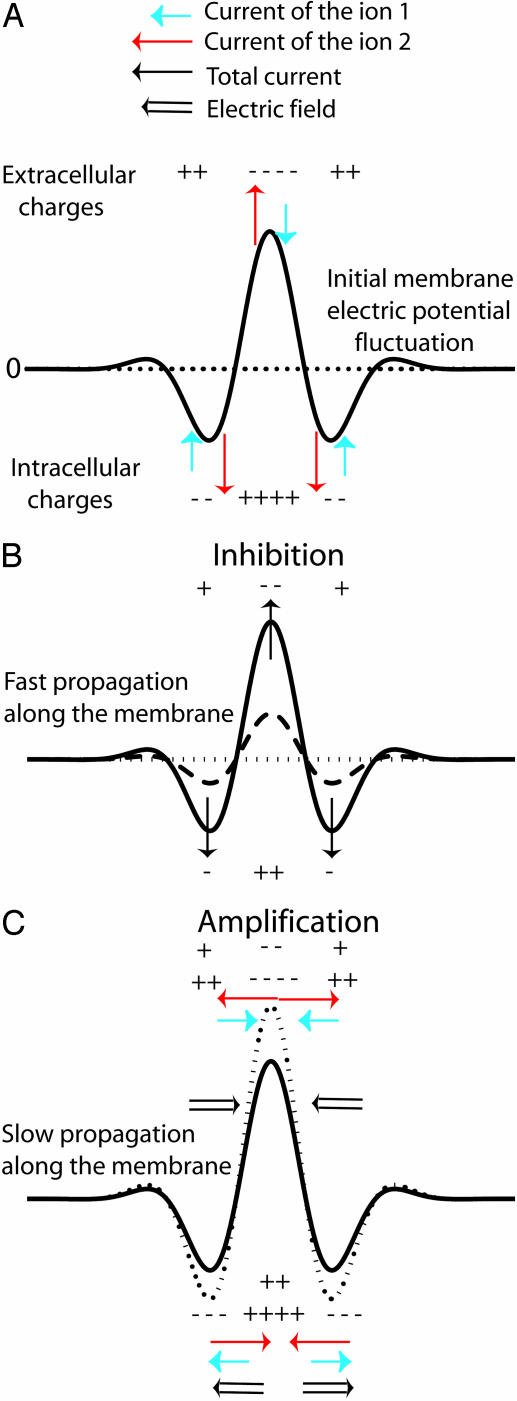
Origin of the instability. (A) Antagonist effects of an initial membrane potential fluctuation (solid line) around a stationary pattern (dotted line). Two membrane currents I1 (blue arrows) and I2 (red arrows) are induced. (B) The total current I1 + I2 tends to dissipate the fluctuation to zero (dashed and dotted lines) and propagates laterally rapidly by cable effect. (C) The initial membrane potential fluctuation generates also a concentration gradient for each ion, and electrodiffusive fluxes occur outside and inside the cell. Because the ions are assumed to diffuse at different speeds, the result is the occurrence of a lateral electric field (C), which amplifies the initial perturbation for a suitable ratio of diffusion coefficients, D2/D1 > 1. The characteristic dynamical coefficient of this amplification process is a diffusive one that is slower than the inhibition process. Thus, as the inhibition effect propagates rapidly, the perturbation is slowly and locally amplified.
Model Description
To describe the dynamics of both ions and membrane electric potential difference, we consider electrodiffusive models coupled to the membrane conductances to account for the membrane transport processes. For the sake of simplicity, we only consider two ions 1 and 2 of charge number z1 and z2, which diffuse at different rates in solution. Dj is the coefficient of diffusion of the ion j. In the initial state, the membrane potential V and each ionic concentration, respectively, are equal to V0 and Cj0 (j = 1, 2).
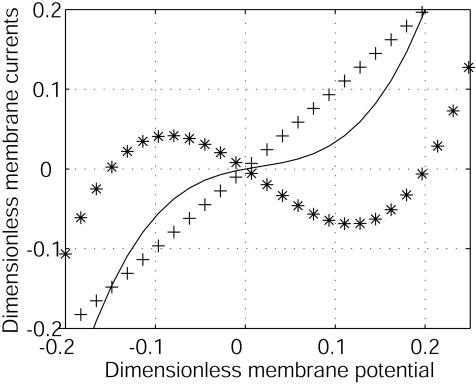
Membrane Currents. The current of each ion occurs through membrane proteins and is characterized by a current-voltage I–V curve: I1(V) and I2(V). The differential conductances G1 and G2 around the initial state V = V0 control the linear response of the cell to all perturbations. In all of the following, we assume that G1 is negative and that G2 and the sum G1 + G2 are positive (Fig. 1). This assumption is supported by experiments showing the presence of both voltage-dependent calcium channels and a potassium leak in Fucus (26). We model such a current by a cubic variation to have a N shape (Fig. 1):
 |
[1] |
 |
[2] |
where ν is the dimensionless membrane potential ν = (V – V0)/|V0|, F is the Faraday constant, ν1 and ν2 are two characteristic dimensionless membrane potentials, and P is a permeability coefficient that evaluates the dependence of the current with the intracellular concentrations. For the sake of simplicity, we take the same value for Ij and ignore the variations with the extracellular concentrations. We also define a dimensionless parameter  , which quantifies the variation of the currents with the concentrations versus the variation with the membrane potential. The results reported here do not depend on the exact shapes of the currents, which affect only the magnitude of the results.
Fig. 1.
Dimensionless membrane currents versus dimensionless electric membrane potential v = (V – V0)/|V0|. The current I2/G2|V0| (+++) of ion 2 is assumed to be linear. I1/G2|V0| (***) has an N shape characterized by a negative differential conductance G1 at V0. The dimensionless total current (I1 + I2)/G2|V0| (–) has a positive differential conductance. G1/G2 =–0.8. The concentrations are assumed to be at equilibrium.
2D and 3D Models. We consider a circular cell of radius R. In the extracellular and intracellular media, each ionic concentration Cj and the electric potential φ satisfy a continuity equation based on Nernst–Planck electrodiffusive flux and the Poisson equation:
 |
[3] |
 |
[4] |
The boundary conditions at cell membrane are:
 |
[5] |
 |
[6] |
 |
[7] |
where  is the molar electrodiffusive flux, F is the Faraday constant,
  is the outer normal unit vector, ε is the bulk permittivity, and Cm is the membrane capacitance: Cm = εm/d, where d is the membrane thickness. The subscripts i and e refer to the inside and the outside of the cell. The membrane potential V is equal to φi – φe. Eq. 5 is valid at the two sides of the membrane, which means that the current of each ion through the membrane, Ij, is equal to the outer and inner electrodiffusive ones. Eq. 6 provides the continuity of the electric field. Eq. 7 is the dielectric one where the right member
  is approximately a charge per unit area because of mobile ions integrated across the Debye layer. Eqs. 6 and 7 have been calculated from Maxwell boundary conditions at each interface (extracellular medium-membrane and membrane-intracellular medium), assuming the absence of fixed charges (due to lipids or proteins). We have assumed that the normal component of the electric field inside the membrane is a constant. This assumption is valid in biological cells where the characteristic length of membrane potential variations is large compared with the membrane thickness. Then, in the framework of this model, we determine explicitly the ionic charge density in the extracellular and intracellular media; the ionic charge density is not zero, notably, in the Debye layers. Far from the cell, the electric potential and the concentrations are equal to the initial values.
The 1D Model. To understand and characterize the results obtained in two dimensions, we have studied in details a 1D case that has the great advantage to be less time-consuming. It does not change the qualitative results. The 1D model (a cell cylinder of radius r) is based on the 1D Nernst–Planck equation with an additional capacitive relation:
 |
[8] |
 |
[9] |
Several authors have applied this model to relatively small intracellular structures such as dentritic spines (27). We have checked that the 3D model reduces to the 1D one for a cylindrical cell if the correlation space constant is large compared with the cell radius.
Numerical Methods. All the simulations are performed with dimensionless parameters, which vouches for the scope of the results. The dimensionless coordinates X and Y in two dimensions are equal to x/λ2 and y/λ2, where λ2 is the characteristic correlation space constant of the current  , where σ is the solution conductivity. The dimensionless time T is equal to
  , where D̃ is a mean ionic diffusion coefficient: D̃ = δ1D1 + δ2D2, with
  . We recall that
  . For all the figures, z1 = 2, z2 = 1, δj = 0.5, ν1 = –0.2, ν2 = 0.15,
  , and e|V0|/kBT = 4. These values are not critical for the results. p = 0.1 for all of the figures except the stability diagram (see Fig. 5). Other parameters are provided in the following section. We assume an initial white noise of the membrane potential and analyze the response of our system by computing the electrodynamic equations.
Fig. 5.
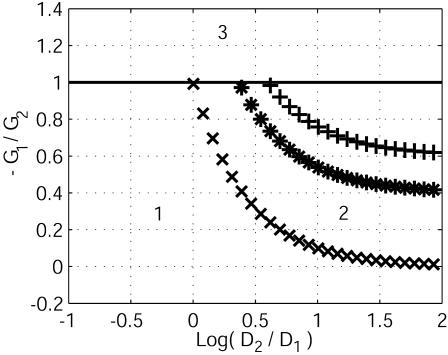
Stability diagram. The relevant parameters are –G1/G2, D2/D1, and p, which quantifies the variations of currents with concentrations. Three values of p are considered: p = 0 (xxx), 0.1 (***), and 0.3 (+++). Domains 1 (stability of the membrane potential due to capacitive relaxation) and 3 (instability, a wave propagation, leading to a new homogeneous resting state) were expected. The curve of zero total conductance –G1/G2 = 1 distinguishes domain 1 from 3. Domain 2 defines the new cellular instability that leads to stationary patterns of transcellular ionic currents on a typical ionic diffusive time.
Results
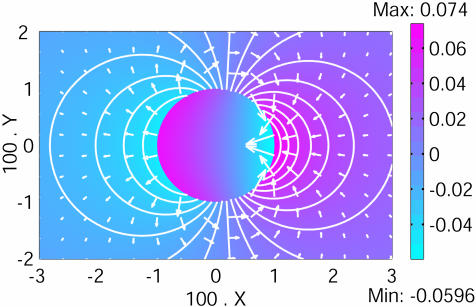
Let us consider a circular cell of radius R corresponding to the Fucus zygote (Fig. 2). The relevant ions are the calcium (ion 1) and potassium (ion 2) ones. The relevant value of the intracellular calcium diffusion coefficient must take into account the binding to buffers, reaction with organelle, and so on. We have collected the intracellular apparent values from different species. They vary from 2.010–6 to 10–8 cm2/s (4, 28, 29). We have used an intermediate value, DCa2+ ≈ 2.010–7 cm2/s. This value provides a large ratio of coefficients of diffusion D2/D1 = 100. The differential membrane conductances are assumed to be of the same order: G1/G2 = –0.8. For a dimensionless radius 2G2R/σ = 0.01, a stable stationary dipolar circulation of ions appears, breaking the initial symmetry as observed in Fucus (Fig. 2). Calcium ions and the electric field enter at the depolarized pole in agreement with experiments (9–12). An asymmetry exists between the magnitudes of the electric field at the two poles, reflected by the relative length of the arrows. It arises from the asymmetry of the N shape of I1(V).
Fig. 2.
A 2D pattern formation. The Fucus zygote has a dimensionless radius X = 0.01. The two relevant ions transported through the cell membrane are the calcium (1) and the potassium (2), D2/D1 = 100 and G1/G2 = –0.8. A stationary dipolar circulation of ions occurs through the cell, breaking the initial symmetry. The color bar indicates the value of the dimensionless electric potential (zero at infinite). The white arrows are proportional to the local electric field, and the isopotential curves are shown by white lines.
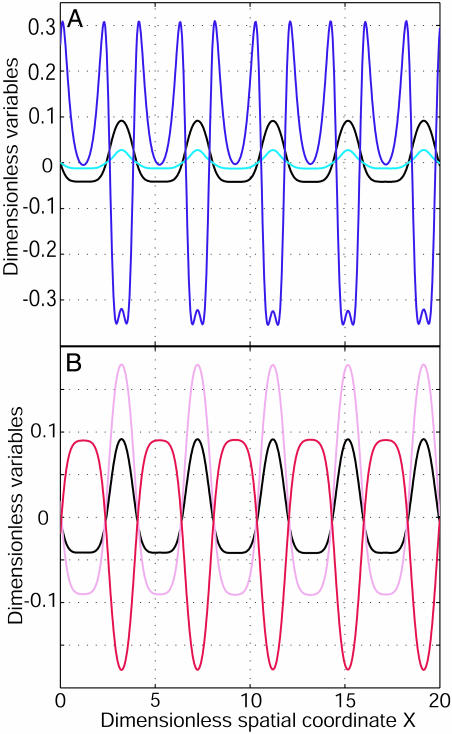
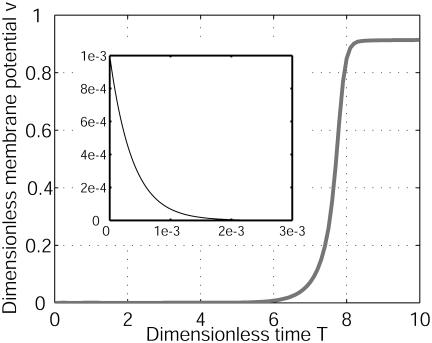
To understand this mechanism fully, we needed to return to the 1D model that allows both reasonable time computations and analytical calculations. In one dimension, for D2/D1 = 100 and G1/G2 =–0.8, the system is still unstable; any perturbation is amplified. After a characteristic time, a stable spatial modulation of finite wavelength λ of the membrane potential has developed along the cellular axis. It arises from ionic currents (Fig. 3A) that break the symmetry along the cell. On Fig. 3B, we have also computed the patterns of the intracellular ionic concentrations C1 and C2. The variations of the extracellular concentrations are opposite. The width and the amplitude of both depolarized and hyperpolarized bands are different. Such a property is uncommon in pattern formation (30). The characteristic time is typically an ionic diffusive time: T ≈ R2/D1 in the limit of large ratio D2/D1 (Fig. 4). In agreement with experiments, the characteristic time is ≈1 min for the Fucus zygote (9–12). This time is shorter than that required for any cytological modification [F-actin polymerization, notably (17)], which suggests that ionic current pattern could be the initial event leading to the symmetry breakage. The difference between the total ionic current and the ohmic current is described in Discussion.
Fig. 3.
A 1D pattern formation. (A) The dimensionless membrane potential v = (V – V0)/|V0| (black), the dimensionless total membrane current (I1 + I2)/G2|V0| (cyan), and the dimensional ohmic current D̃(I1/D1 + I2/D2)/G2|V0| (blue) as a function of the dimensionless spatial coordinate X = x/λ2 along the cellular axis (λ2 is the cable length of 2). (B) v and dimensionless concentrations (C1 – C10)/C0 (pink) and (C2 – C20)/C0 (red) as a function of X. Parameters are G1/G2 =–0.8 and D2/D1 = 100. The initial perturbation is a spatial modulation of small amplitude at v = 0. After a specific time, a stationary spatial pattern of membrane potential, currents, and concentrations appears along the cellular axis.
Fig. 4.
Characteristic time. v = (V – V0)/|V0|at X = 18 on Fig. 2 is computed as a function of the dimensionless time T. G1/G2 = –0.8 and D2/D1 = 100. Initially, the system was perturbed by a white noise of electric membrane potential. An unexpected new structure appears on a characteristic ionic diffusion time. To the contrary, for D2/D1 = 0.7, the membrane potential relaxes on an expected electrical time (see Inset). More than four orders of magnitude are between the two times, revealing the different bioelectrical origins.
To investigate the domain of occurrence of this cellular diffusive instability, we vary the two parameters D2/D1 and G1/G2. For instance, for a typical ratio of diffusion coefficients, D2/D1 = 0.7, which corresponds to K+ (ion 1) and Na+ (ion 2) and the same ratio of differential membrane conductances, G1/G2 = –0.8, the membrane potential difference V relaxes to zero (Fig. 4 Inset) on a characteristic electric time t ≈ Cm/(G1 + G2) as predicted in literature (1, 3). This response corresponds to domain 1 of the stability diagram (Fig. 5). Note the tremendous difference between the diffusive and electric time relaxation (four orders of magnitude). When G1/G2 < –1, we recover the expected domain of wave propagation for a total negative differential conductance (Fig. 5, domain 3). The stability diagram depends also on the variation of the currents with the concentrations (Fig. 5, domain 2). We have computed this diagram for three values of p. The large ratio of coefficients of diffusion D2/D1 used here arise from the low calcium mobility caused by the intracellular buffering activity (4, 28, 29). As shown in Fig. 5, for small p, the diffusive cellular instability can appear as soon as D2/D1 > 1, indicating that a huge value is not essential.
Discussion
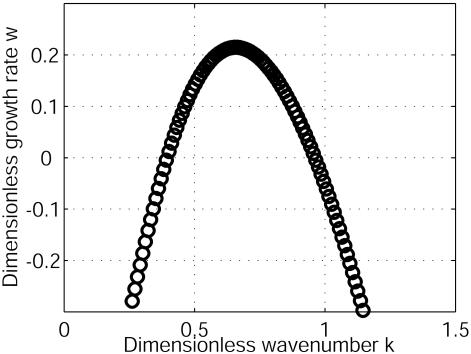
Critical Size Evaluation. A linear analysis and numerical computations permit also the determination of the dispersion relation (Fig. 6). Contrary to previous works on electrodynamic instabilities (25), for D2/D1 = 100, when the conductance G1 is decreased from positive values to negative ones, the membrane potential becomes unstable at a finite characteristic wavelength and, beyond, a finite range of wavelength exists for which there is instability (Fig. 6). If the cellular radius is less than a critical one, Rc, the membrane potential is stable. Above Rc, the first mode that is unstable is the dipolar mode as shown in Fig. 2. If the radius is further increased (or D1 is decreased), the quadrupolar mode is the most probable and so on [mechanism of wavelength selection (15, 16)]. After ≈10 h, the quadrupolar mode will generate two opposite growing poles similar to the mode observed in experiments in response to a change of calcium diffusion (31) or in the presence of a plane-polarized light (32). The induction of double rhizoids indicates a mechanism of selection of the developmental axis, supporting such a theoretical approach. In the limit of high D2/D1, Rc ≈ (D1/D2)σ/|G1|. In Fucus, after the fertilization, the total membrane resistance becomes small, a few kiloohms (26), which provides an order of magnitude of |G1|. Therefore, for σ ≈ 0.5 Ωm, we get Rc ≈ 31 μm, which is in agreement with the Fucus radius. The presence of a finite wavelength domain of instability occurrence is a fundamental property to establish some analogy with reaction-diffusion system (17–20, 33).
Fig. 6.
Dispersion relation. The homogeneous state becomes unstable against periodic perturbations in a finite range of dimensionless wave numbers k (k = 2πλ2/λ, where λ is the wavelength of the perturbation) for the following parameters: G1/G2 = –0.8 and D2/D1 = 100. The typical time of occurrence 1/w (w is the growth rate) is an ionic diffusive one. The instability appears at a finite wavelength and not at k = 0 as in other electrodynamic instabilities. This instability is analogous to the Turing instability.
Ohmic Versus Total Extracellular Currents. The vibrating probe consists of a microelectrode that oscillates on a small amplitude farther from the membrane than the Debye layer but sufficiently close to measure a signal (12). The vibrating probe measures the local electric field which, according to Ohm's law, is assumed to be proportional to the total extracellular current. However, this assumption fails in the case of transcellular ionic currents. Indeed, outside the membrane at a distance longer than the Debye length, it is valid to assume electroneutrality: ρ = z1F(C1 – C10) + z2F(C2 – C20) ≈ 0, where ρ is the charge density. In this approximation, the total electrodiffusive current is equal to:
 |
[10] |
where  and
and  are the local electric field and the local concentration gradient, respectively. The total current
  reduces to its ohmic part
  when the ions flowing through the membrane have a similar diffusion coefficient (e.g., Na+, K+, and Cl–) or when concentration gradients are neglected (34). Unfortunately, in Fucus, calcium diffuses slower than potassium or sodium ions. So, a significant test of the validity of our mechanism is to compute the ohmic part, Iohmic, of the total current. Outside the membrane at a distance longer than the Debye length, using electroneutrality, we calculate:
 |
[11] |
On Fig. 3A, the computation of D̃(I1/D1 + I2/D2) shows that a hyperpolarized (depolarized) band matches an output (input) of the ohmic current in agreement with experiments. In agreement with Eq. 10 the total extracellular current is opposite to the ohmic current (Fig. 3A). Note that in the limit where  dominates, the vibrating probe can evaluate the current of ion 1:
  .
.
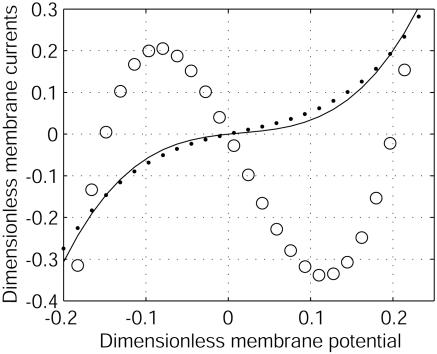
Origin of the Instability. To understand the origin of the stationary self-organized pattern described here, let us consider the effect of a local fluctuation of the membrane potential (Fig. 7A) around its resting-state value (Fig. 7A). As shown in Fig. 7A, a local membrane depolarization will occur in response to an increase of a local positive (negative) charge density inside (outside) the cell. This fluctuation generates membrane currents, I1 for ion 1 (Ca2+) and I2 for ion 2 (K+) (Fig. 7A). Because G1/G2 is negative, these currents are opposite. The first consequence is a local membrane current I1 + I2 (Fig. 7B), which tends to dissipate the fluctuation as G1 + G2 > 0. The cable model provides the characteristic dynamic coefficient of this process: Dm ≈ rσ/4Cm, where Cm is the membrane capacitance. For a cell diameter r of 10 μm, σ = 0.5 Ωm and Cm = 0.01 Fm–2, and D2 = 2.0 10–5 cm2/s, Dm/D2 ≈ 106 » 1. Thus, a very fast lateral inhibition will occur. The second consequence of the local membrane potential fluctuation is a variation of the ionic concentrations on either side of the membrane that, in turn, induces a lateral ionic electrodiffusive flux inside and outside the cell (Fig. 7C). These fluxes are opposite and, because both ions diffuse at different speeds, ionic diffusion of 1 and 2 induces spatial ionic charge differences that, in turn, generate an electric field determined (and computed) by Eq. 11. The direction of the electric field depends on the sign of G1/D1 + G2/D2, which is negative for D2/D1 = 100 (Fig. 8). In this case, the diffusion-induced electric field amplifies the initial perturbation of the membrane potential. The characteristic dynamic coefficient of this process is an ionic diffusive one, D1D2/D̃. This second effect is a slow local self-activation. Thus, two antagonist effects occur in response to a membrane potential fluctuation: a very fast lateral inhibition arising from membrane potential propagation along the cell membrane due to the cable properties of cell membranes and a slow local amplification due to ionic diffusion-induced currents that enhance the local membrane potential fluctuation. The result is a balance between these two antagonistic effects. The unstable case happens as soon as the perturbation lasts longer than the time required for lateral inhibition, which permits the establishment of a significant ion gradient around the membrane to initiate the instability. Note that the total current and the electric field are opposite, breaking Ohm's law. This finding underlines why the instability cannot be predicted by a classic electric cable. For D2/D1 = 0.7 (K+/Na+), the electric field has the other direction (G1/D1 + G2/D2 > 0) (Fig. 8). Therefore, no local positive feedback occurs for D2/D1 < 1 because the two effects depicted in Fig. 7 inhibit the initial perturbation.
Fig. 8.
Dimensionless membrane currents versus dimensionless electric membrane potential for G1/G2 = –0.8. The total current (I1 + I2)/G2|V0| (–) does not depend on D2/D1. For D2/D1 = 100 (e.g., Ca2+ = 1 and K+ = 2), the ohmic current D̃(I1/D1 + I2/D2)/G2|V0| (○) has a negative differential conductance at V0, whereas for D2/D1 = 0.7 (e.g., Na+ = 2 and K+ = 1), it has a positive differential conductance (•). This sign change with the ratio D2/D1 is at the origin of the instability.
It has been suggested that self-organization of the fluid mosaic of charged channel proteins in membranes could explain the formation of the ionic current pattern. This phenomenon occurs with a larger time constant (hours) than that of the diffusive process described here (minutes). This finding suggests that electrodiffusion would be the early event for pattern formation, lateral diffusion of membrane proteins being important to sustain the pattern, at least in the case of Fucus. Other phenomena (e.g., membrane, cell wall, and cytoplasmic reorganization and actin polymerization) with large relaxation times could also contribute to maintaining the pattern and, beyond, the breaking symmetry as time elapses.
After fertilization, the polar axis remains labile for about 10 h. During this period it can be reoriented in the presence of an external cue (9, 10, 13, 14). Two kinds of reorientation can be differentiated. The first appears soon after the fertilization and consists of spontaneous reorientation of the polar axis measured with the vibrating probe (35). The framework of electrodiffusive instabilities provides a simple explanation for this fast reorientation: the current pattern will reorganize under the electric field fluctuation. The amplitude required to induce this reorientation will be larger than thermal fluctuations and of the order of the electric field generated by the pattern of transcellular ionic currents. The second kind of reorientation occurs in response to an environmental cue when the spatial organization of the cytoplasm is clearly visible. For example, a unilateral light can reorient the axis after few hours before a characteristic time (axis fixation). To understand this last process, it is necessary to take into account other phenomena (e.g., signal transduction pathways and cytoplasmic reorganization) with large relaxation times.
Experimental evidence shows a correlation of the polarizations of neighboring Fucus (36). In our model and in the self-aggregation model, the electric field generated by the dipolar transcellular ionic currents decreases like 1/r3 far from the cellular membrane (r is the radial coordinate). Thus, if two Fucus are sufficiently close, the two loops of currents interact strongly and the instability will select a peculiar mode; their polarizations will be correlated. By symmetry, for two Fucus, the simplest mode is such that the axis is the same as in experiments (36). If the two Fucus are far from each other, thermal noise will prevent any correlation.
Finally, the mechanism described here casts a glance on the role of ionic diffusion in bioelectric self-organization and defines simple conditions for a new kind of instability. It gives a reasonable accurate representation of the spatiotemporal pattern of transcellular ionic currents observed in numerous cells and, notably, in Fucus. The mechanism seems to have the salient features of a Turing-like pattern (17–20, 33). It can be included in the general class introduced by Gierer and Meinhardt (33, 37): local self-activation (diffusion-induced currents) and lateral inhibition (electric relaxation). However, the condition D1 < D2 is only necessary to have the positive feedback in this mechanism. In Turing, D1 < D2 contributes to differentiate the timescales of positive and negative effects what underlies the microscopic difference between the two mechanisms.
Acknowledgments
This work was supported by the Fonds National de la Recherche Scientifique (Belgium), the Communauté Française de Belgique-Action de Recherches Concertées, and the Centre National de la Recherche Scientifique (France) “Programme Physico-Chimie du Vivant.”
This paper was submitted directly (Track II) to the PNAS office.
References
- 1.Koch, C. (1999) Biophysics of Computation: Information Processing in Single Neurons (Oxford Univ. Press, Oxford).
- 2.Gow, N. A. R. (1989) Adv. Microb. Physiol. 30, 89–123. [DOI] [PubMed] [Google Scholar]
- 3.Mikhailov, A. S. & Holden, A. V. (1997) Computational Biology of the Heart (Wiley, New York).
- 4.Holdaway-Clarke, T. L. & Hepler, P. K. (2003) New Phytol. 159, 539–563. [DOI] [PubMed] [Google Scholar]
- 5.Kropf, D. L., Lupa, M. D., Caldwell, J. H. & Harold, F. M. (1983) Science 220, 1385–1387. [DOI] [PubMed] [Google Scholar]
- 6.Jaffe, L. F. (1999) BioEssays 21, 657–667. [DOI] [PubMed] [Google Scholar]
- 7.Lucas, W. J. (1993) in Oscillations and Morphogenesis, ed. Rensing, L. (Marcel Dekker, New York), pp. 413–425.
- 8.Wedlich-Soldner, R. & Li, R. (2003) Nat. Cell Biol. 5, 267–270. [DOI] [PubMed] [Google Scholar]
- 9.Kropf, D. L. (2001) in Branching in Nature, eds. Fleury, V., Gouyet, J.-F. & Leonetti, M. (EDP Sciences, Les Ulis, Springer, Berlin), pp. 87–98.
- 10.Kropf, D. L., Bisgrove, S. R. & Hable, W. E. (1999) Trends Plant Sci. 4, 490–494. [DOI] [PubMed] [Google Scholar]
- 11.Robinson, K. R. & Jaffe, L. F. (1975) Science 187, 70–72. [DOI] [PubMed] [Google Scholar]
- 12.Nuccitelli, R. (1983) Mod. Cell Biol. 2, 451–481. [Google Scholar]
- 13.Gibbon, B. C. & Kropf, D. L. (1994) Science 263, 1419–1421. [DOI] [PubMed] [Google Scholar]
- 14.Robinson, K. R. & Cone, R. (1980) Science 207, 77–78. [DOI] [PubMed] [Google Scholar]
- 15.Bowman, C. & Newell, A. C. (1998) Rev. Mod. Phys. 70, 289–301. [Google Scholar]
- 16.Cross, M. C. & Hohenberg, P. C. (1993) Rev. Mod. Phys. 65, 851–1112. [Google Scholar]
- 17.Hable W. E. & Kropf, D. L. (2000) Development (Cambridge, U.K.) 127, 493–501. [DOI] [PubMed] [Google Scholar]
- 18.Lengyel, I. & Epstein, I. (1991) Science 251, 650–652. [DOI] [PubMed] [Google Scholar]
- 19.Turing, A. (1952) Philos. Trans. R. Soc. London Ser. B 237, 37–72. [Google Scholar]
- 20.Ouyang, Q. & Swinney, H. L. (1991) Nature 352, 610–612. [Google Scholar]
- 21.Castets, V., Dulos, E., Boissonade, J. & De Kepper, P. (1990) Phys. Rev. Lett. 64, 2953–2956. [DOI] [PubMed] [Google Scholar]
- 22.Jaffe, L. F. (1977) Nature 265, 600–602. [DOI] [PubMed] [Google Scholar]
- 23.Fromherz, P. (1998) Proc. Natl. Acad. Sci. USA 85, 6353–6357. [DOI] [PMC free article] [PubMed] [Google Scholar]
- 24.Kramer, S. C. & Kree, R. (2002) Phys. Rev. E 65, 051920. [DOI] [PubMed] [Google Scholar]
- 25.Leonetti, M. & Dubois-Violette, E. (1998) Phys. Rev. Lett. 81, 1977–1980. [Google Scholar]
- 26.Taylor, A. & Brownlee, C. (1993) Planta 189, 109–119. [Google Scholar]
- 27.Klingauf, J. & Neher, E. (1997) Biophys. J. 72, 674–690. [DOI] [PMC free article] [PubMed] [Google Scholar]
- 28.Silverman-Gravila, L. B. & Lew, R. R. (2003) Microbiology 149, 2475–2485. [DOI] [PubMed] [Google Scholar]
- 29.Qian, N. & Sejnowski, T. J. (1990) Proc. Natl. Acad. Sci. USA 87, 8145–8149. [DOI] [PMC free article] [PubMed] [Google Scholar]
- 30.Meinhardt, H. (1995) Nature 376, 722–723. [Google Scholar]
- 31.Speksnijder, J. E., Miller, A. L., Weisenseel, M. H., Chen T.-H. & Jaffe, L. F. (1989) Proc. Natl. Acad. Sci. USA 86, 6607–6611. [DOI] [PMC free article] [PubMed] [Google Scholar]
- 32.Jaffe, L. F. (1958) Exp. Cell Res. 15, 282–299. [DOI] [PubMed] [Google Scholar]
- 33.Meinhardt, H. & Gierer, A. (2000) BioEssays 22, 753–760. [DOI] [PubMed] [Google Scholar]
- 34.Ferrier, J. M. (1980) J. Theor. Biol. 85, 739–743. [DOI] [PubMed] [Google Scholar]
- 35.Nuccitelli, R. (1978) Dev. Biol. 62, 13–33. [DOI] [PubMed] [Google Scholar]
- 36.Jaffe, L. F. (1968) Adv. Morphol. 7, 295–328. [DOI] [PubMed] [Google Scholar]
- 37.Gierer, A. & Meinhardt, H. (1972) Kybernetik 12, 30–39. [DOI] [PubMed] [Google Scholar]


