

Abstract
The analysis of conservation between the human and mouse genomes resulted in the identification of a large number of conserved nongenic sequences (CNGs). The functional significance of this nongenic conservation remains unknown, however. The availability of the sequence of a third mammalian genome, the dog, allows for a large-scale analysis of evolutionary attributes of CNGs in mammals. We have aligned 1638 previously identified CNGs and 976 conserved exons (CODs) from human chromosome 21 (Hsa21) with their orthologous sequences in mouse and dog. Attributes of selective constraint, such as sequence conservation, clustering, and direction of substitutions were compared between CNGs and CODs, showing a clear distinction between the two classes. We subsequently performed a chromosome-wide analysis of CNGs by correlating selective constraint metrics with their position on the chromosome and relative to their distance from genes. We found that CNGs appear to be randomly arranged in intergenic regions, with no bias to be closer or farther from genes. Moreover, conservation and clustering of substitutions of CNGs appear to be completely independent of their distance from genes. These results suggest that the majority of CNGs are not typical of previously described regulatory elements in terms of their location. We propose models for a global role of CNGs in genome function and regulation, through long-distance cis or trans chromosomal interactions.
Comparative genomics analysis with other vertebrate genomes promises the identification of some of the functional elements (Hardison et al. 1997; O'Brien et al. 1999; Ureta-Vidal et al. 2003). The exploration of the human genome (Lander et al. 2001; Venter et al. 2001) through the comparison with other genomes is reaching a very interesting and exciting stage. Although most of the current methodologies for gene identification have succeeded in determining most of the genes of the mammalian genomes (Alexandersson et al. 2003; Guigo et al. 2003), there has been very little progress in the elucidation of function of highly conserved nongenic (CNG) sequences (Dermitzakis et al. 2002; Waterston et al. 2002; Boffelli et al. 2003). Some recent studies have attempted to identify the evolutionary properties of CNGs (Boffelli et al. 2003; Dermitzakis et al. 2003). It became apparent that such sequences are often more conserved than coding sequences and are conserved in multiple mammalian species (Dermitzakis et al. 2003; Thomas et al. 2003). In addition, CNGs appear to undergo evolutionary processes different from those of coding sequences and noncoding RNAs. A small number of them have also recently been implicated in regulation of alternative splicing (Sorek and Ast 2003).
A few of the CNGs have been functionally characterized, and some of these sequences are most likely regulatory sequences of nearby genes (Loots et al. 2000; Boffelli et al. 2003). The distance between these regulatory CNGs and the genes they regulate could be large, in the order of hundreds of kilobases (Kleinjan and van Heyningen 1998; Spitz et al. 2003). However, the successfully analyzed sequences are a minority of the total number of the CNGs identified, which usually have characteristics (higher conservation, proximity to genes) distinct from those of the average CNG and thus have an a priori higher probability of being a regulatory sequence.
In a previous study we performed a systematic analysis of conservation of a sample of 191 human chromosome 21 (Hsa21) CNGs and their characteristics across the whole mammalian phylogenetic tree (Dermitzakis et al. 2003). There we studied attributes of CNGs on the phylogenetic tree, disregarding their position relative to the other components of the genome. However, it is a reasonable assumption that levels and patterns of conservation of CNGs are dependent on the proximity to genes and density of functional genomic elements in a given genomic region.
In the present study we took advantage of the recent availability of the 1.5× coverage of the whole-genome shotgun sequence of the dog (Canis familiaris; Kirkness et al. 2003) to perform three-way comparisons of all CNGs and conserved exonic sequences of Hsa21 and their orthologous regions in mouse and dog. Our evolutionary analysis shows that almost all of the CNGs identified between human and mouse are also conserved in dog. Attributes of conservation such as substitution biases that had been observed before (Dermitzakis et al. 2002, 2003) were also detected in our analysis. Remarkably, the most striking result is that attributes of conservation of CNGs are not correlated with the distance of nearby genes. We present data that support that CNGs on Hsa21, and most likely in the whole human genome, act in a manner independent of the nearby genic environment. This raises interesting hypotheses concerning the role and interactions of CNGs with the rest of the genome, and the organization of functional DNA in the nucleus.
RESULTS
Identification of Orthologous Dog Sequences
The quality of the dog 1.5× assembly was assessed by comparing the sequence with two other sources of dog sequence, high-quality BAC sequencing from Eric Green (NHGRI) and colleagues (115,479 bp; GenBank accession AC144643), and shotgun reads from the NIH-funded dog genome. The levels of similarity at the nucleotide level (excluding indels) in these two comparisons were 99.9% and 99.8%, respectively (see Methods). This high level of similarity suggests that the quality of the assembly used in the present study is high enough to produce reliable conclusions regarding the levels of conservation of the chosen sequences.
The 2262 unknown conserved nongenic sequences, (herein named CNGs) and 1229 known (exonic) conserved sequences (herein named CODs) between human and mouse from Dermitzakis et al. (2002) were searched by reciprocal BLAST, and a threshold e-value of 10-3 against assembled genomic sequences, representing the 1.5× coverage of the dog genome (Kirkness et al. 2003, also see Methods) was used. A total of 1638 orthologous CNGs (73%) and orthologous 976 CODs (79%) were retrieved. All of the dog sequences were subsequently aligned with MultiPipMaker (Schwartz et al. 2003) with their orthologous human and mouse sequences, resulting in 1638 CNG and 976 COD alignments in all three of these mammalian species. If we require that any given CNG sequence is found and aligned to the 1.5× genome with 10%, 50%, and 90% coverage of its sequence, we expect to find hits for 85%, 78%, and 70% of the CNGs, respectively. It is therefore likely that almost all of the CNGs (of at least 100 bp in length and at least 70% identity without gaps between human and mouse genomes) are conserved in these three mammalian species. This supports the notion that the majority of CNGs are conserved in the majority of the mammals, as has been suggested (Dubchak et al. 2000; Frazer et al. 2001; Dermitzakis et al. 2003).
Levels of Divergence of Intergenic CNGs, Intronic CNGs, and CODs
We also measured levels of divergence in the three lineages of human, mouse and dog for the three types of conserved sequences, intergenic and intronic CNGs and CODs. Figure 1 shows the distribution of branch length values as percent sequence change estimates with the Kimura two-parameter distance (Kimura 1980). Remarkably, almost all of the originally identified CNGs and CODs between human and mouse are also highly conserved in dog. Moreover, as described in Dermitzakis et al. (2003), the level of divergence of CNGs is significantly lower than the CODs in the dog lineage. This result once more illustrates that the CNGs are highly constrained and constitute a functional class of genomic sequences. Interestingly, when we performed a regression analysis between divergence in the human, mouse, and dog lineages we observed low but statistically significant levels indicating that the space of conservation that we were analyzing is substantially high and not capable of giving high regression coefficient values (see Fig. S1 in Supplemental information). Finally, the pattern of periodicity observed in a past study (Dermitzakis et al. 2002) was also observed with the three-species alignment (see Suppl. Fig. S2).
Figure 1.

Distributions of human, mouse, and dog branch lengths using the K80 estimate of divergence for intergenic CNGs (A,B,C), intronic CNGs (D,E,F), and CODs (exonic; G,H,I). The y-axes indicate the number of sequences (frequency).
Direction of Substitutions in CNGs and CODs
One of the interesting properties in sequence evolution is the direction of substitutions that can reveal patterns of selective constraint associated with local nucleotide composition. We previously described a pronounced bias in substitutions of CNGs from AT to GC in mouse and rabbit (Dermitzakis et al. 2002). We have now determined in a much more extended sample the direction of substitutions in the human, mouse, and dog lineages assuming an unrooted tree of the three species. We used PAML3 to derive the direction of substitutions for each branch and counted them. Figure 2A shows the counts of the different directions of substitutions within CNGs for each species. It is apparent that there are some obvious biases such as the excess of AT to GC changes in mouse.
Figure 2.

(A) Numbers and direction of the different types of substitutions detected in the three lineages of human, mouse, and dog assuming an unrooted tree. (B,C,D) Relative rates of GC minus AT substitutions in CODs, intronic CNGs, and intergenic CNGs in human (B), mouse (C), and dog (D). Note the excess of GC to AT substitutions in human CODs.
We also computed the same values for the CODs, in order to determine a particular bias in those versus the CNGs. Figure 2B,C,D shows the relative rates of GC to AT nucleotide changes for intronic and intergenic CNGs and CODs in all three species. It is clear that the AT to GC bias is pronounced in CNGs in mouse but absent from CODs. The mouse and dog CODs do not show any strong GC to AT effect. One of the intriguing patterns is that there is a GC to AT bias in the CODs in humans. This is contrary to expectation, because the codon bias of the human genome is GC-biased in degenerate codon positions and is associated with expression levels (Iida and Akashi 2000). This implies that genes on Hsa21 have become more AT-rich and thus disfavored by codon availability and likely more restricted in their rate of translation. This observation needs to be explored further and compared with the genes in other chromosomes.
Organization of CNGs and Distance From Annotated Human Genes
We mapped the 2262 original CNGs (Dermitzakis et al. 2002) in the most recent build (NCBI build 33) of the human genome, relative to the 238 known Hsa21 genes. A total of 1813 (80%) CNGs are mapped in intergenic regions and 449 (20%) within introns. We calculated the distance of each of the intergenic CNGs from the nearest gene, regardless of its orientation. Figure 3A shows the distribution of the smaller of the two distance values from the two adjacent genes for all CNGs. There is a pronounced peak at 50 Kb with a long tail to higher distances (mean = 148 kb, median = 86 kb, min = 19 bp, max = 988 kb). This distribution of course is confounded on the length of the intergenic regions of human chromosome 21. To obtain an unbiased picture we calculated the distance of each CNG from the two adjacent genes normalized for the length of the intergenic region. The distribution of these proportional positions in the intergenic region (relative position values are between 0 and 1) is presented in Figure 3B. It is striking that this distribution is uniform, indicating that CNGs do not tend to be closer to genes even in long intergenic regions, but are distributed evenly in the sequence between two adjacent genes, as if there is no dependence on them.
Figure 3.

(A) Distribution of the distances of CNGs from the nearest gene (minimum distance from gene). (B) Relative position of CNGs in intergenic regions when all of them are scaled to 1. Note the uniformity along the intergenic regions. The y-axis indicates the number of sequences (frequency).
Relationship of Nucleotide Sequence Divergence With Distance From Genes
If the majority of CNGs in intergenic regions were mainly regulatory regions of the adjacent genes, one would expect that CNGs closer to genes would have a higher or at least different constraint from those far from genes. We computed the correlation coefficient for the degree of divergence in the human lineage relative to the distance from the closest gene according to the current annotation of the human genome (NCBI build 33). Surprisingly, we observed no correlation, showing that the selective constraint is independent of the genic environment of the chromosomal regions under study (Fig. 4A). This is consistent with the observation above that the density of intergenic CNGs is independent of the distance from genes.
Figure 4.
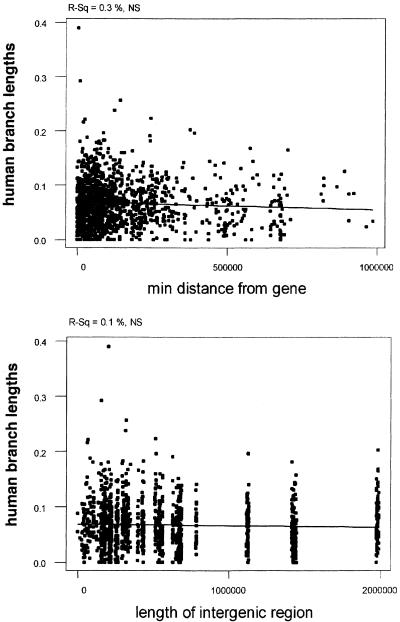
Regression of human branch lengths with the distance from the nearest gene (A) and length of intergenic region (B). Regression lines are indicative. P-values and R-squared values are at the top of the graph.
In addition, we performed a correlation analysis of the human branch length (divergence) with the length of the intergenic region in which the CNGs reside. We also observed no correlation between the divergence values of CNGs in short versus long intergenic regions (Fig. 4B). This suggests that the nature of selective constraint of CNGs does not differ between those residing in long and short intergenic regions. It is possible that more genes will be identified on Hsa21 (e.g., keratin-associated protein gene clusters). However, given the fact that Hsa21 has been exhaustively studied, we do not expect a large increase in the number of genes. Nevertheless, even if we would introduce genes in the currently large intergenic regions, the pattern is not expected to change, because by “inserting” a gene in a uniform distribution of CNGs the pattern will remain independent of gene distance.
Clustering of Substitutions
Protein-binding regions tend to have an alternating pattern of high- and low-conservation blocks, where the high-conservation blocks correspond to the protein-binding sites (Stojanovic et al. 1999). We recently used a modified statistic originally developed by Tang and Lewontin (1999) to test for hot-spots and cold-spots of substitutions in sequences (Dermitzakis et al. 2003). There was more pronounced clustering of sequence similarities in CNGs than CODs, and we attributed that to a potential function of CNGs compatible with sequences corresponding to binding sites of DNA-binding proteins flanked by spacer sequence. We performed the same analysis here using the alignments of the human–mouse–dog sequences. The significance of the test is determined by permutation, and therefore we used the P-value as a metric to compare in different classes of sequences.
As we have previously observed, there is more pronounced clustering in intronic and intergenic CNGs than in the CODs (Fig. 5A). Interestingly, the clustering significance is not different between intronic and intergenic CNGs, suggesting that these two types of CNGs may not have different function.
Figure 5.
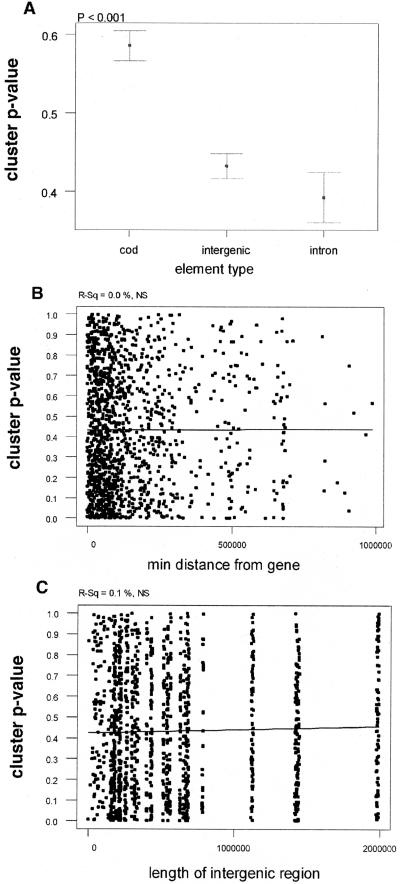
(A) Confidence intervals of clustering P-values for CODs, intergenic CNGs, and intronic CNGs. (B,C) Regression of clustering P-values with distance of CNG from nearest gene (B) and length of intergenic region (C). Regression lines are indicative. P-values and R-squared values are at the top of the graph.
The data presented above strongly suggest that attributes of selective constraint are not correlated with distance from the adjacent genes. We therefore tested whether clustering P-values show any correlation with distance from genes. We observed no correlation of P-values with distance from the nearest gene (Fig. 5B), or with the length of the intergenic region (Fig. 5C), further supporting the conclusions that the selective constraint of CNGs is independent of the distance from the adjacent genes, and likely independent of the genic environment of their genomic location.
DISCUSSION
One of the most exciting observations following the comparison of the human and mouse genomes is the discovery of the likely functional conserved nongenic (CNGs) sequences (Dermitzakis et al. 2002; Waterston et al. 2002). In the present study we describe the first chromosome-wide analysis of CNGs beyond the human–mouse comparison by using the 1.5× coverage of the dog genome sequence. We analyzed a set of characteristics related to selective constraint and patterns of substitutions of intronic and intergenic CNGs and how they compare with those of CODs. The main conclusions from this analysis are: (1) Almost all CNGs are highly conserved in dog and therefore are shared among a large number of mammals; and (2) their attributes of selective constraint are independent of the genic environment they reside in, suggesting new, intriguing models for their function.
The levels of divergence of the tested CNGs in dog appear to be low, and we were able to find about 73% of the CNGs and 79% of the CODs in the 1.5× sequence coverage of the dog genome. It is expected that with such coverage we should be able to detect approximately 78% of all previously identified CNGs and CODs, if all are present and conserved. Given the cloning bias of some regions and the statistical error, we conclude that almost all of the CNGs identified between human and mouse will be present and highly conserved in dog.
In addition, the patterns of substitution of CNGs and CODs suggest unique properties for the genomic regions in which they are found. Specifically, we observed a direction of the substitutions in mouse and dog which leads to an increase of the GC content in their CNG sequences. Remarkably, we observed the opposite substitution bias for CODs in humans, turning coding sequences richer in AT. This is contrary to the codon bias of the human genome, which is GC-biased, suggesting possible models for chromosome-wide patterns of substitution that could alter the rate of translation and protein levels and patterns in the course of evolution.
The most intriguing observation of this analysis is that the selective constraint is independent of the genic environment of the CNGs. Neither divergence nor clustering of substitutions is correlated with distance from genes or size of intergenic regions. Moreover, there is no difference in divergence or clustering between intronic and intergenic CNGs, further supporting that notion. These data suggest that the position of CNGs is independent of currently known functional elements of the genome. Therefore, the evolutionary characteristics of a CNG are not influenced by how far or close it maps to a gene, or whether it is situated 5′ or 3′ or in an intron of a gene.
This observation raises interesting models regarding the potential function of CNGs in the human and other mammalian genomes. It has been suggested that some of the CNGs are likely regulatory regions (Hardison 2000; Pennacchio and Rubin 2001). Even though we still do not have a complete understanding of the position, function, and nature of cis-regulatory elements, the current models for their function should generate a dependence on the distance from the gene they are regulating. The pattern of independence from their genic environment make it less likely that the majority of CNGs are cis-regulatory elements.
One other possible model is their involvement as structural components of chromatin. The fact that they are not evenly distributed on the chromosome but have an inversely proportional density with genes shows that they are found wherever there is genomic “space”, and thus their main role cannot be only the structure of the chromatin. In addition, they are single-copy sequences in the human genome, which makes them unlikely to be evenly spaced repeated structural elements.
Another intriguing but speculative hypothesis is that CNGs participate in direct regulation of gene expression through interactions in trans (Muller and Schaffner 1990), in a manner similar to transvection in diptera (Duncan 2002). It is becoming evident that chromosomes occupy specific positions in the nucleus during the cell cycle of mammalian cells (Croft et al. 1999; Nielsen et al. 2002; Tanabe et al. 2002). It is therefore plausible that if two chromosomes are nearby in the nucleus of a given cell, an element on one chromosome could form a complex of proteins that directly interacts with the promoter of a gene on the other chromosome regulating its transcription, or interacts with another chromosomal region to direct the movement of chromosomes in the nucleus. Such interactions are in theory as likely to occur as known interactions in cis (Kleinjan and van Heyningen 1998; Spitz et al. 2003) between genomic regions that are as far as several hundreds of kilobases. Interestingly, such a model could partially explain the pathology of Down syndrome and other aneuploidies: The occurrence of a trisomy or monosomy of a genomic region contributes to the phenotype not only with the supernumerary or haploinsufficient genes, but also with a set of CNGs that are present in either three or one copy(ies). These CNGs could contribute to the dysregulation of a number of genes in the genome, many more than one can predict by simply focusing on the function and downstream regulation of genes in the trisomic or monosomic regions. This hypothesis is testable by abolishing (in cells or model organisms) the function of one or more CNGs in a genomic region and determining the expression of genes that are affected, and if the dysregulated genes are in trans or in cis.
What have we learned with the use of the dog genome as a third species in the analysis? It has been shown that the dog is closer in terms of nucleotide identity to the human than the mouse, so one could argue that we have more power to detect evolutionary conserved sequences with the mouse than with the dog. However, even lower amounts of divergence can be very useful. The first contribution of the dog genome is that it shows that the selected sequences based on the human–mouse comparison are also conserved in the dog, further supporting that they are selectively constrained. In addition, with the use of a third species we are able to root the direction of substitutions, which would have been impossible with two genomes only. See for example in Dermitzakis et al. (2003) how this becomes very useful when more than two genomes are added to tease apart the detailed patterns of selective constraint and detect interesting and useful properties. Finally, although the levels of conservation between human and dog are higher than those between human and mouse, they are still very useful when we examine their correlation with other characteristics of the genome (e.g., distance from genes or clustering) because there we are looking for relative patterns and dependencies and not simply absolute levels of conservation.
In conclusion, CNGs most likely constitute a new and heterogeneous class of functional genomic elements that are highly conserved and shared across multiple mammals. The function of some CNGs may be a local regulation of gene expression in cis; however, our results presented here favor the implication of CNGs in regulation and chromosomal interactions in a distance-independent (cis or trans) manner. From the extensive evolutionary analysis it is obvious that we need to entertain many alternative hypotheses to be tested with experimental strategies to elucidate the function of CNGs. The next challenge will be to design and interpret informative experiments to investigate the function of CNGs and assess their contribution to phenotypic variation within and between species and to complex and mendelian disorders.
METHODS
The Dog Genome Sequence
Sequence data, representing ∼1.5× coverage of the dog genome, was derived from 6.22 million sequencing reads. The end-sequencing of 2-kb and 10-kb clones was conducted under contract at Celera Genomics as described previously for human, and reads were assembled with Celera Assembler (Venter et al. 2001; Kirkness et al. 2003). The assembly output consisted of 1.09 million contigs (mean length, 1393 bases) and 0.85 million singletons.
To assess the quality of the 1.5× assembly, two comparisons were carried out.
1. Comparison of the 1.5× Data to a `Finished' BAC Sequence
The dog BAC clone, RP81-410C20, was sequenced independently by Eric Green and colleagues (115,479 bp; GenBank acc. AC144643). This sequence was repeat-masked, and used to identify 1.5× assemblies with at least 40 bases of identical sequence. Each assembly was then aligned end-to-end with the unmasked BAC sequence in order to quantify indels and mismatched bases.
Sixty-one assemblies aligned with 89,220 bp of unique BAC sequence. This proportion of the BAC sequence (77.3%) is close to the theoretical value for 1.5× coverage (77.6%). End-to-end alignment of each assembly with the BAC sequence revealed a total of 143 indels and 128 mismatched bases. Overall, there was 99.5% identity between the BAC sequence and the 1.5× assemblies. However, many indels are located within tandem repeats, and encompass multiple bases. If indels are ignored, there was 99.9% identity between the BAC sequence and the 1.5× data.
It should be noted that many of these indels and mismatches will represent genuine polymorphisms (the BAC library was derived from a Doberman, the 1.5× data from a poodle). For comparison, one might consider the variation (most of which is allelic variation) of two overlapping BACs from the same dog (AC114890, AC113573; each assembled after >9× coverage of >Q20 bases). The overlap of 94,162 bp contains a total of 103 indels and 271 mismatched bases.
2. Comparison of 1.5× Sequences With Boxer Shotgun Reads
For an independent analysis, we selected 100 of the 2661 dog sequences that were used for the human/mouse/dog alignments described. These were compared to shotgun reads from the NIH-funded dog (boxer) genome project that can be accessed via NCBI's Trace Archive. The analysis was restricted to 100 sequences because it was necessary to perform the searches manually using NCBI's BLAST server. However, the selected sequences were those with the lowest level of similarity to the human genome, and therefore most likely to contain misassemblies or erroneous base-calls.
All 2661 dog sequences were sorted by % identity to the human genome, and the 100 with the lowest values (60%–74%) were searched against all available whole-genome shotgun reads from the boxer genome. Each 1.5× sequence was aligned end-to-end with homologous boxer reads in order to quantify indels and mismatched bases.
For 98 of the 1.5× dog sequences, it was possible to identify one or more boxer reads that aligned from end-to-end. These 98 sequences had a combined length of 16,293 bp. The alignments revealed a total of 14 indels and 28 mismatched bases. Overall, there was 99.8 % identity between the 1.5× sequences and the boxer reads.
Again, it should be noted that many of these indels and mismatches will represent genuine polymorphisms between the poodle and boxer genomes. However, even if the error rate is as high as 0.2%, this would have a negligible effect on the analyses described herein.
Identification of Orthologous Dog Sequences
Previously described collections of 2262 CNGs (conserved nongenic sequences, unknown) and 1229 CODs (coding sequences, known) from human chromosome 21 (Dermitzakis et al. 2002) were searched against the complete collection of assembled dog sequences using BLASTN 2.0MP (http://blast.wustl.edu) with an E-value cutoff of 0.001. The best dog hit for each human sequence was then searched back against the repeat-masked human genome sequence (NCBI build 30, June 2002) using the same cutoff value. Only reciprocal best hits were considered further. For the set of 2262 CNGs, 1638 (73%) had a reciprocal best dog hit (E < 0.001), and 1406 (62%) satisfied additional criteria of at least 90% coverage, and at least 70% nucleotide identity. For the set of 1229 CODs, 976 (79%) had a reciprocal best dog hit (E < 0.001), and 749 (61%) satisfied additional criteria of at least 90% coverage, and at least 70% nucleotide identity. For each of the CNGs and CODs we performed an alignment with MultiPipMaker (Schwartz et al. 2003).
Annotation of CNGs and Exons on the Current Version of Human Chromosome 21
In order to obtain the relative distances of CNGs from genes we used the NCBI build 33 that contains 238 genes to obtain the position of genes on the chromosome. To obtain the position of CNGs we used BLAT at the UCSC browser (http://genome.ucsc.edu). We then overlaid the positions of CNGs and genes to assign intergenic or intronic position of CNGs and distance from the nearest gene obtained from Ensembl (www.ensembl.org) for the same version of the genome (Build 33). For each intergenic region the density along the region was calculated by computing the relative position of the CNG and scaling all intergenic regions to the size of 1.
Estimation of Number of Substitutions, Divergence, and Branch Lengths
To obtain estimates of divergence we used the estimate K80 (Kimura 1980). We assumed trichotomy of the three lineages of human, mouse, and dog and performed maximum likelihood analysis with PAML3 (Yang 1997) to derive direction of substitutions and levels of divergence in each branch (i.e., branch length). Estimates other than K80 were used, and the results were almost identical; therefore we chose to describe the simplest estimate with the lowest variance.
Periodicity
As described by Dermitzakis et al. (2002), we computed the distance between two consecutive variable sites in the alignment of the three species sequences.
Clustering
The metric of clustering was calculated as described by Dermitzakis et al. (2003).
Acknowledgments
We thank Roderic Guigo and Enrique Blanco for helpful comments and suggestions in the course of this study and for critically reading the manuscript. Support for this work was provided by the Swiss National Science Foundation, NCCR “Frontiers in Genetics,” ChildCare Foundation, European Union FP5 to S.E.A. and Lejeune foundation to A.R.
The publication costs of this article were defrayed in part by payment of page charges. This article must therefore be hereby marked “advertisement” in accordance with 18 USC section 1734 solely to indicate this fact.
Article and publication are at http://www.genome.org/cgi/doi/10.1101/gr.1934904. Article published online before print in April 2004.
Footnotes
[Supplemental material is available online at www.genome.org.]
References
- Alexandersson, M., Cawley, S., and Pachter, L. 2003. SLAM: Cross-species gene finding and alignment with a generalized pair Hidden Markov Model. Genome Res. 13: 496-502. [DOI] [PMC free article] [PubMed] [Google Scholar]
- Boffelli, D., McAuliffe, J., Ovcharenko, D., Lewis, K.D., Ovcharenko, I., Pachter, L., and Rubin, E.M. 2003. Phylogenetic shadowing of primate sequences to find functional regions of the human genome. Science 299: 1391-1394. [DOI] [PubMed] [Google Scholar]
- Croft, J.A., Bridger, J.M., Boyle, S., Perry, P., Teague, P., and Bickmore, W.A. 1999. Differences in the localization and morphology of chromosomes in the human nucleus. J. Cell Biol. 145: 1119-1131. [DOI] [PMC free article] [PubMed] [Google Scholar]
- Dermitzakis, E.T., Reymond, A., Lyle, R., Scamuffa, N., Ucla, C., Deutsch, S., Stevenson, B.J., Flegel, V., Bucher, P., Jongeneel, C.V., et al. 2002. Numerous potentially functional but nongenic conserved sequences on human chromosome 21. Nature 420: 578-582. [DOI] [PubMed] [Google Scholar]
- Dermitzakis, E.T., Reymond, A., Scamuffa, N., Ucla, C., Kirkness, E., Rossier, C., and Antonarakis, S.E. 2003. Evolutionary discrimination of mammalian conserved nongenic sequences (CNGs). Science 302: 1033-1035. [DOI] [PubMed] [Google Scholar]
- Dubchak, I., Brudno, M., Loots, G.G., Pachter, L., Mayor, C., Rubin, E.M., and Frazer, K.A. 2000. Active conservation of noncoding sequences revealed by three-way species comparisons. Genome Res. 10: 1304-1306. [DOI] [PMC free article] [PubMed] [Google Scholar]
- Duncan, I.W. 2002. Transvection effects in Drosophila. Annu. Rev. Genet. 36: 521-556. [DOI] [PubMed] [Google Scholar]
- Frazer, K.A., Sheehan, J.B., Stokowski, R.P., Chen, X., Hosseini, R., Cheng, J.F., Fodor, S.P., Cox, D.R., and Patil, N. 2001. Evolutionarily conserved sequences on human chromosome 21. Genome Res. 11: 1651-1659. [DOI] [PMC free article] [PubMed] [Google Scholar]
- Guigo, R., Dermitzakis, E.T., Agarwal, P., Ponting, C.P., Parra, G., Reymond, A., Abril, J.F., Keibler, E., Lyle, R., Ucla, C., et al. 2003. Comparison of mouse and human genomes followed by experimental verification yields an estimated 1,019 additional genes. Proc. Natl. Acad. Sci. 100: 1140-1145. [DOI] [PMC free article] [PubMed] [Google Scholar]
- Hardison, R.C. 2000. Conserved noncoding sequences are reliable guides to regulatory elements. Trends Genet. 16: 369-372. [DOI] [PubMed] [Google Scholar]
- Hardison, R.C., Oeltjen, J., and Miller, W. 1997. Long human–mouse sequence alignments reveal novel regulatory elements: A reason to sequence the mouse genome. Genome Res. 7: 959-966. [DOI] [PubMed] [Google Scholar]
- Iida, K. and Akashi, H. 2000. A test of translational selection at “silent” sites in the human genome: Base composition comparisons in alternatively spliced genes. Gene 261: 93-105. [DOI] [PubMed] [Google Scholar]
- Kimura, M. 1980. A simple method for estimating evolutionary rates of base substitutions through comparative studies of nucleotide sequences. J. Mol. Evol. 16: 111-120. [DOI] [PubMed] [Google Scholar]
- Kirkness, E.F., Bafna, V., Halpern, A.L., Levy, S., Remington, K., Rusch, D.B., Delcher, A.L., Pop, M., Wang, W., Fraser, C.M., et al. 2003. The dog genome: Survey sequencing and comparative analysis. Science 301: 1898-1903. [DOI] [PubMed] [Google Scholar]
- Kleinjan, D.J. and van Heyningen, V. 1998. Position effect in human genetic disease. Hum. Mol. Genet. 7: 1611-1618. [DOI] [PubMed] [Google Scholar]
- Lander, E.S., Linton, L.M., Birren, B., Nusbaum, C., Zody, M.C., Baldwin, J., Devon, K., Dewar, K., Doyle, M., FitzHugh, W., et al. 2001. Initial sequencing and analysis of the human genome. Nature 409: 860-921. [DOI] [PubMed] [Google Scholar]
- Loots, G.G., Locksley, R.M., Blankespoor, C.M., Wang, Z.E., Miller, W., Rubin, E.M., and Frazer, K.A. 2000. Identification of a coordinate regulator of interleukins 4, 13, and 5 by cross-species sequence comparisons. Science 288: 136-140. [DOI] [PubMed] [Google Scholar]
- Muller, H.P. and Schaffner, W. 1990. Transcriptional enhancers can act in trans. Trends Genet. 6: 300-304. [DOI] [PubMed] [Google Scholar]
- Nielsen, J.A., Hudson, L.D., and Armstrong, R.C. 2002. Nuclear organization in differentiating oligodendrocytes. J. Cell Sci. 115: 4071-4079. [DOI] [PubMed] [Google Scholar]
- O'Brien, S.J., Menotti-Raymond, M., Murphy, W.J., Nash, W.G., Wienberg, J., Stanyon, R., Copeland, N.G., Jenkins, N.A., Womack, J.E., and Marshall Graves, J.A. 1999. The promise of comparative genomics in mammals. Science 286: 458-462, 479-481. [DOI] [PubMed] [Google Scholar]
- Pennacchio, L.A. and Rubin, E.M. 2001. Genomic strategies to identify mammalian regulatory sequences. Nat. Rev. Genet. 2: 100-109. [DOI] [PubMed] [Google Scholar]
- Schwartz, S., Elnitski, L., Li, M., Weirauch, M., Riemer, C., Smit, A., Green, E.D., Hardison, R.C., and Miller, W. 2003. MultiPipMaker and supporting tools: Alignments and analysis of multiple genomic DNA sequences. Nucleic Acids Res. 31: 3518-3524. [DOI] [PMC free article] [PubMed] [Google Scholar]
- Sorek, R. and Ast, G. 2003. Intronic sequences flanking alternatively spliced exons are conserved between human and mouse. Genome Res. 13: 1631-1637. [DOI] [PMC free article] [PubMed] [Google Scholar]
- Spitz, F., Gonzalez, F., and Duboule, D. 2003. A global control region defines a chromosomal regulatory landscape containing the HoxD cluster. Cell 113: 405-417. [DOI] [PubMed] [Google Scholar]
- Stojanovic, N., Florea, L., Riemer, C., Gumucio, D., Slightom, J., Goodman, M., Miller, W., and Hardison, R. 1999. Comparison of five methods for finding conserved sequences in multiple alignments of gene regulatory regions. Nucleic Acids Res. 27: 3899-3910. [DOI] [PMC free article] [PubMed] [Google Scholar]
- Tanabe, H., Muller, S., Neusser, M., von Hase, J., Calcagno, E., Cremer, M., Solovei, I., Cremer, C., and Cremer, T. 2002. Evolutionary conservation of chromosome territory arrangements in cell nuclei from higher primates. Proc. Natl. Acad. Sci. 99: 4424-4429. [DOI] [PMC free article] [PubMed] [Google Scholar]
- Tang, H. and Lewontin, R.C. 1999. Locating regions of differential variability in DNA and protein sequences. Genetics 153: 485-495. [DOI] [PMC free article] [PubMed] [Google Scholar]
- Thomas, J.W., Touchman, J.W., Blakesley, R.W., Bouffard, G.G., Beckstrom-Sternberg, S.M., Margulies, E.H., Blanchette, M., Siepel, A.C., Thomas, P.J., McDowell, J.C., et al. 2003. Comparative analyses of multi-species sequences from targeted genomic regions. Nature 424: 788-793. [DOI] [PubMed] [Google Scholar]
- Ureta-Vidal, A., Ettwiller, L., and Birney, E. 2003. Comparative genomics: Genome-wide analysis in metazoan eukaryotes. Nat. Rev. Genet. 4: 251-262. [DOI] [PubMed] [Google Scholar]
- Venter, J.C., Adams, M.D., Myers, E.W., Li, P.W., Mural, R.J., Sutton, G.G., Smith, H.O., Yandell, M., Evans, C.A., Holt, R.A., et al. 2001. The sequence of the human genome. Science 291: 1304-1351. [DOI] [PubMed] [Google Scholar]
- Waterston, R.H., Lindblad-Toh, K., Birney, E., Rogers, J., Abril, J.F., Agarwal, P., Agarwala, R., Ainscough, R., Alexandersson, M., An, P., et al. 2002. Initial sequencing and comparative analysis of the mouse genome. Nature 420: 520-562. [DOI] [PubMed] [Google Scholar]
- Yang, Z. 1997. PAML: A program package for phylogenetic analysis by maximum likelihood. Comput. Appl. Biosci. 13: 555-556. [DOI] [PubMed] [Google Scholar]