

Abstract
We initially analyzed 11 families of low- and middle-copy-number long terminal repeat (LTR) retrotransposons in rice to determine how their structures have diverged from their predicted ancestral forms. These elements, many highly fragmented, were identified on the basis of sequence homology and structural characteristics. The 11 families, totaling 1000 elements, have copy numbers ranging from 1 to 278. Less than one-quarter of these elements are intact, whereas the remaining are solo LTRs and variously truncated fragments. We also analyzed two highly repetitive families (Osr8 and Osr30) of LTR retrotransposons and observed the same results. Our data indicate that unequal homologous recombination and illegitimate recombination are primarily responsible for LTR-retrotransposon removal. Further analysis suggests that most of the detectable LTR retrotransposons in rice inserted less than 8 million years ago, and have now lost over two-thirds of their encoded sequences. Hence, we predict that the half-life of LTR-retrotransposon sequences in rice is less than 6 million years. Moreover, our data demonstrate that at least 22% (97 Mb) of the current rice genome is comprised of LTR-retrotransposon sequences, and that more than 190 Mb of LTR-retrotransposon sequences have been deleted from the rice genome in the last 8 million years.
Genome sizes vary remarkably in plant species (Bennett and Leitch 1995). It has been suggested that rapid LTR-retrotransposon amplification plays a major evolutionary role in genome expansion (SanMiguel et al. 1996, 1998; Vicient et al. 1999; Shirasu et al. 2000; Meyers et al. 2001; Wicker et al. 2001; Fu and Dooner 2002). Even the relatively small Arabidopsis genome (about 130 Mb; The Arabidopsis Genome Initiative 2000) has experienced a high level of LTR-retrotransposon amplification in recent times (Devos et al. 2002). In fact, LTR retrotransposons in all plants analyzed appear to be relatively young, dating to less than 15 million years of age in all investigated cases (SanMiguel et al. 1998; Kumar and Bennetzen 1999; Devos et al. 2002). This is true despite diversity analyses indicating that these elements have been present in all plant lineages for hundreds of millions of years (for review, see Kumar and Bennetzen 1999). Hence, some process or processes must exist to remove retroelement DNA (Bennetzen 2002).
Several studies have uncovered cases of DNA loss in genic and nongenic regions of plant and other eukaryotic genomes (Petrov et al. 1996, 2000; Petrov and Hartl 1998; Tikhonov et al. 1999; Blanc et al. 2000; Ku et al. 2000; Bancroft 2001; Bensasson et al. 2001; Devos et al. 2002; Fu and Dooner 2002; Ramakrishna et al. 2002b; Song et al. 2002; Jiang et al. 2003; Wicker et al. 2003). Devos and colleagues, investigating LTR-retrotransposon structure in Arabidopsis, found that these elements were highly unstable in this plant species. Most of the instability was associated with small deletions that were the apparent result of illegitimate recombination (Devos et al. 2002) and similar results were obtained in wheat (Wicker et al. 2003). Petrov and colleague(s) studied rates and patterns of small deletions and insertions in non-LTR retroelements in different insect species, and found that an abundance of small deletions accounted for reductions in genome size over evolutionary time scales (Petrov et al. 1996, 2000; Petrov and Hartl 1998). A mechanism for these deletions was not identified, although the presence of flanking short repeats indicated that illegitimate recombination was the likely culprit (Devos et al. 2002). Whether this phenomenon affects more than just transposons has not been determined.
The nearly complete genomic sequence of rice (Feng et al. 2002; Sasaki et al. 2002; Rice Chromosome 10 Sequencing Consortium 2003; http://www.dna.affrc.jp/cgi-bin/statusdb/status.pl) provides an unprecedented opportunity to study genome evolution in this model crop species. LTR retrotransposons constitute a large fraction of transposable-element DNA in rice (Feng et al. 2002; Goff et al. 2002; Sasaki et al. 2002; Yu et al. 2002). Moreover, retroelements are relatively neutral sequence components within the genome (Petrov 2001). Hence, study of the nature and rates of change in LTR retrotransposons can provide insights into genome-wide mechanisms of sequence evolution. In this study, we present a comprehensive structural analysis of a representative sample of LTR retrotransposons identified in the genome of rice from variety Nipponbare (http://rgp.dna.affrc.go.jp/cgi-bin/statusdb/status.pl). Our data indicate that illegitimate recombination and unequal homologous recombination are the key processes that delete LTR-retrotransposon sequences, thereby competing with LTR-retrotransposon amplification as determinants of rice genome size.
RESULTS AND DISCUSSION
Strategy for Mining LTR Retrotransposons in Rice
LTR retrotransposons in plants are characterized by LTRs that vary in size from a few hundred basepairs to several kilobases, and are generally terminated by the dinucleotides 5′-TG...CA-3′ (Kumar and Bennetzen 1999). In this study, we randomly chose 28 rice BAC sequences from variety Nipponbare in GenBank and searched them for intact LTR retrotransposons. The identified retrotransposons were used, individually, to conduct BLASTN searches against rice genomic sequences in GenBank. In this initial effort, we identified eight LTR-retrotransposon families with low- and middle-copy numbers for further investigation. In addition, three more retrotransposon families with higher copy numbers that had been described earlier (Osr1, Osr14, and Osr41; McCarthy et al. 2002) were also analyzed in our study.
BLASTN searches against nonredundant (nr) and high-throughput genomic sequence (htgs) databases at GenBank were conducted to identify all of the elements in these 11 families, including all detectable fragments. We performed these searches in several steps. First, LTRs were used as queries to identify intact elements, solo LTRs, and truncated elements. Second, the sequences of intact retroelements were aligned to identify possible deletions and insertions in these elements, and then the internal regions of the most complete retroelements were extracted and used as queries to identify internal remnants. Third, the extended regions around matched sequences at expectation cut-off values of e-10 or less identified in the first two steps were used as queries to search against rice nr and htgs genomic sequence databases. Then, the new multiple alignments between each query sequence and all matches were established. This last step is necessary for identifying the boundaries of each element precisely and excluding fragments that cross-match elements belonging to different families. The structure of each element was finally determined on the basis of sequence homology of matched elements and structural characteristics of LTR retrotransposons, such as the presence of a primer binding site (PBS), a polypurine tract (PPT), and/or short target site duplications (TSDs) found at the site of integration. Because virtually all of the elements investigated differed by many sequence changes, differences due to errors in DNA sequence determination (<10-4 for all sequences analyzed) were miniscule compared with true mutations. In rare cases in which two elements exhibited identical or near-identical sequence, flanking sequences were used to determine whether these were actually different elements at different genomic locations.
Structural Characterization of LTR Retrotransposons in Rice
A total of 1000 elements and fragments belonging to 11 low- and middle-copy-number families, including six copia-like, three gypsy-like, and two unknown families, were identified in this study of the rice genome (Table 1). Copy numbers per family ranged from 1 to 278 per haploid genome. Because only 85% of the Nipponbare rice genome was available on BAC sequences at the time of this study (http://www.tigr.org/tdb/e2k1/osa1/BACmapping/description.shtml), we believe that copy numbers of these families could be substantially higher. Regardless, these 1000 elements provide a representative sample of low- and middle-copy-number families in rice.
Table 1.
LTR-Retrotransposon Families Investigated in This Study
| Familya | Sizeb(kb) | Type | Pre-existing name |
|---|---|---|---|
| Low- and middle-copy-number families | |||
| Family I | 5.8 | copia-like | Osr4 |
| Family II | 5.5 | copia-like | |
| Family III | 5.0 | gypsy-like | |
| Family IV | 7.1 | unknown | |
| Family V | 5.3 | copia-like | |
| Family VI | 18.0 | gypsy-like | Osr28 |
| Family VII | 11.7 | copia-like | |
| Family VIII | 10.0 | unknown | |
| Family IX | 4.7 | copia-like | Osr14 |
| Family X | 6.5 | copia-like | Osr1 |
| Family XI | 15.0 | gypsy-like | Osr41 |
| High-copy-number families | 9.2 | copia-like | Osr8 |
| 13.8 | gypsy-like | Osr30 |
Families I—VIII were randomly identified and selected, whereas other families were selected on the basis of McCarthy et al. 2002. Families II—V, VII and VIII were missed by McCarthy et al. 2002, accounting for 678 kb (22%) of the total 2991 kb of elements in the 11 low- and middle-copy-number families studied
Predicted size of full-length elements from assembled consensus sequence
To assess the structural variation in these LTR retrotransposons, we grouped the elements identified in this study into several different categories on the basis of their structural characteristics. An intact element is one that contains two relatively intact LTRs and identified PPT and PBS sites, and is also flanked by TSDs. Solo LTR refers to any relatively intact LTR flanked by TSDs. Elements having deletions at the 5′ or 3′ ends of LTRs are defined as truncated elements. These include elements with one partially deleted LTR, elements with one completely deleted LTR, elements with both LTRs partially deleted, and elements with one partially deleted LTR and another completely deleted. Other fragments only showing homologies with partial sequences of retrotransposons without any recognized structural feature are termed “remnants.” Internal remnants were not determined for the two largest families identified in this study because of their similarity to retrotransposons belonging to different families, and because many had been incompletely sequenced. The structural categories of LTR retrotransposons identified in this study are summarized in Table 2.
Table 2.
|
Number of elements in each class
|
Total
|
|||||||||||||
|---|---|---|---|---|---|---|---|---|---|---|---|---|---|---|
| Structuresa | Families | I | II | III | IV | V | VI | VII | VIII | IX | X | XI | No. | Percentage (%)b |
| Intact elements | 34 | 4 | 9 | 1 | 2 | 1 | 17 | 1 | 14 | 82 | 73 | 238 | 23.8 | |
| Intact elements without TSDs | 1 | 0 | 2 | 0 | 1 | 0 | 2 | 0 | 0 | 5 | 3 | 14 | 1.4 | |
| Solo LTRs | 7 | 0 | 42 | 0 | 0 | 7 | 46 | 5 | 103 | 80 | 58 | 348 | 34.8 | |
| Solo LTRs without TSDs | 1 | 0 | 7 | 0 | 0 | 0 | 7 | 1 | 9 | 12 | 5 | 42 | 4.2 | |
| One LTR partially deleted | 4 | 1 | 5 | 0 | 0 | 0 | 3 | 0 | 14 | 21 | 5 | 53 | 5.3 | |
| One LTR completely deleted | 4 | 0 | 13 | 0 | 1 | 0 | 18 | 1 | 8 | 16 | 46 | 107 | 10.7 | |
| Both LTRs partially deleted | 1 | 0 | 0 | 0 | 0 | 0 | 1 | 0 | 0 | 1 | 0 | 3 | 0.3 | |
| One LTR deleted, another partially deleted | 1 | 1 | 4 | 0 | 0 | 1 | 0 | 1 | 1 | 7 | 6 | 22 | 2.2 | |
| LTR remnants | 4 | 0 | 27 | 0 | 0 | 4 | 13 | 3 | 35 | 54 | 33 | 173 | 17.3 | |
| Total | 57 | 6 | 109 | 1 | 4 | 13 | 107 | 12 | 184 | 278 | 229 | 1000 | 100.0 | |
Does not include a small number of difficult-to-identify internal remnants or incompletely sequenced elements
Percentage of total elements in these families
Unequal Homologous Recombination
Of the 1000 elements that we initially investigated, 238 are intact, accounting for less than one-quarter of all elements identified, whereas 348 are solo LTRs. The ratio of intact elements to solo LTRs in rice is ∼2:3, lower than previously described in Arabidopsis (∼1:1; Devos et al. 2002). In maize, with a moderately large genome of ∼2400 Mb that is >60% LTR retrotransposons (SanMiguel et al. 1996; Meyers et al. 2001), intact retroelements outnumber solo LTRs by >5:1 in all investigated genomic regions (SanMiguel et al. 1996; Fu and Dooner 2002; Ramakrishna et al. 2002b). In barley, which has a genome about twofold larger than maize, the copy number of LTRs was reported to be 7- to 11-fold higher than the coding regions for the BARE-1 retrotransposon. These numerous LTRs were predicted to be the result of a high frequency of unequal intrastrand homologous recombination between the same or different elements (Vicient et al. 1999). However, subsequent genomic investigations of barley have not shown such a high frequency of solo LTRs (Dubcovsky et al. 2001; Ramakrishna et al. 2002a; Rostoks et al. 2002), suggesting that BARE-1 elements not derived from unequal homologous recombination are largely responsible for the high-LTR to internal-region ratio. Regardless, solo LTRs have been found in all investigated plant genomes (SanMiguel et al. 1996; Vicient et al. 1999; Dubcovsky et al. 2001; Devos et al. 2002; Fu and Dooner 2002; Vitte and Panaud 2003), so unequal homologous recombination (presumably intrastrand) is one common process that can slow genome expansion caused by the amplification of LTR retrotransposons in plants.
In addition to intact elements and solo LTRs with standard TSDs, 14 intact elements and 42 solo LTRs lacking flanking TSDs were identified. Although mutations of the flanking TSDs could slowly lead to their disappearance, it is more likely that these elements were derived from unequal homologous recombination between different elements of the same family. These events are more frequent in rice than in Arabidopsis, where they comprised <1% of investigated elements (Devos et al. 2002). Because solo LTRs are also more abundant in rice as a percentage of total elements, it appears that the ratio of unequal homologous recombination to illegitimate recombination is higher in rice than in Arabidopsis.
Illegitimate Recombination
In this first 1000 LTR-retrotransposons analyzed, 358 mildly or severely truncated elements were identified, including elements with partially deleted LTRs, elements with completely deleted LTRs, and severely deleted remnants (Table 1). Although we have not been able to consistently perform precise sequence-alignment analysis on the severely deleted elements, it appears that most have undergone multiple deletions. Moreover, small and/or large deletions were also found in the majority of intact elements and solo LTRs by further sequence-alignment analysis. Frequent deletions have also been found in LTR retrotransposon in other plant species, such as maize (Jin and Bennetzen 1989; Marillonnet and Wessler 1998; Ramakrishna et al. 2002b), wheat (Wicker et al. 2001, 2003), barley (Rostoks et al. 2002), and Arabidopsis (Devos et al. 2002), indicating that internal deletions are a common mechanism for elimination of LTR-retrotransposon DNA. To gain insights into mechanisms that may underlie deletion processes during genome evolution, we selected and carefully compared 20 relatively complete elements from each of three middle-copy-number families (Families I, X, and XI). These elements are all flanked by TSDs. The complete sequences of selected elements from each family were aligned using ClustalX (Thompson et al. 1997), and the breakpoints of identified deletions were further analyzed. We identified a total of 47, 9, and 15 deletions in aligned sequences in the three families, ranging in size from 10 to 3007 bp. These deletions appeared to be randomly distributed within LTRs and internal regions (data not shown). Indels smaller than 10 bp were not analyzed because their nature (i.e., insertion or deletion) and boundaries are more difficult to define. Deletions could be differentiated from insertions because they removed all or part of a known LTR-retrotransposon component (e.g., integrase coding potential or a PPT) from an element. Deletions that were shared by more than one element should represent a single event that occurred in a common ancestor, and thus, were counted only once. In a previous manuscript, Devos et al. (2002) demonstrated that most LTR-retrotransposon deletions in Arabidopsis were bounded by terminal duplications, a hallmark of illegitimate recombination. Of the 47, 9, and 15 deletions in this study, 41 (87.3%), 8 (88.9%), and 14 (93.4%), respectively, were flanked by short direct repeats (DRs) of 2–15 bp prior to the deletions (Fig. 1). Randomization tests on base composition in LTR retrotransposons and the distribution of sequences homologous to the short flanking repeats indicate that the short repeats are significantly associated with deletions in LTR retrotransposons (Table 3). These data suggest that illegitimate recombination mainly accounts for the numerous internal deletions found in LTR retrotransposons in rice. Although the precise mechanism of illegitimate recombination remains unknown in these cases, the association of deletions with flanking short repeats in rice, Arabidopsis (Devos et al. 2002), wheat (Wicker et al. 2003), yeast (Albertini et al. 1982; Asami et al. 2002), and insects (Petrov et al. 1996) suggests that illegitimate recombination is an important mechanism of DNA removal in many or all eukaryotic genomes.
Figure 1.
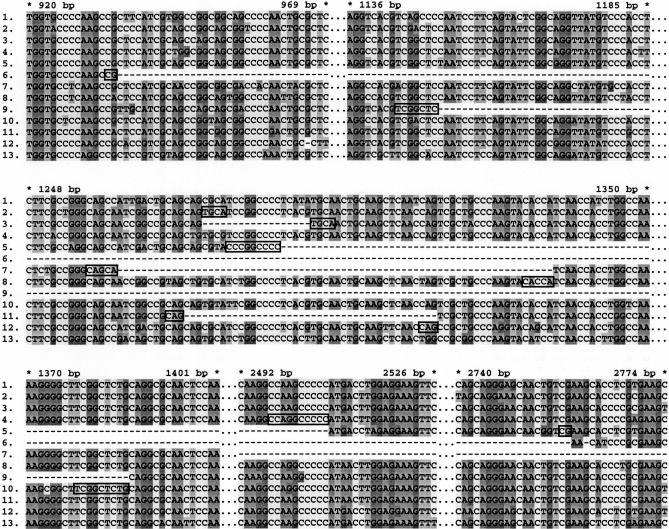
Nucleotide sequence alignments of an internal region of LTR retrotransposons from Family XI. The full-length sequences of relatively intact elements were aligned using ClustalX and then a 1.8-kb region was extracted from the original alignment and edited manually. Dashed lines indicate deletions; dotted lines indicate sequenced regions not shown in the figure (six more deletions in this region flanked by short repeats are not shown in this figure). Stars with nearby numbers show base pair (bp) positions of the consensus sequences of full-length elements. Flanking short repeats in the boundaries of deletions are framed. (1–13) Internal regions from 13 different elements.
Table 3.
Statistical Significance of the Association of Short Direct Repeats (DRs) With Deletions
|
No. of repeats in randomization test (Test 1)
|
No. of matching bases in randomization test (Test 2)
|
||||||||
|---|---|---|---|---|---|---|---|---|---|
| LTR Retrotransposon Family | No. of elements | No. of deletions | No. of deletions flanked by DRsa | Mean ± SD (max.) | P | No. of bases in repeats | No. of bases matching in 5′ and 3′ sequences | Mean ± SD (max.) | P |
| Family I (Osr4) | 20 | 15 | 14 | 0.44 ± 0.64 (4) | 6 × 10⁻¹⁰ | 54 | 51 | 14.9 ± 3.2 (26) | 4 × 10⁻⁹ |
| Family X (Osr1) | 20 | 9 | 8 | 0.35 ± 0.56 (3) | 1 × 10⁻⁷ | 38 | 38 | 10.2 ± 2.28 (19) | 7 × 10⁻⁷ |
| Family XI (Osr41) | 20 | 47 | 41 | 1.23 ± 1.09 (6) | 8 × 10⁻¹⁰ | 207 | 193 | 52.7 ± 6.2 (74) | 9 × 10-29 |
| Osr8 | 10 | 16 | 13 | 0.26 ± 0.47 (2) | 2 × 10-14 | 63 | 63 | 15.0 ± 4.0 (29) | 7 × 10⁻⁸ |
| Osr30 | 10 | 12 | 10 | 0.28 ± 0.50 (3) | 7 × 10-11 | 44 | 43 | 11.3 ± 3.7 (23) | 5 × 10⁻⁵ |
A short direct repeat (DR) was considered as starting from the deletion breakpoint and was extended if the bases in the 5′ and 3′ flanking sequences matched, or if a single-base mismatch was followed by at least two matching bases. The DR was considered as stopping where a mismatch was followed by zero or one matching base
DNA Loss Through Recombination
The original sizes of fully intact LTR retrotransposons for these 11 families were determined by intrafamily comparisons (Table 1). For the LTR-retrotransposons families that we analyzed, consensus analysis predicts that their total size at the time of integration was ∼9100 kb (Table 4). On the basis of the assumption addressed above that solo LTRs are the products of unequal intraelement recombination, and that solo LTRs and intact elements lacking TSDs are derived from interelement recombination, we estimated that a minimum of 3300 kb of DNA has been removed from 404 elements by unequal homologous recombination. This estimate does not include any potential loss of DNA sequence between flanking retroelements. Similarly, if each truncated element or severely deleted remnant was derived from a completely intact element, it is estimated that ∼2450 kb of DNA has been deleted from 358 elements (Table 4). Even in the intact elements that show canonical characteristics, such as two LTRs and PBS/PPT sites, deletions totaling ∼370 kb of DNA can be estimated from sequence alignments, averaging about 1.6 kb of DNA lost per element (Table 4). Altogether, ∼6 Mb of DNA sequence appears to have been removed from the 1000 low- and middle-copy-number LTR retrotransposons investigated in this study through unequal recombination and illegitimate recombination. These elements accounted for ∼9 Mb of genomic DNA at the time that they originally integrated into the rice genome. Thus, a total of about two-thirds of the DNA from these inserted LTR retrotransposons has been gradually removed from the rice genome. If at least two-thirds of LTR-retrotransposon sequences have been removed in the less than 8 million years since their insertion (see below), this suggests that the half-life of LTR-retrotransposon sequences in rice is less than 6 million years.
Table 4.
Structural Variation and Size Reduction in LTR Retrotransposons
|
Families I—XI
|
Osr8 and Osr30
|
||||||||
|---|---|---|---|---|---|---|---|---|---|
| Structure | No. of elements | Remaining size (kb) | Estimated original size (kb)a | Loss of DNA (kb) | No. of elementsb | Remaining size (kb) | Estimated original size (kb)a | Loss of DNA (kb) | Primary mechanism |
| Solo LTRS | 348 | 277 | 2852 | 2575 | 85 | 115 | 938 | 823 | Intra-element unequal recombination |
| Solo LTRs without TSDs | 42 | 37 | 635 | 598 | 9 | 16 | 212 | 196 | Inter-element unequal recombination |
| Intact elements without TSDs | 14 | 103 | 243 | 140 | 2 | 28 | 55 | 27 | Inter-element unequal recombination |
| Truncated elements | 358 | 745 | 3198 | 2453 | 87 | 272 | 1021 | 749 | Illegitimate recombination |
| Intact elements | 238 | 1829 | 2198 | 369 | 33 | 338 | 359 | 21 | Illegitimate recombination |
| Total | 1000 | 2991 | 9126 | 6135 | 216 | 769 | 2585 | 1816 | |
The original size of each element was estimated on the basis of the sizes of full-length and consensus elements identified in each family (Table 1)
A subset of Osr8 and Osr30 were randomly chosen
It is theoretically possible that the rates, mechanisms, and degrees of sequence instability in the analyzed 11 families would exhibit different properties than in the high-copy-number LTR retrotransposons of rice that we did not initially analyze. Hence, we decided to investigate these same characteristics for two highly repetitive elements, Osr8 (∼1100 copies) and Osr30 (∼1500 copies; McCarthy et al. 2002). We chose only a small, but representative sample of these elements for the identical analysis. As Tables 3, 4, and 5 demonstrate, these two highly repetitive families show the same degrees, types, and approximate ratios of sequence loss as in the 11 low- and middle-copy-number families. Hence, we believe that the same phenomena act on all LTR retrotransposons in rice, regardless of their copy number. One significant difference was observed, however, in that the loss of internal sequences from intract LTR retrotransposons was relatively low for these two higher-copy-number families. We have no explanation for this result, especially as illegitimate recombination does appear to be equally active in generating truncated fragments (Tables 4 and 5).
Table 5.
Structures of LTR Retrotransposons Identified in Two High-Copy-Number Families in Rice
|
Family
|
||||
|---|---|---|---|---|
|
Osr8
|
Osr30
|
|||
| Structuresa | No. | Percentage (%)b | No. | Percentage (%)b |
| Intact elements | 21 | 18.3 | 12 | 11.9 |
| Intact elements without TSDs | 0 | 0.0 | 2 | 2.0 |
| Solo LTRs | 51 | 44.3 | 34 | 33.7 |
| Solo LTRs without TSDs | 4 | 3.5 | 5 | 5.0 |
| One LTR partially deleted | 6 | 5.2 | 5 | 5.0 |
| One LTR completely deleted | 8 | 7.0 | 16 | 15.8 |
| Both LTRs partially deleted | 2 | 1.7 | 0 | 0.0 |
| One LTR deleted, another partially deleted | 2 | 1.7 | 5 | 5.0 |
| LTR remnants | 21 | 18.3 | 22 | 21.8 |
| Total | 115 | 100.0 | 101 | 100.0 |
Does not include a small number of difficult-to-identify internal remnants or incompletely sequenced elements
Percentage of total elements in this study
Preliminary annotations of the rice genome suggest that LTR retrotransposons comprise ∼7.4% of rice chromosome 4 (Feng et al. 2002). As numerous retroelements have not been identified yet, or have been inappropriately annotated, the fraction of LTR retrotransposons in the rice genome is likely to be an underestimate. A careful survey was conducted by McCarthy et al. (2002). Through scanning 29.8 Mb of rice sequence using LTR_STRUC, a data mining program, they identified 59 families of LTR retrotransposons, accounting for 17% of the rice genome. However, six of the 11 families (Families II, III, IV, V, VII, and VIII) that we identified in this study were missed by LTR_STRUC, accounting for 22.7% of all elements of these 11 families. Combining our results with the data obtained by McCarthy and colleagues, we estimate that at least 22% (97 Mb) of the rice genome (430 Mb) consists of LTR retrotransposons.
If one assumes that all LTR retrotransposons in rice are as unstable and largely deleted as the 13 families we have studied, then it can be estimated that at least 194 Mb of LTR-retrotransposon sequence has been removed from the rice genome through unequal homologous recombination and illegitimate recombination after these elements inserted. We should note that the elements that we identified do not include remnants of a few tens of base pairs with homology to LTR retrotransposons, because of our initial identification criteria, nor do we include any internal remnants and remnants showing high-level homology with LTR retrotransposons belonging to different families. Thus, it is likely that the actual amount of LTR-retrotransposon DNA eliminated through unequal recombination and illegitimate recombination is far greater than we have estimated.
The frequent appearance of highly truncated elements suggests that frequent deletions occur in regions other than those containing LTR retrotransposons. In fact, deletions have been detected in non-LTR retroelements (Petrov et al. 1996; Petrov and Hartl 1998) and class II transposons (Masson et al. 1987; Jiang et al. 2003), suggesting that numerous small deletions serve as a major process that removes many classes of repetitive DNA.
Deletion Frequency Is Related to the Ages of LTR Retrotransposons
As described previously by SanMiguel et al. (1998), the degree of LTR sequence identity can be used to estimate the time of integration of LTR retrotransposons. This dating strategy is based on the fact that the two LTRs of a single LTR retrotransposon are usually identical at the nucleotide sequence level upon integration. By applying the average synonymous substitution rate of 6.5 × 10⁻⁹ mutations per site per year determined for the adh1 and adh2 genes in grasses (Gaut et al. 1996), we have calculated the integration times of the 261 LTR retrotransposons from the initial 11 families with two partly or fully intact LTRs. Our data show that 246 (95.4%) of these elements integrated into the rice genome within the last 5 million years, and only 12 elements were dated to 5–12 million years (Fig. 2). Although partially deleted LTRs were also found in a few elements younger than 1 million years, all of the elements older than 7 million years were found to contain partially deleted LTRs (Figs. 2 and 3), indicating that deletions by illegitimate recombination accumulate progressively over evolutionary time.
Figure 2.

Distribution of ages of LTR retrotransposons in rice. Open bars show intact elements. Gray bars show elements with partially deleted LTRs. (mys) Million years.
Figure 3.

Compositions and average ages of six middle-copy-number LTR-retrotransposon families. The average age of an individual family refers to the average age of elements with relatively intact LTRs. (mys) Million years.
We found that the percentage of LTR-retrotransposon structural types (solo LTRs, truncated elements, and intact elements) in six middle-copy-number families correlated with the average age of each family (estimated on the basis of ages of intact elements). As we expected, the younger families usually contain a higher percentage of intact elements and a lower percentage of truncated elements and solo LTRs, whereas older families contain a higher percentage of truncated elements and solo LTRs and a lower percentage of intact elements (Fig. 3). This result supports our model that the highly deleted elements are older than intact elements, and that extensive deletions in LTR retrotransposons will lead to their eventual disappearance as identifiable entities in the rice genome. In fact, because large deletions that allow removal of one or more complete elements could not be detected by our analysis, it is possible that DNA loss is significantly more comprehensive and rapid than we are able to certify.
In an attempt to further understand the dynamics of elimination of LTR retrotransposons in the rice genome, we performed phylogenetic analysis of LTR retrotransposons within Family III, a middle-copy-number family composed of very high percentages of solo LTRs and truncated elements (Table 2). The relatively complete LTR sequences extracted from intact elements, solo LTRs, and truncated elements were aligned using ClustalX, and the alignments were manually edited. Subsequently, a Neighbor-Joining phylogenetic tree was generated using MEGA (Fig. 4). The phylogenetic tree exhibited very low bootstrap values between branches, indicating the high level of nucleotide sequence identity between different elements within the whole family. Although retrotransposon remnants are not included in this phylogenetic analysis, randomly checked remnants also show high-sequence similarity (∼90%) to the homologous regions of intact elements and/or solo LTRs of this family (data not shown), suggesting that most elements of this family were probably derived from a major amplification event that occurred within a relatively narrow period. The overall mean pairwise nucleotide divergence distance is 0.105 ± 0.008. The average pairwise nucleotide identity across the complete sequence of elements that are very closely related at the phylogenetic level has been used previously to estimate insertion times of retrotransposons (Kapitonov and Jurka 1996; Costas and Naveria 2000; Bowen and McDonald 2001). Using this dating method, we estimate that the average age of LTR retrotransposons of Family III is ∼8 million years. As this family has a relatively high percentage of solo LTRs and truncated elements compared with other families analyzed in this study, we predict that most of the retrotransposon DNA elimination that we detected in the rice genome has occurred within the past 8 million years.
Figure 4.

Neighbor-Joining phylogenetic tree of an LTR-retrotransposon family based on LTR sequences. LTR sequences were extracted from intact elements, solo LTRs, and truncated elements of Family III, and are indicated by filled squares, filled circles, and triangles, respectively. Numbers adjacent to nodes indicate bootstrap support from 500 replicates. The nucleotide sequence divergence scale is indicated.
In a recent article, Vitte and Panaud (2003) also used a phenetic analysis to show that three rice gypsy-like elements had amplified primarily within the last 5 million years, and had subsequently accumulated a majority of solo LTRs. Our results support many of the conclusions drawn by Vitte and Panaud (2003), although we did not detect any particular bursts of LTR-retrotransposon activity. Our data indicate that different families were primarily active in fairly broad temporal windows, and that the median times of activity varied broadly from 1 million years to more than 4 million years.
Comparative sequence analyses reveal rapid genome variations in plants (Bennetzen 2001). These variations are mainly due to dramatic changes of repetitive DNA. Even between closely related species, such as maize and sorghum or wheat and barley that diverged from common ancestors ∼16.5 (Gaut and Doebley 1997) and 10–14 million years ago (Wolfe et al. 1989; Ramakrishna et al. 2002a), respectively, detectably conserved sequences of transposable elements in colinear regions are exceedingly rare (Ramakrishna et al. 2002a). Our prediction of an LTR-retrotransposon half-life in rice of less than 6 million years is in full agreement with this observation. This is especially true because we have taken the most conservative assumptions in all aspects of our calculation. The substitution rate for adh1 and adh2 in the grasses (6.5 × 10⁻⁹ substitutions per synonymous site per year) is probably at least twofold slower than the actual rate for LTR retrotransposons (as discussed in SanMiguel et al. 1998), and we also used a minimal estimate of LTR-retrotransposon sequence loss. Hence, it is likely that the half-life of LTR-retrotransposon sequences in rice is on the order of 2–4 million years. Genomic sequence comparison between haplotypes in two rice subspecies, indica and japonica, that diverged only ∼1 million years ago or less, also reveals extensive rearrangements involving insertions and deletions of transposable elements (Feng et al. 2002; Han and Xue 2003). These observations fully support the recent and rapid genome evolution model that is illustrated in this study.
METHODS
Data Mining and Characterization of LTR Retrotransposons
Information was mined from the genomic sequence of rice cultivar Nipponbare, generated by the International Rice Genome Sequencing Project (IRGSP). All of the genomic sequences deposited in GenBank by August 21, 2002, accounting for ∼85% of the rice genome, were screened to identify LTR retrotransposons. The programs Repeat and Gap, from the Wisconsin Package Version 10.1, Genetics Computer Group (GCG), were used for the initial identification and alignment of LTRs in 28 randomly selected BACs from Nipponbare (GenBank Accession nos: AC074054, AC093955, AC108763, AC118980, AC120987, AC123515, AC99399, AL074054, AL606459, AL662938, AL662950, AL663001, AL713941, AL713954, AL732380, AP002539, AP002820, AP003618, AP003755, AP003763, AP003866, AP004093, AP004634, AP004708, AP004733, AP004851, AP005475, AP005521). The selection of these BACs was completely random, and our subsequent in silico analysis of their locations on the physical and genetic maps indicated random dispersal across the sequenced portion of the rice genome (data not shown).
Each BAC was screened for putative LTR retrotransposons by a manual search for the presence of a terminal TG/CA inverted repeat in the LTRs, a PBS, a PPT, and a TSD. This analysis found eight confirmed elements and these were used, individually, as query sequences in BLASTN searches against the rice nonredundant (nr) and high-throughput genomic sequence (htgs) databases. We also investigated three previously described families (Osr1, Osr14, and Osr41) with middle-copy numbers. Finally, we chose Osr8 and Osr30 as representative of highly repetitive LTR retrotransposons. The structures of LTR retrotransposons were finally determined on the basis of sequence homology of matched elements and structural characteristics of LTR retrotransposons. Elements were not analyzed if they were incompletely sequenced because of their location at the end of a BAC or because of an unfinished sequence analysis.
Families of LTR retrotransposons were defined by two criteria. First, members of a family needed to share polypurine tract (PPT) and primer-binding site (PBS) sequences. Second, the members of a family were expected to have a high degree of internal DNA sequence homology. This homology was arbitrarily set at an expect value of e-10 or less.
Because LTR retrotransposons are highly conserved in structure across species, we can often tell an insertion from a deletion by simple structural criteria. Insertions add sequences that are not usually seen in an element, whereas deletions remove part or all of a standard component of an LTR retrotransposon. In practice, this is not as simple as it sounds, especially for small indels (insertions or deletions). However, by aligning all members of a particular family, a consensus intact element can be generated (and was for each of the elements investigated in this study). Insertions or deletions are then clear as specific derivations from this consensus.
Sequence Alignments and Editing
To investigate the breakpoints of deletions, the complete sequences of selected LTR retrotransposons were aligned using ClustalX (Thompson et al. 1997). The sequence alignments were edited manually using JalView (M. Clamp, EBI). To date, LTR-retrotransposon insertion times, LTR sequences were aligned using ClustalX. The alignments were edited manually if needed.
Insertion Time Estimations
The insertion times of LTR retrotransposons with both LTRs were determined in a manner similar to that used by SanMiguel et al. (1998). MEGA (Kumar et al. 2001) was used to calculate the number of transition and transversion mutations. Insertion dates were estimated using the Kimura two-parameter method (Kimura 1980), and a mutation rate of 6.5 × 10⁻⁹ substitutions per synonymous site per year, based on the adh1 and adh2 loci of grasses (Gaut et al. 1996). For Family III, the mean pairwise divergence of LTR sequences of intact elements, solo LTRs, and truncated elements were calculated using MEGA, and was subsequently converted into average age by the method described above.
Statistical Analysis
Statistical analysis of the association of deletions with short flanking direct repeats was performed as described earlier (Devos et al. 2002).
Acknowledgments
We thank Dr. James K.M. Brown, John Innes Centre, Norwich, England, for providing us with a calculating spreadsheet for statistical analysis, and three anonymous reviewers for their valuable comments. We also thank the National Science Foundation for supporting this research (Grant 9975793).
The publication costs of this article were defrayed in part by payment of page charges. This article must therefore be hereby marked “advertisement” in accordance with 18 USC section 1734 solely to indicate this fact.
Article and publication are at http://www.genome.org/cgi/doi/10.1101/gr.1466204. Article published online before print in April 2004.
References
- Albertini, A.M., Hofer, M., Calos, M.P., and Miller, J.H. 1982. On the formation of spontaneous deletions: The importance of short sequence homologies in the generation of large deletions. Cell 29: 319-328. [DOI] [PubMed] [Google Scholar]
- The Arabidopsis Genome Initiative. 2000. Analysis of the genome sequence of the flowering plant Arabidopsis thaliana. Nature 408: 796-815. [DOI] [PubMed] [Google Scholar]
- Asami, Y., Jia, D.W., Tatebayashi, K., Yamagata, K., Tanokura, M., and Ikeda, H. 2002. Effect of the DNA topoisomerase II inhibitor VP-16 on illegitimate recombination in yeast chromosomes. Gene 291: 251-257. [DOI] [PubMed] [Google Scholar]
- Bancroft, I. 2001. Duplicate and diverge: The evolution of plant genome microstructure. Trends Genet. 17: 89-93. [DOI] [PubMed] [Google Scholar]
- Blanc, G., Barakat, A., Guyot, R., Cooke, R., and Delseny, M. 2000. Extensive duplication and reshuffling in the Arabidopsis thaliana genome. Plant Cell 12: 1093-1101. [DOI] [PMC free article] [PubMed] [Google Scholar]
- Bennett, M.D. and Leitch, I.J. 1995. Nuclear DNA amounts in Angiosperms. Ann. Bot. 76: 113-176. [Google Scholar]
- Bennetzen, J.L. 2001. Comparative sequence analysis of plant nuclear genomes: Microcolinearity and its many exceptions. Plant Cell 12: 1021-1029. [DOI] [PMC free article] [PubMed] [Google Scholar]
- ———. 2002. Mechanisms and rates of genome expansion and contraction in flowering plants. Genetica 115: 29-36. [DOI] [PubMed] [Google Scholar]
- Bensasson, D., Petrov, D.A., Zhang, D.X., Hartl, D.L., and Hewitt, G.M. 2001. Genomic gigantism: DNA loss is slow in mountain grasshoppers. Mol. Biol. Evol. 18: 246-253. [DOI] [PubMed] [Google Scholar]
- Bowen, N.J. and McDonald, J.F. 2001. Drosophila euchromatic LTR retrotransposons are much younger than the host species in which they reside. Genome Res. 11: 1527-1540. [DOI] [PMC free article] [PubMed] [Google Scholar]
- Costas, J. and Naveira, H. 2000. Evolutionary history of the human endogenous retrovirus family ERV9. Mol. Biol. Evol. 17: 320-330. [DOI] [PubMed] [Google Scholar]
- Dubcovsky, J., Ramakrishna, W., SanMiguel, P.J., Busso, C.S., Yan, L., Shiloff, B.A., and Bennetzen, J.L. 2001. Comparative sequence analysis of colinear barley and rice bacterial artificial chromosomes. Plant Physiol. 125: 1342-1353. [DOI] [PMC free article] [PubMed] [Google Scholar]
- Devos, K.M., Brown, J.K., and Bennetzen, J.L. 2002. Genome size reduction through illegitimate recombination counteracts genome expansion in Arabidopsis. Genome Res. 12: 1075-1079. [DOI] [PMC free article] [PubMed] [Google Scholar]
- Feng, Q., Zhang, Y., Hao, P., Wang, S., Fu, G., Huang, Y., Li, Y., Zhu, J., Liu, Y., Hu, X., et al. 2002. Sequence and analysis of rice chromosome 4. Nature 420: 316-320. [DOI] [PubMed] [Google Scholar]
- Fu, H. and Dooner, H.K. 2002. Intraspecific violation of genetic colinearity and its implications in maize. Proc. Natl. Acad. Sci. 99: 9573-9578. [DOI] [PMC free article] [PubMed] [Google Scholar]
- Gaut, B.S. and Doebley, J.F. 1997. DNA sequence evidence for the segmental allotetraploid origin of maize. Proc. Natl. Acad. Sci. 94: 6809-6814. [DOI] [PMC free article] [PubMed] [Google Scholar]
- Gaut, B.S., Morton, B.R., McCaig, B.C., and Clegg, M.T. 1996. Substitution rate comparisons between grasses and palms: Synonymous rate differences at the nuclear gene Adh parallel rate differences at the plastid gene rbcL. Proc. Natl. Acad. Sci. 93: 10274-10279. [DOI] [PMC free article] [PubMed] [Google Scholar]
- Goff, S.A., Ricke, D., Lan, T.H., Presting, G., Wang, R., Dunn, M., Glazebrook, J., Sessions, A., Oeller, P., Varma, H., et al. 2002. A draft sequence of the rice genome (Oryza sativa L. ssp. japonica). Science 296: 92-100. [DOI] [PubMed] [Google Scholar]
- Han, B. and Xue, Y. 2003. Genome-wide intraspecific DNA-sequence variations in rice. Curr. Opin. Plant Biol. 6: 134-138. [DOI] [PubMed] [Google Scholar]
- Jiang, N., Bao, Z., Zhang, X., Hirochika, H., Eddy, S.R., McCouch, S.R., and Wessler, S.R. 2003. An active DNA transposon family in rice. Nature 421: 163-167. [DOI] [PubMed] [Google Scholar]
- Jin, Y.-K. and Bennetzen, J.L. 1989. Structure and coding properties of Bs1, a maize retrovirus-like transposon. Proc. Natl. Acad. Sci. 93: 7783-7788. [DOI] [PMC free article] [PubMed] [Google Scholar]
- Kapitonov, V. and Jurka, J. 1996. The age of Alu subfamily. J. Mol. Evol. 42: 59-65. [DOI] [PubMed] [Google Scholar]
- Kimura, M. 1980. A simple method for estimating evolutionary rate of base substitutions through comparative studies of nucleotide sequences. J. Mol. Evol. 16: 111-120. [DOI] [PubMed] [Google Scholar]
- Ku, H.M., Vision, T., Liu, J.P., and Tanksley, S.D. 2000. Comparing sequenced segments of the tomato and Arabidopsis genomes: Large-scale duplication followed by selective gene loss creates a network of synteny. Proc. Natl. Acad. Sci. 97: 9121-9126. [DOI] [PMC free article] [PubMed] [Google Scholar]
- Kumar, A. and Bennetzen, J.B. 1999. Plant retrotransposons. Annu. Rev. Genet. 33: 479-532. [DOI] [PubMed] [Google Scholar]
- Kumar, S., Tamura, K., Jakobsen, I.B., and Nei, M. 2001. MEGA2: Molecular evolutionary genetics analysis software. Bioinformatics 17: 1244-1245. [DOI] [PubMed] [Google Scholar]
- Marillonnet, S. and Wessler, S.R. 1998. Extreme structural heterogeneity among the members of a maize retrotransposon family. Genetics 150: 1245-1256. [DOI] [PMC free article] [PubMed] [Google Scholar]
- Masson, P., Surosky, R., Kingsbury, J.A., and Fedoroff, N.V. 1987. Genetics and molecular analysis of the Spm-dependent a-m2 alleles of the maize a locus. Genetics 117: 117-137. [DOI] [PMC free article] [PubMed] [Google Scholar]
- McCarthy, E.M., Liu, J., Lizhi, G., and McDonald, J.F. 2002. Long terminal repeat retrotransposons of Oryza sativa. Genome Biol. 3: Research0053.1–Research0053.11. [DOI] [PMC free article] [PubMed]
- Meyers, B.C., Tingey, S.V., and Morgante, M. 2001. Abundance, distribution and transcriptional activity of repetitive elements in the maize genome. Genome Res. 11: 1660-1676. [DOI] [PMC free article] [PubMed] [Google Scholar]
- Petrov, D.A. 2001. Evolution of genome size: New approaches to an old problem. Trends Genet. 17: 23-28. [DOI] [PubMed] [Google Scholar]
- Petrov, D.A. and Hartl, D.L. 1998. High rate of DNA loss in the Drosophila melanogaster and Drosophila virilis species groups. Mol. Biol. Evol. 15: 293-302. [DOI] [PubMed] [Google Scholar]
- Petrov, D.A., Lozovskaya, E.R., and Hartl, D.L. 1996. High intrinsic rate of DNA loss in Drosophila. Nature 384: 346-349. [DOI] [PubMed] [Google Scholar]
- Petrov, D.A., Sangster, T.A., Johnston, J.S., Hartl, D.L., and Shaw, K.L. 2000. Evidence for DNA loss as a determinant of genome size. Science 287: 1060-1062. [DOI] [PubMed] [Google Scholar]
- Ramakrishna, W., Dubcovsky, J., Park, Y.J., Busso, C., Emberton, J., SanMiguel, P., and Bennetzen, J.L. 2002a. Different types and rates of genome evolution detected by comparative sequence analysis of orthologous segments from four cereal genomes. Genetics 162: 1389-1400. [DOI] [PMC free article] [PubMed] [Google Scholar]
- Ramakrishna, W., Emberton, J., SanMiguel, P., Ogden, M., Llaca, V., Messing, J., and Bennetzen, J.L. 2002b. Comparative sequence analysis of the sorghum rph region and the maize rp1 resistance gene complex. Plant Physiol. 130: 1728-1738. [DOI] [PMC free article] [PubMed] [Google Scholar]
- Rice Chromosome 10 Sequencing Consortium 2003. In-depth view of structure, activity, and evolution of rice chromosome 10. Science 300: 1566-1569. [DOI] [PubMed] [Google Scholar]
- Rostoks, N., Park, Y.-J., Ramakrishna, W., Ma, J., Druka, A., Shiloff, B.A., SanMiguel, P.L., Jiang, Z., Brueggeman, R., Sandhu, D., et al., 2002. Genomic sequencing reveals gene content, genomic organization, and recombination relationships in barley. Funct. Integr. Genomics 2: 51-59. [DOI] [PubMed] [Google Scholar]
- SanMiguel, P., Tikhonov, A., Jin, Y.-K., Motchoulskaia, N., Zakharov, D., Melake Berhan, A., Springer, P.S., Edwards, K.J., Avramova, Z., and Bennetzen, J.L. 1996. Nested retrotransposons in the intergenic regions of the maize genome. Science 274: 765-768. [DOI] [PubMed] [Google Scholar]
- SanMiguel, P., Gaut, B.S., Tikhonov, A., Nakajima, Y., and Bennetzen, J.L. 1998. The paleontology of intergene retrotransposons of maize. Nat. Genet. 20: 43-45. [DOI] [PubMed] [Google Scholar]
- Sasaki, T., Matsumoto, T., Yamamoto, K., Sakata, K., Baba, T., Katayose, Y., Wu, J., Niimura, Y., Cheng, Z., Nagamura, Y., et al. 2002. The genome sequence and structure of rice chromosome 1. Nature 420: 312-316. [DOI] [PubMed] [Google Scholar]
- Shirasu, K., Schulman, A.H., Lahaye, T., and Schulze-Lefert, P. 2000. A contiguous 66-kb barley DNA sequence provides evidence for reversible genome expansion. Genome Res. 10: 908-915. [DOI] [PMC free article] [PubMed] [Google Scholar]
- Song, R., Llaca, V., and Messing, J. 2002. Mosaic organization of orthologous sequences in grass genomes. Genome Res. 12: 1549-1555. [DOI] [PMC free article] [PubMed] [Google Scholar]
- Thompson, J.D., Gibson, T.J., Plewniak, F., Jeanmougin, F., and Higgins, D.G. 1997. The CLUSTAL_X windows interface: Flexible strategies for multiple sequence alignment aided by quality analysis tools. Nucleic Acids Res. 25: 4876-4882. [DOI] [PMC free article] [PubMed] [Google Scholar]
- Tikhonov, A.P., SanMiguel, P.J., Nakajima, Y., Gorenstein, N.M., Bennetzen, J.L., and Avramova, Z. 1999. Colinearity and its exceptions in orthologous adh regions of maize and sorghum. Proc. Natl. Acad. Sci. 96: 7409-7414. [DOI] [PMC free article] [PubMed] [Google Scholar]
- Vicient, C.M., Suoniemi, A., Anamthawat-Jónsson, K., Tanskanen, J., Beharav, A., Nevo, E., and Schulman, A.H. 1999. Retrotransposon BARE-1 and its role in genome evolution in the genus Hordeum. Plant Cell 11: 1769-1784. [DOI] [PMC free article] [PubMed] [Google Scholar]
- Vitte, C. and Panaud, O. 2003. Formation of solo-LTRs through unequal homologous recombination counterbalances amplifications of LTR retrotransposons in rice Oryza sativa L. Mol. Biol. Evol. 20: 528-540. [DOI] [PubMed] [Google Scholar]
- Wicker, T., Stein, N., Albar, L., Feuillet, C., Schlagenhauf, E., and Keller, B. 2001. Analysis of a contiguous 211 kb sequence in diploid wheat (Triticum monococcum L.) reveals multiple mechanisms of genome evolution. Plant J. 26: 307-316. [DOI] [PubMed] [Google Scholar]
- Wicker, T., Yahiaoui, N., Guyot, R., Schlagenhauf, E., Liu, Z.D., Dubcovsky, J., and Keller, B. 2003. Rapid genome divergence at orthologous low molecular weight glutenin loci of the A and Am genomes of wheat. Plant Cell 15: 1186-1197. [DOI] [PMC free article] [PubMed] [Google Scholar]
- Wolfe, K.H., Gouy, M., Yang, Y.-W., Sharp, P.M., and Li, W.H. 1989. Date of the monocot-dicot divergence estimated from chloroplast DNA sequence data. Proc. Natl. Acad. Sci. 86: 6201-6205. [DOI] [PMC free article] [PubMed] [Google Scholar]
- Yu, J., Hu, S., Wang, J., Wong, G.K., Li, S., Liu, B., Deng, Y., Dai, L., Zhou, Y., Zhang, X., et al. 2002. A draft sequence of the rice genome (Oryza sativa L. ssp. indica). Science 296: 79-92. [DOI] [PubMed] [Google Scholar]
WEB SITE REFERENCES
- http://www.tigr.org/tdb/e2k1/osa1/BACmapping/description.shtml; Status of the International Rice Genome Sequencing Project.
- http://rgp.dna.affrc.go.jp/cgi-bin/statusdb/status.pl; Rice Genome Sequencing Resource.