

Abstract
Accumulating evidence indicates that ovarian high-grade serous carcinoma (HGSC) originates from Fallopian tube secretory epithelial cells (FTSECs). However, the molecular mechanisms underlying the initiation and progression of HGSC derived from FTSECs remains unclear. In the present study, we found that the Hippo/YAP signaling pathway plays a critical role in the initiation and progression of Fallopian tube and ovarian HGSC. Importantly, YAP was overexpressed in inflammatory and cancerous Fallopian tube tissues. Further, overexpression of wild-type YAP, or constitutively active YAP in immortalized FTSECs, induced cell proliferation, migration, colony formation, and tumorigenesis. Moreover, the Hippo/YAP and the fibroblast growth factor (FGF) signaling pathways formed an autocrine/paracrine positive feedback loop to drive the progression of the FTSECs-derived HGSC. Evidence in this study strongly suggests that combined therapy with inhibitors of YAP (such as verteporfin) and FGFRs (such as BGJ398) can provide a novel therapeutic strategy to treat Fallopian tube and ovarian HGSC.
Ovarian cancer is the most lethal gynecological cancer. Globally, approximately 225,500 women are diagnosed with ovarian cancer annually, with an estimated 140,200 associated deaths worldwide1. The majority (~80%) of ovarian cancers are of epithelial origin. A key feature of high-grade serous carcinoma (HGSC), which constitutes 60–80% of ovarian epithelial carcinomas, is its aggressive nature and its unique genetic alterations2, 3. Patients with HGSC most frequently present at advanced clinical stages and have a very poor overall survival.
The etiology of ovarian HGSC is unclear. Previous studies suggest that HGSC is derived from the neoplastic transformation of ovarian surface epithelial (OSE) cells in the cortical inclusion cysts of the ovary4, 5. However, the existence of a precursor lesion in the ovary that leads to HGSC has not been demonstrated conclusively6, 7. Studies using ovarian and Fallopian tube specimens from prophylactic salpingo-oophorectomy of BRCA1/2-mutation carriers suggest that most ovarian HGSC originate in the fimbrial end of the Fallopian tube8, 9. Recent studies indicate that ovarian HGSC, primary peritoneal carcinoma (PPC), and Fallopian tube cancer have similar pathogenesis and may originate from the same cell source, the Fallopian tube epithelial cells (FTSECs)10. Epidemiological studies also support the concept that ovarian, Fallopian tube, and primary peritoneal cancers have a common etiology11. Obviously, the conventional pathologic classification of many other pelvic serous cancers primarily as ovarian cancer contributes to underreporting the incidence of the Fallopian tube cancer because, in many cases, Fallopian tube cancers are also present on the surface of the ovary. The involvement of ovary in conventional ovarian HGSC is potentially a secondary event. Therefore, studies on the mechanisms underlying the initiation and progression of Fallopian tube HGSC represent a new and promising direction for the diagnosis and treatment of ovarian cancer.
The etiology of the Fallopian tube cancer is also unknown. Recent studies suggest that disruption of the Hippo pathway is an important oncogenic event during tumorigenesis in many cancers12, 13. First discovered in Drosophila14,15, the Hippo pathway is a growth control pathway that is highly conserved throughout species16. Accumulating evidence indicates that the Hippo pathway has a fundamental role in organ size control, stem cell function, and tumor suppression. Hence, the Hippo pathway has attracted growing interest12, 13, 16. Activation of the Hippo pathway suppresses the activity of the transcriptional co-activator Yes-associated protein 1 (YAP1, commonly referred to as YAP) by phosphorylating YAP and subsequently retaining it in the cytoplasm. YAP has been identified as an ovarian cancer oncogene17,18. Our research also indicates that YAP contributes to ovarian cancer progression19,20. Although several very recent studies indicate the importance of FTSECs in the tumorigenesis of the Fallopian and ovarian HGSC11–14,21,22, the extent to which the Hippo pathway is involved in their initiation and progression has not been examined.
In addition to limited information on the etiology, the molecular mechanism underlying the rapid progression of Fallopian tube and ovarian HGSCs is also unclear. Interestingly, previous studies have shown that cultured human FTSECs produce basic fibroblast growth factors (FGF2)23. FGF2, a growth regulatory peptide secreted from cells, is reported to be involved in a variety of biological processes including cell differentiation, cell growth, migration, angiogenesis, and tumor formation24. Most importantly, several Phase I and Phase II clinical trials for a pan FGF receptor inhibitor, BGJ39825, are currently underway to examine the role of this novel small molecule in the treatment of several solid tumors (http://clinicaltrials.gov/ct2/results?term=BGJ398&Search=Search). However, it is not known whether FGF2 secreted by FTSECs contribute to the tumorigenic process of Fallopian tube and ovarian HGSC. Whether the Hippo/YAP signaling pathway interacts with the FGF/FGFR signaling pathway to regulate the rapid progression of Fallopian tube and ovarian HGSC has not been investigated.
In turn, the present study aims to determine if the Hippo/YAP signaling pathway is involved in initiation and progression of Fallopian tube-derived HGSC and the potential signaling mechanism(s) underlying the Hippo/YAP pathway regulation of HGSC initiation and progression.
RESULTS
Expression of YAP in normal and cancerous human Fallopian tube tissues
Immunohistochemical analysis of normal and cancerous Fallopian tube tissues showed that the YAP immunosignal in normal Fallopian tube tissues was very low (Fig. 1a, 1b, Supplementary Fig. 1). In the normal fallopian tube tissues, the YAP immunosignal was localized to both cytoplasm and nucleus of some epithelial cells (Supplementary Fig. 1). However, the YAP immunosignal was significantly increased in inflammatory (chronic tube inflammation) and cancerous tissues (Fig. 1a, 1b, Supplementary Fig. 1). Also, the immunosignal was mainly localized to nuclei of almost all epithelial cells of these abnormal tissues (Supplementary Fig. 1). The immunosignal positivity and intensity in the cancerous tissues significantly increased compared to that of normal and inflammatory tissues (Fig. 1a, 1b. P < 0.001). Further, the YAP immunosignal positivity and intensity in the inflammatory tissues were also significantly increased compared to normal tissues (Fig. 1a, 1b. P < 0.05).
Figure 1. Expression of YAP protein and alterations of YAP-associated genes in Fallopian tube cancer (FTC) and ovarian high grade serous carcinoma (HGSC).

a) Quantitative data showing YAP immunosignal positivity (percentage of the YAP positive cell number relative to the total cell number) in normal, inflammatory (chronic tube inflammation, Inflam) and cancerous (tumor) Fallopian tube tissues determined by immunohistochemistry. b) Quantitative data showing YAP immunosignal intensity in normal, inflammatory (Inflam) and cancerous Fallopian tube tissues determined by immunohistochemistry. Each bar represents the mean ± SEM (n=5 for Normal, n=10 for Inflam, n=10 for tumor. *: P < 0.05, ***: P < 0.001. c) Quantitative data showing YAP immunosignal positivity in the ovarian normal tissues and ovarian HGSC. d) Quantitative data showing YAP immunosignal intensity in the ovarian normal tissues and ovarian HGSC. CTRL: normal ovarian tissues used as control; HGSC: ovarian high grade serous carcinoma tissues. Each bar represents the mean ± SEM (n=42 for CTRL, n=105 for HGSC). ***: P < 0.001. e) Alterations of YAP gene across the gynecological cancers. The cross cancer YAP gene alteration analyses was performed using online datasets and data mining tools (the cBioPortal for Cancer Genomics and the datasets from the TCGA research Network). f) Alterations of YAP, LATS1 and TEAD genes in the ovarian high grade serous carcinoma. Data sources and analysis tools are the same as in e). g) Correlation between overall survival and YAP/TEAD expression in the ovarian HGSC. Data were extracted from the TCGA datasets using the cBioPortal and uploaded to the GraphPad Prism 5 for statistical analysis. Total: Correlation between YAP/TEAD levels and overall survival in all ovarian HGSC cases (n=418); YAP/TEAD down: Correlation between YAP/TEAD expression levels and the overall survival in 19 cases of ovarian HGSC in which YAP/TEAD expression levels are lower and are out of the default Z score thresholds.
Expression and Alteration of YAP gene in the ovarian HGSC
Since most ovarian HGSCs are believed to originate from Fallopian tube HGSC, we detected the expression of YAP protein in ovarian HGSC with a human tissue microarray. Our results also indicate that both the positivity (Fig. 1c) and intensity (Fig. 1d) of YAP immunosignal in the ovarian HGSCs (n=105) are significantly higher than in the normal ovarian tissues (n=42) (P<0.001). Moreover, The YAP immunosignal was present mainly in the nuclei of the ovarian HGSC cancer cells (Supplementary Fig. 2). To further confirm the importance of YAP in the ovarian HGSC, we performed multidimensional genomic data analysis using online cancer databases and analysis tools [The Cancer Genomic Atlas (TCGA) and the cBioPortal for Cancer Genomics]26, 27. Mining these databases revealed that the YAP gene is frequently amplified in ovarian HGSC (7.9% amplification vs. 0.7% deletion, n=279) (Fig. 1e, 1f, Supplementary table 1)28,29. Cervical cancer has the highest YAP gene alteration across all gynecological cancers (Fig. 1e), which is consistent with our recent finding (He et al, EMBO Molecular Medicine, in press). LATS1 is a core component of the Hippo/YAP signaling cascade and a major negative regulator of YAP activity, while TEAD is the major mediator of YAP activity13, 16. In examined ovarian HGSC patient samples, LATS1 gene is greatly down-regulated, whereas YAP and TEADs are up-regulated (Fig. 1f), confirming our hypothesis that the Hippo/YAP pathway plays critical roles in the progression of ovarian HGSC. In the ovarian HGSC samples, although YAP/TEAD expression and survival rates are not significantly correlated [Total (n=418) Vs. YAP/TEAD-down (n=19), P = 0.1003], the result indicated a trend that down-regulation of YAP gene was associated with a higher overall survival rate (Fig. 1g).
Establishment and characterization of YAP-overexpressing FTSEC cell lines
The five non-tumorigenic FTSEC cell lines used in this study were characterized previously30, 31. As expected, Western blot analysis showed that all FTSEC cell lines retained expression of Müllerian (PAX8) and epithelial (Cytokeratin-7) lineage markers (Supplementary Fig. 3a). Further, Western blot results indicated that these cell lines have differential expression and phosphorylation of YAP protein (Supplementary Fig. 3a). Both total and phosphorylated YAP levels in FT194, FT237, and FT240 cells were higher than that in FT190 and FT246 cells. Because the TP53 protein was inactivated by SV40 large T antigen in FT190 and FT194 cells and was knocked down in FT237, FT240, and FT246 cells30, it is difficult to estimate the association between YAP expression and TP53 protein levels. To examine the role of YAP in the proliferation of FTSECs, we established six cell lines with differential levels of expression and activation of YAP protein based on FT194 (with virus-inactivated TP53) and FT246 (with TP53 knockdown) cell lines. Fluorescent immunohistochemical analyses indicated that YAP expression levels in FT194-YAP, FT246-YAP, FT194-YAPS127A, and FT246-YAPS127A cells dramatically increased compared to FT194-MXIV and FT246-MXIV control cells (Fig. 2a). Importantly, YAP was primarily localized in the nuclei of FT194-YAPS127A and FT246-YAPS127A cells (Fig. 2a). Overexpression of YAP also induced a significant change in the morphology of FTSECs. YAP and YAPS127A overexpressing cells are elongated and develop a spindle-shaped morphology (Fig. 2a, Supplementary Fig. 4). Consistent with the immunofluorescence results, Western blot results showed that FT194-YAP and FT246-YAP cells, which were transfected with vectors expressing wild-type YAP, had significantly increased levels of YAP and phosphorylated YAP (Fig. 2b, Supplementary Fig. 3b, 3c). FT194-YAPS127A and FT246-YAPS127A cells, which were transfected with mutated YAP (constitutive activation mutation), however, have high levels of YAP protein and very low levels of phosphorylated YAP due to the mutation of YAP at serine 127.
Figure 2. Effect of YAP protein levels on the proliferation of FTSECs.

a) Fluorescent immunocytochemistry determining the expression and localization of YAP protein (green) in FT246-MXIV, FT246-YAP and FT246-YAPS127A and FT194-MXIV, FT194-YAP and FT194-YAPS127A cell lines. Nuclei were stained with DAPI (blue). Scale bar = 50μm. b) Overexpression of wild type YAP or constitutively active YAP on the proliferation of FT246 cells. Left panel: Western blot detection of levels of YAP and phosphorylated YAP in FT246-MXIV, FT246-YAP and FT246-YAPS127A cell lines. Right panel: growth curves of FT246-MXIV, FT246-YAP and FT246-YAPS127A cell lines. ***: P < 0.001 compared to MXIV control. c) Top: protein levels of YAP and phosphorylated YAP (ser127) in FT246 cells with or without knockdown of YAP with YAP siRNA (siYAP). SiGlo: Non-targeting siRNA used as a control. Bottom: effect of YAP knockdown on the proliferation of FT246 cells. ***: P < 0.001 compared to siGlo control. d) Effect of knockdown of YAP on the proliferation of FT194 cells. ***: P < 0.001 compared to siGlo control.
YAP promotes growth and induces transformation of FTSEC cells in vitro
Consistent with the differential expression and cellular distributions of YAP protein in established stable cell lines, proliferation of these cells varied significantly. For example, FT194-MXIV and FT246-MXIV cells grew slowly, and their growth was inhibited when cells reach confluence (Fig. 2b, Supplementary Fig. 3c). However, FT194-YAP, FT246-YAP, FT194-YAPS127A and FT246-YAPS127A cells continued to grow after they reached confluence. Also, FT194-YAPS127A and FT246-YAPS127A had significantly increased growth rates compared to corresponding wild-type YAP transfected cells (FT194-YAP and FT246-YAP) (Fig. 2b, Supplementary Fig. 3b). In agreement with these observations, knockdown of YAP in FT194 and FT246 cells significantly suppressed their proliferation (Fig. 2c, 2d). The growth-promoting effect of YAP in FTSECs was also confirmed by the MTT assay (supplementary Fig. 5a, 5b). The pro-proliferation activity of YAP in FTSECs was further indicated by its action on the progression of cell cycle. Ectopic expression of wild-type YAP or constitutively active YAP in FT194 and FT246 cell lines promoted cell cycle progression, as indicated by significant increases in the proportion of cells in S and G2/M phase and decreases in cells in the G1 phase (Supplementary Fig. 6a,6c). These results were further confirmed by increases in the cyclin A, cyclin B and cyclin D in YAP and YAPS127A overexpressing FT194 and FT246 cell lines compared to their corresponding control cell lines (MXIV transfected cells) (Supplementary Fig. 6b,6d). Consistent with these observations, siRNA knockdown of YAP with YAP siRNA significantly reduced the proportion of cells in the S and G2/M phase and increased the proportion of cells in G1 phase (Supplementary Fig. 7).
It has been shown that the immortalized FTSECs, like primary Fallopian tube cells, demonstrate regular contact inhibition during growth30. The continued growth of FT194-YAP, FT246-YAP, FT194-YAPS127A and FT246-YAPS127A cells after reaching confluence suggests that these cells are transformed following YAP overexpression. Soft agar assays showed that FT194-MXIV and FT246-MXIV cells did not form colonies in soft agar (Fig. 3a, 3b). However, FT194-YAP, FT246-YAP, FT194-YAPS127A and FT246-YAPS127A cells formed colonies in soft agar (Fig. 3). FT194-YAPS127A and FT246-YAPS127A cells formed a greater number of and larger colonies compared to FT194-YAP and FT246-YAP cells, respectively (Fig. 3a, 3b). A fluorescence-based cell transformation assay (CytoSelect™ 96-Well Cell Transformation Assay kit, Cell Biolabs, Inc. San Diego, CA) was also used to confirm the quantitative data. These results indicate that overexpression of wild-type YAP or constitutive active YAP in FT194 and FT246 cells stimulates colony formation, which is indicated by a significant increase (P <0.001) in the relative fluorescence units (RFU) in FT194-YAP, FT246-YAP, FT194-YAPS127A and FT246-YAPS127A cells (Fig. 3).
Figure 3. YAP is able to transform immortalized FTSECs.

a) Top panel: Soft agar assay showing colony formation in FT246-MXIV, FT246-YAP and FT246-YAPS127A cells. Scale bar = 500 μm. Lower panel: quantitative analysis of colony formation in FT246-MXIV, FT246-YAP and FT246-YAPS127A cells. Left: colony numbers in FT246-MXIV, FT246-YAP and FT246-YAPS127A cells. Colonies with more than fifty cells were considered viable and counted. Right: fluorescence-based quantitative soft agar assay showing the relative colony numbers in FT246-MXIV, FT246-YAP, and FT246-YAPS127A cells. b) Soft agar assay showing colony formation in FT194-MXIV, FT194-YAP, and FT194-YAPS127A cells. Scale bar = 500 μm. Lower panels are quantitative data of regular soft agar assays and the fluorescence-based soft agar assays. Each bar represents mean ± SEM of five assays. ***: P < 0.001 compared to MXIV control.
YAP-transformed FTSECs forms tumor in vivo
The colony formation assays suggest that YAP is sufficient to transform immortalized FTSECs in vitro. In turn, we then examined if YAP-transformed cells are tumorigenic. FT194-MXIV, FT194-YAP and FT194-YAPS127A cells (6 × 10⁶ cells/group) were injected SC into five-week-old female athymic nude mice. Tumors were observed in FT194-YAP and FT194-YAPS127A injected mice three weeks after injection. Consistent with colony formation data, no tumors were observed in the FT194-MXIV cell injected group (Fig. 4a, 4b). Tumors derived from FT194-YAPS127A cells grew very rapidly. Tumors derived from FT194-YAP cells grew relatively slowly within the 10-week period (Fig. 4c, 4d).
Figure 4. Tumorigenic effect of YAP in FTSECs.
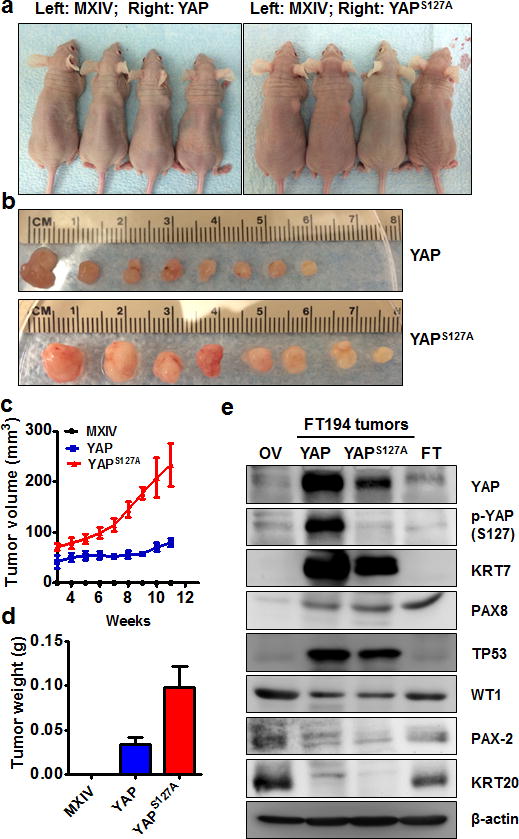
a) Representative images showing tumor formation in the athymic nude mice injected with FT194-YAP and FT194-YAPS127A cells. FT194-MXIV control cells were injected on the left side and did not form tumor. b) Tumors derived from FT194-YAP and FT194-YAPS127A cells. c) Growth curves of tumors-derived from FT194-YAP and FT194-YAPS127A cells. d) Weights of tumors derived from FT194-YAP and FT194-YAPS127A cells. e) Western blot analysis showing biomarkers expressed in tumors derived from FT194-YAP and FT194-YAPS127A cells. Tumors-derived from FT194-YAP and FT194-YAPS127A cells express high levels of cytokeratin-7 (KRT7), PAX8, TP53 and WT1, but very low cytokeratin 20 (KRT20) and PAX2. Same amount of proteins from normal human ovarian (OV) and fallopian tube (FT) tissues were used as control.
Morphologically, tumors derived from the FT194-YAP and FT194-YAPS127A cells resembled HGSC, possessing tumor cells that are generally intermediate to large in size, with prominent nucleoli visible at low magnification (Fig. 5a). The nuclei are distinctly pleomorphic, showing more than a three-fold variation in size. Likewise, these cells are extremely proliferative, which is indicated by the high expression of Ki67 and frequent appearance of mitotic figures (Fig. 5a)32. Except for the high levels of YAP protein, these tumor tissues have very high levels of nuclear stained of TP53, PAX8 and WT1 (Fig. 5a, 4e), which are characteristic of both FTSECs and the vast majority of HGSCs, but not OSE-derived tumor or low grade serous carcinomas33–35. Both biochemical and immunohistochemical analysis show that tumor cells in these tissues express very high levels of cytokeratin 7, but are negative for cytokeratin 20 and PAX2 (Fig. 5a, 4e). Tumor tissues derived from FT194-YAP cells are negative for Alcian blue (PH2.5)-Periodic acid Schiff (AB-PAS) staining (Fig. 5b). These findings further confirm pathological diagnoses that these tumors are HGSC36, 37.
Figure 5. YAP induces Fallopian tube high grade serous carcinoma.

a) Histology and molecular features of tumors-derived from FT194-YAPS127A cells. H-E: Representative image showing histology of FT194-YAPS127A tumors tissues stained with hematoxylin-eosin. Ki67: representative image showing expression of Ki67 protein in FT194-YAPS127A tumor tissues analyzed by immunohistochemistry. FT194-YAPS127A tumors also express high level of cytokeratin 7 (KRT7), nuclear TP53, PAX8 and WT1, but not cytokeratin 20 (KRT20) and PAX2. Scale bar: 20μm. b) Representative images showing that tumor tissues derived from FT194-YAP cells are negative for the Alcian blue PH2.5-Periodic acid (AB-PAS) staining. Left: colorectal epithelium was used as a positive control for AB-PAS staining. Right: tumor tissues derived from FT194-YAP cells were AB-PAS negatively stained. Scale bar: 25μm.
YAP stimulates migration of FTSECs in vitro
Wound healing assays show that, compared to the controls, overexpression of wild-type YAP or constitutively active YAP significantly enhances wound closure in FT246 (Supplementary Fig. 8) and FT194 cells (Supplementary Fig. 9). Transwell migration assay also indicate that ectopic expression of wild-type YAP or constitutively active YAP significantly increases the number of cells migrated through the chamber membrane in both FT246 (Supplementary Fig. 8) and FT194 cells (Supplementary Fig. 9).
YAP overexpression up-regulates FGF ligands and FGFRs in FTSECs
Previous reports show that isolated FTSECs can secret acidic (FGF1) and basic fibroblast growth factors (FGF2)23. FGF1 and FGF2, which are the most abundant FGF ligands in ovarian cancer cell lines38, and all FGFRs (FGFR1, FGFR2, FGFR3 and FGFR4) were expressed in five immortalized human Fallopian tube cell lines (Supplementary Fig. 10). Of considerable interest, we found that overexpression of wild-type YAP or constitutively active YAP in FT194 and FT246 cells significantly increased mRNA levels of FGF1, FGF2 and all four FGFRs (Fig. 6a, Supplementary Fig. 11–12). Importantly, overexpression of wild-type YAP or constitutive active YAP in FT194 cells significantly increased protein levels of FGF2 (Fig. 6b) and FGF1 (Fig. 6c) in culture medium and on-dish cell lysates. Intriguingly, treatment of these cells with verteporfin39, a YAP antagonist, eliminated YAP- or YAPS127A-induced production of FGF1 and FGF2 (Fig. 6b, 6c). Overexpression of wild-type YAP or constitutively active YAP in FT194 and FT246 cells also significantly increased the expression of the amphiregulin (AREG) (Fig 6a, Supplementary Fig. 11–12), which is a known downstream gene of the Hippo/YAP pathway40.
Figure 6. YAP stimulates expression FGF and FGFR and secretion of basic and acidic FGFs.
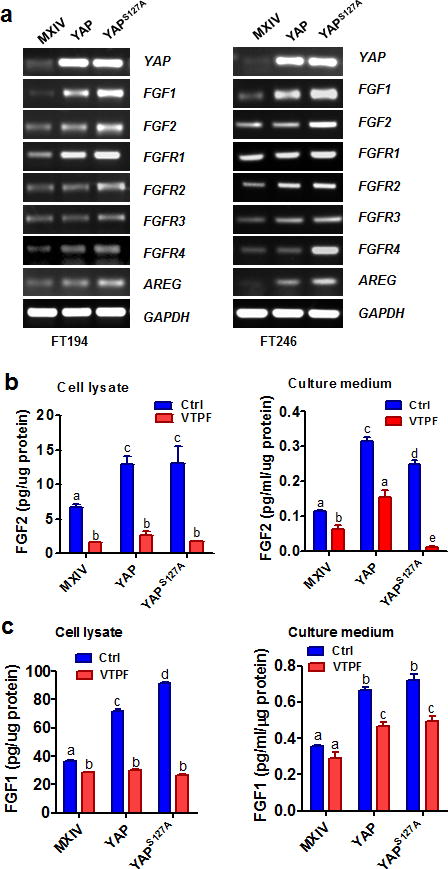
a) Determining the mRNA expression of YAP, FGF ligands (FGF1&FGF2) and FGFR1-4 in FT194-MXIV, FT194-YAP, and FT194-YAPS127A cells (Left panel), and FT246-MXIV, FT246-YAP and FT246-YAPS127A cells (right panels) by RT-PCR. AREG was used as a positive control. GAPDH was used as a loading control. b) Verteporfin (VTPF) suppresses YAP–induced production of basic FGF (FGF2). Left panel: FGF2 levels in the cell lysate of FT194-MXIV, FT194-YAP and FT194-YAPS127A cells in the absence or presence of 5μM of VTPF. Right panel: FGF2 levels in the culture medium of FT194-MXIV, FT194-YAP, and FT194-YAPS127A cells in the absence or presence of 5μM of VTPF. c) Verteporfin (VTPF) suppresses YAP–induced production acidic FGF (FGF1). Left penal: FGF1 levels in the cell lysate of FT194-MXIV, FT194-YAP, and FT194-YAPS127A cells in the absence or presence of 5μM of VTPF. Right panel: FGF1 levels in the culture medium of FT194-MXIV, FT194-YAP and FT194-YAPS127A cells in the absence or presence of 5μM of VTPF. Each bar represents the mean ± SEM of at least three independent experiments. Bars with different letters are significantly different from each other (P < 0.05).
FGF2 induces proliferation and migration of FTSECs
To determine the role of FGF1/2 in FTSECs, FT194 and FT246 cells were treated with different concentrations of recombinant human FGF1 and FGF2 (10 to 100 ng/ml) for 72h. FGF1/2 treatment significantly increased proliferation of FT194 and FT246 cells at a concentration of 10 ng/ml (Fig. 7a, 7b). Since FGF2 has been reported to be secreted by FTSECs23 and the biological activity of FGF2 is not significantly dependent on heparin, in the following experiments, we used FGF2 as a primary ligand in the study. The maximal pro-proliferative effect of FGF2 was observed at 10–20 ng/ml in both FT194 and FT246 cells. Flow cytometry results showed that FGF2 (20 ng/ml) treatment promoted cell-cycle progression in FT194 and FT246 cells, as indicated by a significant decrease in the portion of cells in G1 phase and significant increase in cells in S and G2/M phases (P<0.05, Supplementary Fig. 13). Additionally, wound healing assays showed that FGF2 treatment (20 ng/ml, 15h) significantly induced wound closure in FT246 (Fig. 7c) and FT194 cells (Fig. 7d), suggesting that FGF2 also induces FTSECs migration.
Figure 7. FGF stimulates the proliferation and migration of FTSECs.

a) Proliferation of FT194 (left panel) and FT246 (right panel) cells incubated in medium containing 1% FBS in the absence (0) or presence of 10 ng/ml, 20 ng/ml, 50 ng/ml or 100 ng/ml basic FGF (FGF2) for 3 days. S: seeding cell number. Each bar represents the mean ± SEM of three repeats. Bars with different letters are significantly different from each other (P < 0.05). b) Proliferation of FT194 (left panel) and FT246 (right panel) cells incubated in medium containing 1% FBS in the absence (0) or presence of 10 ng/ml, 20 ng/ml, 50 ng/ml or 100 ng/ml acidic FGF (FGF1) for 3 days. S: seeding cell number. Each bar represents the mean ± SEM of three repeats. Bars with different letters are significantly different from each other (P < 0.05). c) Left panel: representative images showing the effect of FGF2 (20 ng/ml, 15h) on the wound closure of FT194 cells. Right panel: quantitative data showing percentage of wound closure in FT194 cells in the absence or presence of 20 ng/ml FGF2. d) Left panel: representative images showing the effect of FGF treatment (FGF2, 20 ng/ml, 15h) on the wound closure of FT246 cells; right panel: quantitative data showing percentage of wound closure in FT246 cells in the presence or absence of 20 ng/ml FGF2. Each bar represents means ± SEM of three independent experiments. *** P < 0.001 compared to the control (Ctrl).
YAP is required for FGF regulating proliferation and migration of FTSECs
To determine if YAP plays a role in FGF2 stimulated proliferation of FTSEC, we knocked down YAP protein in FT194 and FT246 cells using YAP siRNAs and then treated these cells with FGF2. Results showed that FGF2 failed to promote the proliferation of FT194 and FT246 cells after knockdown of YAP (Fig. 8a). Flow cytometry results showed that knockdown of YAP completely blocked FGF-promoted cell cycle progression in both FT194 (Supplementary Fig. 14a) and FT246 cells (Supplementary Fig. 14b). Knockdown of YAP not only blocked FGF2-induced cell proliferation, but also reduced basal growth of FT194 and FT246 cells, suggesting that YAP was required for the survival of Fallopian tube secretory epithelial cells (Fig. 8a). Additionally, we found that knockdown of YAP in FTSEC cells diminished FGF2-stimulated cell migration, as indicated by the significant decrease in the wound closure in YAP-knockdown FT194 and FT246 cells after FGF2 treatment (Fig. 8b, supplementary Fig. 15). Interestingly, FGF2 treatment (10 ng/ml, 48h) induced amphiregulin (AREG) mRNA expression in both FT194 and FT246 cells, but had no effect on YAP mRNA expression. Knockdown of YAP completely blocked FGF2-induced AREG mRNA expression in both FT246 and FT194 cells (Fig. 8c). These results clearly indicate that YAP protein is required for FGF to regulate FTSEC cell proliferation, migration and gene expression. Intriguingly, we found that FGF2 was able to stimulate FGF1, FGF2 mRNA expression in cultured FTSECs, indicating that FGF2 might regulate the immortalized FTSECs in an autocrine and/or paracrine manner (Fig. 8d, Supplementary Fig. 16). Knockdown of YAP blocked FGF2-induced expression of FGF1/2, suggesting that the proper interaction between the Hippo/YAP and FGF/FGFR signaling pathways are also required for the maintenance of the autocrine/paracrine regulation of FTSECs by the FGF/FGFR system (Fig. 8d, Supplementary Fig. 16).
Figure 8. YAP is required for FGF regulating proliferation and migration of FTSECs.

a) Knockdown of YAP protein with YAP siRNA (siYAP) in FT194 (left panel) and FT246 (right panel) cells eliminate FGF-induced cell proliferation. Each bar represents the mean ± SEM of three independent experiments. Bars with different letters are significantly different from each other (P<0.001). b) Representative images showing that knockdown of YAP with YAP siRNA blocked FGF-induced wound closure in FT194 (left) and FT246 (right) cells. Scale bar = 200μm. quantitative results showing the percentage of wound closure in the wound healing assays in FT194 and FT246 cells was presented in supplementary figure 15. c) RT-PCR results showing that knockdown of YAP with YAP siRNA (siYAP) blocks FGF2-induced expression of AREG mRNA in both FT194 (left panel) and FT246 (right panel) cells. FGF treatments had no effect on YAP and GAPDH mRNA expression. GAPDH was used as an internal control. d) FGF2 stimulates mRNA expression of basic and acidic FGFs in FTSECs. FT246 cells were transfected with non-targeting siRNA (siGLO) or YAP siRNA (siYAP) before treatment with or without FGF2 (10 ng/ml) for 48h. YAP, FGF1 and FGF2 mRNA was detected with RT-PCR. FGF2 stimulates FGF1 and FGF2 mRNA expression, but has no effect on YAP and GAPDH mRNA expression. GAPDH was used as an internal control.
The Hippo pathway is involved in YAP regulation of FTSEC cell activities
The production of FGF ligands and FGFRs in FTSEC cells suggests that an autocrine and/or paracrine mechanism exists in FTSECs to regulate cell activities. Treatment of FT194 cells with 20 ng/ml of FGF2 rapidly suppressed phosphorylation LATS1 at both threonine 1079 and serine 909 (Fig. 9a, Supplementary Fig. 17). Further, treatment with FGF2 suppressed phosphorylation of Mob1 at threonine 35 and YAP at serine 127. FGF2 treatment had no effect on the total protein levels of these core components of the Hippo pathway signaling cascade (Fig. 9a, supplementary Fig. 17). These pieces of evidence suggest that the Hippo pathway is involved in the YAP and FGF interaction, despite of the fact that YAP can be activated in a Hippo-independent manner41.
Figure 9. The Hippo pathway is actively involved in the interaction between YAP and FGFR signaling pathway in the FTSECs.

a) FGF2 suppresses the phosphorylation of the major components of the Hippo/YAP signaling pathways in FT194 cells. The total and phosphorylated proteins were determined by Western blot. b) Western blot analysis indicates that knockdown of LATS1/2 in FT194 cells using LATS1/2 specific siRNA activates YAP, AKT (S473) and ERK1/2. c) RT-PCR results showing that knockdown of LATS1/2 in FT194 cells induces expression of FGF1, FGF2, FGFR1, and FGFR4. d) Blockage of YAP and FGFR using verteporfin and BGJ398 inhibited FT194 cell proliferation induced by LATS1/2 knockdown. Each box represents Mean ± SEM of 4 independent experiments. Boxes with different letters are significantly different from each other. e) Blockage of YAP and FGFR using verteporfin and BGJ398 inhibited FT194 cell migration induced by LATS1/2 knockdown. BGJ: BGJ398 (1μM); VTPF: verteporfin (5μm). Scale bar=200μm.
As mentioned above, LATS1/2 is the major suppressors of YAP activity in the Hippo/YAP pathway13, 16. Consistent with above observations, knockdown of LATS1/2 in FT194 cells with LATS1/2 siRNAs activates YAP (S127), which is indicated by significantly decrease of YAP phosphorylation at serine 127 (Fig. 9b, supplementary Fig. 18). Knockdown of LATS1/2 has no effect on the total YAP protein level (Fig 9b, supplementary Fig. 18). As expected, knockdown of LATS1/2 significantly Increased FGF1 (P < 0.01), FGF2 (P<0.05), FGFR1 (P < 0.01), and FGFR4 (P < 0.01) expression in FT194 cells (Fig 9c, supplementary Fig. 19). Importantly, inhibition of YAP or FGFR activities with verteporfin or BGJ398, respectively, not only eliminated increases in cell proliferation and migration induced by LATS knockdown (Fig. 9d, 9e, supplementary Fig. 20), but also reduced the basal-level growth of FT194 cells (Fig. 9d).
FGF treatment also rapidly (within 10 minutes) activated the Raf/ERK and the PI3K/AKT pathways (Fig. 9a), which have been shown to be activated by binding of FGF2 to FGFRs42. Knockdown of LATS1/2 also increase phosphorylation of AKT (S473) and ERK1/2 (T202/Y204) (Fig. 9b). Further, FGF2 induced suppression of YAP phosphorylation was blocked by the FGFR inhibitor BGJ398, PI3K inhibitor LY294002, and by MEK inhibitor UO126, suggesting that the PI3K and MAPK pathways are involved in FGF/FGFR-induced suppression of Hippo/YAP signaling in FTSECs (Supplementary Fig. 21a). In a 3D hanging-drop culture system, treatment of FT194 cells with LY294002 (PI3K inhibitor) completely inhibited FTSEC growth, leading to disassembly of the 3D structure. However, treatment with UO126 only partially inhibited YAP-induced FTSEC cell growth in the 3D culture system. This indicates that PI3K and MAPK pathways are involved in YAP regulation of FTSEC growth, but potentially in differential ways (Supplementary Fig. 21b).
The Hippo/YAP pathway interacts with FGF pathway to regulate Fallopian tube cell growth
To examine whether FGFR signaling pathway is required by YAP to regulate FTSEC cell activities, we knocked down FGFRs with four FGFR siRNAs (supplementary Fig. 22). Knockdown of FGFRs inhibited YAP- or constitutively active YAP-induced growth of FTSECs (Fig. 10a, supplementary Fig. 22). The same results was observed if BGJ was used to block FGFRs (Fig. 10a, supplementary Fig. 22). Wound healing assay showed that treatment of FT194 cells with BGJ or verteporfin significantly blocked “wound” closure in FTSECs, suggesting that these pathways are important for the migration of FTSECs (Supplementary Fig. 23). Importantly, blockage of FGFRs with BGJ eliminates YAP- or constitutively active YAP-induced anchorage-free growth of FTSECs, suggesting that FGFR signaling pathway is also involved in the transformation of FTSECs (Fig. 10c, 10d). OVSAHO is a verified ovarian HGSC cell line43. Treatment of OVSAHO cells with BGJ and verteporfin also eliminated its ability of anchorage-free survival (supplementary Fig. 24), further confirming the critical role of FGFR in YAP-induced carcinogenesis of FTSECs.
Figure 10. The Hippo/YAP pathway interacts with FGF/FGFR pathway to regulate activities of FTSECs.

a) Knockdown of FGFRs in FT194 and FT246 cells using FGFR siRNAs or blockage of FGFR activities using BGJ398 eliminate YAP- or constitutively active YAP-induced cell growth. Each bar represents mean ± SEM of four independent repeats. Bars with different letters are significantly different from each other (p<0.05). b) Verteporfin (YAP antagonist, 5 μM) and BGJ398 (FGFR inhibitor, 1μM) block YAP-induced growth of FT194 cells in a 3D-hanging drop culture system. c) Representative images from the soft agar assays showing that verteporfin and BGJ398 block YAP-induced colony formation in FT194 cells. d) Fluorescence-based quantitative soft agar assay showing that verteporfin and BGJ398 block YAP-induced colony formation in FT194 cells. Each bar represents mean ± SEM of four independent repeats. Bars with different letters are significantly different from each other (p<0.05). e) Representative images showing that treatment of tumor tissues derived from transformed FT194 cell mouse xenografts with BGJ398 (BGJ) or verteporfin (VTPF) suppressed tumor cell growth, which was indicated by the reduced expression of Ki-67 (Ki-67 positive cells are in green) (lower panel), and increased tumor cell apoptosis, which is indicated by TUNEL staining (TUNEL positive tumor cells are in green) (upper panel). Scale bar: 10μm.
Previous studies has shown that spheroid formation is one of the most well characterized models for 3D culture and screening due to its simplicity, reproducibility, and similarity to physiological tissues44. We then used a 3D hanging-drop culture system to further examine the biological function of the interaction between the Hippo/YAP and the FGFR signaling pathways in FTSECs. We found that ectopic expression of wild-type YAP or constitutively active YAP in FT194 cells significantly induced cell growth in the 3D culture system (Fig. 10b). YAP-induced growth of FTSECs in a 3D hanging drop culture system can be significantly suppressed by verteporfin (YAP antagonist)39 and BGJ398 (FGFR inhibitor)25 (Fig. 10b). In the BGJ treated FT194 cells, we can clearly see that BGI398 blocks YAP and YAPS127A-induced FTSEC growth (indicated by the smaller spheroids in groups, Fig. 10b). In the verteporfin treated FT194 cells, the spheroids did not shrink, but we clearly observed that well-defined edges of these spheroids disappeared. The cell-cell contacts in these drug-treated spheroids are so loose that these cells can be easily dispersed by pipetting. Staining of Ki67 indicated that both verteporfin and BGJ398 treatments suppressed YAP- and YAPS127A-induced Ki-67 expression, suggesting that the Hippo/YAP pathway and FGFR signaling pathway are critical for the cell-cell communication and growth of the FTSECs (supplementary Fig. 25). TUNEL assay showed that treatment of FTSECs with verteporfin and BGJ398 dramatically increased TUNEL positive cells, further supporting the role of the Hippo/YAP signaling pathway and the FGFR pathway in the viability of FTSECs (supplementary Fig. 26).
Finally, we use a xenograft tumor tissue culture system to examine the role of FGFR signaling pathway and oncogene YAP on the growth of xenograft tumor cells. Treatment of tumor tissues for 3 days suppressed tumor cell growth and induced tumor cell death, which is indicated by the decreased Ki-67 positive cells and increased TUNEL-positive cells in the tumors derived from FT194-YAPS127A cells (Fig. 10e). Similar results were also observed in tumors derived from OVSAHO cells, a cell line that has been verified as ovarian high grade serous carcinoma cells43, after treatment for 3 days with antagonists against FGFRs and YAP (supplementary Fig. 27). These lines of evidence clearly suggest that the proper interaction between the Hippo/YAP and FGF/FGFR signaling pathways are not only essential for FTSECs growth, but also for FTSEC transformation and potentially Fallopian tube and ovarian HGSC initiation.
DISCUSSION
Fallopian tube cancer (FTC) has long been considered as a rare type of gynecological cancer11, 45. However, the present criteria for diagnosis and classification of FTC are not well-established. Presently, pelvic cancers are classified as FTC only in the presence of a dominant tubal mass and a precursor lesion in the Fallopian tube, with no mass observed in the ovary or endometrium10. Similarly, primary peritoneal cancer (PPC) is diagnosed only when no mass is found in the ovary or the Fallopian tube. Interestingly, the presence of a precursor lesion in the ovary is not a requirement to diagnose a tumor of ovarian origin46. Furthermore, the convention has been to classify serous tumors in the pelvis as ovarian cancer when the origin is unclear8. Owing to the fact that many cases of FTC also have tumors on the surface of the ovary8–11, 46, 47, the previous criteria for diagnosis and classification of FTC, PPC, and ovarian cancer have led to significant underestimation of the incidence of Fallopian tube cancers. Recent studies identify the FTSECs as the cell origin of ovarian HGSC provide direct evidence for the importance of FTC in the initiation and progression of the conventional ovarian HGSC9, 48.
Despite progress in identifying the FTSEC origin of ovarian HGSC, the mechanism underlying the initiation and progression of Fallopian tube and ovarian HGSCs remains unclear. Previous studies show that YAP overexpression occurs in a broad range of human cancers49–51, including ovarian cancer17–18, 20, 54, and has been identified as a oncogene13,16, although several reports indicate that YAP also functions as a tumor suppressor in certain types of cancer52, 53. Our recent data show that YAP is overexpressed in the ovarian adult granulosa cell tumor (GCT) and plays critical roles in regulating GCT cell proliferation, migration, and steroidogenesis19. We also found that YAP interacts with EGFR signaling pathway to regulate growth of ovarian surface epithelial cells and ovarian cancer cells20. In the present study, we found that in the normal Fallopian tube cells, YAP expression was very low and was primarily located in the cytoplasm of the ciliated epithelial cells. However, YAP was overexpressed and localized in the nucleus of almost all epithelial cells in the inflammatory and cancerous Fallopian tube tissues. These results suggest that the Hippo/YAP pathway may be involved in the initiation and progression of Fallopian tube epithelia-derived cancer. This hypothesis is supported by observations that: 1) overexpression of wild-type YAP or constitutively active YAP induces FTSEC proliferation, while knockdown of YAP results in suppression of FTSEC proliferation; 2) ectopic expression of wild-type YAP or constitutively active YAP induced transformation of FTSECs; and 3) FTSECs transformed by wild-type YAP or constitutively active YAP are tumorigenic, as indicated by the formation and growth of tumor xenograft in athymic nude mice. This is the first report to show that YAP plays a critical role in initiating Fallopian tube cancer. Due to emerging evidence that ovarian HGSC is primarily derived from transformed FTSECs8–11, it is reasonable to theorize that YAP plays critical roles in the development of ovarian HGSC. Results from analysis of the multidimensional genomics data indicate that YAP and TEAD genes are frequently amplified and up-regulated in ovarian HGSC (Fig. 1f), while LATS1, the main component of the Hippo signaling pathway and the major negative regulator of YAP activity, is down-regulated (Fig. 1f). Results from these large-scale sequencing analyses not only support our hypothesis that the Hippo/YAP signaling pathway play critical role in the initiation and progression of Fallopian tube-derived ovarian HGSC, but also provide evidence for the clinical relevance of the present study. Since YAP activity depend on its expression level, phosphorylation status (i.e. phosphorylation level and sites), and sub-cellular localization, up-regulation of YAP mRNA or protein levels alone cannot reflect its activity, making it difficult to analyze the relationship between YAP activity and patient survival, especially in ovarian HGSC. Interestingly, we found that in the 418 patients with ovarian HGSC, YAP and TEADs genes were significantly down-regulated in 19 HGSC patients (beyond the default Z score threshold). The survival analysis indicated that down-regulation of YAP and TEADs in ovarian HGSC might be associated with improved patient survival (Fig. 1g). However, larger samples from ovarian HGSC patients are needed to confirm this finding.
As noted in the introduction, the etiology of Fallopian tube and ovarian HGSC is unknown. Indeed, several research groups have sought to identify the potential molecules or pathways that underlie FTSEC cell transformation and ovarian HGSC progression. The combination of SV40 T/t antigen and hTERT expression resulted in immortalized FTSECs that were non-tumorigenic in mice21, 22. Jazaeri et al. showed that activation of HRAS G12V and C-MYC T58A in FTSECs harboring SV40 T and hTERT were the minimal alterations required to achieve transformation of human FTSECs21. These results are consistent with observations by Kendall et al. who showed that forced activation of MYC, RASv12, and hTERT, in addition to interference with TP53 and RB1 tumor suppressor functions (mediated by SV40 T), were necessary and sufficient to transform human cells of epithelial and mesenchymal origin55. On the other hand, studies by Karst et al. indicate that introduction of H-RASV12 or c-MYC transforms FTSECs and induces formation of HGSC22. These results are supported by Shan et al, who also found that overexpression of HRASV12 transformed human Fallopian tube epithelial (FTE) cell lines that were immortalized with SV40 T/g antigens and hTERT56. It is notable that in all three experiments, mutated HRAS has been used as an oncogene to transform the FTSECs. However, HRAS mutations are not characteristic of ovarian HGSC57. Therefore, the pathological relevance of HGSC models employing HRAS is questionable. In our present study, we found that overexpression of the YAP gene is not only sufficient to transform the FTSECs immortalized by viral genes (FT194 cells, immortalized by SV40 T/t and hTERT), but also FTSEC cells immortalized without viral genes30 (FT246, immortalized by TP53 shRNA, CDKR24C, and PP2A-B56γ shRNA). Wild-type or mutant YAP overexpressing cells, namely FT194-YAP, FT246-YAP, FT194-YAPS127A, and FT246-YAPS127A cells, overcome contact inhibition and continue to grow after cells reach confluence. Further, these cells acquire the ability of anchorage-independent growth, and form solid tumor in athymic nude mice after implantation. These pieces of evidence clearly position YAP as a critical oncogenic molecule in the development of malignancy in FTSECs. This idea is further supported by the fact that blocking the action of YAP protein using verteporfin, a YAP antagonist, eliminates YAP-induced FTSEC cell proliferation in 3D-culture system and colony formation in the soft agar gel.
Importantly, we note that tumor cells in FTSECs-derived tumor tissues have pleomorphic nuclei, prominent nucleoli, and are highly proliferative (high mitotic index and Ki67 expression), suggesting these tumor cells are HGSC cells. Because serous tumors usually show positive staining for cytokeratin 7 and negative staining for cytokeratin 2036, the strong cytoplasm staining of cytokeratin 7 and negative staining of cytokeratin 20 in FTSECs-derived tumor tissues suggests that these tumors are serous type. Very strong nuclear staining of WT-1 in FTSECs-derived tumor tissues also differentiates them from other types of ovarian tumors, such as endometrioid and clear cell carcinomas58, 59. The histological features and the negative periodic acid Schiff and Alcian blue PH2.5 staining (Fig. 5b) excluded these tumors from the mucinous type. Moreover, compared to HGSC, borderline serous tumors and low-grade serous carcinomas are more likely to show nuclear staining for PAX237. The very low expression of PAX2 in FTSECs-derived tumor tissues detected using immunohistochemical and Western blot analyses indicates that these tumor tissues are not borderline serous tumors or low-grade serous carcinomas. On the other hand, PAX8 is a reliable marker of female genital tract tumors and is almost always positive in serous tumors31, 33, 34. The very strong nuclear staining of PAX8 further confirms that FTSEC-derived tumors are HGSC in nature. Consistent with our findings, two very recent studies using FTSECs to model the cell origin of OSE also indicate that tumors derived from FTSEC are HGSC in nature21, 22. Although another research group found that transfection of the SV40T and hTERT immortalized Fallopian tube epithelial cell lines with mutated HRAS induced poorly differentiated mucinous adenocarcinoma mixed with undifferentiated carcinoma, the authors believe that this discrepancy could be attributed to the purity of cells used in their study56. Moreover, findings from three very recent transgenic mouse models also strongly suggest that the tumors derived from FTSECs are HGSC31, 60, 61.
Molecular mechanisms underlying the initiation and progression of FTSEC-derived Fallopian tube and ovarian HGSCs are unknown. It is known that the mitogen FGFs play key roles in the growth and survival of progenitor cells during development, tissue regeneration, and carcinogenesis62, 63. Studies on the gene expression profiling of advanced ovarian cancer suggest that FGF2 acts as an autocrine growth factor for ovarian cancer cell proliferation and invasion38, 64–66, and tissue healing67, 68. Previous research also demonstrates that cultured FTSECs produce FGF223. Consistent with these results, we show that FTSECs not only secret FGF1 and FGF2, but also express all four FGFRs, suggesting that FGF1/2 may play autocrine and/or paracrine roles in the Fallopian tube cells. Supporting our hypothesis, our present study clearly shows that FGF1 and FGF2 can stimulate cell proliferation, promote cell-cycle progression, and enhance migration in FTSECs. These findings strongly indicate that FGFs are functional mitogens in FTSECs. Intriguingly, we found that ectopic expression of YAP or constitutively active YAP not only stimulates expression and secretion of FGF1/2, but also induces the expression of FGFRs. It seems that in the FTSECs, YAP may function as a major player in the FGF signaling, which plays critical roles in regulating growth of FTSECs in an autocrine/paracrine manner. Consistent with these observations, knockdown of YAP eliminated FGF-stimulated proliferation and migration of FTSECs. Moreover, treatment of FTSECs with verteporfin, a YAP antagonist, entirely blocked YAP- and YAPS127A-induced production of FGF1/2. Finally, we found that FGF2 induced FGF1 and FGF2 mRNA expression in FTSECs (Fig. 8d), Knockdown of YAP blocked FGF2-induced FGF1/2 mRNA expression (Fig. 8d). Clearly, the FGFR signaling pathway formed an autocrine loop to regulate the growth of FTSECs. YAP is required for FGF2 to promote proliferation and migration of normal and transformed FTSECs.
YAP is the major effector of the Hippo pathway, although the Hippo-independent YAP action has also been reported12,16. FGF2 treatment suppressed the Hippo pathway and activated YAP in FTSECs (Fig. 9a), suggesting that the Hippo pathway is involved in the interaction between FGF/FGFR and YAP in the FTSECs. Knockdown of LATS1/2 significantly promoted proliferation and migration of FTSECs. Knockdown of LATS1/2 also stimulated expression of FGF ligands and FGFRs (supplementary fig 19). Furthermore, both BGJ398 (FGFR antagonist) and verteporfin (YAP antagonist) eliminated LATS1/2-knoockdown-induced proliferation and migration of FTSECs (Fig. 9). These lines of evidence clearly indicated that the Hippo/YAP pathway and the FGFR signaling pathway interact with each other to control the growth of FTSECs.
MAPK and PI3K/AKT pathways are two known major downstream pathways of the FGF signaling cascade42, 69. Pretreatment of FTSECs with BGJ398 (a pan FGFR inhibitor), LY294002 (a PI3K inhibitor), or UO126 (a MEK inhibitor) blocked FGF2-induced dephosphorylation of YAP, suggesting the PI3K and MAPK pathways are actively involved in FGF2-induced suppression of the Hippo pathway and activation of YAP oncogene. Inhibition of YAP- or YAPS127A-induced spheroid growth by Uo126 and LY294002, and activation of ERK1/2 and AKT by knockdown of LATS1/2 in FTSECs clearly indicate the involvement of ERK1/2 and AKT pathway in the crosstalk between the Hippo pathway and the FGFR pathway in the FTSECs. Treatment of FTSECs with FGF2 rapidly (within 10 minutes) activates ERK1/2 and AKT pathway, but suppresses the Hippo signaling pathway 30–60 minutes after treatment (Fig. 9a), suggesting that ERK1/2 and AKT are potential mediators of the interactions between the Hippo/YAP pathway and the FGFR pathway. Collectively, these results suggest that MAPK and AKT pathways are actively involved in the interaction between the Hippo/YAP pathway and the FGFR pathway. However, more experiments are necessary for us to uncover the exact molecular base underlying the proper crosstalk among these pathways in the FTSECs.
In summary, our study suggests that YAP is overexpressed in the Fallopian tube inflammatory and cancerous tissues. Overexpression or constitutive activation of YAP promote proliferation and drive transformation of FTSECs. Moreover, we found that YAP stimulates secretion of FGF ligands and expression of FGFRs. Elevated FGF ligands bind to the increased FGF receptors to activate downstream signaling pathways such as PI3K and MAPK pathways, leading the suppression of the Hippo pathway and activation of YAP protein. Activated YAP can, in turn, stimulate the proliferation of FTSECs and enhance the production of FGFs and expression of FGFRs. Our study clearly suggests that the Hippo/YAP signaling pathway interacts with FGF signaling pathway to form an autocrine/paracrine loop to induce the growth of transformed Fallopian tube epithelial cells (Fig. 11a). The existence of the positive feedback loop is confirmed and clinical relevance of this positive regulatory loop is evidenced by the Multidimensional Genomics Data analysis using online cancer database and data-mining tools [The Cancer genomic Atlas (TCGA) and the cBioPortal for Cancer Genomics]26, 27. These analyses indicate that 77% (322/420) of ovarian HGSCs have alterations in major components of this FGFs/FGFR/Hippo/YAP/FGFs positive feedback loop (Fig. 11b). These alterations match perfectly with our present finding (down-regulation of LATS1 and up-regulation of YAP, TEAD, FGF1/2, FGFRs and PI3K) (Fig. 11b). Several Phase I and Phase II clinical trials for BGJ398, a pan FGFR inhibitor, are currently underway to examine the role of this novel small molecule in the treatment of several solid tumors (http://clinicaltrials.gov/ct2/results?term=BGJ398&Search=Search). Evidence in the present study clearly suggests that combined targeting of YAP with a YAP inhibitor (such as verteporfin) and FGFRs with a FGFR inhibitor (such as BGJ398) represents a novel therapeutic strategy for the FTSEC-derived Fallopian tube and ovarian HGSC.
Figure 11. Schematic diagram showing the signaling mechanisms underlying the Hippo/YAP pathway regulation of ovarian HGSC progression.

a) Schematic diagram showing that the Hippo/YAP and FGF/FGFR pathways interact with each other to form a positive feedback loop to regulate activities of FTSECs. Our data indicated that dysfunction of the Hippo signaling pathway may lead to dysregulation of YAP protein expression or activation. Overexpression or constitutive activation of YAP protein in FTSECs is able to promote proliferation and drive transformation of these cells. Moreover, increased YAP activation stimulates secretion of FGF ligands and expression of FGFRs. Elevated FGF ligands bind to the increased FGF receptors to activate downstream signaling pathways such as PI3K and MAPK pathways, leading the suppression of the Hippo pathway and activation of YAP protein. Dysfunction of FGFR pathway may also have the similar effect on the FTSECs. The Hippo/YAP and FGF/FGFR pathways interact with each other to form a positive feedback loop to regulate activities of FTSECs. b) The clinical relevance of the discovered positive feedback loop is evidenced by the results from the multidimensional cancer genomics data analysis. These large-scale patient sample analyses indicate that 77% of ovarian HGSC cases (322/420) have alterations in major genes composing the positive feedback loop.
MATERIALS AND METHODS
Chemicals
Recombinant human acidic FGF (FGF1) and basic FGF (FGF2), as well as the ELISA kits for FGF1 and FGF2 measurements, were from R&D Systems Inc. (Minneapolis, MN). DMEM/F12 cell culture medium was from Fisher Scientific Inc. (Pittsburgh, PA). The Ultroser™ G serum substitute was from Pall Corporation (France). Fetal bovine serum (FBS) was from Atlanta Biologicals, Inc. (Lawrenceville, GA). The cDNA first strand synthesis and PCR chemicals, and Alexa-conjugated secondary antibodies were from Life Technologies™ (Grand Island, NY). The RNeasy Mini Kit was from QIAGEN Inc. (Valencia, CA). YAP siRNA was from Dhamarcon/Thermo Scientific (Pittsburgh, PA). Antibodies against YAP, phospho-YAP (ser127), Cyclin A2, Cyclin D1, Cyclin B1, and cytokerintins were from Cell Signaling Technology Inc. (Danvers, MA); PAX8 and WT-1 were from Proteintech Inc. (Chicago, IL). Peroxidase-conjugated secondary antibodies for Western blot analysis were from Jackson Immunoresearch Laboratories Inc. (West Grove, PA). The SuperSignal West Femto Chemiluminescent Substrate Kit was from Pierce/Thermo Scientific (Rockford, IL). Optitran® Nitrocellular transfer membrane was from Schleicher & Schuell Bioscience (Dassel, Germany). Antibodies against β-actin were from Sigma-Aldrich (St. Louis, MO). LY294002 and UO126 inhibitors were from Calbiochem (San Diego, CA). The BGJ398 inhibitor was from Medchem Express (Monmouth Junction, NJ). The matrigel basement-membrane matrix was from BD Biosciences Inc. (San Jose, CA).
Cell Lines and Human Ovarian Tissues
Fallopian tube secretory epithelial cells (FTSECs) have been successfully isolated from primary human Fallopian tube tissue and immortalized by expressing human telomerase reverse transcriptase (hTERT) and perturbing the TP53 and RB1 tumor suppressor pathways30. Immortalized human FTSECs, namely FT190, FT194, FT237, FT240 and FT246, were used in these experiments (passage number < 10). OVSAHO cell line was purchased from the Riken Biosource Center (Riken Cell Bank) and has been validated by STR polymorphism analysis. Human normal and cancerous Fallopian tube and ovarian tissue microarray slides were purchased from US Biomax (Rockville, MD). A total of 29 normal, inflammation, and cancerous human Fallopian tube tissues (including 10 adenocarcinoma tissues, 10 inflammation tissues, and 9 normal Fallopian tube tissues) and 147 normal and cancerous ovarian tissues (42 normal, 105 ovarian HGSC) were used for IHC analysis. Each sample from an individual patient was arranged in duplicate on the slides.
Immunohistochemistry and PAS-AB staining
YAP expression in normal, inflammatory, and cancerous human Fallopian tube tissues was detected using a peroxidase-based immunohistochemistry as previously described19. Sections were scanned using an iSCAN Coreo Slide Scaner (Ventana Medical Systems, Inc., Oro Valley, AZ, USA). The intensity of the positive signal was quantified and recorded using Aperio ImageScope software (Aperio® Technologies, Inc., Vista, CA). The Annotations and the Positive Pixel Count V 9 parameters were set according to the user instructions to analyze YAP immunosignal (Ip(Low)=Isp(High) were set to 100. All other parameters were set as default). The values of total intensity of positive and positivity were record and analyzed. The positivity (i.e., the ratio of positive cells per total cell number) of each section was also recorded. The automatic scores from the software were verified by pathologist (Dr. Subodh M. Lele).
Immunofluorescent histochemistry (IF) was used to localize YAP in the established cell lines. Briefly, cells were fixed in freshly prepared 4% paraformaldehyde and stained for YAP using a protocol established in our laboratory19, 70. Images were captured using a Zeiss 710 Meta Confocal Laser Scanning Microscope and analyzed using Zeiss Zen 2010 software (Carl Zeiss Microscopy, LLC, Thornwood, NY).
Alcian Blue 2.5 staining was used to determine the production of sulfated and carboxylated acid mucopolysaccharides and sialomucins in the FTSECs-derived tumor xenografts. The colorectal epithelium tissues were used as a positive control. The section was counter-stained with Periodic acid-Schiff and hematoxylin.
Cell Proliferation Analysis
Six cell lines expressing different levels of YAP protein were established to determine the effect of YAP on FTSECs proliferation. Briefly, FTSECs were cultured to 40% confluent and then transfected using retrovirus-based YAP overexpression constructs. The efficiency of these vectors has been reported previously19, 49. Stable FT194-MXIV, FT194-YAP and FT194-YAPS127A expressing clones were selected using G418. YAP expression and phosphorylation in these cells were confirmed by Western blot. The following six stable cell lines were established: (1) the FT194-MXIV, (2) FT246-MXIV, (3) FT194-YAP, (4) FT246-YAP, (5) FT194-YAPS127A and (6) FT246-YAPS127A. The FT194-MXIV and FT246-MXIV cell lines were created by transfecting FT194 and FT246 cells with the empty vector (MXIV). These cells expressed endogenous YAP and were used as control cells. The FT194-YAP and FT246-YAP cell lines, which overexpress wild-type YAP protein, were created by transfecting FT194 and FT246 cells with vectors expressing wild-type YAP. The FT194-YAPS127A and FT246-YAPS127A cells were created by transfecting FT194 and FT246 cells with vectors expressing constitutively activated YAP (i.e., dephosphorylated YAP). The serine to alanine mutation of YAP at residue 127 (YAPS127A) prevented YAP phosphorylation, leading to its nuclear localization and constitutive activation. YAP expressions were confirmed by Western blot, RT-PCR, and immunofluorescence assay. Cell growth was determined by counting the cell number using an Invitrogen Countess® Automated cell counter (Invitrogen Corporation, Carlsbad, CA).
The effect of YAP on FTSEC proliferation was also determined by knockdown of YAP using a RNA interference technique. Briefly, 60% confluent FT194 and FT246 cells were transfected with siGLO (a cy5-labeled non-target siRNA as control) or YAP siRNAs for 6h using Lipofectamine RNAimax (Invitrogen Corporation, Carlsbad, CA). Successful knockdown of YAP was also confirmed by RT-PCR and Western blot. Cell growth was determined by counting cell number using an Invitrogen Countess® Automated cell counter as described above.
Cell cycle analysis
FTSECs subjected to different treatments (including control cells, YAP overexpression and constitutively activated YAP, and YAP knockdown cells) were trypsinized, fixed and permeabilized with 70% ethanol overnight at −20°C. Cells were then labeled with propidium iodide for 30 minutes at 37°C and flow cytometry was used to determine the cell cycle distribution of the cells.
Cell Migration Assays
A wound healing assay was used to test the motility of FTSECs control cells, YAP overexpression, constitutively activated cells, YAP knockdown cells, and FGF2 incubated cells71. The “wound” area was measured using computerized Microsuite™ FIVE imaging software (Olympus America, Inc. Center Valley, PA). We also use an additional Transwell cell migration assay protocol established in our laboratory to confirm the effect of YAP overexpression or constitutive activation on FESEC migration71. Experiments were repeated in triplicate, and at least three inserts were used for each treatment group.
Colony Formation Assay
The effect of YAP on the transformation of non-oncogenic normal FTSECs was determined using a Cytoselect 96-Well Cell Transformation kit (Cell Biolabs, Inc., SanDiego, CA) according to the manufacturer’s instructions. This soft agar-based cell colony formation kit was also used to determine the effect of YAP on the anchorage-independent growth of FTSECs in vitro.
Western Blot Analysis
Protein levels in FTSECs, as well as in the xenograft tissues, were determined by Western Blot based on a protocol established in our laboratory19, 72. The immunosignal was detected using a Thermo Scientific SuperSignalWest Femto Chemiluminescent Substrate Kit (Thermo Fisher Scientific, Rockford, IL). The images were captured and analyzed with a UVP gel documentation system (UVP, LLC, Upland, CA).
RT-PCR Analysis of Gene Expression
Expression of YAP, AREG, FGF ligands, and FGFRs were also detected with RT-PCR. Total RNA was prepared by TRIzol reagent (Invitrogen Corporation, Carlsbad, CA), and reverse transcription was completed using a SuperScript® III First-Strand Synthesis System (Life TechnlogyTM, Grand Island, NY). RT-PCR was performed on an MJ Research PTC100 Programmable Thermal cycler (Bio-RadLaboratories, Inc., Hercules, CA) based on a protocol established in our laboratory19, 71. Primers have been described and validated previously73, 74.
In Vivo Tumorigenicity
To confirm the transformative action of YAP in the FTSECs, FT194-MXIV, FT194-YAP, and FT194-YAPS127A cells were suspended in 100μL of DMEM/F12, mixed with 100μL of Matrigel (BD Biosciences) and injected subcutaneously into the left shoulder (MXIV control) and right shoulder (YAP overexpression or constitutively activated) of five-week-old female athymic nude mice (n=6). The tumor diameter was recorded weekly for 11 weeks. Tumor volume (mm3) was estimated by measuring the longest and shortest diameter of the tumor and calculated as follows: volume = (shortest diameter)2 × (longest diameter) ×3.14 ÷ 6. All mice were euthanized at the end of the experiment, and tumors were collected for preparation of protein, RNA, and paraffin tissue sections. The animal handling procedures and all experimental protocols were approved by the Institutional Animal Care and Use Committee (IACUC) at the University of Nebraska Medical Center.
Multidimensional oncogenomic data analysis
Multidimensional cancer genomic data analysis was performed using online data mining tool from the cBioPortal for Cancer Genomics (http://cbioportal.org) and the datasets from the cBioPortal for Cancer Genomics and the TCGA research Network (http://cancergenome.nih.gov) according to recently published protocols26, 27. Tumor types and datasets are chosen in accordance with the publication guidelines from TCGA (last update: September 30, 2014). Genomic alterations are identified when following occurs: 1) gene mutations; 2) putative copy-number alteration (amplification or deletion); 3) RNA expression Z-scores (RNA Seq Version 2 RSEM) with Z-score thresholds ± 2.0; 4) protein/phospho-protein level (RPPA) with Z-score thresholds ± 2.0. All clinical data and copy number alterations or variations data were merged per “Case Id” as the linking variable after the separate files were uploaded to GraphPad prism 5 for statistical analysis.
Xenograft tumor tissue culture
FT194-YAP S127A cells (transformed FT-194 cells) were injected subcutaneously into the athymic nude mice to form HGSC tumors as described in Figure 4. When tumor size (diameter) reached 0.8cm, the nude mice were sacrificed and the tumors were surgically removed, sliced into 300μm slices. The tumor slice was then cut into small pieces (1.0 mm × 1.0 mm) under a stereo microscope and loaded onto the membrane of a culture insert in a tissues culture system, which has been reported previously70. Tumor tissues were culture for 3 days with or without BGJ (1μM) or verteporfin (5μM). Control tissues were treated with the same amount of vehicle (DMSO, 0.1% final concentration). The incubated tissues were embedded into OCT and sectioned using a cryostat to prepare the frozen section for TUNEL assay and Ki-67 staining. TUNEL assay and Ki-67 staining were performed with protocols established in our laboratory20. OVSAHO, a verified high grade ovarian serous carcinoma cell lines43, 75, have been used to replace the FT194-YAPS127A cells to confirm the role of verteporfin and BGJ398 on the growth of ovarian HGSC tumor in vitro using the same experimental design.
Statistical analysis
All experiments were repeated at least three times with each sample in triplicate unless otherwise noted (duplicate only if the volume of a sample is limited). Statistical analyses were conducted primarily using GraphPad Prism software (GraphPad Software, Inc.). Statistical comparisons between two groups were analyzed for significance by one-way ANOVA with Tukey’s post-Hoc test or by two-tailed Student’s t-test. Multiple group comparisons were assessed using two-way repeated measures analysis of variance with post-hoc t-test. Data in the graph are presented as the mean ± SEM. Sample numbers used for cell biology and biochemical studies were determine based on data reported previously20. For tumorigenic experiments, six animals were used in each groups. The number was determined by power analysis based on a preliminary study and a relevant report20. Survival data were estimated by Kaplan–Meier method analyzed by log-rank test. High grade serous carcinoma YAP expression data and patient survival data were extracted from TCGA database (http://cancergenome.nih.gov/). The frequency of cross-cancer YAP gene alterations and the frequency of YAP/TEADs gene alteration in ovarian high grade serous carcinoma were analyzed and graphed by the cBioPortal online analysis tool (The cBioportal for Cancer Genomics, http://www.cbioportal.org/) using data extracted from TCGA26, 27.
Supplementary Material
Acknowledgments
We thank Dr. Adam Karpf (The Pamela & Fred Cancer Center, University of Nebraska Medical Center) for providing ovarian high grade serous carcinoma cell lines. We acknowledge the cBioPortal for Cancer Genomics (http://cbioportal.org) for providing datasets and online analyzing tools. We also acknowledge the TCGA research Network (http://cancergenome.nih.gov) for providing datasets. This work was supported by the Eunice Kennedy Shriver National Institute of Child Health and Human Development (5R00HD059985, 5P01AG029531); The Olson Center for Women’s Health (no number); The Fred & Pamela Buffett Cancer Center (LB595), the Colleen’s Dream Foundation (no number), the Omaha Veterans Administration Medical Center (5I01BX000512) and The National Institute of Food and Agriculture (2011-67015-20076). The authors thank Melody Montgomery at the University of Nebraska Medical Center (UNMC) Research Editorial Office for the professional editing of this manuscript.
Footnotes
Conflict of Interest: The authors have no competing interests to declare.
References
- 1.Jemal A, Bray F, Center MM, Ferlay J, Ward E, Forman D. Global cancer statistics. CA Cancer J Clin. 2011;61:69–90. doi: 10.3322/caac.20107. [DOI] [PubMed] [Google Scholar]
- 2.Seidman JD, Horkayne-Szakaly I, Haiba M, Boice CR, Kurman RJ, Ronnett BM. The histologic type and stage distribution of ovarian carcinomas of surface epithelial origin. Int J Gynecol Pathol. 2004;23:41–44. doi: 10.1097/01.pgp.0000101080.35393.16. [DOI] [PubMed] [Google Scholar]
- 3.Selvaggi SM. Tumors of the ovary, maldeveloped gonads, fallopian tube, and broad ligament. Arch Pathol Lab Med. 2000;124:477. [PubMed] [Google Scholar]
- 4.Auersperg N, Wong AS, Choi KC, Kang SK, Leung PC. Ovarian surface epithelium: biology, endocrinology, and pathology. Endocr Rev. 2001;22:255–288. doi: 10.1210/edrv.22.2.0422. [DOI] [PubMed] [Google Scholar]
- 5.Katabuchi H, Okamura H. Cell biology of human ovarian surface epithelial cells and ovarian carcinogenesis. Med Electron Microsc. 2003;36:74–86. doi: 10.1007/s00795-002-0196-6. [DOI] [PubMed] [Google Scholar]
- 6.Casey MJ, Bewtra C, Hoehne LL, Tatpati AD, Lynch HT, Watson P. Histology of prophylactically removed ovaries from BRCA1 and BRCA2 mutation carriers compared with noncarriers in hereditary breast ovarian cancer syndrome kindreds. Gynecol Oncol. 2000;78:278–287. doi: 10.1006/gyno.2000.5861. [DOI] [PubMed] [Google Scholar]
- 7.Barakat RR, Federici MG, Saigo PE, Robson ME, Offit K, Boyd J. Absence of premalignant histologic, molecular, or cell biologic alterations in prophylactic oophorectomy specimens from BRCA1 heterozygotes. Cancer. 2000;89:383–390. doi: 10.1002/1097-0142(20000715)89:2<383::aid-cncr25>3.0.co;2-t. [DOI] [PubMed] [Google Scholar]
- 8.Berek JS, Crum C, Friedlander M. Cancer of the ovary, fallopian tube, and peritoneum. Int J Gynaecol Obstet. 2012;119 (Suppl 2):S118–129. doi: 10.1016/S0020-7292(12)60025-3. [DOI] [PubMed] [Google Scholar]
- 9.Kurman RJ, Shih Ie M. Molecular pathogenesis and extraovarian origin of epithelial ovarian cancer--shifting the paradigm. Hum Pathol. 2011;42:918–931. doi: 10.1016/j.humpath.2011.03.003. [DOI] [PMC free article] [PubMed] [Google Scholar]
- 10.Kindelberger DW, Lee Y, Miron A, Hirsch MS, Feltmate C, Medeiros F, et al. Intraepithelial carcinoma of the fimbria and pelvic serous carcinoma: Evidence for a causal relationship. Am J Surg Pathol. 2007;31:161–169. doi: 10.1097/01.pas.0000213335.40358.47. [DOI] [PubMed] [Google Scholar]
- 11.Goodman MT, Shvetsov YB. Incidence of ovarian, peritoneal, and fallopian tube carcinomas in the United States, 1995–2004. Cancer Epidemiol Biomarkers Prev. 2009;18:132–139. doi: 10.1158/1055-9965.EPI-08-0771. [DOI] [PMC free article] [PubMed] [Google Scholar]
- 12.Johnson R, Halder G. The two faces of Hippo: targeting the Hippo pathway for regenerative medicine and cancer treatment. Nat Rev Drug Discov. 2014;13:63–79. doi: 10.1038/nrd4161. [DOI] [PMC free article] [PubMed] [Google Scholar]
- 13.Pan D. The hippo signaling pathway in development and cancer. Dev Cell. 2010;19:491–505. doi: 10.1016/j.devcel.2010.09.011. [DOI] [PMC free article] [PubMed] [Google Scholar]
- 14.Huang J, Wu S, Barrera J, Matthews K, Pan D. The Hippo signaling pathway coordinately regulates cell proliferation and apoptosis by inactivating Yorkie, the Drosophila Homolog of YAP. Cell. 2005;122:421–434. doi: 10.1016/j.cell.2005.06.007. [DOI] [PubMed] [Google Scholar]
- 15.Tapon N, Harvey KF, Bell DW, Wahrer DC, Schiripo TA, Haber D, et al. salvador Promotes both cell cycle exit and apoptosis in Drosophila and is mutated in human cancer cell lines. Cell. 2002;110:467–478. doi: 10.1016/s0092-8674(02)00824-3. [DOI] [PubMed] [Google Scholar]
- 16.Yu FX, Guan KL. The Hippo pathway: regulators and regulations. Genes Dev. 2013;27:355–371. doi: 10.1101/gad.210773.112. [DOI] [PMC free article] [PubMed] [Google Scholar]
- 17.Zhang X, George J, Deb S, Degoutin JL, Takano EA, Fox SB, et al. The Hippo pathway transcriptional co-activator, YAP, is an ovarian cancer oncogene. Oncogene. 2011;30:2810–2822. doi: 10.1038/onc.2011.8. [DOI] [PubMed] [Google Scholar]
- 18.Hall CA, Wang R, Miao J, Oliva E, Shen X, Wheeler T, et al. Hippo pathway effector Yap is an ovarian cancer oncogene. Cancer Res. 2010;70:8517–8525. doi: 10.1158/0008-5472.CAN-10-1242. [DOI] [PMC free article] [PubMed] [Google Scholar]
- 19.Fu D, Lv X, Hua G, He C, Dong J, Lele SM, et al. YAP regulates cell proliferation, migration, and steroidogenesis in adult granulosa cell tumors. Endocr Relat Cancer. 2014 doi: 10.1530/ERC-13-0339. [DOI] [PMC free article] [PubMed] [Google Scholar]
- 20.He C, Lv X, Hua G, Lele SM, Remmenga S, Dong J, et al. YAP forms autocrine loops with the ERBB pathway to regulate ovarian cancer initiation and progression. Oncogene. 2015 doi: 10.1038/onc.2015.52. [DOI] [PMC free article] [PubMed] [Google Scholar]
- 21.Jazaeri AA, Bryant JL, Park H, Li H, Dahiya N, Stoler MH, et al. Molecular requirements for transformation of fallopian tube epithelial cells into serous carcinoma. Neoplasia. 2011;13:899–911. doi: 10.1593/neo.11138. [DOI] [PMC free article] [PubMed] [Google Scholar]
- 22.Karst AM, Levanon K, Drapkin R. Modeling high-grade serous ovarian carcinogenesis from the fallopian tube. Proc Natl Acad Sci U S A. 2011;108:7547–7552. doi: 10.1073/pnas.1017300108. [DOI] [PMC free article] [PubMed] [Google Scholar]
- 23.Ando H, Kobayashi M, Toda S, Kikkawa F, Masahashi T, Mizutani S. Establishment of a ciliated epithelial cell line from human Fallopian tube. Hum Reprod. 2000;15:1597–1603. doi: 10.1093/humrep/15.7.1597. [DOI] [PubMed] [Google Scholar]
- 24.Smith JA, Madden T, Vijjeswarapu M, Newman RA. Inhibition of export of fibroblast growth factor-2 (FGF-2) from the prostate cancer cell lines PC3 and DU145 by Anvirzel and its cardiac glycoside component, oleandrin. Biochem Pharmacol. 2001;62:469–472. doi: 10.1016/s0006-2952(01)00690-6. [DOI] [PubMed] [Google Scholar]
- 25.Guagnano V, Furet P, Spanka C, Bordas V, Le Douget M, Stamm C, et al. Discovery of 3-(2,6-dichloro-3,5-dimethoxy-phenyl)-1-{6-[4-(4-ethyl-piperazin-1-yl)-phenylamin o]-pyrimidin-4-yl}-1-methyl-urea (NVP-BGJ398), a potent and selective inhibitor of the fibroblast growth factor receptor family of receptor tyrosine kinase. J Med Chem. 2011;54:7066–7083. doi: 10.1021/jm2006222. [DOI] [PubMed] [Google Scholar]
- 26.Gao J, Aksoy BA, Dogrusoz U, Dresdner G, Gross B, Sumer SO, et al. Integrative analysis of complex cancer genomics and clinical profiles using the cBioPortal. Sci Signal. 2013;6:pl1. doi: 10.1126/scisignal.2004088. [DOI] [PMC free article] [PubMed] [Google Scholar]
- 27.Cerami E, Gao J, Dogrusoz U, Gross BE, Sumer SO, Aksoy BA, et al. The cBio cancer genomics portal: an open platform for exploring multidimensional cancer genomics data. Cancer Discov. 2012;2:401–404. doi: 10.1158/2159-8290.CD-12-0095. [DOI] [PMC free article] [PubMed] [Google Scholar]
- 28.Cancer Genome Atlas N. Comprehensive molecular portraits of human breast tumours. Nature. 2012;490:61–70. doi: 10.1038/nature11412. [DOI] [PMC free article] [PubMed] [Google Scholar]
- 29.Cancer Genome Atlas Research N. Kandoth C, Schultz N, Cherniack AD, Akbani R, Liu Y, et al. Integrated genomic characterization of endometrial carcinoma. Nature. 2013;497:67–73. doi: 10.1038/nature12113. [DOI] [PMC free article] [PubMed] [Google Scholar]
- 30.Karst AM, Drapkin R. Primary culture and immortalization of human fallopian tube secretory epithelial cells. Nat Protoc. 2012;7:1755–1764. doi: 10.1038/nprot.2012.097. [DOI] [PMC free article] [PubMed] [Google Scholar]
- 31.Perets R, Wyant GA, Muto KW, Bijron JG, Poole BB, Chin KT, et al. Transformation of the fallopian tube secretory epithelium leads to high-grade serous ovarian cancer in Brca; Tp53; Pten models. Cancer Cell. 2013;24:751–765. doi: 10.1016/j.ccr.2013.10.013. [DOI] [PMC free article] [PubMed] [Google Scholar]
- 32.Kuhn E, Meeker A, Wang TL, Sehdev AS, Kurman RJ, Shih Ie M. Shortened telomeres in serous tubal intraepithelial carcinoma: an early event in ovarian high-grade serous carcinogenesis. Am J Surg Pathol. 2010;34:829–836. doi: 10.1097/PAS.0b013e3181dcede7. [DOI] [PMC free article] [PubMed] [Google Scholar]
- 33.Bowen NJ, Logani S, Dickerson EB, Kapa LB, Akhtar M, Benigno BB, et al. Emerging roles for PAX8 in ovarian cancer and endosalpingeal development. Gynecol Oncol. 2007;104:331–337. doi: 10.1016/j.ygyno.2006.08.052. [DOI] [PubMed] [Google Scholar]
- 34.Laury AR, Hornick JL, Perets R, Krane JF, Corson J, Drapkin R, et al. PAX8 reliably distinguishes ovarian serous tumors from malignant mesothelioma. Am J Surg Pathol. 2010;34:627–635. doi: 10.1097/PAS.0b013e3181da7687. [DOI] [PubMed] [Google Scholar]
- 35.Madore J, Ren F, Filali-Mouhim A, Sanchez L, Kobel M, Tonin PN, et al. Characterization of the molecular differences between ovarian endometrioid carcinoma and ovarian serous carcinoma. J Pathol. 2010;220:392–400. doi: 10.1002/path.2659. [DOI] [PubMed] [Google Scholar]
- 36.Cathro HP, Stoler MH. Expression of cytokeratins 7 and 20 in ovarian neoplasia. Am J Clin Pathol. 2002;117:944–951. doi: 10.1309/2T1Y-7BB7-DAPE-PQ6L. [DOI] [PubMed] [Google Scholar]
- 37.Tung CS, Mok SC, Tsang YT, Zu Z, Song H, Liu J, et al. PAX2 expression in low malignant potential ovarian tumors and low-grade ovarian serous carcinomas. Mod Pathol. 2009;22:1243–1250. doi: 10.1038/modpathol.2009.92. [DOI] [PMC free article] [PubMed] [Google Scholar]
- 38.Crickard K, Gross JL, Crickard U, Yoonessi M, Lele S, Herblin WF, et al. Basic fibroblast growth factor and receptor expression in human ovarian cancer. Gynecol Oncol. 1994;55:277–284. doi: 10.1006/gyno.1994.1290. [DOI] [PubMed] [Google Scholar]
- 39.Liu-Chittenden Y, Huang B, Shim JS, Chen Q, Lee SJ, Anders RA, et al. Genetic and pharmacological disruption of the TEAD-YAP complex suppresses the oncogenic activity of YAP. Genes Dev. 2012;26:1300–1305. doi: 10.1101/gad.192856.112. [DOI] [PMC free article] [PubMed] [Google Scholar]
- 40.Zhang J, Ji JY, Yu M, Overholtzer M, Smolen GA, Wang R, et al. YAP-dependent induction of amphiregulin identifies a non-cell-autonomous component of the Hippo pathway. Nat Cell Biol. 2009;11:1444–1450. doi: 10.1038/ncb1993. [DOI] [PMC free article] [PubMed] [Google Scholar]
- 41.Yang S, Zhang L, Liu M, Chong R, Ding SJ, Chen Y, et al. CDK1 phosphorylation of YAP promotes mitotic defects and cell motility and is essential for neoplastic transformation. Cancer Res. 2013;73:6722–6733. doi: 10.1158/0008-5472.CAN-13-2049. [DOI] [PMC free article] [PubMed] [Google Scholar]
- 42.Fearon AE, Gould CR, Grose RP. FGFR signalling in women’s cancers. Int J Biochem Cell Biol. 2013;45:2832–2842. doi: 10.1016/j.biocel.2013.09.017. [DOI] [PubMed] [Google Scholar]
- 43.Domcke S, Sinha R, Levine DA, Sander C, Schultz N. Evaluating cell lines as tumour models by comparison of genomic profiles. Nat Commun. 2013;4:2126. doi: 10.1038/ncomms3126. [DOI] [PMC free article] [PubMed] [Google Scholar]
- 44.Friedrich J, Seidel C, Ebner R, Kunz-Schughart LA. Spheroid-based drug screen: considerations and practical approach. Nat Protoc. 2009;4:309–324. doi: 10.1038/nprot.2008.226. [DOI] [PubMed] [Google Scholar]
- 45.Stewart SL, Wike JM, Foster SL, Michaud F. The incidence of primary fallopian tube cancer in the United States. Gynecol Oncol. 2007;107:392–397. doi: 10.1016/j.ygyno.2007.09.018. [DOI] [PubMed] [Google Scholar]
- 46.Crum CP, Drapkin R, Miron A, Ince TA, Muto M, Kindelberger DW, et al. The distal fallopian tube: a new model for pelvic serous carcinogenesis. Curr Opin Obstet Gynecol. 2007;19:3–9. doi: 10.1097/GCO.0b013e328011a21f. [DOI] [PubMed] [Google Scholar]
- 47.Dubeau L, Drapkin R. Coming into focus: the nonovarian origins of ovarian cancer. Ann Oncol. 2013;24(Suppl 8):viii28–viii35. doi: 10.1093/annonc/mdt308. [DOI] [PMC free article] [PubMed] [Google Scholar]
- 48.Levanon K, Crum C, Drapkin R. New insights into the pathogenesis of serous ovarian cancer and its clinical impact. J Clin Oncol. 2008;26:5284–5293. doi: 10.1200/JCO.2008.18.1107. [DOI] [PMC free article] [PubMed] [Google Scholar]
- 49.Dong J, Feldmann G, Huang J, Wu S, Zhang N, Comerford SA, et al. Elucidation of a universal size-control mechanism in Drosophila and mammals. Cell. 2007;130:1120–1133. doi: 10.1016/j.cell.2007.07.019. [DOI] [PMC free article] [PubMed] [Google Scholar]
- 50.Lee KP, Lee JH, Kim TS, Kim TH, Park HD, Byun JS, et al. The Hippo-Salvador pathway restrains hepatic oval cell proliferation, liver size, and liver tumorigenesis. Proc Natl Acad Sci U S A. 2010;107:8248–8253. doi: 10.1073/pnas.0912203107. [DOI] [PMC free article] [PubMed] [Google Scholar]
- 51.Harvey KF, Zhang X, Thomas DM. The Hippo pathway and human cancer. Nat Rev Cancer. 2013;13:246–257. doi: 10.1038/nrc3458. [DOI] [PubMed] [Google Scholar]
- 52.Yuan M, Tomlinson V, Lara R, Holliday D, Chelala C, Harada T, et al. Yes-associated protein (YAP) functions as a tumor suppressor in breast. Cell Death Differ. 2008;15:1752–1759. doi: 10.1038/cdd.2008.108. [DOI] [PubMed] [Google Scholar]
- 53.Strano S, Monti O, Pediconi N, Baccarini A, Fontemaggi G, Lapi E, et al. The transcriptional coactivator Yes-associated protein drives p73 gene-target specificity in response to DNA Damage. Mol Cell. 2005;18:447–459. doi: 10.1016/j.molcel.2005.04.008. [DOI] [PubMed] [Google Scholar]
- 54.Cai H, Xu Y. The role of LPA and YAP signaling in long-term migration of human ovarian cancer cells. Cell Commun Signal. 2013;11:31. doi: 10.1186/1478-811X-11-31. [DOI] [PMC free article] [PubMed] [Google Scholar]
- 55.Kendall SD, Linardic CM, Adam SJ, Counter CM. A network of genetic events sufficient to convert normal human cells to a tumorigenic state. Cancer Res. 2005;65:9824–9828. doi: 10.1158/0008-5472.CAN-05-1543. [DOI] [PubMed] [Google Scholar]
- 56.Shan W, Mercado-Uribe I, Zhang J, Rosen D, Zhang S, Wei J, et al. Mucinous adenocarcinoma developed from human fallopian tube epithelial cells through defined genetic modifications. Cell Cycle. 2012;11:2107–2113. doi: 10.4161/cc.20544. [DOI] [PMC free article] [PubMed] [Google Scholar]
- 57.Cancer Genome Atlas Research N. Integrated genomic analyses of ovarian carcinoma. Nature. 2011;474:609–615. doi: 10.1038/nature10166. [DOI] [PMC free article] [PubMed] [Google Scholar]
- 58.Hwang H, Quenneville L, Yaziji H, Gown AM. Wilms tumor gene product: sensitive and contextually specific marker of serous carcinomas of ovarian surface epithelial origin. Appl Immunohistochem Mol Morphol. 2004;12:122–126. doi: 10.1097/00129039-200406000-00004. [DOI] [PubMed] [Google Scholar]
- 59.Al-Hussaini M, Stockman A, Foster H, McCluggage WG. WT-1 assists in distinguishing ovarian from uterine serous carcinoma and in distinguishing between serous and endometrioid ovarian carcinoma. Histopathology. 2004;44:109–115. doi: 10.1111/j.1365-2559.2004.01787.x. [DOI] [PubMed] [Google Scholar]
- 60.Kim J, Coffey DM, Creighton CJ, Yu Z, Hawkins SM, Matzuk MM. High-grade serous ovarian cancer arises from fallopian tube in a mouse model. Proc Natl Acad Sci U S A. 2012;109:3921–3926. doi: 10.1073/pnas.1117135109. [DOI] [PMC free article] [PubMed] [Google Scholar]
- 61.Sherman-Baust CA, Kuhn E, Valle BL, Shih Ie M, Kurman RJ, Wang TL, et al. A genetically engineered ovarian cancer mouse model based on fallopian tube transformation mimics human high-grade serous carcinoma development. J Pathol. 2014;233:228–237. doi: 10.1002/path.4353. [DOI] [PMC free article] [PubMed] [Google Scholar]
- 62.Dailey L, Ambrosetti D, Mansukhani A, Basilico C. Mechanisms underlying differential responses to FGF signaling. Cytokine Growth Factor Rev. 2005;16:233–247. doi: 10.1016/j.cytogfr.2005.01.007. [DOI] [PubMed] [Google Scholar]
- 63.Eswarakumar VP, Lax I, Schlessinger J. Cellular signaling by fibroblast growth factor receptors. Cytokine Growth Factor Rev. 2005;16:139–149. doi: 10.1016/j.cytogfr.2005.01.001. [DOI] [PubMed] [Google Scholar]
- 64.De Cecco L, Marchionni L, Gariboldi M, Reid JF, Lagonigro MS, Caramuta S, et al. Gene expression profiling of advanced ovarian cancer: characterization of a molecular signature involving fibroblast growth factor 2. Oncogene. 2004;23:8171–8183. doi: 10.1038/sj.onc.1207979. [DOI] [PubMed] [Google Scholar]
- 65.Di Blasio AM, Cremonesi L, Vigano P, Ferrari M, Gospodarowicz D, Vignali M, et al. Basic fibroblast growth factor and its receptor messenger ribonucleic acids are expressed in human ovarian epithelial neoplasms. Am J Obstet Gynecol. 1993;169:1517–1523. doi: 10.1016/0002-9378(93)90428-l. [DOI] [PubMed] [Google Scholar]
- 66.Li T, Jiang S. Effect of bFGF on invasion of ovarian cancer cells through the regulation of Ets-1 and urokinase-type plasminogen activator. Pharm Biol. 2010;48:161–165. doi: 10.3109/13880200903062630. [DOI] [PubMed] [Google Scholar]
- 67.Meyer GE, Yu E, Siegal JA, Petteway JC, Blumenstein BA, Brawer MK. Serum basic fibroblast growth factor in men with and without prostate carcinoma. Cancer. 1995;76:2304–2311. doi: 10.1002/1097-0142(19951201)76:11<2304::aid-cncr2820761119>3.0.co;2-n. [DOI] [PubMed] [Google Scholar]
- 68.Ono I. The effects of basic fibroblast growth factor (bFGF) on the breaking strength of acute incisional wounds. J Dermatol Sci. 2002;29:104–113. doi: 10.1016/s0923-1811(02)00019-1. [DOI] [PubMed] [Google Scholar]
- 69.Beenken A, Mohammadi M. The FGF family: biology, pathophysiology and therapy. Nat Rev Drug Discov. 2009;8:235–253. doi: 10.1038/nrd2792. [DOI] [PMC free article] [PubMed] [Google Scholar]
- 70.Wang C, Roy SK. Expression of E-cadherin and N-cadherin in perinatal hamster ovary: possible involvement in primordial follicle formation and regulation by follicle-stimulating hormone. Endocrinology. 2010;151:2319–2330. doi: 10.1210/en.2009-1489. [DOI] [PMC free article] [PubMed] [Google Scholar]
- 71.Wang C, Lv X, He C, Hua G, Tsai MY, Davis JS. The G-protein-coupled estrogen receptor agonist G-1 suppresses proliferation of ovarian cancer cells by blocking tubulin polymerization. Cell Death Dis. 2013;4:e869. doi: 10.1038/cddis.2013.397. [DOI] [PMC free article] [PubMed] [Google Scholar]
- 72.Wang C, Lv X, Jiang C, Cordes CM, Fu L, Lele SM, et al. Transforming growth factor alpha (TGFalpha) regulates granulosa cell tumor (GCT) cell proliferation and migration through activation of multiple pathways. PLoS One. 2012;7:e48299. doi: 10.1371/journal.pone.0048299. [DOI] [PMC free article] [PubMed] [Google Scholar]
- 73.Siffroi-Fernandez S, Cinaroglu A, Fuhrmann-Panfalone V, Normand G, Bugra K, Sahel J, et al. Acidic fibroblast growth factor (FGF-1) and FGF receptor 1 signaling in human Y79 retinoblastoma. Arch Ophthalmol. 2005;123:368–376. doi: 10.1001/archopht.123.3.368. [DOI] [PubMed] [Google Scholar]
- 74.Krejci P, Krakow D, Mekikian PB, Wilcox WR. Fibroblast growth factors 1, 2, 17, and 19 are the predominant FGF ligands expressed in human fetal growth plate cartilage. Pediatr Res. 2007;61:267–272. doi: 10.1203/pdr.0b013e318030d157. [DOI] [PubMed] [Google Scholar]
- 75.Beaufort CM, Helmijr JC, Piskorz AM, Hoogstraat M, Ruigrok-Ritstier K, Besselink N, et al. Ovarian cancer cell line panel (OCCP): clinical importance of in vitro morphological subtypes. PLoS One. 2014;9:e103988. doi: 10.1371/journal.pone.0103988. [DOI] [PMC free article] [PubMed] [Google Scholar]
Associated Data
This section collects any data citations, data availability statements, or supplementary materials included in this article.