Abstract
Patients with superior canal dehiscence (SCD) suffer from events of dizziness and vertigo in response to sound, also known as Tullio phenomenon (TP). The present work seeks to explain the fluid-dynamical mechanisms behind TP. In accordance with the so-called third window theory, we developed a computational model for the vestibular signal pathway between stapes and SCD. It is based on first principles and accounts for fluid–structure interactions arising between endolymph, perilymph, and membranous labyrinth. The simulation results reveal a wave propagation phenomenon in the membranous canal, leading to two flow phenomena within the endolymph which are in close interaction. First, the periodic deformation of the membranous labyrinth causes oscillating endolymph flow which forces the cupula to oscillate in phase with the sound stimulus. Second, these primary oscillations of the endolymph induce a steady flow component by a phenomenon known as steady streaming. We find that this steady flow of the endolymph is typically in ampullofugal direction. This flow leads to a quasi-steady deflection of the cupula which increases until the driving forces of the steady streaming are balanced by the elastic reaction forces of the cupula, such that the cupula attains a constant deflection amplitude which lasts as long as the sound stimulus. Both response types have been observed in the literature. In a sensitivity study, we obtain an analytical fit which very well matches our simulation results in a relevant parameter range. Finally, we correlate the corresponding eye response (vestibulo-ocular reflex) with the fluid dynamics by a simplified model of lumped system constants. The results reveal a “sweet spot” for TP within the audible sound spectrum. We find that the underlying mechanisms which lead to TP originate primarily from Reynolds stresses in the fluid, which are weaker at lower sound frequencies.
Keywords: superior canal dehiscence, slow-phase eye velocity, fluid–structure interaction, steady streaming, fluid dynamics
INTRODUCTION
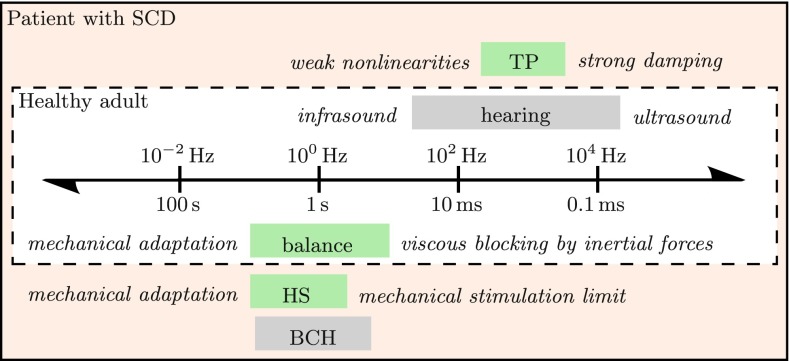
The cavity of the inner ear is filled with endolymph and perilymph which are separated by a thin compliant structure known as the membranous labyrinth. From this point of view, it seems surprising that we can hear sound and sense motion at the same time, given that either sense is based on fluid motions within these two connected fluid spaces. Obviously, there occur two different types of system responses which (usually) do not interact. This is believed to be related to the temporal-scale separation between the two organs of balance and hearing (Obrist 2011), such that the low-frequency limit of hearing (≈20 Hz) is of the same order of magnitude as the frequency of the fastest perceivable angular head motion (≈41 Hz, Van Buskirk et al. 1976).
Patients with a superior canal dehiscence (SCD) are examples of a pathological breakdown of this scale separation (Fig. 1). Minor et al. (1998) found that they typically suffer from sound-induced vertigo, also known as Tullio phenomenon (TP). Sound stimuli within a subrange of the audible spectrum, typically between 500 Hz and 2 kHz at sound intensities of 100–110 dB (Minor 2000), trigger vestibular reactions in the plane of the dehiscent semicircular canal. Through the vestibulo-ocular reflex (VOR), these reactions become visible to the observer when the patient’s eyes perform a vertical–torsional motion during acoustic stimulation (Minor 2000).
FIG. 1.
Temporal-scale separation between hearing and balance in healthy adults, adapted from Fig. 20.1 in Obrist (2011) and supplemented with patho-physiological phenomena from patients with SCD: Tullio phenomenon (TP) from sound, Hennebert sign (HS) from pressure stimuli, and bone conduction hyperacusis (BCH) to body sounds. Mechanisms of vestibular and cochlear origin are shaded in green and gray, respectively.
According to the third window theory, the pathological “window” in the canal (SCD) allows for a redistribution of the stapes-induced oscillating perilymph flow in the vestibular system (Minor 2000; Carey et al. 2000, 2004). This (primary) flow was computationally assessed and quantified by Rosowski et al. (2004), Songer and Rosowski (2007), and Kim et al. (2013). It remains unclear how this strongly oscillatory motion of the perilymph is able to provoke a “tonic response” (slow change) of the cupula afferents’ firing rate as it has been observed by Carey et al. (2004).
The present work aims at finding a mechanistic explanation for TP by means of a computational model. Our model is based on first principles (i.e., basic conservation laws of mass and momentum for the fluid motion) and focuses on fluid–structure interactions (FSI) between the two lymphatic fluids and the elastic membranous labyrinth. We hypothesize that FSI leads to attenuated waves in the membranous labyrinth which propagate towards the SCD (Obrist 2011). This membrane displacement results in the development of an oscillating endolymph flow with a non-zero mean component. The non-zero mean flow is due to a fluid-dynamical phenomenon known as acoustic streaming. It is a nonlinear process through which small periodic oscillations in a fluid (e.g., acoustic waves) can lead to a constant directed flow (Lighthill 1978; Riley 2001; Boluriaan and Morris 2003). Acoustic streaming is closely related to Stokes drift (Andrews and McIntyre 1978) which describes the slow mass transport in the ocean induced by periodic waves. The underlying nonlinear processes of acoustic streaming (and Stokes drift) are inherent to the mechanics of Newtonian fluids (e.g., as described by the Navier–Stokes equations) and do not require any additional modeling. In the context of the inner ear, streaming phenomena (in the cochlea) have already been identified by von Békésy (1960). Further theoretical and computational studies on streaming in the cochlea (Hallauer 1974; Lighthill 1992; Gerstenberger and Wolter 2013; Edom et al. 2014) showed that the well-known traveling waves on the basilar membrane induce a large non-oscillating vortical flow on either side of the basilar membrane which is known as Békésy eddy (see Lesser and Berkley 1972, Figure 4).
The non-zero mean flow in the SCC could provoke cupula deflections which most likely cause the characteristic eye movements in TP. Using simplified mechanical models, we will create a link between these complex fluid-dynamical phenomena and the corresponding slow-phase eye velocity. Our predictions will be compared against available clinical measurements of the characteristic eye response of such patients.
Table 1 shows a glossary for the physical parameters which appear in the following sections.
TABLE 1.
Glossary of symbols in alphabetical order
| Symbol | Definition |
|---|---|
| A e/A p/A s | Endolymph/perilymph/stapes area |
| c | Wave speed |
| E | Young’s modulus |
| f | Sound frequency |
| h | Membranous wall thickness |
| K c | Volumetric cupula stiffness |
| K α | VOR calibration constant |
| L 1 | SCD location |
| L 2 | Slender duct length |
| p e/p p/p s | Endolymph/perilymph/sound pressure |
| r | Radial coordinate |
| r 0/R | Minor/major radius of membranous duct |
| SPL | Sound pressure level |
| T | Sound period |
| t | Time |
| U e | Instantaneous bulk velocity (endolymph) |
| Ū e | Steady streaming bulk velocity (endolymph) |
| U p/U s | Perilymph/velocity amplitude |
| u e/u p | Local endolymph/perilymph velocity |
| Cupula volume displacement | |
| x | Axial coordinate |
| α t | Angular eye velocity |
| ∆p c/∆p s | Pressure difference cupula/membranous wall |
| ϵ p | Pseudo-viscous damping |
| η | Membranous wall displacement |
| λ | Wave length (spatial) |
| ν f | Kinematic fluid viscosity |
| ν s | Poisson’s ratio |
| ρ f | Fluid density |
| ρ s | Membranous wall density |
| σ | Attenuation length |
| τ c | Cupula time constant |
| ϕ | Cochlear fluid fraction |
| ω | Angular sound frequency |
METHODS
In the following, a model is presented which accounts for perilymph and endolymph flow and for the deformation of the membranous labyrinth in the superior semicircular canal. It considers fluid–structure interactions and nonlinear effects within the endolymph flow which we believe are responsible for the generation of a steady endolymph flow component. A detailed documentation of this model can be found in Grieser (2015). The source code of the corresponding numerical solver is available online (Grieser et al. 2015).
Physical Model
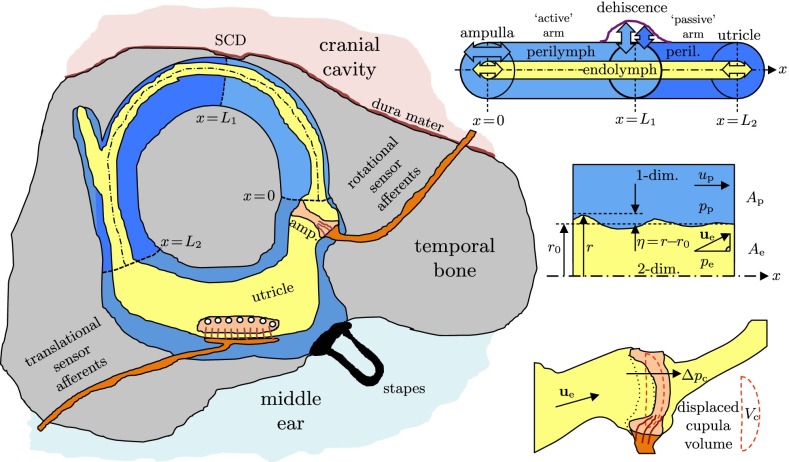
Assuming that the stapes oscillates harmonically with sound frequency f, at least two oscillating fluid columns will form in the perilymph: the fluid column along the physiological signal path leading towards the round window via the cochlear scalae and the fluid column along the pathological signal path(s) towards the SCD along the semicircular canals (SCC). Our model focuses on the most direct pathological pathway whose centerline coordinate we denote by x. After passing the ampulla (x = 0) along the superior canal (SC), the pathway leads directly to the SCD at x = L1 (Fig. 2).
FIG. 2.
Left: physical model of the vestibular system with a dehiscence of bone above the superior canal (SC). Upper right: straightened model of the SC with concentric, circular cross sections of endolymph (EL) and perilymph (PL), confined between the ampulla and the utricle and separated by the elastic membranous labyrinth (ML). Center right: fluid–structure interaction between PL, ML, and EL. Lower right: volume-based cupula model.
Vestibular Flow Induced by the Stapes
We estimate the vestibular perilymph flux by subtracting the cochlear fluid fraction ϕ from the total, stapes-induced flux at the oval window. Here, ϕ is defined as the percentage of the stapes-induced flow which enters the cochlear scalae (the rest enters the vestibular system). This is incorporated into a lumped lever arm model (Grieser 2015, p. 29) with which we can compute the vestibular perilymph velocity amplitudes Up [m/s] as a function of the frequency f and the sound pressure level SPL measured in the ear canal,
| 1 |
This model accounts for the difference between the stapes footplate area As = 3.21 mm2 (Aibara et al. 2001) and the perilymph lumen Ap in the SC which amplifies the stapes velocity. Here, ps is the sound pressure at the stapes given as ps = pref · 10SPL/20dB with pref = 20 μPa. The normalized stapes velocity amplitude Us/ps is also known as the stapes motility which has been determined in cadavers (Kringlebotn and Gundersen 1985) as well as in vivo (Huber et al. 2001; Chien et al. 2009) in human ears for harmonic sound stimuli.
We will find in the following that the value of Up has a direct effect on the intensity of the Tullio phenomenon but not on the character of the underlying physical mechanisms. Therefore, the particular choice for our lumped lever arm model only affects the magnitude of the streaming flow and the resulting nystagmus. It has no effect on the basic structure of the mechanisms behind TP.
Perilymph Dynamics
We assume that the perilymph can be treated as an incompressible fluid and that the temporal bone is rigid. Therefore, any local expansion of the perilymph lumen Ap must be compensated by a contraction of the endolymph lumen Ae = r2π, where r(x,t) is the local minor radius of the membranous labyrinth. From the principle of mass conservation, it follows for the local axial perilymph velocity up(x, t) that
| 2 |
From the conservation of momentum along the axis x, we obtain
| 3 |
where pp denotes the perilymph pressure and ρf its density. Here, a pseudo-viscous damping coefficient ϵp is introduced because we simplify the perilymph as a one-dimensional flow along the centerline x such that viscous effects due to velocity gradients in the radial direction are not intrinsically captured. It can be shown (Grieser 2015, App. A) that this parameter becomes ϵp ≈ ω = 2πf in the limit of high-frequency flows such as in the present problem.
We set the perilymph pressure pp = 0 at x = L1 to model the pathological third window to the cranial cavity by a constant reference pressure. This boundary condition was suggested in Obrist (2011) and has also been used in a computational study by Kim et al. (2013). At this discontinuity, we split the perilymph domain into two parts (cf. Figs. 2 and 4). The “active” arm (0 < x < L1) is directly stimulated by the harmonic stapes forcing, such that we set up(x = 0) = Up cos(ωt) at the boundary towards the ampulla. At the end of the “passive” arm which opens towards the vestibule (x = L2), we impose a vanishing pressure gradient, i.e., ∂pp/∂x = 0, which is a standard boundary condition in computational fluid dynamics for open boundaries.
FIG. 4.
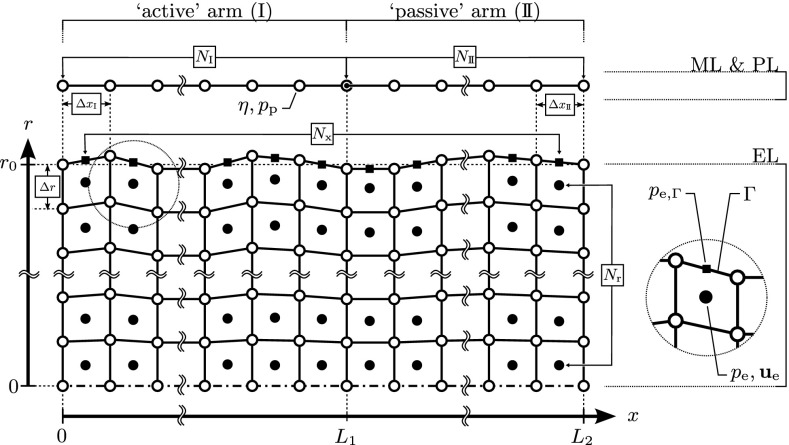
Numerical discretization of the computational domains of membranous labyrinth (ML), perilymph (PL), and endolymph (EL). At the SCD (x = L 1), the coupled, one-dimensional system of ML and PL is split into the “active” (I) and “passive” (II) arms. Each arm is discretized by N equidistant (∆x) vertices (white circle) which represent the computational nodes for ML displacements η and PL pressures p p. The axisymmetric domain of the EL is discretized by an array of N x × N r = 720 × 32 finite volumes in the axial and radial directions, respectively. Center points (black circles) store velocities u e and pressures p e. Face centers (black squares) at the ML interface (Γ) store pressures at the boundary, p e,Γ. Vertices of the EL (white squares) move in the radial direction yet maintain their axial location (coupled to the ML). Figure adapted from Fig. 4.1 in Grieser (2015).
It is worth noting that we are solving the same set of equations for both the active and the passive arms. The wording “passive/active” only refers to the type of stimulation: Whereas the active arm is directly stimulated through a Dirichlet boundary condition at x = 0, the passive arm is only indirectly stimulated through traveling waves in the active arm which carry on beyond the SCD into the passive arm. It may be debated whether this simplification is justified. However, on the basis of the fact that a direct stimulation path for the passive arm needs to pass through the large vestibule with its reservoir character (with correspondingly high damping), the actual contribution of a second stimulation pathway to the overall mechanisms is expected to be negligible.
Membranous Labyrinth
The membranous labyrinth is able to deform under transmural pressures ∆ps = pe − pp where pe and pp are the local pressures in the endolymph and perilymph, respectively. We assume that the membrane can be described as a linear-elastic material with Young’s modulus E and Poisson’s ratio νs. Assuming plane strain in the membrane, the equation of motion for the radial membrane displacement η can be derived according to Gautier et al. (2007) as
| 4 |
with membrane density ρs, membrane thickness h, and membrane radius r0. It is important to note that the value of Young’s modulus in humans has not yet been determined. Rabbitt et al. (1999) estimate a membrane stiffness for fish on the order of 1 kPa, but they point out that inter-animal variations and variations with gender and age for soft tissue stiffness may span more than an order of magnitude. Studies of Gueta et al. (2011) in the tectorial membrane of the cochlea of mice report a Young’s modulus as high as E = 40 kPa. Therefore, we will study the effect of the choice of Young’s modulus over a large range of values.
Endolymph Flow
The fluid dynamics of the endolymph is completely described by the Navier–Stokes equations,
| 5a |
| 5b |
with local endolymph velocity ue, pressure pe, and kinematic viscosity νf. The endolymph density ρf is assumed to be equal to the perilymph density. At the two open model boundaries towards the utricle, we impose a zero axial velocity gradient and constant pressure. At the moving membranous wall, we impose no-slip conditions. The curvature of the SC does not contribute significantly to the flow because the major radius R of the membranous duct is an order of magnitude greater than its minor radius r0, i.e., R ≫ r0. Therefore, we model the endolymph flow as an axisymmetric flow in a straight circular pipe of radius r0, as indicated in Figure 2 (right).
The Navier–Stokes equations already contain a source of nonlinearity due to the presence of the second convective term on the left-hand side of Eq. (5b). Another source of nonlinearity results inherently from the interaction between a flexible membrane (membranous duct) and a viscous fluid (endolymph) as it has been shown by Bradley (2012) and Edom et al. (2014).
Cupula and Eye Response
In the following, we derive simplified model equations for the cupula mechanics and the VOR electro-mechanics to establish a connection between the fluid dynamics of the inner ear and the pathological eye response. In contrast to the fluid-dynamical model which is based on first principles, these equations comprise a sequence of lumped parameter models which are used to relate the fluid-dynamical results to clinical measurements. There is no feedback loop from these models to the fluid-dynamical model in the SCC.
We will find from numerical results that the acoustic stimulation leads to a non-zero mean axial flow of the endolymph which we describe by an axial bulk velocity Ūe. We use Poiseuille’s law to estimate an equivalent transcupular pressure difference ∆pc,
| 6 |
The small deformations of the membranous wall η ≪ r0 have no significant effect on the viscous pressure drop of the mean axial flow component such that Poiseuille’s law is expected to yield good estimates for the transcupular pressure difference.
The cupula may give way to this transcupular pressure difference until it reaches a net displacement volume for which the elastic reaction of the cupula balances the transcupular pressure. This displacement volume may be approximated by a linear-elastic relation
| 7 |
with a volumetric stiffness Kc. Grieser et al. (2014) performed numerical studies on the fluid and solid mechanics of the balance sense in response to video head impulse tests (vHIT). They calibrated the cupula stiffness Kc = 600 GPa/m3 such that the cupula dynamics matches the typical time constant for an exponential decay of around τc ≈ 4.4 s. Therefore, we relate the characteristic eye velocity αt to the volumetric cupula displacement by
| 8 |
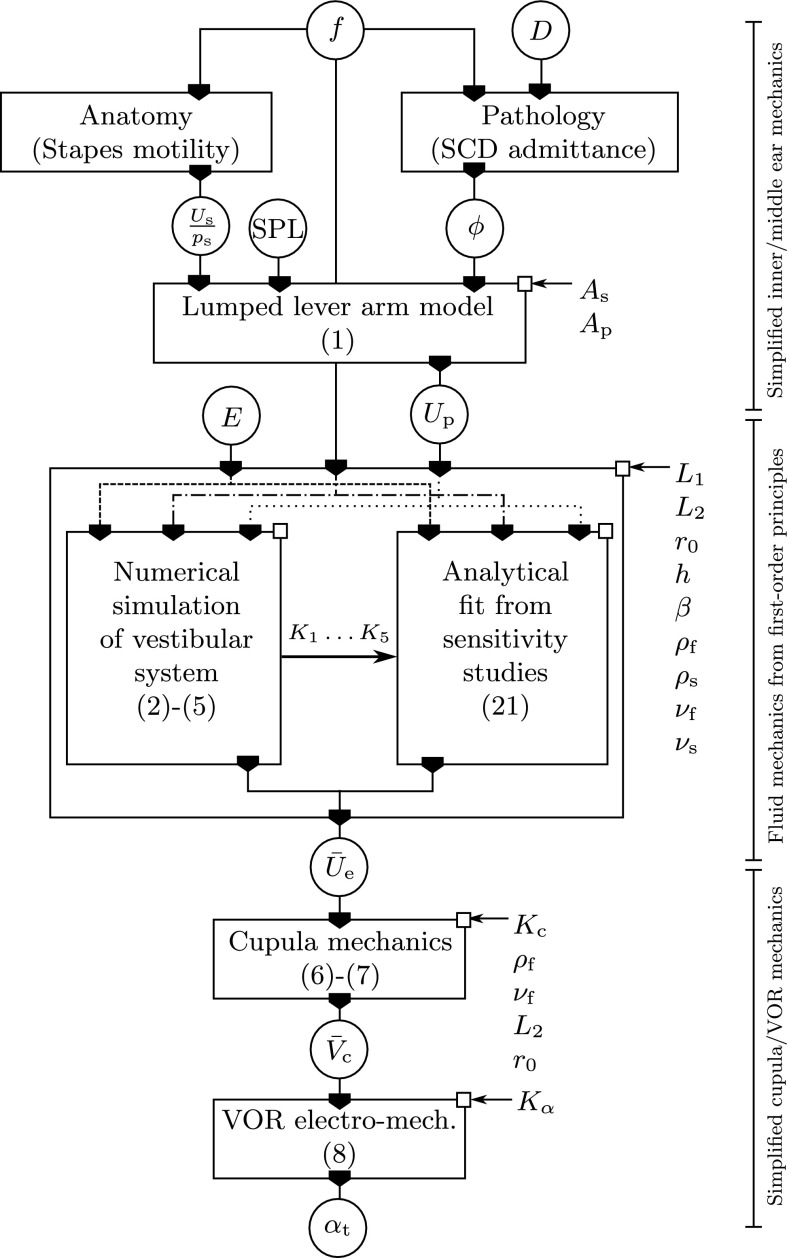
where we use a calibrated proportionality constant Kα ≈ 122°s−1/0.003 mm3 (Grieser 2015, p. 41). Equations (6)–(8) allow us to predict the eye response αt for a steady endolymph streaming with an axial bulk velocity Ūe which is obtained from the numerical simulations of the endolymph flow. A model summary is given in the block diagram in Figure 3.
FIG. 3.
Block diagram displaying the transfer function circuit to model sound-induced vertigo in patients with SCD. Input/output variables (encircled): sound frequency f, sound pressure level SPL, cochlear fluid fraction ϕ, relative radius of the SCD D = r d/r SC (Kim et al. 2013, Fig. A3), stapes motility U s/p s, perilymph velocity amplitude U p, membrane Young’s modulus E, steady endolymph streaming Ū e, cupula displacement volume , and eye velocity α t. All other symbols denote system constants corresponding to the (patho-)anatomy of the individual patient. Center box: an analytical fit of Ū e becomes available after numerical sensitivity studies in the patho-physiological range of interest (E, f, U p).
Numerical Model
The spatial discretization of the computational domains of the perilymph, membranous labyrinth, and endolymph is illustrated in Figure 4. Using the OpenFOAM library (OpenFOAM Foundation 2015), we employ the finite-volume method in the arbitrary Lagrangian Eulerian (ALE) formulation for moving grids. For our set of governing Eqs. (2)–(5), we choose spatial discretization schemes of second order and temporally discretize them with the generalized Crank–Nicolson method.
The FSI coupling procedure which iterates between the membrane displacement η and the endolymph pressure pe follows the Aitken method (Küttler and Wall 2008) by a “Dirichlet–Neumann” approach. Our numerical model is implemented in the solver tullioFoam (Grieser et al. 2015). A full description of the numerical model can be found in Grieser (2015). Table 2 shows the standard parameter values used in the computational setup.
TABLE 2.
Default physical and numerical parameter values of the computational setup
| Symbol | Value |
|---|---|
| r 0 | 160 μm |
| L 1 | 5 mm |
| L 2 | 9 mm |
| h | 20 μm |
| ρ s | 1200 kg/m3 |
| ν s | 0.5 |
| ν f | 10−6 m2/s |
| ρ f | 1000 kg/m3 |
| N I | 400 |
| N II | 320 |
| N r | 32 |
Geometrical quantities and material properties are similar to those given by Curthoys and Oman (1987) and Rabbitt et al. (1999). The parameters N I, N II, and N r indicate the number of grid points in the axial direction for the active (I) and the passive (II) arms and in the radial direction, respectively
RESULTS
Wave Propagation
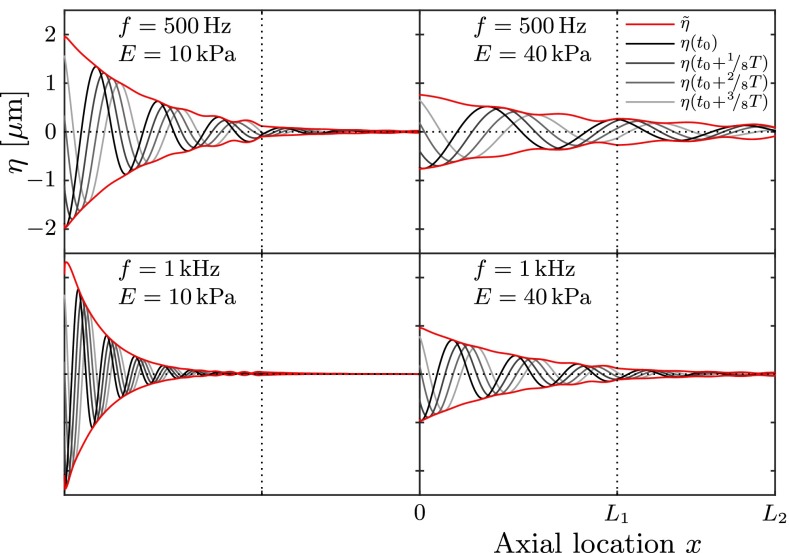
A series of numerical simulations was carried out for harmonic sound stimuli of frequencies f = 0.1 … 4 kHz and sound intensities of SPL < 130 dB. Young’s modulus of the membranous labyrinth ranges within E = 1…100 kPa. The results show that the membranous labyrinth acts as a waveguide within the vestibular system. Waves propagate from the stapes towards the location of the SCD (at x = L1) and decay in amplitude along their path. Figure 5 visualizes the membrane displacement η along the canal length L2 at four consecutive points in time.
FIG. 5.
Wave propagation along the membranous labyrinth. Gray lines correspond to consecutive membrane positions η; the red lines indicate the respective envelope . In all four cases, we applied a perilymph velocity amplitude of U p = 2.6 mm/s.
We find that the maximum deflection ηmax occurs in the vicinity of the stapes (at x = 0) and that it amounts to only a small fraction of the labyrinth’s radius, i.e., ηmax/r0 ≪ 1. According to the theory of Korteweg (1878), the wave speed cK is proportional to the square root of Young’s modulus E, such that the wavelength λ is proportional to . We see this proportionality confirmed in Figure 5 in that the upper left and lower right panels feature the same wavelength.
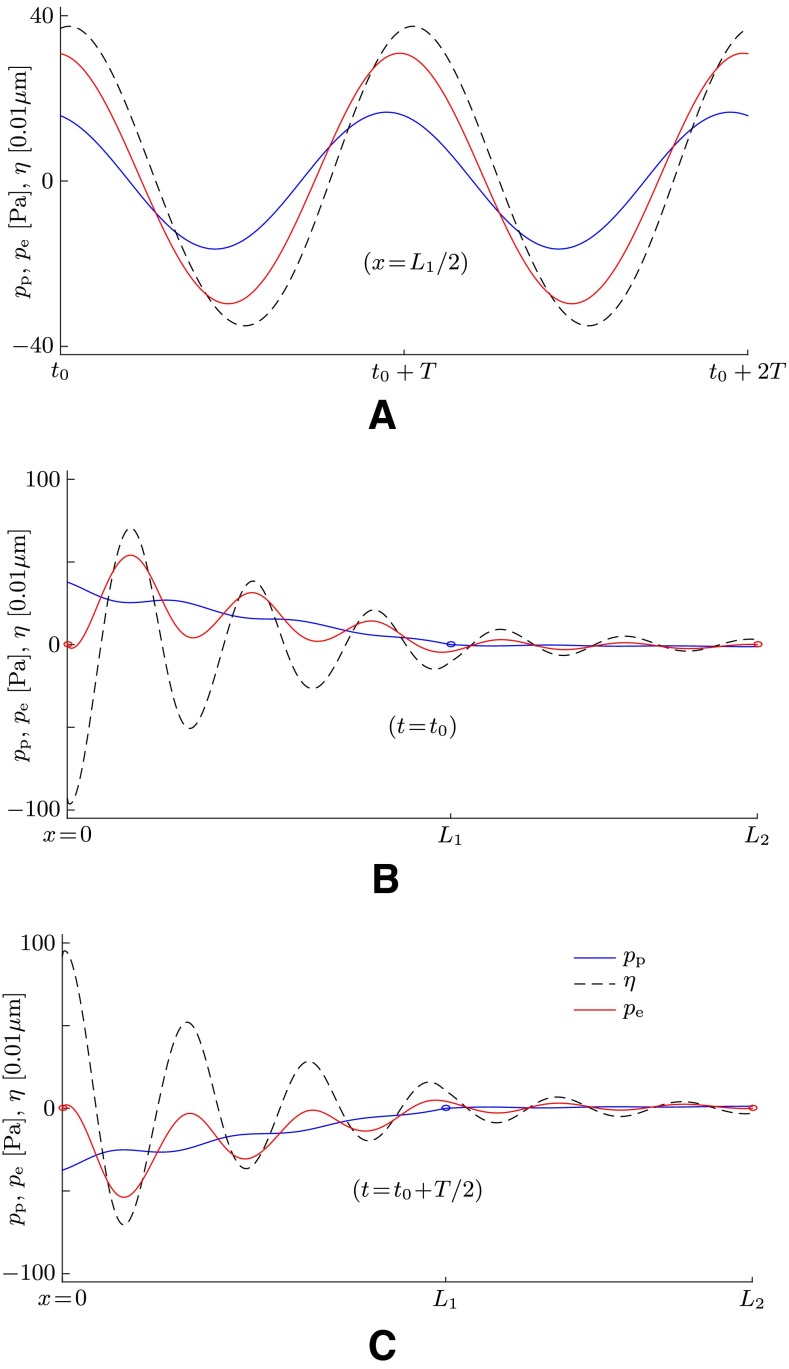
The wave propagation is also illustrated in Figure 6 which shows data at a time when the system has reached a quasi-periodic steady state. We see clearly that waves propagate not only in the membrane structure but also in both lymphs. All waves feature the same frequency (Fig. 6A) as well as the same wavelength λ (Fig. 6B, C).
FIG. 6.
Simulation results for the perilymph pressure p p (blue lines), the membrane displacement η (dashed lines), and the endolymph pressure p e (red lines) for a sound stimulus with f = 1 kHz. The membrane stiffness is set to E = 40 kPa, and the perilymph velocity amplitude is set to U p = 2.6 mm/s at x = 0. A Time series for two successive sound periods T at quasi-periodic steady state at the axial location x = L 1/2. B, C Snapshots at two distinct points in time plotted along x. The blue circles indicate the zero-pressure boundary condition for the perilymph at the location of the SCD (x = L 1); the red circles indicate the zero-pressure boundary condition for the endolymph at the openings towards the utricle (x = 0 and x = L 2).
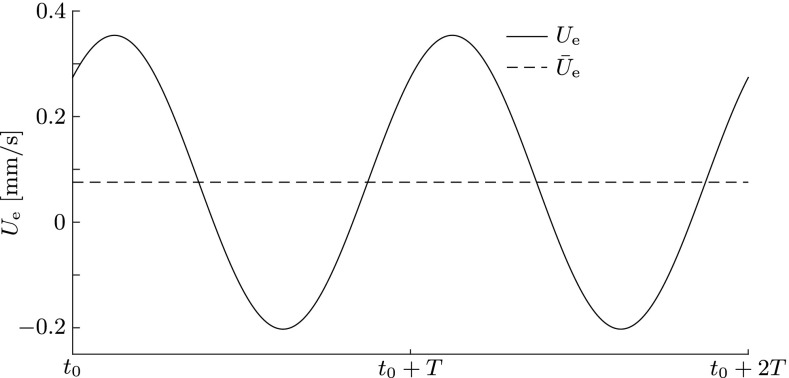
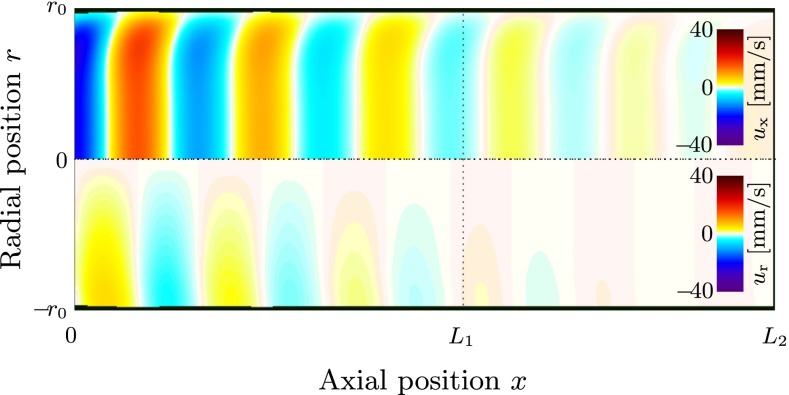
The endolymph responds to the oscillating membranous wall with phased oscillations in the radial and axial directions, as can be seen in Figures 7 and 8. The axial flow pattern in Figure 8 shows classical features of oscillating pipe flow which is also known as Womersley flow (Womersley 1955). This includes a flat velocity profile in the core and thin boundary layers towards the membranous walls. As this flow pattern travels towards the right at wave speed c, endolymph is periodically drawn from and pushed into the utricular chamber (Fig. 7), thereby inevitably displacing the cupula back and forth at the sound frequency to satisfy mass conservation.
FIG. 7.
Bulk velocity U e (solid line) of the endolymph at x = L 2 during two sound periods T at quasi-periodic steady state. The dashed line indicates the temporal mean, i.e., the steady streaming Ū e. Simulation performed at f = 1 kHz, E = 40 kPa, and U p = 2.6 mm/s.
FIG. 8.
Traveling wave in the endolymph at sound frequency f = 1 kHz, Young’s modulus E = 40 kPa, and perilymph velocity amplitude U p = 2.6 mm/s, visualized by a snapshot of the axial endolymph velocity u x (top half, r > 0) and the radial endolymph velocity u r (bottom half, r < 0). The axial velocity profile resembles a Womersley flow profile, featuring thin boundary layers and a constant core flow. This wave pattern travels to the right (in positive x-direction) at constant wave speed c (Fig. 9) while losing amplitude. After a full period T = 1/f, the shown velocity field repeats itself (periodic steady state).
This phase-locking behavior of the cupula in response to sound has also been reported by Carey et al. (2004) who measured irregular cupula afferents in anesthetized and “fenestrated” chinchillas.
Wave Speed
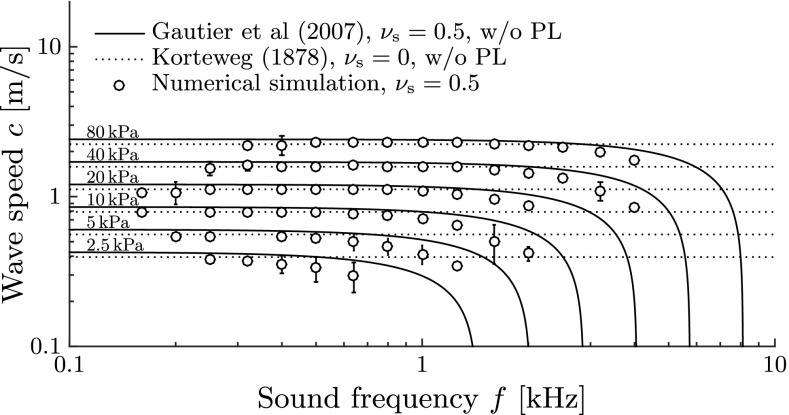
In the absence of the membranous structure, one would expect wavelengths λ = c/f on the order of meters, because the wave speed is then exclusively determined by the speed of sound of the lymphs, cf ≈ 1500 m/s. The presence of the elastic labyrinth, however, adds compliance to the system and causes a dramatic reduction of the effective wave speed and wavelength. The analysis of the numerically predicted wave speeds is shown in Figure 9. Our numerical results fully recover the Korteweg wave speed for low frequencies below the membranous canal’s ring frequency fπ (Gautier et al. 2007) where
| 9 |
FIG. 9.
Speed c of propagating waves along the membranous labyrinth for different Young’s moduli E and sound frequencies f. Continuous lines correspond to the exact solution of the dispersion equation by Gautier et al. (2007) for unstretched membranes. They decay asymptotically to zero speed at the respective ring frequency, f = f π(E) (9). Dotted lines correspond to the Korteweg wave speed c K (Korteweg 1878). The analytical solutions for waves in fluid-filled tubes do not account for a fluid surrounding the tube such as the perilymph (PL). Error bars denote standard deviations from the mean by post-processing N t = T/∆t = 200 snapshots of the simulated membrane shape during one sound period T at periodical steady-state conditions.
For higher stimulus frequencies, these waves become strongly dispersive. Gautier et al. (2007) derived an exact formulation for the wave speed c which is also shown in Figure 9. Our results follow the theoretical predictions by Gautier et al. (2007) quite well but are slightly lower. This small difference can be attributed to the additional mass which the perilymph adds to the system (note that the theories by Korteweg (1878) and by Gautier et al. (2007) only consider fluid-filled tubes without a surrounding fluid like the perilymph).
According to Gautier et al. (2007), there exists a stop band for axial wave propagation which starts at the ring frequency fπ. For frequencies above fπ, the wave speed virtually becomes zero such that we cannot expect any vestibular reaction. Since patients sense vertigo at stimulus frequencies of up to 3 kHz, the ring frequency limit must be located above. Therefore, we conclude from Figure 9 that Young’s modulus of the membranous labyrinth is likely to be larger than 10 kPa.
Wave Attenuation
The waves get attenuated along the canal due to the viscous damping properties of the fluids. The attenuation is characterized by the length σ,
| 10 |
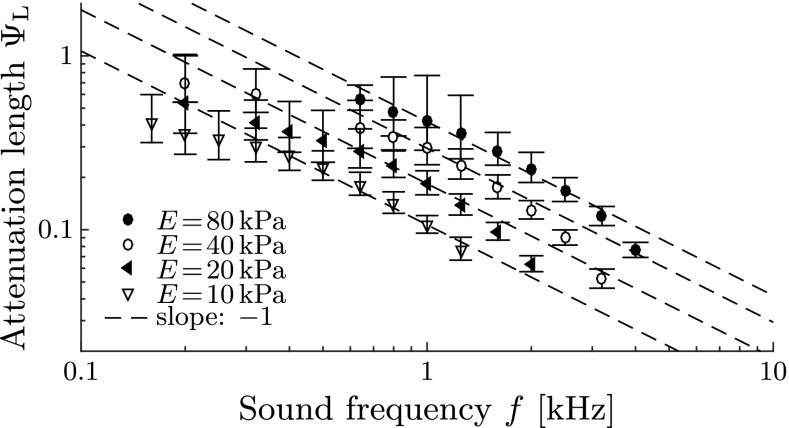
with denoting the displacement amplitudes (shown as red lines in Fig. 5). Shorter attenuation lengths σ correspond to stronger wave attenuation, and vice versa. We find that wave attenuation is stronger at higher sound frequencies (Fig. 10) which corresponds well to the theory of oscillating pipe flow (Womersley 1955).
FIG. 10.
Wave attenuation along the membranous labyrinth. Dimensionless attenuation length ΨL ≡ σ/L 2 for different sound frequencies f and Young’s moduli E, obtained from numerical simulations. Error bars denote standard deviations from the mean by post-processing N t = T/∆t = 200 snapshots of the simulated membrane shape during one sound period T at periodical steady-state conditions.
Steady Streaming in the Endolymph
Local Mean Flow
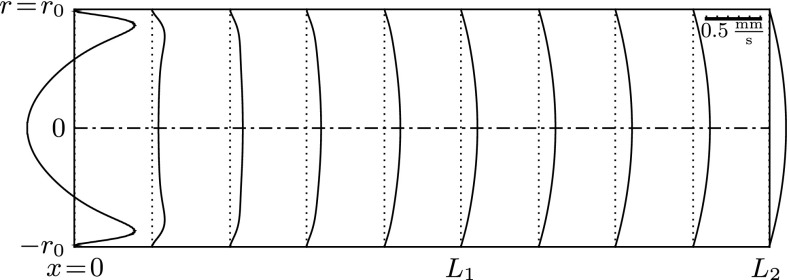
The Lagrangian mean velocity ūe is defined via the distance which a passive fluid tracer particle travels during one period T = 1/f. We see in Figure 11 that ūe resembles Poiseuille flow in most of the canal. Only a small domain in the vicinity of the stapes features a region of backflow. Due to mass conservation, the overall flux through each cross section remains the same such that the backflow is compensated by an even larger flow velocity along the walls towards the SCD. Since Poiseuille flow dominates, we find our assumption for Eq. (6) confirmed.
FIG. 11.
Cross-sectional profiles of the axial Lagrangian mean velocity within the endolymph, ū e. Simulation at sound frequency f = 1 kHz, Young’s modulus E = 40 kPa, and perilymph velocity amplitude U p = 2.6 mm/s.
Bulk Mean Flow
The steady streaming velocity Ūe in the endolymph (dashed line in Fig. 7) is given by the total flux ∫ūedAe divided by the cross-section Ae. The intensity of the resulting eye response, as given by Eqs. (6)–(8), is directly proportional to the streaming velocity. The steady streaming velocity Ūe can be characterized by a dimensionless steady streaming Reynolds number,
| 11 |
Applying the principles of dimensional analysis (e.g., Hornung 2006), we could identify eight dimensionless parameters which completely define our physical model (Grieser 2015, ch. 3). These are the
| 12 |
| 13 |
| 14 |
| 15 |
| 16 |
| 17 |
| 18 |
| 19 |
Using typical values from the literature for the geometrical and material properties of the inner ear (Table 2), we obtain a fluid loading of , a perilymph dominance of β = 10, a density ratio of γ = 1.2, a SCD position of κ1 = 31.25, and a SC length of κ2 = 56.25. We know from dimensional analysis that the steady streaming Reynolds number then can only depend on the remaining three dimensionless parameters Eqs. (12)–(14), i.e., the Womersley number Wo, the ring number Π, and the Reynolds number Re,
| 20 |
We studied this relationship (20) empirically with a series of numerical simulations and applied the following analytical fit (Grieser 2015) to match the obtained data,
| 21 |
This fit was found to be robust within the parameter range of interest, i.e., f = 0.1 … 4 kHz, E = 1 … 100 kPa, and Up = 0 … 10 mm/s with K1 = 1.26, K2 = 0.3, K3 = 6.76, K4 = 0.018, and K5 = 0.1. These constants (K1, …, K5) were specifically calibrated for the aforementioned fixed choices of L, β, γ, κ1, and κ2. Figure 12 demonstrates that Eq. (21) matches our simulation results extremely well, even for a broad spectrum of parameter combinations of f, Up, and E.
FIG. 12.
Simulation results on steady endolymph streaming Ū e for variations of the A sound frequency f, B perilymph velocity amplitude U p, and C Young’s modulus E. In order to demonstrate the robustness of the analytical fit (Eq. 21), a broad spectrum of parameter combinations [f, U p, E] is shown here with the following arbitrary choices for the perilymph amplitude: U p,0 = 2.6 mm/s, U p,1 = 2.1 mm/s, U p,2 = 1.2 mm/s, and U p,3 = 0.9 mm/s. The ring frequency f π (Eq. 9) is indicated by a dotted vertical line in A, marking the onset of a stop band for acoustic wave propagation according to Gautier et al. (2007). Dashed lines correspond to the respective analytical fit. Symbols denote simulation results. Please note that all plot axes are logarithmically scaled, except in C where the steady streaming is plotted on a linear scale.
It can be seen in Figure 12B that the steady streaming scales with the square of the perilymph velocity amplitude Up. This is also explicitly reflected in Eq. (21). In other words, if the sound source that stimulates the vestibular system doubles its intensity, the pathological response increases by a factor of four. Furthermore, Figure 12C shows that an increase in membrane stiffness generally lowers the pathological response.
The perilymph velocity amplitude Up is connected to the sound frequency f and the sound pressure level SPL via the lumped parameter model (Eq. 1). Using patient-specific data from Kringlebotn and Gundersen (1985) on the human stapes motility Us/ps (Chien et al. 2009, Fig. 10, “Human cadaveric”) and incorporating predictions on the pathological fluid fraction ϕ (Kim et al. 2013, Fig. A3, “zero pressure”), we are able to calculate the patient-specific steady streaming directly as a function of the frequency f and Young’s modulus E (or in dimensionless form: Wo and Π).
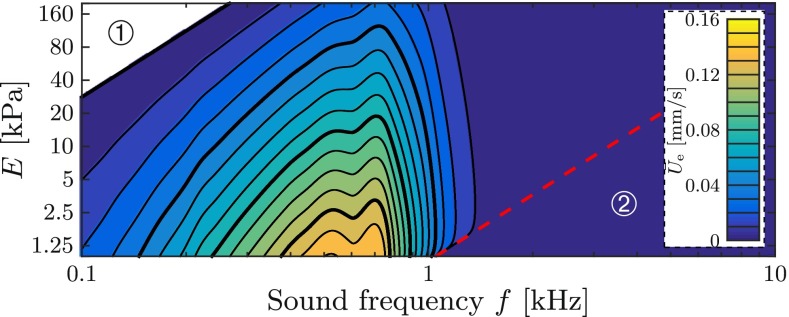
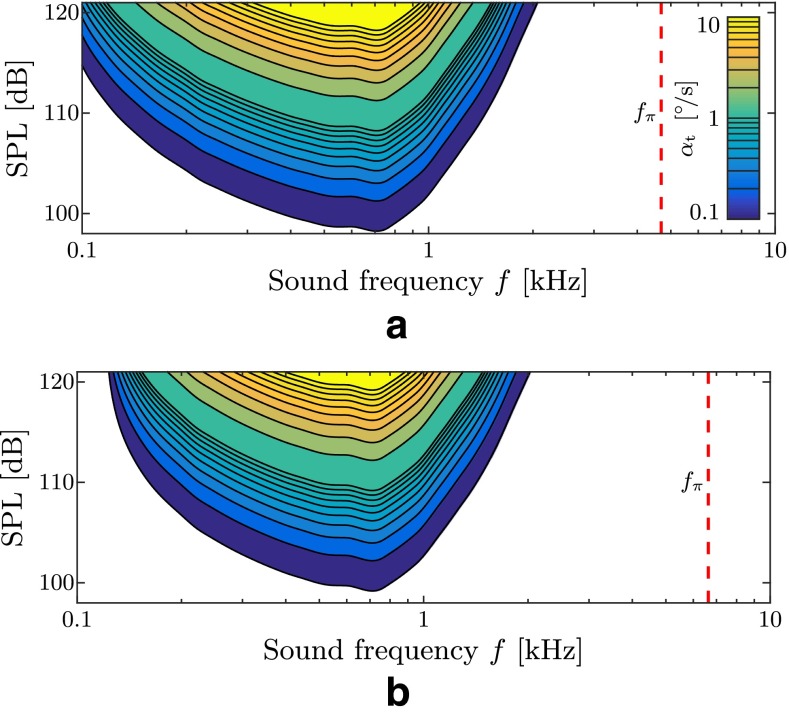
Figure 13 visualizes the steady streaming velocity for these patho-anatomical datasets. We note the existence of a sweet spot for the endolymph streaming at sound frequencies of about 300–1000 Hz. Furthermore, in the region ① of Figure 13, i.e., where Π < K4, the steady streaming is expected to reverse its direction from ampullofugal to ampullopetal. However, this result cannot be confirmed because this region is outside the range of validity of our model. The streaming vanishes for acoustic frequencies higher than the ring frequency (red dashed line), i.e., in region ② where Π > 1. A stiffer membranous labyrinth generally provokes less steady streaming.
FIG. 13.
Contour plot of the steady streaming velocity Ū e in the endolymph according to the analytical fit (Eq. 21) at a sound pressure level of SPL = 120 dB. Ū e vanishes in region 2 (circled digit 2) beyond the dashed red line which corresponds to the ring frequency f π (Eq. 9) and marks the onset of a stop band for plane wave propagation (Gautier et al. 2007). Thick isolines correspond to numbers printed next to the color bar.
We further analyzed the effect of the SCD location and the SC length. Figure 14 shows that a SCD further away from the superior ampulla yields a stronger steady streaming, whereas an increase in the total SC length reduces it.
FIG. 14.
Steady endolymph streaming Ū e for variations in SCD location, L 1, and canal length, L 2, at Young’s modulus E = 40 kPa and perilymph velocity amplitude U p = 2.6 mm/s. Stars refer to the default values in our computational setup.
Sources of Nonlinearity
As already pointed out earlier, nonlinear effects are required to generate steady streaming from oscillatory stimulation. Nonlinearities are contained in the set of governing Eqs. (2)–(5a and 5b) which describe the endolymph and perilymph motion. They arise also from the fluid–structure coupling at the elastic walls of the membranous labyrinth. Such nonlinearities also appear in the cochlea (Edom et al. 2014; Lighthill 1992). Investigating these nonlinear sources, we identify two mechanisms which have a significant effect on the formation of steady streaming within the phenomenologically relevant parameter range.
The so-called Reynolds stresses (Lighthill 1978) vanish if we manually switch “off” the advection term in the endolymph Eq. (5b), i.e., setting (ue · ∇) ue = 0. In consequence, only the FSI-induced nonlinearities are able to provoke the resulting mean endolymph flow (see Bradley 2012, or Edom et al. 2014, section 4.2.1). In a numerical experiment, we eliminated the advection term to demonstrate the effect of the absence of Reynolds stresses on the steady streaming. Figure 15 shows that the Reynolds stresses induce a (ampullofugal) steady streaming of the endolymph which is practically independent of the elasticity of the membranous labyrinth. The FSI-induced amount of steady streaming Ūe, on the other hand, effectively reduces the overall streaming by inducing streaming in the ampullopetal direction which becomes more intense for stiffer membranes.
FIG. 15.
Steady endolymph streaming Ū e from numerical simulations, with and without nonlinear contributions from the advection term in the Navier–Stokes equations (Reynolds stresses). Results are visualized for different Young’s moduli E and sound frequencies f at constant perilymph velocity amplitude, U p, 0 = 2.6 mm/s. The steady streaming which originates from Reynolds stresses is denoted by Ū e|Re (black right-pointing triangles), and is obtained from the difference in Ū e (white right-pointing triangles) when advection was suppressed, i.e., when only steady streaming Ū e|w (black circles) from nonlinearities of the wall motion is present.
Eye Response
Using the derived transfer functions Eqs. (6)–(8), the analytical description Eq. (21) of the sound-induced steady streaming velocity in the endolymph can be used to approximate the corresponding eye velocities αt. In order to reflect physically reasonable anatomical conditions, we use the frequency-dependent stapes motility measurements Us/ps from Kringlebotn and Gundersen (1985) in combination with numerical predictions on the fluid fraction ϕ by Kim et al. (2013), using Eq. (1). This allows us to determine the primary flow velocity amplitude Up in the perilymph for a given sound frequency f at sound pressure level SPL.
Figure 16 shows predictions for five such virtual patients that differ from each other in SCD size (based on the model by Kim et al. 2013) and within a presumable variance of the patient-specific frequency where the stapes motility is greatest. Some eye velocity predictions are of the same order of magnitude as the ones from real patients which we reconstructed from available search coil recordings in the literature (Minor 2000; Cremer et al. 2000; Minor et al. 2001; Minor 2005; Kaski et al. 2012). However, at higher frequencies, our model results fail to reproduce high levels of αt comparable to observations in real patients. Furthermore, we identify the presence of a sweet spot for vestibular reactions in the sound frequency spectrum. This spot may shift according to the individual patient anatomy and generally becomes more prominent for softer membranous labyrinths. Drawing an “activity map” (Fig. 17) for TP, we observe that this sweet spot narrows for stiffer membranous labyrinths.
FIG. 16.
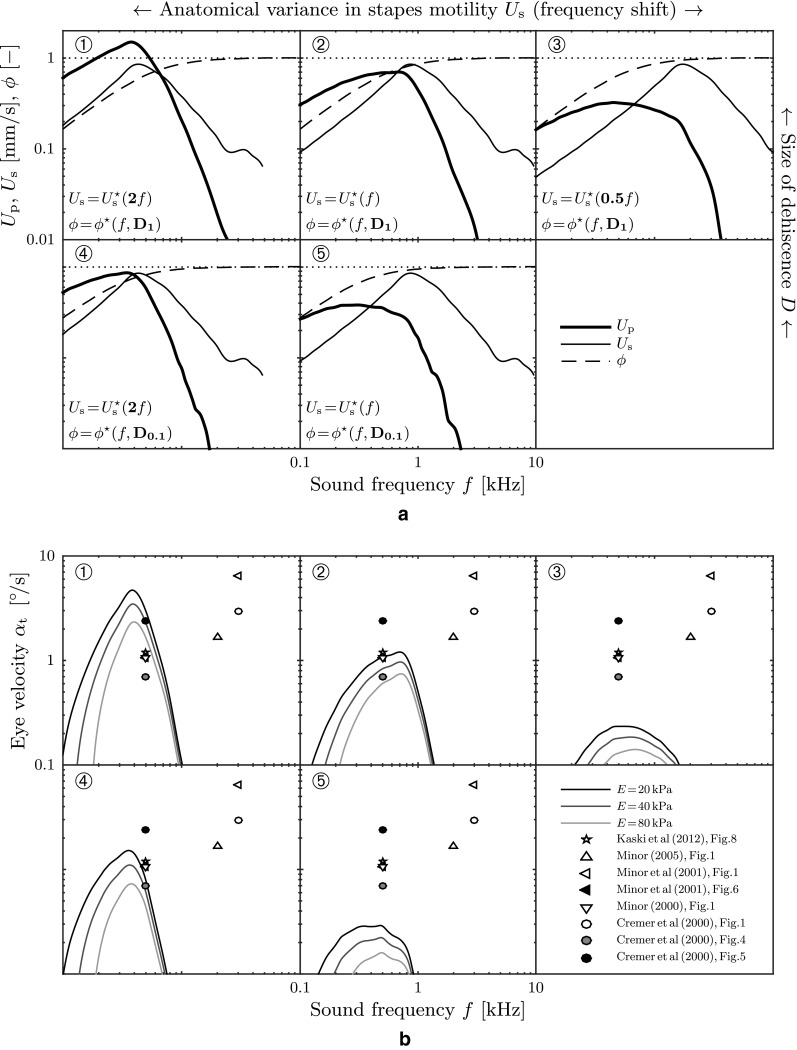
Predicted slow-phase eye velocities α t are shown for five virtual patients (circled digits 1–5). Additionally, measurement data from eight real patients are added. All (virtual and real) patients were exposed to a sound pressure level of SPL = 110 dB. Physio-anatomical conditions are based on stapes motility measurements U ∗s of real humans (Chien et al. 2009, Fig. 10, “Human cadaveric”). SCD pathoanatomy is based on numerical predictions of the fluid fraction ϕ * (Kim et al. 2013, Fig. A3). D denotes the size of the SCD, i.e., D ≡ r d/r SC, where D 1 = 1 and D 0.1 = 0.1. Perilymph velocity amplitudes U p obtained from Eq. (1) with stapes footplate area A s = 3.21 mm2 and perilymph lumen A p = βr 20 π. A Possible scenarios for anatomical conditions in SCD patients. B Corresponding predictions of the slow-phase eye velocities α t for three different values of the membrane stiffness E.
FIG. 17.
Activity map of the Tullio phenomenon for virtual patient 2 (circled digit 2) from Figure 16. Contour plots of the slow-phase eye velocity α t correspond to our model predictions. The dashed red lines correspond to the ring frequency f π (Eq. 9), marking the onset of a stop band region for plane wave propagation (Gautier et al. 2007). A E = 20 kPa. B E = 40 kPa.
DISCUSSION
Wave Propagation and Attenuation
The numerical simulation results have shown that in the presence of a SCD, stapes oscillation leads to traveling waves along the membranous labyrinth. These waves travel with a speed of about c ≈ 1–3 m/s towards the SCD where they get partly reflected. It may be remarked here that these waves propagate about two to three orders of magnitude slower than acoustic waves in the lymphs, resulting in shorter wavelengths on the order of millimeters.
Due to the high-frequency oscillations of the lymphatic fluids, a Womersley-type flow develops. Such a flow is characterized by strong velocity gradients at the walls and an almost gradient-free core flow, as it can be seen in Figure 8. The thickness of a Womersley boundary layer scales with (Womersley 1955), leading to extremely thin boundary layers (with respect to the canal’s minor radius r0) and causing high wall shear stress. Given these flow characteristics, it is not surprising to see (Fig. 10) that higher sound frequencies yield stronger wave attenuation due to higher viscous losses in thinner boundary layers. Approaching the upper limit for wave propagation, i.e., when the sound frequency f reaches the ring frequency fπ ≈ 4 − 6 kHz of the membranous canal, we observe that the wave attenuation is so strong that the labyrinth’s deformation only affects an insignificantly small area of the total membrane surface. Evidently, such a stimulation would be incapable of creating a pathologic response.
In contrast to that, low sound frequencies f < 100 Hz result in long wavelengths which may exceed the canal dimensions. Such waves lack the necessary “unsteadiness” (the Womersley number is too low) to generate a steady streaming within the endolymph. Between these two limits, an optimum frequency exists at which wave attenuation is weak enough such that a large portion of the membrane surface gets deformed, yet the frequencies are high enough to provide the necessary unsteadiness to the flow. This optimum can shift according to the individual (patho-)anatomy of the patient.
Steady Streaming Mechanisms
There exist two different groups of mechanisms which have an impact on the pathological sensation of sound-induced vertigo. In the following, we will distinguish mechanisms which generate a steady streaming from the ones which modulate its intensity.
Mechanisms That Generate Steady Streaming
Our results have shown that steady streaming in the endolymph originates from two different mechanisms. The largest contribution was found to come from the Reynolds stresses in the endolymph (Fig. 15). Nearly independent of the membrane stiffness E, these stresses drive a non-zero mean flow in the ampullofugal direction. In contrast, the nonlinearities which arise from FSI at the membranous walls strongly depend on E and counteract the steady streaming from the Reynolds stresses. At frequencies f ≪ 500 Hz, the FSI-induced streaming practically vanishes.
Mechanisms That Modulate Steady Streaming
There are several factors which modulate the intensity of the steady streaming. Our results show that the dominant mechanisms relate to the patho-anatomy of the patient. Measurements of the stapes motility Us/ps indicate that the stapes oscillates at the largest velocity amplitudes for sound stimuli between approximately 800 Hz and 2 kHz (Kringlebotn and Gundersen 1985; Huber et al. 2001; Chien et al. 2009). According to predictions for the fluid fraction ϕ by Kim et al. (2013), a larger percentage of the stapes-induced flow enters the vestibular ducts at lower frequencies, whereas higher sound frequencies favor a stimulation of the cochlear ducts. Since the steady streaming was found to scale with the square of the perilymph velocity amplitude Up (see Eq. (21) with Eq. (14)), patho-anatomical sensitivity peaks of Up get amplified even stronger and result in a band pass for pathologic reactions.
Another mechanism (already mentioned earlier) relates to the stiffness of the membranous labyrinth. It determines the frequency range in which wave attenuation is optimal such that a largest-possible part of the membranous canal deforms at smallest-possible wavelengths. We found that this optimal frequency range shifts towards higher frequencies for stiffer membranes.
Predictions on the Eye Response
A conceivable measure for the severity of vertigo in response to sound may be the patient’s slow-phase eye velocity αt. Using Eqs. (1), (6)–(8), (12)–(14), and (21) we obtained an analytical description for αt as a function of the sound properties (f, SPL), but also of the membrane stiffness E which has not yet been quantified reliably for humans. Our results show that an increase of the membrane stiffness would significantly reduce the intensity of vestibular reactions, as well as it would narrow the frequency range in which they are strongest (“sweet spot,” Fig. 17). We find that our predictions of αt are able to reproduce some of the reported patient data from the literature (Fig. 16). The agreement with patient data is poor for higher frequencies where we approach the limits of our computational model.
Model Limitations
The computational model reaches its limits as the sound frequency approaches the ring frequency (i.e., where Π = 1). There, strong interdependencies occur with longitudinal and azimuthal waves in the membranous labyrinth which our model does not consider. This could also explain why our model underpredicts patient responses at high frequencies (2–4 kHz). Additionally, such frequencies yield relatively short wavelengths λ ≪ L2. It then requires even greater numerical efforts to spatially resolve these which renders a timely solution virtually impossible. In the other extreme, at frequencies f < 200 Hz, we observe that the wavelengths reach the canal dimensions L2 such that the numerical solution procedure fails to converge. As we neglected the second direct stimulation pathway through the passive arm, some corresponding effects might not have been captured by our model.
Further limitations relate to the simplifications made for the cupula and VOR mechanics. In reality, these systems behave like band passes which are usually tuned to their natural operating range. Therefore, additional nonlinear effects may come into play which, e.g., our linear cupula model may not be able to capture.
Finally, we would like to point out again that the quantitative results for the streaming velocity (and subsequently the resulting eye velocities) depend on the particular choice of our lumped lever arm model. This model is driven by the stapes velocity which has been obtained from measurements in inner ears without SCD. Recent work by Pisano et al. (2012) and Niesten et al. (2015) suggests that these stapes velocities do not accurately describe the overall pressure distribution in the inner ear and the associated perilymph flux in the presence of SCD. More sophisticated modeling of the perilymph velocity amplitudes Up according to results by Pisano et al. (2012) and Niesten et al. (2015) could lead to improved quantitative predictions for the eye velocity. Nevertheless, the principal result of the present work, i.e., that acoustic stimulation creates a steady endolymph flow, will not be affected by this.
CONCLUDING REMARKS
This work focuses on the fluid dynamics of the inner ear and simplifies all other connected mechanisms (middle ear mechanics, shape of SCD, cupula mechanics, VOR) to some extent such that the fluid-dynamical results can be translated to clinically measureable values such as the eye motion αt and ultimately compared to patient data. Numerical results indicate that our traveling wave hypothesis may serve as an explanation for TP. In the presence of a pathological window in the vestibular system, an unnatural flow of perilymph develops in the canals which triggers the evolution of traveling waves along the membranous duct. Owing to the fact that the membranous walls add compliance to the vestibular system, the effective wave speed is found to be up to three orders of magnitude lower than the speed of acoustic waves, rendering the canal dynamics sensitive to sound-induced (primary) flows. Analyzing the numerical results, we identify the nonlinear mechanisms which lead to a steady streaming phenomenon in the endolymph. Based on these findings, we establish an analytical expression (21) calibrated for a specific set of parameters. It represents an empirical model for TP and quantitatively predicts the intensity of TP as a function of various parameters such as the stiffness of the membranous labyrinth, the sound frequency, the sound pressure level, and the SCD size and position. If ways can be found to stiffen the membranous superior canal, our findings suggest that the pathological response could be alleviated significantly. As the membrane stiffness E plays such an important role, its value should be measured reliably. Further experimental research could be done by, e.g., exposing a patient with SCD to a series of frequencies (i.e., by a slow tone sweep) in order to analyze αt as a function of the sound frequency f. This could then be compared to our predictions in Figure 16B to further validate the model.
Acknowledgments
The work of B. Grieser was supported by the Swiss National Science Foundation (SNSF, Grant No. 205321-138298). The authors would like to thank Prof. J. Dual for helpful remarks, C.-F. Benner for his support in the course of a master’s thesis (Benner 2015), and Dr. S. Hegemann for introducing them to the Tullio phenomenon.
Compliance with Ethical Standards
Conflict of Interest
The authors declare that they have no competing interests.
Contributor Information
Bernhard J. Grieser, Email: grieserb@ethz.ch
Leonhard Kleiser, Email: kleiser@ifd.mavt.ethz.ch.
Dominik Obrist, Phone: +41-31-632-7602, Email: dominik.obrist@artorg.unibe.ch.
References
- Aibara R, Welsh JT, Puria S, Goode RL. Human middle-ear sound transfer function and cochlear input impedance. Hear Res. 2001;152(1–2):100–109. doi: 10.1016/S0378-5955(00)00240-9. [DOI] [PubMed] [Google Scholar]
- Andrews DG, McIntyre ME. An exact theory of nonlinear waves on a Lagrangian-mean flow. J Fluid Mech. 1978;89(4):609–646. doi: 10.1017/S0022112078002773. [DOI] [Google Scholar]
- Benner CF (2015) Fluid-dynamic study of sound-induced vertigo. Master thesis, Institute of Fluid Dynamics, ETH Zürich, doi:10.3929/ethz-a-010395756
- Boluriaan S, Morris PJ. Acoustic streaming: from Rayleigh to today. Int J Aeroacoust. 2003;2(3):255–292. doi: 10.1260/147547203322986142. [DOI] [Google Scholar]
- Bradley C. Acoustic streaming field structure. Part II. Examples that include boundary-driven flow. J Acoust Soc Am. 2012;131(1):13–23. doi: 10.1121/1.3664098. [DOI] [PubMed] [Google Scholar]
- Carey JP, Minor LB, Nager GT. Dehiscence or thinning of bone overlying the superior semicircular canal in a temporal bone survey. Arch Otolaryngol Head Neck Surg. 2000;126(2):137–147. doi: 10.1001/archotol.126.2.137. [DOI] [PubMed] [Google Scholar]
- Carey JP, Hirvonen TP, Hullar TE, Minor LB. Acoustic responses of vestibular afferents in a model of superior canal dehiscence. Otol Neurotol. 2004;25(3):345–352. doi: 10.1097/00129492-200405000-00024. [DOI] [PubMed] [Google Scholar]
- Chien W, Rosowski JJ, Ravicz ME, Rauch SD, Smullen J, Merchant SN. Measurements of stapes velocity in live human ears. Hear Res. 2009;249(1–2):54–61. doi: 10.1016/j.heares.2008.11.011. [DOI] [PMC free article] [PubMed] [Google Scholar]
- Cremer P, Minor L, Carey J, Della Santina C. Eye movements in patients with superior canal dehiscence syndrome align with the abnormal canal. Neurology. 2000;55(12):1833–1841. doi: 10.1212/WNL.55.12.1833. [DOI] [PubMed] [Google Scholar]
- Curthoys IS, Oman CM. Dimensions of the horizontal semicircular duct, ampulla and utricle in the human. Acta Otolaryngol. 1987;103(3–4):254–261. doi: 10.3109/00016488709107280. [DOI] [PubMed] [Google Scholar]
- Edom E, Obrist D, Kleiser L. Steady streaming in a two-dimensional box model of a passive cochlea. J Fluid Mech. 2014;753:254–278. doi: 10.1017/jfm.2014.360. [DOI] [Google Scholar]
- Gautier F, Gilbert J, Dalmont JP, Picó Vila R. Wave propagation in a fluid-filled cylindrical membrane. Acta Acust. 2007;93:333–344. [Google Scholar]
- Gerstenberger C, Wolter FE. Numerical simulation of acoustic streaming within the cochlea. J Comput Acoust. 2013;21(4:1350019):1–37. [Google Scholar]
- Grieser B (2015) Fluid-mechanical model for vestibular responses to sound in presence of a superior canal dehiscence. PhD Thesis, ETH Zürich, Dissertation No. 22681, available online
- Grieser B, McGarvie LA, Kleiser L, Manzari L, Obrist D, Curthoys IS. Numerical investigations of the effects of endolymphatic hydrops on the VOR response. J Vestib Res. 2014;24(2–3):219. [Google Scholar]
- Grieser B, Kleiser L, Obrist D (2015) tullioFoam—a numerical model of the Tullio phenomenon. ETH E- Collections ETH Zürich, doi:10.3929/ethz-a-10435235
- Gueta R, Levitt J, Xia A, Katz O, Oghalai JS, Rousso I. Structural and mechanical analysis of tectorial membrane Tecta mutants. Biophys J. 2011;100(10):2530–2538. doi: 10.1016/j.bpj.2011.04.024. [DOI] [PMC free article] [PubMed] [Google Scholar]
- Hallauer WM (1974) Nonlinear mechanical behavior of the cochlea. PhD Thesis, Stanford University
- Hornung HG. Dimensional analysis: examples of the use of symmetry. Mineola: Dover Publications Inc; 2006. [Google Scholar]
- Huber A, Linder T, Ferrazzini M, Schmid S, Dillier N, Stoeckli S, Fisch U. Intraoperative assessment of stapes movement. Ann Otol Rhinol Laryngol. 2001;110(1):31–35. doi: 10.1177/000348940111000106. [DOI] [PubMed] [Google Scholar]
- Kaski D, Davies R, Luxon L, Bronstein AM, Rudge P. The Tullio phenomenon: a neurologically neglected presentation. J Neurol. 2012;259(1):4–21. doi: 10.1007/s00415-011-6130-x. [DOI] [PubMed] [Google Scholar]
- Kim N, Steele CR, Puria S. Superior-semicircular-canal dehiscence: effects of location, shape, and size on sound conduction. Hear Res. 2013;301:72–84. doi: 10.1016/j.heares.2013.03.008. [DOI] [PMC free article] [PubMed] [Google Scholar]
- Korteweg DJ. Über die Fortpflanzungsgeschwindigkeit des Schalles in elastischen Röhren. Ann Phys. 1878;241(12):525–542. doi: 10.1002/andp.18782411206. [DOI] [Google Scholar]
- Kringlebotn M, Gundersen T. Frequency characteristics of the middle ear. J Acoust Soc Am. 1985;77(1):159–164. doi: 10.1121/1.392280. [DOI] [PubMed] [Google Scholar]
- Küttler U, Wall W. Fixed-point fluid–structure interaction solvers with dynamic relaxation. Comput Mech. 2008;43(1):61–72. doi: 10.1007/s00466-008-0255-5. [DOI] [Google Scholar]
- Lesser MB, Berkley DA. Fluid mechanics of the cochlea. Part 1. J Fluid Mech. 1972;51(3):497–512. doi: 10.1017/S0022112072002320. [DOI] [Google Scholar]
- Lighthill J. Acoustic streaming. J Sound Vib. 1978;61(3):391–418. doi: 10.1016/0022-460X(78)90388-7. [DOI] [Google Scholar]
- Lighthill J. Acoustic streaming in the ear itself. J Fluid Mech. 1992;239:551–606. doi: 10.1017/S0022112092004531. [DOI] [Google Scholar]
- Minor LB. Superior canal dehiscence syndrome. Am J Otol. 2000;21(1):9–19. doi: 10.1016/S0196-0709(00)80105-2. [DOI] [PubMed] [Google Scholar]
- Minor LB. Clinical manifestations of superior semicircular canal dehiscence. Laryngoscope. 2005;115(10):1717–1727. doi: 10.1097/01.mlg.0000178324.55729.b7. [DOI] [PubMed] [Google Scholar]
- Minor LB, Solomon D, Zinreich SJ, Zee DS. Sound-and/or pressure-induced vertigo due to bone dehiscence of the superior semicircular canal. Arch Otolaryngol Head Neck Surg. 1998;124(3):249–258. doi: 10.1001/archotol.124.3.249. [DOI] [PubMed] [Google Scholar]
- Minor LB, Cremer PD, Carey JP, Della Santina CC, Streubel SO, Weg N. Symptoms and signs in superior canal dehiscence syndrome. Ann N Y Acad Sci. 2001;942(410):259–273. doi: 10.1111/j.1749-6632.2001.tb03751.x. [DOI] [PubMed] [Google Scholar]
- Niesten MEF, Stieger C, Lee DJ, Merchant JP, Grolman W, Rosowski JJ, Nakajima HH. Assessment of the effects of superior canal dehiscence location and size on intracochlear sound pressures. Audiol Neuro Otol. 2015;20(1):62–71. doi: 10.1159/000366512. [DOI] [PMC free article] [PubMed] [Google Scholar]
- Obrist D. Fluid mechanics of the inner ear. Habilitation treatise. Zürich: ETH Zürich; 2011. [Google Scholar]
- OpenFOAM Foundation (2015) OpenFOAM project web page. http://www.openfoam.org. Accessed 7 Feb 2015
- Pisano DV, Niesten MEF, Merchant SN, Nakajima HH. The effect of superior semicircular canal dehiscence on intracochlear sound pressures. Audiol Neuro Otol. 2012;17(5):338–348. doi: 10.1159/000339653. [DOI] [PMC free article] [PubMed] [Google Scholar]
- Rabbitt RD, Boyle R, Highstein SM. Influence of surgical plugging on horizontal semicircular canal mechanics and afferent response dynamics. J Neurophysiol. 1999;82(2):1033–1053. doi: 10.1152/jn.1999.82.2.1033. [DOI] [PubMed] [Google Scholar]
- Riley N. Steady streaming. Annu Rev Fluid Mech. 2001;33(1):43–65. doi: 10.1146/annurev.fluid.33.1.43. [DOI] [Google Scholar]
- Rosowski JJ, Songer JE, Nakajima HH, Brinsko KM, Merchant SN. Clinical, experimental, and theoretical investigations of the effect of superior semicircular canal dehiscence on hearing mechanisms. Otol Neurotol. 2004;25:323–332. doi: 10.1097/00129492-200405000-00021. [DOI] [PubMed] [Google Scholar]
- Songer JE, Rosowski JJ. A mechano-acoustic model of the effect of superior canal dehiscence on hearing in chinchilla. J Acoust Soc Am. 2007;122(2):943–951. doi: 10.1121/1.2747158. [DOI] [PMC free article] [PubMed] [Google Scholar]
- Van Buskirk WC, Watts RG, Liu YK. The fluid mechanics of the semicircular canals. J Fluid Mech. 1976;78(01):87–98. doi: 10.1017/S0022112076002346. [DOI] [Google Scholar]
- von Békésy G. Experiments in hearing. New York: McGraw-Hill; 1960. [Google Scholar]
- Womersley JR. Method for the calculation of velocity, rate of flow and viscous drag in arteries when the pressure gradient is known. J Physiol. 1955;127(3):553–563. doi: 10.1113/jphysiol.1955.sp005276. [DOI] [PMC free article] [PubMed] [Google Scholar]


