Abstract
The ability to fluorescently label microtubules in live cells has enabled numerous studies of motile and mitotic processes. Such studies are particularly useful in budding yeast due to the ease with which they can be genetically manipulated and imaged by live cell fluorescence microscopy. Due to problems associated with fusing genes encoding fluorescent proteins (FPs) to the native a-tubulin (TUB1) gene, the FP-Tub1 fusion is generally integrated into the genome such that the endogenous TUB1 locus is left intact. Although such modifications have no apparent consequences on cell viability, it is unknown if these genome integrated FP-tubulin fusions negatively affect microtubule functions. Thus, a simple, economical, and highly sensitive assay of microtubule function is required. Furthermore, the current plasmids available for generation of FP-Tub1 fusions have not kept pace with the development of improved FPs. Here, we have developed a simple and sensitive assay of microtubule function that is sufficient to identify microtubule defects that were not apparent by fluorescence microscopy or cell growth assays. Using results obtained from this assay, we have engineered a new family of thirty FP-Tub1 plasmids that employ various improved FPs and numerous selectable markers that upon genome integration have no apparent defect on microtubule function.
Keywords: Tub1, tubulin, microtubules, fluorescent proteins, budding yeast
INTRODUCTION
Cytoskeletal studies performed in the budding yeast Saccharomyces cerevisiae have revealed many crucial insights into phenomena that are well conserved in higher eukaryotic organisms. The genetic tractability of this organism combined with the ease with which they can be imaged by fluorescence microscopy makes them ideal and powerful tools for live cell studies. A key aspect of their utility is the ability to target specific regions of their genome for homologous recombination-mediated gene modification. For instance, fluorescent tagging of endogenous genes allows for live cell fluorescence imaging of various cytoskeletal structures (1-4). Such techniques have revealed insights into processes ranging from endocytosis to cell division (5-9). In some cases, however, such as in the case of actin and tubulin, fluorescent tagging of endogenous genes can disrupt protein function, leading to cytoskeletal defects, or even cell death (10). Thus, alternative strategies have been used over the years to tag such components. In the case of tubulin tagging, plasmids with fluorescent protein (FP)-Tub1 (α-tubulin) fusion cassettes are integrated into the genome such that the endogenous TUB1 open reading frame is left intact. Subsequent to FP-TUB1 plasmid integration, the cells express two copies of TUB1: the native, untagged copy, and a tagged version. Previous studies have shown this to be critical (11), since FP-TUB1 does not complement a TUB1 deletion, presumably because microtubules have a limited threshold of tolerance for lattice-incorporated FP-tagged tubulin (12). In most cases, since the cells remain viable following plasmid integration, it is not understood what function, if any, has been perturbed by the tagged FP.
Here, we set out to test the effects different integrated FP-TUB1 plasmids have on microtubule function as judged by growth defects due to synthetic interaction with bim1Δ or bik1Δ. Although the choice of FP has little effect, we find that the site of plasmid integration can significantly contribute to growth defects. Our findings allowed us to develop a new family of FP-TUB1 plasmids with a standard method for integration at the TUB1 locus. To further improve the utility of these constructs, we utilized bright and photostable FPs that span the spectrum of fluorescent molecules, as well as mEos2, a green-to-red photoconvertible FP that is useful for protein dynamics studies. To expand their versatility, we combined each FP-Tub1 fusion with multiple selectable markers, thus offering a variety of options for fluorescence-based live cell imaging of microtubules.
RESULTS AND DISCUSSION
Site-specific integration of an FP-Tub1 construct differentially affects microtubule function
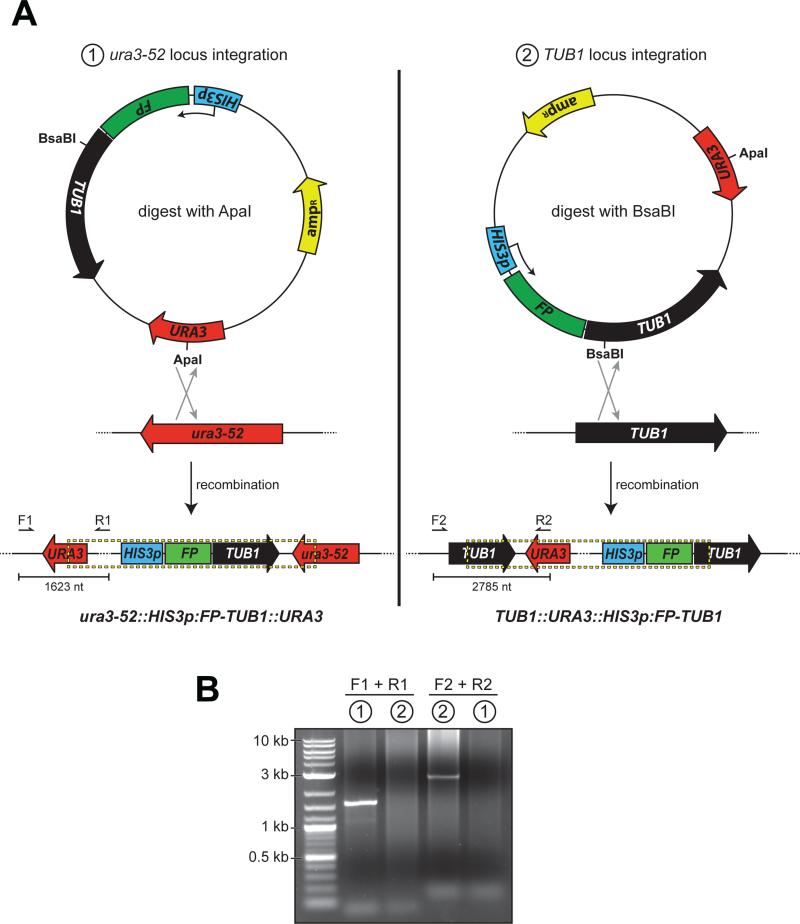
Previous strategies to label microtubules in budding yeast have employed homologous recombination to integrate a fluorescent protein (FP)-Tub1 expressing plasmid into the URA3 locus (9, 13, 14), TRP1 locus (15), LEU2 locus (16, 17), or TUB1 locus (18, 19). In most experiments, site-specific targeting of a linearized FP-Tub1 plasmid is mediated by sequence homology between the plasmid-borne auxotrophic marker (e.g., URA3) and the respective chromosomal allele (e.g., ura3-52). One of the drawbacks for this strategy is that the choice of auxotrophic markers is limited to those that have corresponding sequence in the host yeast strain. This limitation eliminates as options those markers for which the complete auxotrophic gene has been deleted from the host strain (e.g., his3Δ, leu2Δ, trp1Δ), and also eliminates antibiotic resistant marker genes, which have no corresponding complementary sequence within the yeast genome (e.g., kanamycin and hygromycin resistance genes). Further complicating this approach is that different targeting strategies must be conceived for each different selectable marker-containing targeting plasmid. In contrast, targeting FP-Tub1 constructs to a single site – the TUB1 locus – overcomes these problems, since the homologous sequence for recombination is within the TUB1 gene. However, although this strategy has been employed in various experiments, it is unknown if affecting the TUB1 locus impacts microtubule function.
To address this question, we first generated yeast strains with a differential targeted FP-Tub1 vector. The plasmid we chose (pRS306:HIS3p:mCherry-TUB1) (15) contains an mCherry-TUB1 fusion under the control of the HIS3 promoter (HIS3p) and a URA3 selectable marker (Fig. 1A). Upon digestion with ApaI, which cuts within the URA3 gene, the exposed ends of the linearized plasmid would theoretically target the construct for integration into the ura3-52 locus. Alternatively, we hypothesized that digestion within the TUB1 sequence of the plasmid, using BsaBI, as pictured in Fig. 1A, would target the plasmid for integration into the TUB1 locus. After digesting with either ApaI or BsaBI and transforming into yeast, we prepared genomic DNA from clonal isolates expressing mCherry-labeled microtubules as confirmed by fluorescence microscopy. Using diagnostic PCR primer pairs shown in Figure 1A and listed in Table 1, we confirmed that the plasmid was indeed differentially targeted to ura3-52 and TUB1 locus as a result of linearization with ApaI and BsaBI, respectively (Fig. 1B).
Figure 1. Differential FP-Tub1 integration strategies.
(A) Schematics depicting Tub1-tagging plasmid pRS306:HIS3p:FP-TUB1 and chromosomal loci ura3-52 and TUB1, with open reading frame and direction of coding sequence indicated (HIS3p, HIS3 promoter; FP, fluorescent protein; TUB1, alpha-tubulin; URA3, auxotrophic marker; ampR, beta-lactamase). Restriction digest by either ApaI (left; cuts within URA3 gene) or BsaBI (right; cuts within TUB1 gene) targets the plasmid for homologous recombination into either the ura3-52 or the TUB1 locus as depicted. Dashed box below delineates chromosomally-integrated plasmid. Arrows indicate the forward (i.e., F1 and F2) and reverse (i.e., R1 and R2) diagnostic PCR primers (see Table 1). (B) Ethidium bromide-stained agarose gel with PCR products from genomic DNA isolated from yeast strains transformed with either (1) ApaI-digested, or (2) BsaBI-digested pRS306:HIS3p:mCherry-TUB1 using the indicated primers. Note the specificity of each PCR product, and thus the ability to target the plasmid for chromosomal integration into either the ura3-52 or the TUB1 locus by differential restriction digest.
Table 1.
Primers used in this study.
| Primer | Purpose | Primer sequence |
|---|---|---|
| F1 | To confirm URA3 locus integration | 5′ - GGCCATGAAGCTTTTTCTTTCC -3′ |
| R1 | To confirm URA3 locus integration | 5′ - CAGGAAGGCAAAATGCCG -3′ |
| F2 | To confirm TUB1 locus integration | 5′ - CACCCAAGATCTGTAAACTTACAACTG -3′ |
| R2 | To confirm TUB1 locus integration | 5′ - GCGGGTGTATACAGAATAGC -3′ |
Close inspection of the two yeast strains with the differentially-targeted mCherry-Tub1 construct revealed no readily apparent difference in microtubule morphology or behavior (as assessed by fluorescence microscopy) or cell growth (not shown). To more carefully assess microtubule function in these cells, we performed a synthetic genetic analysis of the different HIS3p:mCherry-TUB1 alleles with the microtubule-binding proteins, Bim1 and Bik1. Previous studies have shown that yeast strains deficient for BIM1 (bim1Δ) or BIK1 (bik1Δ) exhibit synthetic lethality with mutations in TUB1 (20, 21). Interestingly, we found that whereas the ura3-52 locus-integrated HIS3p:mCherry-TUB1 exhibited no synthetic genetic interaction with either bik1Δ or bim1Δ, the TUB1 locus-integrated allele showed a strong synthetic interaction with both bik1Δ and bim1Δ mutations (Table 2). These data indicate that the TUB1 locus-integrated mCherry-TUB1 construct, but not the ura3-52 locus-integrated construct, interferes with microtubule function. This is surprising given that neither the upstream promoter region nor the open reading frame of the endogenous TUB1 locus was affected by the plasmid integration in both scenarios (see Fig. 1A).
Table 2.
Summary of genetic interactions.
| Locus | Tub1 fusion | bik1 Δ | bim1 Δ |
|---|---|---|---|
| ura3-52 | mCherry | − | − |
| TUB1 | mCherry | +++ | +++ |
| ura3-52 | mTurquoise2 | − | − |
| TUB1 | mTurquoise2 | +++ | ++ |
| ura3-52 | Venus | − | − |
| TUB1 | Venus | ++ | ++ |
| TUB1 | mRuby2 | +++ | ++ |
| TUB1 + 3′UTR | mRuby2 | − | − |
| TUB1 + 3′UTR | Venus | + | n/t |
| TUB1 + 3′UTR | mTurquoise2 | − | n/t |
| TUB1 + 3′UTR | mEos2 | − | n/t |
| TUB1 + 3′UTR | yomWasabi | + | n/t |
−, no synthetic interaction; + or ++, synthetic sick; +++, synthetic lethal; n/t, not tested
To determine whether the observed synthetic growth defects were due to the specific fluorescent protein tag, we generated similar FP-Tub1 constructs in which mCherry was replaced by either mTurquoise2, Venus, or mRuby2. These are improved (i.e., brighter and/or more photostable) variants of their respective predecessor FPs (i.e., CFP, YFP, mCherry) (22-24). Yeast strains with these new FP-TUB1 constructs targeted to the TUB1 locus also exhibited strong synthetic interactions with both bik1Δ and bim1Δ mutations; however, none of the ura3-52 locus-targeted constructs tested showed synthetic defects with either bik1Δ or bim1Δ (Table 2). These results indicate that the synthetic interactions, and thus the defects in microtubule function, are not a consequence of fluorophore selection, but are in fact due to the choice of the site for plasmid integration.
Addition of TUB1 3'UTR to FP-Tub1 constructs rescues microtubule dysfunction
Since only the TUB1-targeted, but not the ura3-52-targeted, FP-Tub1 constructs were observed to negatively affect microtubule function, we reasoned that a possible cause for this discrepancy was the disruption of the TUB1 locus upon homologous recombination. Following integration into the TUB1 locus, the native 3’ untranslated region (3'UTR) becomes linked to the FP-TUB1, but not the untagged TUB1 gene (see dashed box in Fig. 1A, right). The 3'UTR sequence found in mRNA transcripts often regulates translational control (25). Thus, uncoupling of the endogenous TUB1 gene from its 3'UTR might lead to altered Tub1 protein levels, which might consequently affect microtubule function.
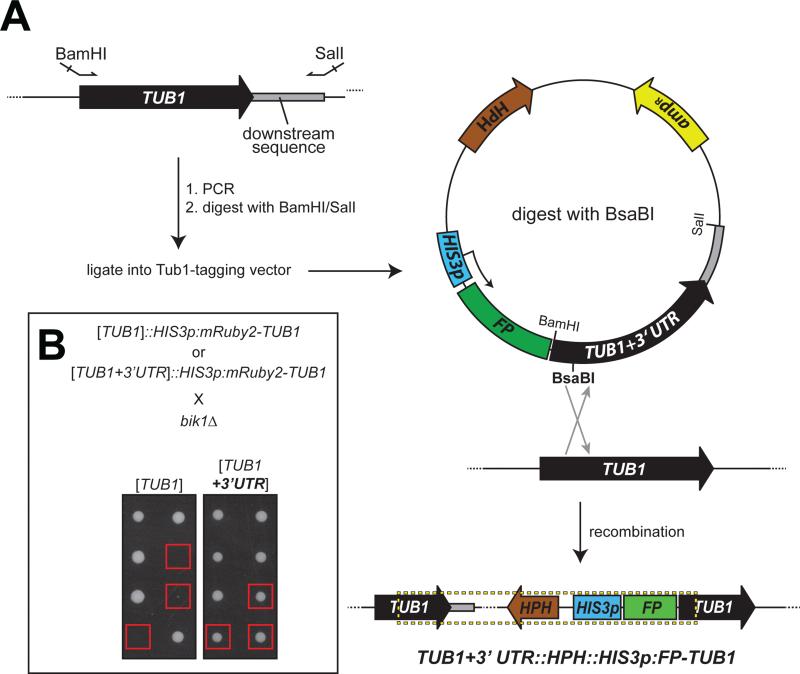
We asked if restoring the 3'UTR to the endogenous, untagged TUB1 gene would rescue the synthetic defects with bim1Δ or bik1Δ mutations. To this end, we altered the FP-Tub1 tagging plasmids by adding an additional 618 nucleotides corresponding to the region downstream of the TUB1 locus (Fig. 2A). This sequence was chosen because it extends well beyond the last potential polyadenylation sequence (AATAAA, 145 nt downstream of the stop codon; ATTAAA, 540 nt downstream of the stop codon). Following transformation with the new BsaBI-digested plasmid (pHIS3p:FP-TUB1+3'UTR), both the endogenous, untagged TUB1 and the FP-TUB1 genes will be immediately followed by the 3'UTR sequence (Fig. 2A, dashed box). Strikingly, we found that most of the FP-TUB1+3'UTR constructs tested exhibited no synthetic genetic interactions with bik1Δ (Table 2 and 3; Fig. 2B, compare growth of colonies boxed in red), indicating that the observed defects in microtubule function were a consequence of disruption of the TUB1 3'UTR sequence. Notably, two out of seven Venus-TUB1+3'UTR isolates, and one out of six yomWasabi-TUB1+3'UTR isolates, exhibited a synthetic interaction when crossed with bik1Δ, producing tetrad progeny that could sometimes form microcolony (Table 3). In cases that we tested, analytical PCR suggested that the plasmid integrated as expected (data not shown). Although the reason for the isolate-dependent differences is unknown, we noted that Venus- and yomWasabi-Tub1+3'UTR isolates that exhibited synthetic growth defects with bik1Δ displayed higher FP-Tub1 fluorescence intensity when compared to isolates that did not exhibit synthetic interaction (Fig. S1 for Venus-Tub1+3'UTR; data not shown for yomWasabi-Tub1+3'UTR). Thus, defects in microtubule function observed in both cases could be due to a higher expression level of FP-Tub1. These results indicate the importance of confirming functionality of a chromosomally integrated Tub1-tagging plasmid, and also indicate the usefulness of the synthetic genetic analysis for such a test.
Figure 2. Addition of 3'UTR to integration plasmid rescues synthetic lethality with bik1Δ.
(A) Schematic depicting strategy for construction of TUB1+3'UTR-integration plasmids. Arrows indicate forward and reverse primers used for PCR, which include BamHI and SalI restriction sites for cloning. Restriction digest by BsaBI targets the plasmid for homologous integration into the TUB1 locus, as depicted. Dashed box delineates chromosomally-integrated plasmid. (B) Representative tetrad progeny of indicated crosses. Red boxes indicate bik1Δ TUB1::HIS3p:mRuby2-TUB1 progeny and bik1Δ TUB1+3'UTR::HIS3p:mRuby2-TUB1 progeny as assessed by marker analysis.
Table 3.
Viability of strains with indicated TUB1+3′UTR::HIS3p:FP-TUB1 integrated vectors in combination with bik1Δ mutant.
| FP-TUB1 strains crossed with bik1Δ* | Number of tetrads analyzed | Number of double mutants | Viability of double mutants | |
|---|---|---|---|---|
| viable | Microcolony | |||
| Venus-TUB1 | 60 | 75 | 59 | 16 |
| mEos2-TUB1 | 51 | 53 | 53 | 0 |
| mRuby2-TUB1 | 27 | 31 | 31 | 0 |
| yomWasabi-TUB1 | 49 | 62 | 56 | 6 |
| mTurquoise2-TUB1 | 35 | 41 | 41 | 0 |
At least four independent isolates were analyzed for synthetic defects. Number indicates the combined total of tetrads or progeny from all isolates. Two out of seven Venus-TUB1 isolates, and one out of six yomWasabi-TUB1 isolates, showed synthetic growth defects when combined with bik1Δ, producing tetrad progeny that could sometimes form microcolony.
Comparative analysis of different FP-Tub1+3'UTR tagging vectors
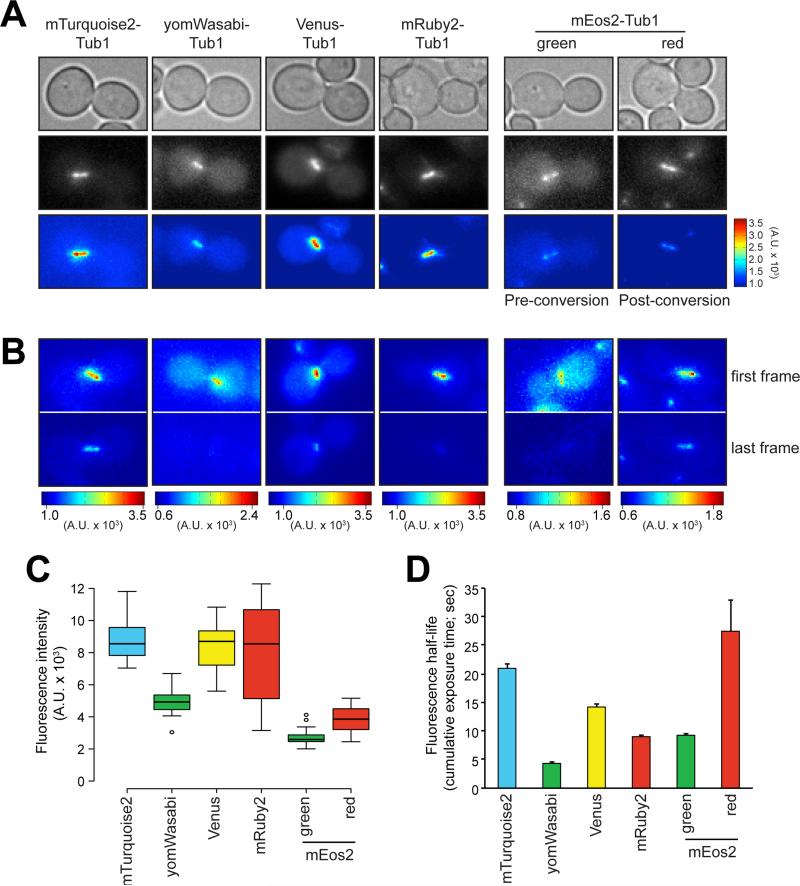
We next sought to compare the brightness and photostability of the different TUB1-locus-targeted FP-Tub1 constructs. Figure 3A shows representative fluorescence images of cells expressing mTurquoise2-Tub1, yomWasabi-Tub1, Venus-Tub1, mRuby2-Tub1, and mEos2-Tub1 (pre- and post-photoconversion), all acquired using identical imaging conditions (see Materials and Methods). mEos2 is a photoconvertible FP that exhibits green fluorescent protein-like properties (λex = 506 nm; λem = 519 nm) until exposed to 405 nm light, after which it switches irreversibly to exhibiting red fluorescent protein-like properties (λex = 573 nm; λem = 584 nm) (26). In addition, we also generated a plasmid with which to tag Tub1 with Clover GFP. Although we managed to confirm integration of the Clover-TUB1+3'UTR plasmid by fluorescence microscopy, the low intensity of this FP makes it a poor choice for live cell imaging. However, given its spectral properties, this construct could conceivably be a good choice for fluorescence resonance energy transfer (FRET) studies (23).
Figure 3. Fluorescence intensities and half-lives of FP-Tub1 constructs.
(A) Representative images depicting HU-arrested FP-Tub1-expressing cells (transformed by TUB1+3'UTR plasmids). In order to depict relative fluorescence intensities, all color map images are shown with the same brightness and contrast settings (see color bar on the right for intensity scale). (B) Representative fluorescence images illustrating fluorescence half-life of each FP-Tub1 construct. Time-lapse images of FP-Tub1 were acquired every 5 seconds for 10 minutes. Color maps of first (t = 0 sec) and last (t = 600 sec) frame are shown. For (A) and (B), each image is a maximum-intensity projection of a 3 μm z stack (0.5 μm step size) of wide-field images. (C) Box plot of fluorescence intensity values measured for HU-arrested spindles (see Materials and Methods; n = 20 spindles). Whiskers define the range, boxes encompass 25th to 75th quartiles, lines depict the medians, and circles depict outlier values (defined as values greater than [upper quartile + 1.5 × interquartile distance] or less than [lower quartile − 1.5 × interquartile distance]). (D) Plot depicting fluorescence half-life of each FP-Tub1 construct. Intensity measurements for HU-arrested spindles (n = 5 spindles) over time were plotted and fit to a single exponential. Values take into account cumulative exposure time. All measurements for post-photoconverted (red) mEos2 were acquired after a 5 second pulse of 405 nm light (see Materials and Methods).
To compare the relative brightness between the different fluorophores, we synchronized FP-Tub1-expressing cells in S phase using hydroxyurea (HU) and measured the fluorescence intensity of the entire preanaphase spindle. Synchronization allowed us to avoid differences in fluorescence intensities arising from differences in spindle assembly state. To determine the relative photostability of each FP-Tub1 construct, we measured the fluorescence intensity of a given spindle over time, and then plotted and fit the values to a single exponential. As quantified in Figure 3C and D, mTurquoise2-, Venus-, and mRuby2-Tub1 were the brightest, while mTurquoise2-, Venus-, and post-converted mEos2-Tub1 were the most photostable (also see images in Fig. 3B for the analysis in 3D). Irrespective of differences in brightness or photostability, even the dimmest, most non-photostable of the FP-Tub1 constructs shown in Figure 3 (i.e., yomWasabi and mEos2) were suitable for time-lapse fluorescence microscopy experiments. The various FP-Tub1 constructs span the spectrum of FPs, and offer useful tools for multi-color fluorescence microscopy imaging studies.
mEos2-Tub1 enables photo-marking of spindle microtubules in living yeast cells
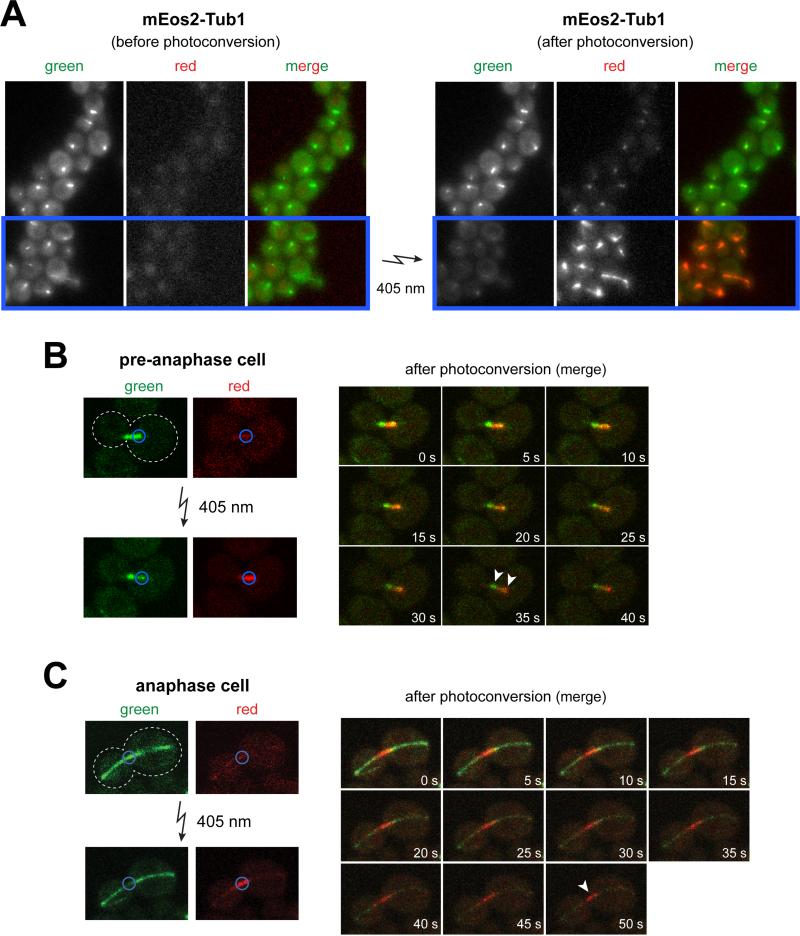
We found that mEos2-Tub1 could be efficiently photoconverted from green to red using both wide-field fluorescence (Fig. 4A) and laser scanning confocal microscopy (Fig. 4B). Unlike photoactivatable FPs (e.g., PA-GFP, PA-mCherry), which are dark until turned on by a pulse of 405 nm light, photoconvertible FPs offer the advantage of being observable prior to conversion. The pre-activated dark state of the PA-FPs complicate identification of the cellular structure of interest (e.g., the spindle) and thus the appropriate targeting of the 405 nm pulse of light.
Figure 4. Photoconversion of mEos2-Tub1 using wide-field and confocal fluorescence microscopy.
(A) Representative image depicting mEos2-Tub1-expressing cells before (left) and after (right) photoconversion. Blue box indicates area in the field targeted for exposure to 5 second pulse of 405 nm light (by reducing field diaphragm). Note the reduction in green fluorescence concomitant with the appearance of red fluorescence following photoconversion. (B) Example of a mEos2-Tub1-expressing pre-anaphase cell subjected to local photoconversion by laser scanning confocal fluorescence microscopy. Half of the pre-anaphase spindle (marked by blue circle) was exposed to a brief 405 nm laser pulse. Pre- (green) and post- (red) photoconverted mEos2-Tub1 fluorescence were subsequently imaged every 5 s for 40 s. Clear separation of green and red fluorescence at t = 35 s (arrowheads) indicates low turnover of tubulin within the spindle in this timeframe. (C) Similar to (B) but the spindle midzone of an anaphase cell was photoconverted. Green and red fluorescence were subsequently imaged every 5 s for 50 s. White arrowhead indicates persistence of photoconverted mark at t = 50 s suggesting low turnover of interpolar spindle microtubules within the indicated timeframe.
To test the utility of mEos2-Tub1, we performed localized photoconversion and monitored green (pre-converted) and red (post-converted) fluorescence over time. Using confocal microscopy, we targeted half of a preanaphase spindle (Fig. 4B) or the midzone area of an anaphase spindle (Fig. 4C) for photoconversion. As shown in Figure 4B and 4C, upon localized 405 nm illumination, we observed strong photoconversion of green to red fluorescence. However, because of the short duration of our imaging conditions, we did not observe significant tubulin turnover, as expected from previous laser-photobleaching studies (19, 27). While these results only demonstrate the effectiveness of the photoconversion, they suggest that mEos2-Tub1 will prove beneficial for monitoring tubulin turnover in future studies.
Comparative analysis of FP-Tub1+3'UTR with older FP-Tub1 fusions
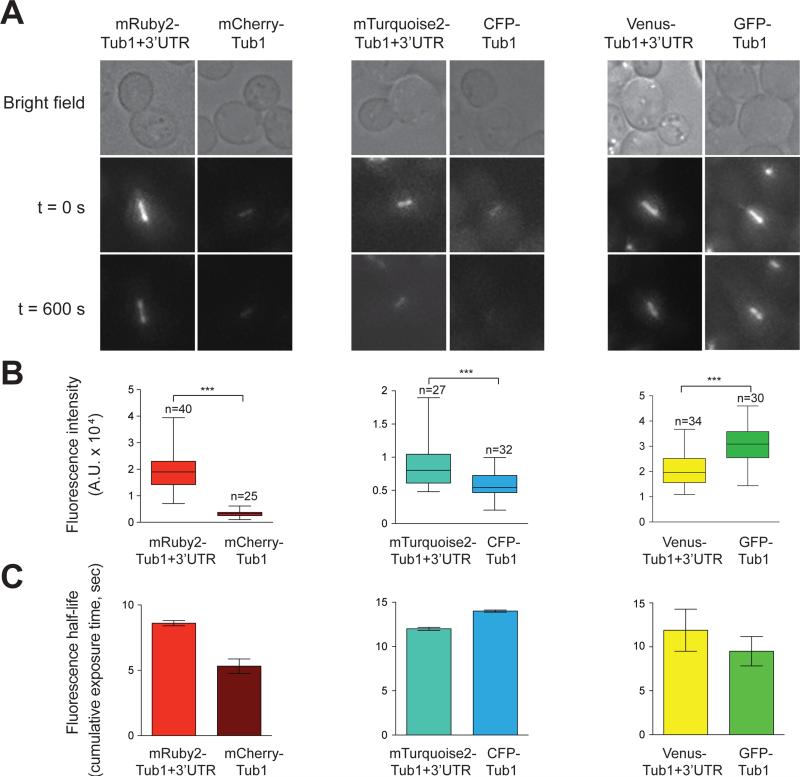
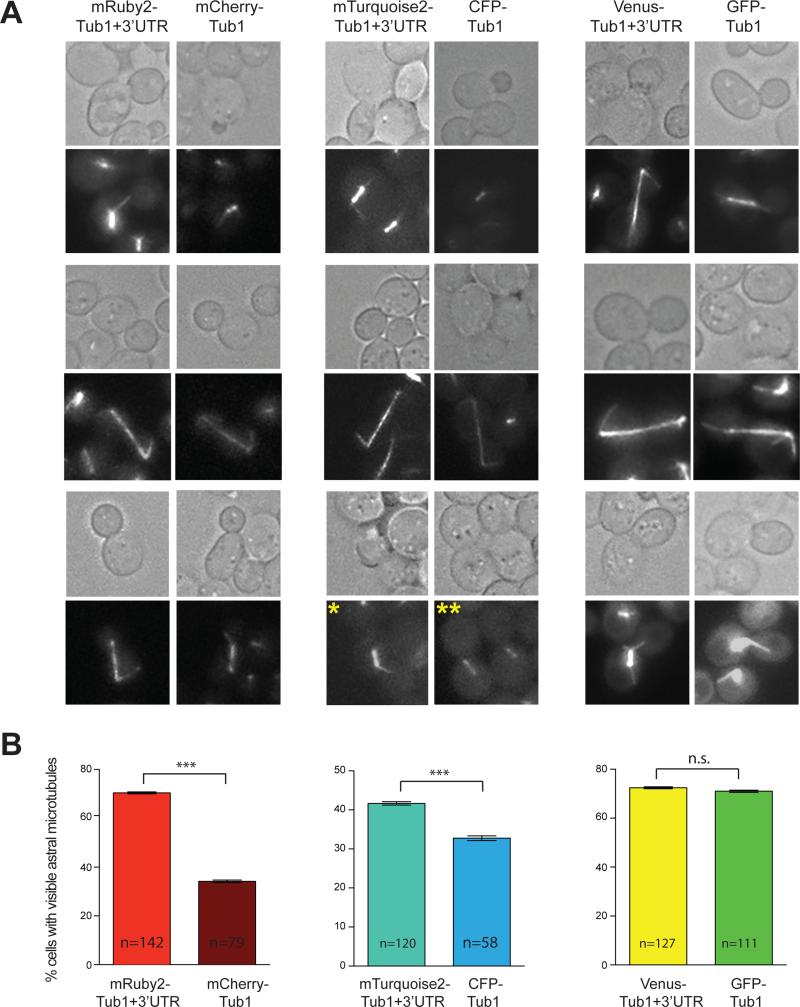
To test whether the new FP-TUB1+3'UTR tagging vectors would constitute better reagents than those currently used in the field (e.g. CFP-TUB1, mCherry-TUB1, and GFP-TUB1), we performed side-by-side comparisons of brightness, photostability, and visibility of astral microtubules, using identical imaging conditions (see Materials and Methods). We found that mRuby2-Tub1+3'UTR and mTurquoise2-Tub1+3'UTR were significantly brighter than mCherry-Tub1 and CFP-Tub1, respectively (Fig. 5A and B). The photostability of mRuby2-Tub1+3'UTR was significantly higher than mCherry-Tub1, whereas that of mTurquoise2-Tub1+3'UTR was comparable to CFP-Tub1 (Fig. 5C). Additionally, we observed that Venus-Tub1+3'UTR was dimmer but more photostable when compared with GFP-Tub1. Furthermore, cells expressing mRuby2-Tub1+3'UTR and mTurquoise2-Tub1+3'UTR displayed brighter astral microtubules (Fig. 6A and data not shown), and a higher frequency of finding astral microtubules (Fig. 6B) when compared to mCherry-Tub1 and CFP-Tub1, respectively. Cells expressing Venus-Tub1+3'UTR and GFP-Tub1 exhibited similar visibility of astral microtubules (Fig. 6B). Because astral microtubules are few (16) and are usually difficult to image, these results suggest that the new FP-TUB1+3'UTR tagging vectors are improved plasmids for FP tagging of microtubules in budding yeast.
Figure 5. Side-by-side comparison of TUB1+3'UTR-FP with older FP-TUB1 constructs.
(A) HU-arrested cells expressing indicated FP-Tub1 were imaged for 10 minutes with 10 s intervals. First (t = 0 s) and last (t = 600 s) frame are shown. Each fluorescence image is a maximum intensity projection of a 3 μm Z-stack with 0.5 μm step size. (B) Box plot of fluorescence intensity values measured for pre-anaphase spindles. Whiskers define the range, boxes encompass 25th to 75th quartile, and lines indicate the median. ***, p ≤ 0.0001 by Student's t-test. (C) Plot of fluorescence half-life of each FP-Tub1 construct. Time-lapse images were acquired continuously for 5 minutes. Next, intensity measurements for preanaphase spindles (n = 5 spindles) over time were plotted and fitted to a single exponential. Values take into account cumulative exposure time. Error bars represent 95 % confidence intervals.
Figure 6. Side-by-side comparison of astral microtubules visualized by TUB1+3'UTR-FP with older FP-TUB1 constructs.
(A) Representative fluorescence images of astral microtubules of each FP-Tub1 fusions. Each image is a maximum intensity projection of a 1 μm Z-stack with 0.5 μm step size, with 2X averaging of 80 ms exposure for each frame. Note that the exposure to capture clear astral microtubules was higher than that needed for mitotic spindle as in Figure 3 and 5. Asterisk (*) indicates an example of a cell with visible astral microtubule (for scoring in (B)), whereas double-asterisk (**) indicates an example of cells with no visible astral microtubules. (B) Frequency of observing astral microtubules for each indicated FP-Tub1. Error bar represents standard error of proportion. ***, p < 0.0001, and n.s., not significant, by Student's t-test.
Availability of a new set of FP-Tub1 tagging plasmids
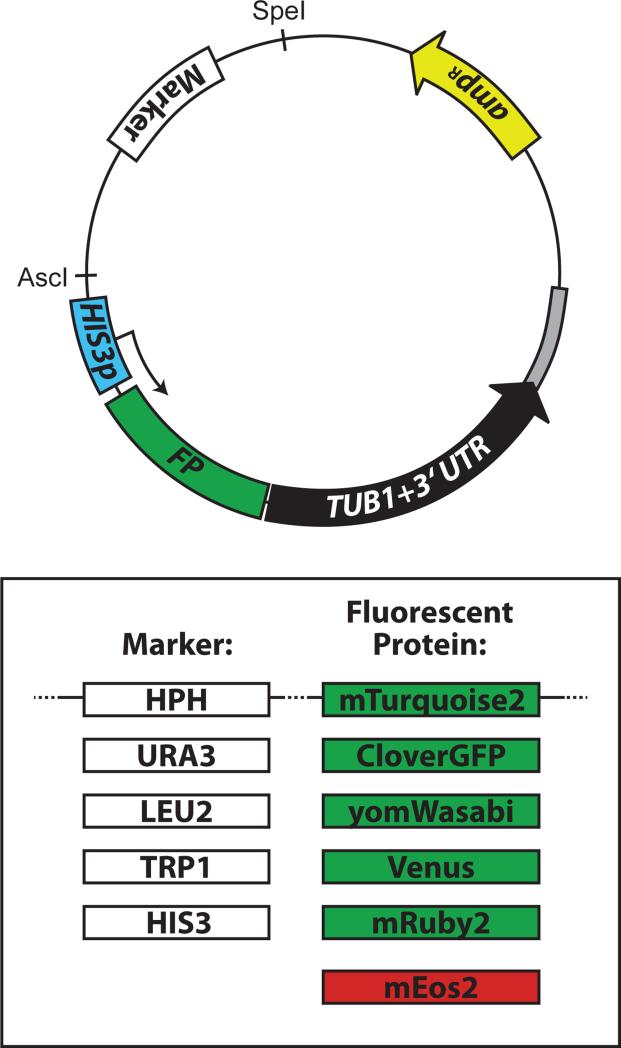
To broaden the flexibility and utility of the FP-TUB1+3'UTR cassettes, we substituted the hygromycin-resistance marker in each plasmid with four different selectable markers: URA3, LEU2, TRP1, HIS3 (Fig. 7). With the exception of the HIS3-containing plasmids, which require digestion with XbaI, BsaBI linearizes each and targets them for integration into the TUB1 locus (see Table 4). All plasmids listed in Table 4 have been deposited at Addgene (http://www.addgene.com) for distribution to academic researchers.
Figure 7. Overview of the plasmids generated for fluorescent labeling of microtubules.
General map of the plasmids generated in this study. Also see Table 4.
Table 4.
Tub1-tagging plasmids for integration into TUB1 locus.
| Plasmid | Selectable marker | Digest for integration |
|---|---|---|
| pHIS3p:mTurquoise2-Tub1+3'UTR::HPH | HPH | BsaBI |
| pHIS3p:CloverGFP-Tub1+3'UTR::HPH | HPH | BsaBI |
| pHIS3p:yomWasabi-Tub1+3'UTR::HPH | HPH | BsaBI |
| pHIS3p:Venus-Tub1+3'UTR::HPH | HPH | BsaBI |
| pHIS3p:mRuby2-Tub1+3'UTR::HPH | HPH | BsaBI |
| pHIS3p:mEos2-Tub1+3'UTR::HPH | HPH | BsaBI |
| pHIS3p:mTurquoise2-Tub1+3'UTR::URA3 | URA3 | BsaBI |
| pHIS3p:CloverGFP-Tub1+3'UTR::URA3 | URA3 | BsaBI |
| pHIS3p:yomWasabi-Tub1+3'UTR::URA3 | URA3 | BsaBI |
| pHIS3p:Venus-Tub1+3'UTR::URA3 | URA3 | BsaBI |
| pHIS3p:mRuby2-Tub1+3'UTR::URA3 | URA3 | BsaBI |
| pHIS3p:mEos2-Tub1+3'UTR::URA3 | URA3 | BsaBI |
| pHIS3p:mTurquoise2-Tub1+3'UTR::LEU2 | LEU2 | BsaBI |
| pHIS3p:CloverGFP-Tub1+3'UTR::LEU2 | LEU2 | BsaBI |
| pHIS3p:yomWasabi-Tub1+3'UTR::LEU2 | LEU2 | BsaBI |
| pHIS3p:Venus-Tub1+3'UTR::LEU2 | LEU2 | BsaBI |
| pHIS3p:mRuby2-Tub1+3'UTR::LEU2 | LEU2 | BsaBI |
| pHIS3p:mEos2-Tub1+3'UTR::LEU2 | LEU2 | BsaBI |
| pHIS3p:mTurquoise2-Tub1+3'UTR::TRP1 | TRP1 | BsaBI |
| pHIS3p:CloverGFP-Tub1+3'UTR::TRP1 | TRP1 | BsaBI |
| pHIS3p:yomWasabi-Tub1+3'UTR::TRP1 | TRP1 | BsaBI |
| pHIS3p:Venus-Tub1+3'UTR::TRP1 | TRP1 | BsaBI |
| pHIS3p:mRuby2-Tub1+3'UTR::TRP1 | TRP1 | BsaBI |
| pHIS3p:mEos2-Tub1+3'UTR::TRP1 | TRP1 | BsaBI |
| pHIS3p:mTurquoise2-Tub1+3'UTR::HIS3 | HIS3 | XbaI |
| pHIS3p:CloverGFP-Tub1+3'UTR::HIS3 | HIS3 | XbaI |
| pHIS3p:yomWasabi-Tub1+3'UTR::HIS3 | HIS3 | XbaI |
| pHIS3p:Venus-Tub1+3'UTR::HIS3 | HIS3 | XbaI |
| pHIS3p:mRuby2-Tub1+3'UTR::HIS3 | HIS3 | XbaI |
| pHIS3p:mEos2-Tub1+3'UTR::HIS3 | HIS3 | XbaI |
Materials and Methods
Media and strain construction
All strains were derived from YWL36 or YWL37 (28) and are available upon request. We transformed yeast strains using the lithium acetate method (29). Transformants were clonally purified by streaking to individual colonies on selective media. Insertion of tagging cassette was confirmed either by PCR (see Fig. 1B) or fluorescence microscopy. Yeast synthetic defined (SD) media were obtained from Sunrise Science Products (San Diego, CA, USA).
Construction of FP-Tub1 tagging vectors
To generate vectors for integration of a HIS3 promoter (HIS3p)-driven fluorescent protein (FP)-TUB1::URA3 cassette into the ura3-52 locus, Venus, mTurquoise2, or mRuby2 were PCR amplified from pFA6a-link-yEVenus-KAN (2), pmTurquoise2-tubulin (Addgene) (22), or pcDNA3:mRuby2 (Addgene) (23), respectively. The forward and reverse PCR primers included a 20-nucleotide 5’ extension that was complementary to regions flanking the mCherry coding sequence (forward: 5’-AAGATAAACGAAGGCAAAGC-3’; reverse: 5’-AATAACTTCTCTCATGGATC-3’) in pAK011 (also known as pRS306:HIS3p:mCherry-TUB1) (15). After digesting pAK011 with BamHI and XhoI (to excise mCherry), the PCR products were assembled with the gel purified vector via Gibson assembly reaction (30). Briefly, a 5 μl mixture of PCR product and vector was combined with a 15 μl mixture of T5 exonuclease (Epicentre), Phusion high-fidelity DNA polymerase (New England Biolabs), and Taq DNA ligase (New England Biolabs), and incubated at 50°C for 15 min. Proper assembly was verified by restriction digest and DNA sequencing, yielding pRS306:HIS3p:Venus-TUB1, pRS306:HIS3p:mTurquoise2-TUB1, and pRS306:HIS3p:mRuby2-TUB1 (see Fig. 1).
To generate a vector for integration of HIS3p:mCherry-TUB1::HPH (hygromycin resistance cassette) into the TUB1 locus, the HIS3p:mCherry-TUB1 cassette was amplified from pAK011, and ligated into XmaI and SalI-digested pAG32 (31) using the Gibson assembly reaction, as above, yielding pHIS3p:mCherry-TUB1::HPH. Subsequently, Venus, mTurquoise2, and mRuby2, were amplified as above, and assembled into XhoI and BamHI-digested pHIS3p:mCherry-TUB1::HPH vector via Gibson assembly reaction, yielding pHIS3p:Venus-TUB1::HPH, pHIS3p:mTurquoise2-TUB1::HPH, and pHIS3p:mRuby2-TUB1::HPH. Clover, yomWasabi (improved GFP; Allele Biotechnology), and mEos2 were amplified from pcDNA3:Clover (Addgene) (23), pFA6a-link-yomWasabi-KAN (Addgene) (1), and pRSETa:mEos2 (Addgene) (26), respectively, using primers flanked with XhoI (forward) and BamHI (reverse) restriction sites. The PCR products were digested with XhoI and BamHI, and ligated into pHIS3p:mCherry-TUB1::HPH digested similarly, yielding pHIS3p:Clover-TUB1::HPH, pHIS3p:yomWasabi-TUB1::HPH, and pHIS3p:mEos2-TUB1::HPH.
To generate vectors for integration into the TUB1 locus without disrupting the putative TUB1 3'UTR sequence (see Fig. 2), we amplified the entire TUB1 open reading frame (including the 116-nucleotide intron) plus 618 nucleotides of downstream genomic sequence following the stop codon using PCR primers flanked with BamHI (forward) and SalI (reverse) sites. The PCR product was digested with BamHI and SalI, and ligated into each respective vector (i.e., pHIS3p:FP-TUB1::HPH) digested similarly (to excise TUB1), yielding pHIS3p:FP-TUB1+3'UTR::HPH (see Fig. 2 and Table 4).
Next, to generate vectors with different selectable markers, we amplified respective markers from pRS303 (HIS3), pRS304 (TRP1), pRS305 (LEU2), and pRS306 (URA3) using PCR primers flanked with AscI (forward) and SpeI (reverse) sites. The PCR products were digested with AscI and SpeI, and ligated into pHIS3p:FP-TUB1::HPH digested similarly, yielding pHIS3p:FP-TUB1+3'UTR::MARKER (see Fig. 7 and Table 4 for a listing of all plasmids).
Construction of FP-Tub1 expressing strains
To integrate the FP-Tub1 tagging vectors into the ura3-52 or TUB1 locus, we transformed yeast strains with ApaI-linearized (pRS306 vectors; for integration into ura3-52 locus), BsaBI-linearized (all pHIS3p:FP-TUB1::MARKER and pHIS3p:FPTUB1+3'UTR::MARKER plasmids, except for pHIS3p:FP-TUB1+3'UTR::HIS3; for integration into TUB1 locus), or XbaI-linearized (pHIS3p:FP-TUB1+3'UTR::HIS3 vectors; for integration into TUB1 locus) plasmids. To label microtubules using previously published plasmids, wild-type strains were transformed with StuI-digested pAK011 (mCherry-TUB1::URA3) (14, 32) or StuI-digested pAFS125C (CFP-TUB1::URA3) (18, 33-35), or undigested pBJ1351 (GFP-TUB1::LEU2) (12, 36-39). Hygromycin-resistant, His+, Trp+, Leu+, or Ura+ transformants were selected and examined for FP-Tub1 fluorescence by microscopy.
Image acquisition and photoconversion
To acquire images of pre-anaphase spindles for fluorescence intensity and half-life measurements (Fig. 3 and Fig. 5), cells were grown to early log phase in SD media, then arrested in S phase by adding 200 mM hydroxyurea (HU). After 2.5 hours in HU-containing media, cells were mounted on a 1.5% agarose pad containing non-fluorescent synthetic defined media supplemented with HU. Wide-field fluorescence images were collected as previously described (40) using a 1.45 NA 100X objective on a Nikon 80i upright microscope equipped with piezo Z control (Physik Instrumente), electronically controlled SmartShutter (Sutter Instrument), motorized filter cube turret, and a cooled EM-CCD Cascade-II camera (Photometrics). The microscope system was controlled by NIS-Elements software (Nikon). Sputtered/ET filter cube sets (Chroma Technology) were used for imaging mTurquoise2 or CFP (49001), yomWasabi or GFP or pre-converted mEos2 (49002), Venus (49003), and mRuby2 or mCherry or post-converted mEos2 (49008) fluorescence. Z-stack images of 2 μm or 3 μm thick were acquired with a step size of 0.5 μm. Images of FP-Tub1 were acquired every 5 s for 10 min (Fig. 3), or every 10 s for 10 min (Fig. 5A), or with no interval for 5 min (Fig. 5C). For Fig. 3, all images were acquired using 30 ms exposure. For photostability measurements (Fig. 3 and Fig. 5C), we used ImageJ (NIH) to draw a box outlining the HU-arrested spindle to quantify the fluorescence intensity of each spindle. An adjacent, non-overlapping region within the same cell was used for background subtraction. The decay in fluorescence intensity was fitted by Matlab or Kaleidagraph using the equation y = a*e^(−b*x). The half-life was calculated as 0.693/b. For comparison of the intensity of FP-Tub1+3'UTR with older FP-Tub1 fusions, identical exposure was used for each pair (60 ms for Tub1+3'UTR-mRuby2 versus Tub1-mCherry; 50 ms for Tub1+3'UTR-mTurquoise2 versus Tub1-CFP; 35 ms for Tub1+3'UTR-Venus and Tub1-GFP). For comparing the frequency of observing astral microtubules between the new FP-Tub1+3'UTR and the older FP-Tub1 fusions (see Fig. 6A for examples of cells showing visible astral microtubules), we acquired Z-stack images of 2 μm thickness with 0.5 μm step size and 2X averaging of 80 ms exposure. All images used for comparison were acquired on the same day to ensure that any changes to the mercury arc lamp bulb were negligible.
To photoconvert mEos2 (from green to red) using wide-field fluorescence microscopy (Fig. 4A), cells were exposed to a pulse of 405 nm light for 5 seconds using the mercury arc lamp and a D405/20 filter cube (Chroma Technology). Local photoconversion was achieved by closing down the field diaphragm, thus restricting the area of excitation. Images of green and red fluorescence were acquired before and after the 405 nm light exposure using the same camera settings (see Fig. 4A). To photoconvert a half-spindle (Fig. 4B), we used a 1.45 NA 100X objective on a Nikon A1-R confocal microscope (Marine Biological Laboratory, Woods Hole) equipped with 405 nm, 488 nm, and 561 nm laser lines. Spindles were locally photoconverted for 1-2 s using an attenuated 405 nm laser power (at 0.4%) followed by two-color time-lapse acquisition of 3 optical sections (0.5 μm step size) with 488 nm and 561 nm lasers.
Supplementary Material
ACKNOWLEDGEMENTS
This work was supported by an American Heart Association Undergraduate Summer Fellowship to K. B. and an NIH/NIGMS grant (1R01GM076094) to W.L.L. The work was also supported in part by a competitive research award to W.L.L. from the Robert Day Allen Fellowship Fund, the Erik B. Fries Endowed Fellowship Fund, and the Laura and Arthur Colwin Endowed Summer Research Fellowship Fund of the Marine Biological Laboratory in Woods Hole MA, where a portion of this work was conducted under the auspices of this award.
REFERENCES
- 1.Lee S, Lim WA, Thorn KS. Improved blue, green, and red fluorescent protein tagging vectors for S. cerevisiae. PLoS One. 2013;8(7):e67902. doi: 10.1371/journal.pone.0067902. [DOI] [PMC free article] [PubMed] [Google Scholar]
- 2.Sheff MA, Thorn KS. Optimized cassettes for fluorescent protein tagging in Saccharomyces cerevisiae. Yeast. 2004;21(8):661–670. doi: 10.1002/yea.1130. [DOI] [PubMed] [Google Scholar]
- 3.Longtine MS, McKenzie A, 3rd, Demarini DJ, Shah NG, Wach A, Brachat A, Philippsen P, Pringle JR. Additional modules for versatile and economical PCR-based gene deletion and modification in Saccharomyces cerevisiae. Yeast. 1998;14(10):953–961. doi: 10.1002/(SICI)1097-0061(199807)14:10<953::AID-YEA293>3.0.CO;2-U. [DOI] [PubMed] [Google Scholar]
- 4.Young CL, Raden DL, Caplan JL, Czymmek KJ, Robinson AS. Cassette series designed for live-cell imaging of proteins and high-resolution techniques in yeast. Yeast. 2012;29(3-4):119–136. doi: 10.1002/yea.2895. [DOI] [PMC free article] [PubMed] [Google Scholar]
- 5.Kaksonen M, Sun Y, Drubin DG. A pathway for association of receptors, adaptors, and actin during endocytic internalization. Cell. 2003;115(4):475–487. doi: 10.1016/s0092-8674(03)00883-3. [DOI] [PubMed] [Google Scholar]
- 6.Wloka C, Vallen EA, The L, Fang X, Oh Y, Bi E. Immobile myosin-II plays a scaffolding role during cytokinesis in budding yeast. J Cell Biol. 2013;200(3):271–286. doi: 10.1083/jcb.201208030. [DOI] [PMC free article] [PubMed] [Google Scholar]
- 7.Woodruff JB, Drubin DG, Barnes G. Mitotic spindle disassembly occurs via distinct subprocesses driven by the anaphase-promoting complex, Aurora B kinase, and kinesin-8. J Cell Biol. 2010;191(4):795–808. doi: 10.1083/jcb.201006028. [DOI] [PMC free article] [PubMed] [Google Scholar]
- 8.Carminati JL, Stearns T. Microtubules orient the mitotic spindle in yeast through dynein-dependent interactions with the cell cortex. J Cell Biol. 1997;138(3):629–641. doi: 10.1083/jcb.138.3.629. [DOI] [PMC free article] [PubMed] [Google Scholar]
- 9.Straight AF, Marshall WF, Sedat JW, Murray AW. Mitosis in living budding yeast: anaphase A but no metaphase plate. Science. 1997;277(5325):574–578. doi: 10.1126/science.277.5325.574. [DOI] [PubMed] [Google Scholar]
- 10.Doyle T, Botstein D. Movement of yeast cortical actin cytoskeleton visualized in vivo. Proc Natl Acad Sci U S A. 1996;93(9):3886–3891. doi: 10.1073/pnas.93.9.3886. [DOI] [PMC free article] [PubMed] [Google Scholar]
- 11.Luchniak A, Fukuda Y, Gupta ML., Jr. Structure-function analysis of yeast tubulin. Methods Cell Biol. 2013;115:355–374. doi: 10.1016/B978-0-12-407757-7.00022-0. [DOI] [PMC free article] [PubMed] [Google Scholar]
- 12.Maddox P, Chin E, Mallavarapu A, Yeh E, Salmon ED, Bloom K. Microtubule dynamics from mating through the first zygotic division in the budding yeast Saccharomyces cerevisiae. J Cell Biol. 1999;144(5):977–987. doi: 10.1083/jcb.144.5.977. [DOI] [PMC free article] [PubMed] [Google Scholar]
- 13.Jensen S, Segal M, Clarke DJ, Reed SI. A novel role of the budding yeast separin Esp1 in anaphase spindle elongation: evidence that proper spindle association of Esp1 is regulated by Pds1. J Cell Biol. 2001;152(1):27–40. doi: 10.1083/jcb.152.1.27. [DOI] [PMC free article] [PubMed] [Google Scholar]
- 14.Khmelinskii A, Roostalu J, Roque H, Antony C, Schiebel E. Phosphorylation-dependent protein interactions at the spindle midzone mediate cell cycle regulation of spindle elongation. Dev Cell. 2009;17(2):244–256. doi: 10.1016/j.devcel.2009.06.011. [DOI] [PubMed] [Google Scholar]
- 15.Khmelinskii A, Lawrence C, Roostalu J, Schiebel E. Cdc14-regulated midzone assembly controls anaphase B. J Cell Biol. 2007;177(6):981–993. doi: 10.1083/jcb.200702145. [DOI] [PMC free article] [PubMed] [Google Scholar]
- 16.Gupta ML, Jr., Bode CJ, Thrower DA, Pearson CG, Suprenant KA, Bloom KS, Himes RH. β-Tubulin C354 mutations that severely decrease microtubule dynamics do not prevent nuclear migration in yeast. Mol Biol Cell. 2002;13(8):2919–2932. doi: 10.1091/mbc.E02-01-0003. [DOI] [PMC free article] [PubMed] [Google Scholar]
- 17.Fukuda Y, Luchniak A, Murphy ER, Gupta ML., Jr. Spatial control of microtubule length and lifetime by opposing stabilizing and destabilizing functions of Kinesin-8. Curr Biol. 2014;24(16):1826–1835. doi: 10.1016/j.cub.2014.06.069. [DOI] [PMC free article] [PubMed] [Google Scholar]
- 18.Markus SM, Plevock KM, St Germain BJ, Punch JJ, Meaden CW, Lee WL. Quantitative analysis of Pac1/LIS1-mediated dynein targeting: Implications for regulation of dynein activity in budding yeast. Cytoskeleton (Hoboken) 2011;68(3):157–174. doi: 10.1002/cm.20502. [DOI] [PMC free article] [PubMed] [Google Scholar]
- 19.Kosco KA, Pearson CG, Maddox PS, Wang PJ, Adams IR, Salmon ED, Bloom K, Huffaker TC. Control of microtubule dynamics by Stu2p is essential for spindle orientation and metaphase chromosome alignment in yeast. Mol Biol Cell. 2001;12(9):2870–2880. doi: 10.1091/mbc.12.9.2870. [DOI] [PMC free article] [PubMed] [Google Scholar]
- 20.Schwartz K, Richards K, Botstein D. BIM1 encodes a microtubule-binding protein in yeast. Mol Biol Cell. 1997;8(12):2677–2691. doi: 10.1091/mbc.8.12.2677. [DOI] [PMC free article] [PubMed] [Google Scholar]
- 21.Berlin V, Styles CA, Fink GR. BIK1, a protein required for microtubule function during mating and mitosis in Saccharomyces cerevisiae, colocalizes with tubulin. J Cell Biol. 1990;111(6 Pt 1):2573–2586. doi: 10.1083/jcb.111.6.2573. [DOI] [PMC free article] [PubMed] [Google Scholar]
- 22.Goedhart J, von Stetten D, Noirclerc-Savoye M, Lelimousin M, Joosen L, Hink MA, van Weeren L, Gadella TW, Jr., Royant A. Structure-guided evolution of cyan fluorescent proteins towards a quantum yield of 93%. Nat Commun. 2012;3:751. doi: 10.1038/ncomms1738. [DOI] [PMC free article] [PubMed] [Google Scholar]
- 23.Lam AJ, St-Pierre F, Gong Y, Marshall JD, Cranfill PJ, Baird MA, McKeown MR, Wiedenmann J, Davidson MW, Schnitzer MJ, Tsien RY, Lin MZ. Improving FRET dynamic range with bright green and red fluorescent proteins. Nat Methods. 2012;9(10):1005–1012. doi: 10.1038/nmeth.2171. [DOI] [PMC free article] [PubMed] [Google Scholar]
- 24.Nagai T, Ibata K, Park ES, Kubota M, Mikoshiba K, Miyawaki A. A variant of yellow fluorescent protein with fast and efficient maturation for cell-biological applications. Nat Biotechnol. 2002;20(1):87–90. doi: 10.1038/nbt0102-87. [DOI] [PubMed] [Google Scholar]
- 25.Mazumder B, Seshadri V, Fox PL. Translational control by the 3′-UTR: the ends specify the means. Trends Biochem Sci. 2003;28(2):91–98. doi: 10.1016/S0968-0004(03)00002-1. [DOI] [PubMed] [Google Scholar]
- 26.McKinney SA, Murphy CS, Hazelwood KL, Davidson MW, Looger LL. A bright and photostable photoconvertible fluorescent protein. Nat Methods. 2009;6(2):131–133. doi: 10.1038/nmeth.1296. [DOI] [PMC free article] [PubMed] [Google Scholar]
- 27.Maddox PS, Bloom KS, Salmon ED. The polarity and dynamics of microtubule assembly in the budding yeast Saccharomyces cerevisiae. Nat Cell Biol. 2000;2(1):36–41. doi: 10.1038/71357. [DOI] [PMC free article] [PubMed] [Google Scholar]
- 28.Vorvis C, Markus SM, Lee WL. Photoactivatable GFP tagging cassettes for protein-tracking studies in the budding yeast Saccharomyces cerevisiae. Yeast. 2008;25(9):651–659. doi: 10.1002/yea.1611. [DOI] [PMC free article] [PubMed] [Google Scholar]
- 29.Knop M, Siegers K, Pereira G, Zachariae W, Winsor B, Nasmyth K, Schiebel E. Epitope tagging of yeast genes using a PCR-based strategy: more tags and improved practical routines. Yeast. 1999;15(10B):963–972. doi: 10.1002/(SICI)1097-0061(199907)15:10B<963::AID-YEA399>3.0.CO;2-W. [DOI] [PubMed] [Google Scholar]
- 30.Gibson DG, Young L, Chuang RY, Venter JC, Hutchison CA, 3rd, Smith HO. Enzymatic assembly of DNA molecules up to several hundred kilobases. Nat Methods. 2009;6(5):343–345. doi: 10.1038/nmeth.1318. [DOI] [PubMed] [Google Scholar]
- 31.Goldstein AL, McCusker JH. Three new dominant drug resistance cassettes for gene disruption in Saccharomyces cerevisiae. Yeast. 1999;15(14):1541–1553. doi: 10.1002/(SICI)1097-0061(199910)15:14<1541::AID-YEA476>3.0.CO;2-K. [DOI] [PubMed] [Google Scholar]
- 32.Gibeaux R, Politi AZ, Nedelec F, Antony C, Knop M. Spindle pole body-anchored Kar3 drives the nucleus along microtubules from another nucleus in preparation for nuclear fusion during yeast karyogamy. Genes Dev. 2013;27(3):335–349. doi: 10.1101/gad.206318.112. [DOI] [PMC free article] [PubMed] [Google Scholar]
- 33.Moore JK, D'Silva S, Miller RK. The CLIP-170 homologue Bik1p promotes the phosphorylation and asymmetric localization of Kar9p. Mol Biol Cell. 2006;17(1):178–191. doi: 10.1091/mbc.E05-06-0565. [DOI] [PMC free article] [PubMed] [Google Scholar]
- 34.Moore JK, Miller RK. The cyclin-dependent kinase Cdc28p regulates multiple aspects of Kar9p function in yeast. Mol Biol Cell. 2007;18(4):1187–1202. doi: 10.1091/mbc.E06-04-0360. [DOI] [PMC free article] [PubMed] [Google Scholar]
- 35.Lee WL, Kaiser MA, Cooper JA. The offloading model for dynein function: differential function of motor subunits. J Cell Biol. 2005;168(2):201–207. doi: 10.1083/jcb.200407036. [DOI] [PMC free article] [PubMed] [Google Scholar]
- 36.Zaichick SV, Metodiev MV, Nelson SA, Durbrovskyi O, Draper E, Cooper JA, Stone DE. The mating-specific Galpha interacts with a kinesin-14 and regulates pheromone-induced nuclear migration in budding yeast. Mol Biol Cell. 2009;20(12):2820–2830. doi: 10.1091/mbc.E09-01-0069. [DOI] [PMC free article] [PubMed] [Google Scholar]
- 37.Moore JK, Chudalayandi P, Heil-Chapdelaine RA, Cooper JA. The spindle position checkpoint is coordinated by the Elm1 kinase. J Cell Biol. 2010;191(3):493–503. doi: 10.1083/jcb.201006092. [DOI] [PMC free article] [PubMed] [Google Scholar]
- 38.Haarer BK, Helfant AH, Nelson SA, Cooper JA, Amberg DC. Stable preanaphase spindle positioning requires Bud6p and an apparent interaction between the spindle pole bodies and the neck. Eukaryot Cell. 2007;6(5):797–807. doi: 10.1128/EC.00332-06. [DOI] [PMC free article] [PubMed] [Google Scholar]
- 39.Song S, Lee KS. A novel function of Saccharomyces cerevisiae CDC5 in cytokinesis. J Cell Biol. 2001;152(3):451–469. doi: 10.1083/jcb.152.3.451. [DOI] [PMC free article] [PubMed] [Google Scholar]
- 40.Markus SM, Punch JJ, Lee WL. Motor- and tail-dependent targeting of dynein to microtubule plus ends and the cell cortex. Curr Biol. 2009;19(3):196–205. doi: 10.1016/j.cub.2008.12.047. [DOI] [PMC free article] [PubMed] [Google Scholar]
Associated Data
This section collects any data citations, data availability statements, or supplementary materials included in this article.


