Abstract
LRIG1, a member of the LRIG family of transmembrane leucine rich repeat-containing proteins, is a negative regulator of receptor tyrosine kinase signaling and a tumor suppressor. LRIG1 expression is broadly decreased in human cancer and in breast cancer, low expression of LRIG1 has been linked to decreased relapse-free survival. Recently, low expression of LRIG1 was revealed to be an independent risk factor for breast cancer metastasis and death. These findings suggest that LRIG1 may oppose breast cancer cell motility and invasion, cellular processes which are fundamental to metastasis. However, very little is known of LRIG1 function in this regard. In this study, we demonstrate that LRIG1 is down-regulated during epithelial to mesenchymal transition (EMT) of human mammary epithelial cells, suggesting that LRIG1 expression may represent a barrier to EMT. Indeed, depletion of endogenous LRIG1 in human mammary epithelial cells expands the stem cell population, augments mammosphere formation and accelerates EMT. Conversely, expression of LRIG1 in highly invasive Basal B breast cancer cells provokes a mesenchymal to epithelial transition accompanied by a dramatic suppression of tumorsphere formation and a striking loss of invasive growth in three-dimensional culture. LRIG1 expression perturbs multiple signaling pathways and represses markers and effectors of the mesenchymal state. Furthermore, LRIG1 expression in MDA-MB-231 breast cancer cells significantly slows their growth as tumors, providing the first in vivo evidence that LRIG1 functions as a growth suppressor in breast cancer.
Keywords: LRIG1, invasion, EMT
INTRODUCTION
LRIG1 is a member of the LRIG (leucine-rich repeat and immunoglobulin-like domain containing) family of single-pass transmembrane proteins, which also includes LRIG2 and LRIG3 (1). LRIG1 is a negative regulator of various receptor tyrosine kinases including all members of the ErbB family (2, 3), Met (4, 5), Ret (6) and PDGFRα (7). LRIG1 promotes the proteolytic degradation of its targets (with the exception of Ret and PDGFRα, for which it was not examined) although the mechanisms by which LRIG1 engages the receptor degradation machinery have not been resolved.
The human LRIG1 gene is located at chromosome 3p14.3 (8), a region frequently deleted in cancer, and LRIG1 mRNA and/or protein are decreased in a variety of human tumors (9). Low expression of LRIG1 has been correlated with poor prognosis in melanoma (10), glioma (10), squamous cell carcinoma of the skin (11), cervical adenocarcinoma (12), oropharyngeal (13) and nasopharyngeal (14) cancer and cancers of breast (10, 15), bladder (10) and lung (10). Deletion of LRIG1 in mice leads to proliferative phenotypes in skin (16, 17), intestine (18), cornea (19) and lung (20) and to the development of duodenal adenomas with heightened expression of ErbB receptors (21), identifying LRIG1 as a tumor suppressor. LRIG1 marks stem cells of these same tissues and LRIG1 loss provokes stem cell expansion in skin (17, 22) and intestine (18), implicating LRIG1 in stem cell quiescence.
In breast cancer, LRIG1 mRNA and protein are decreased compared to normal tissue (23) and LRIG1 silencing in cultured tumor cells leads to increased proliferation (15, 23), supporting a growth suppressive role for LRIG1. LRIG1 is a transcriptional target of estrogen receptor-alpha (ERα) and as such, LRIG1 expression is enriched in ERα-positive breast cancer where its intermediate/high expression correlates with prolonged relapse-free survival (15). Analysis of LRIG1 expression in the UNC337 dataset (n = 337) revealed that LRIG1 expression is highest in the luminal A (ER-positive) molecular subtype of breast cancer and lowest in the basal-like subtype (9). Basal-like breast cancers (BLBC) are aggressive, stem-enriched cancers of particularly poor prognosis (24–27), defined by the expression of basal cytokeratins (5/6/14/17). BLBCs are “triple negative” as they lack expression of ERα, PR (progesterone receptor) and Her2, limiting their therapeutic management. Furthermore, BLBCs are enriched for mesenchymal markers and display a “cadherin switch” accompanied by decreased levels of epithelial markers (28). These molecular features have been proposed to underlie the highly metastatic nature of basal-like breast cancer (29). Notably, LRIG1 copy number losses were recently found to be most prevalent in triple negative and Her2+ breast tumors, providing one explanation for weak expression of LRIG1 in these settings (30).
Genomic profiling led to the segregation of 51 breast cancer cell lines into Luminal, Basal A (features of both luminal and basal breast cancer) and Basal B (stem-like, mesenchymal) categories (31). Basal B cell lines have substantially greater invasive capacity when directly compared to their Luminal and Basal A counterparts (31). Of note, LRIG1 gene expression is lowest in Basal B cell lines (results within). Collectively, this suggests an inverse correlation of LRIG1 expression with invasive behavior of breast cancer cells. In support of this, breast cancer patients with low/medium expression of LRIG1 experience significantly shorter distant metastasis-free survival (n = 1,576, p = 9.5636×10−08), strongly implicating LRIG1 in limiting cellular behaviors fundamental to metastasis (30). However, the role of LRIG1 in breast cancer cell invasion has not been examined.
In this study, we explore whether LRIG1 makes a functional contribution to the regulation of breast cancer invasion. We demonstrate that endogenous LRIG1 is down-regulated during Twist-induced EMT of human mammary epithelial cells and that depletion of LRIG1 accelerates EMT, expands the CD44hi/CD24lo/− stem cell population and increases mammosphere formation. Re-expression of LRIG1 in Basal B breast cancer cells leads to a striking inhibition of their three dimensional invasive growth, inhibition of migration and invasion and decreased tumorsphere formation. LRIG1 expression in aggressive MDA-MB-231 breast cancer cells slows their growth as tumors in vivo. LRIG1 is unable to limit metastasis of MDA-MB-231 cells but our results suggest that LRIG1-expressing cells may be selected against during metastasis. Our findings provide a molecular rationale for the strong correlation between LRIG1 expression and survival in breast cancer.
RESULTS
LRIG1 expression is lowest in basal-like breast cancer and Basal B breast cancer cells
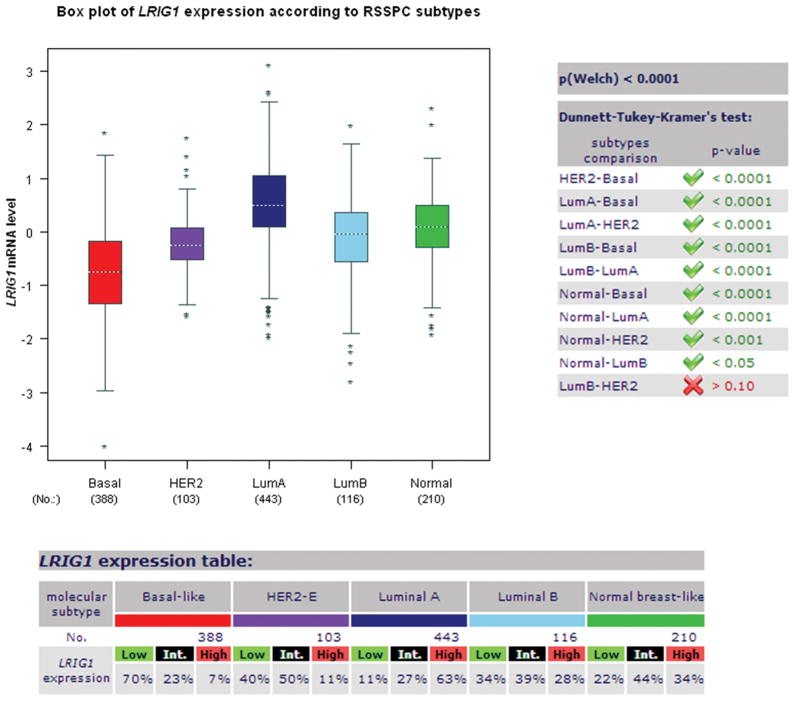
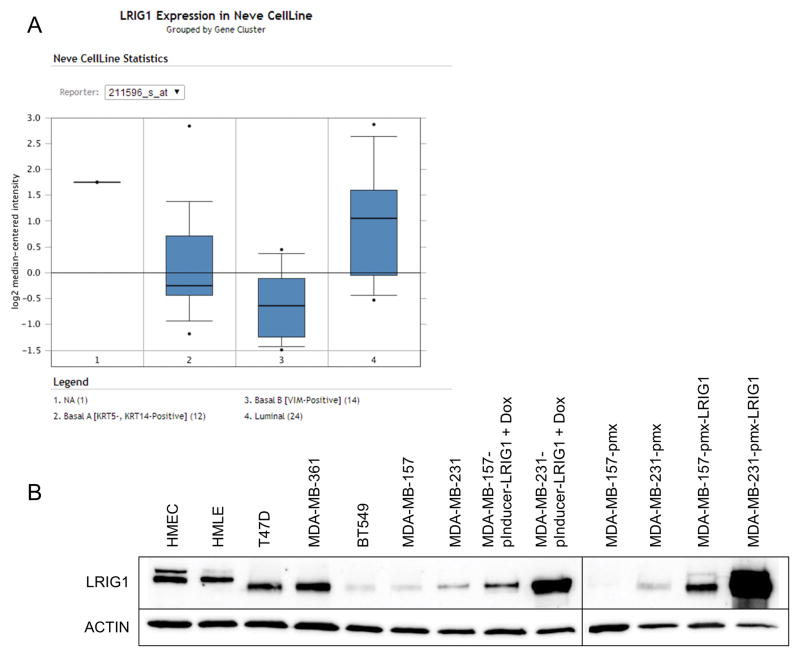
Our prior work demonstrated that LRIG1 mRNA and protein are enriched in ERα-positive breast cancer relative to ERα-negative breast cancer (15). These findings were supported in an analysis of the UNC337 human breast tumor dataset (n = 337) which revealed that LRIG1 mRNA expression is highest in the Luminal A subtype of breast cancer (9). This dataset also revealed that LRIG1 mRNA expression is lowest in basal-like breast cancer, which agrees with the increased frequency of LRIG1 copy number loss observed in triple-negative breast cancers (30). To explore this in an independent dataset, LRIG1 mRNA expression was examined using the publicly available Breast Cancer Gene-Expression Miner v3.0 (32). As shown in Figure 1, LRIG1 mRNA expression is lowest in the basal-like subtype and highest in Luminal A breast cancer (p < 0.0001) (9, 15). This pattern of expression was also observed in three independent datasets accessed through Oncomine (www.oncomine.org) including the Curtis (n = 2,136), Hatzis (n = 508) and Gluck (n = 158) datasets (not shown). LRIG1 mRNA expression was also examined in the Neve dataset which contains 51 human breast cancer cell lines. As shown in Figure 2A, LRIG1 mRNA expression is lowest in the Basal B/Vimentin-positive subset of cell lines. LRIG1 protein expression (Figure 2B) is also significantly lower in the highly invasive Basal B cell lines BT549, MDA-MB-231 and MDA-MB-157 compared to the weakly invasive luminal cell lines T47D and MDA-MB-361 and to HMLE (immortalized human mammary epithelial cells) and HMEC (primary human mammary epithelial cells). Figure 2B also depicts LRIG protein expression in each of the cell lines used in this study (discussed within).
Figure 1. LRIG1 mRNA expression is lowest in Basal-like breast cancer.
The publicly available Breast Cancer Gene-Expression Miner v3.0 was used to assess LRIG1 mRNA expression in breast cancer. The prognostic gene expression analysis tool was used with analysis by molecular subtype and RSSPC robust classification. Tumors were segregated into Basal, Her2-positive, Luminal A, Luminal B and Normal and relative mRNA expression plotted.
Figure 2. LRIG1 expression is lowest in Basal B breast cancer cells.
(A) The publicly available database Oncomine was used to assess LRIG1 mRNA expression in the Neve dataset of 51 breast cancer cell lines. Cell lines are categorized into Basal A, Basal B and Luminal. (B) LRIG1 protein expression was assessed by western blotting of total cell lysates from primary human mammary epithelial cells (HMEC), immortalized human mammary epithelial cells (HMLE), luminal breast cancer cells (T47D, MDA-MB-361) Basal-B breast cancer cells (BT549, MDA-MB-157, MDA-MB-231) and derivatives of MDA-MB-231 and MDA-MB-157 cells, as noted. Actin was used as a loading control. All data are representative of at least 3 independent experiments.
LRIG1 depletion accelerates EMT in human mammary epithelial cells
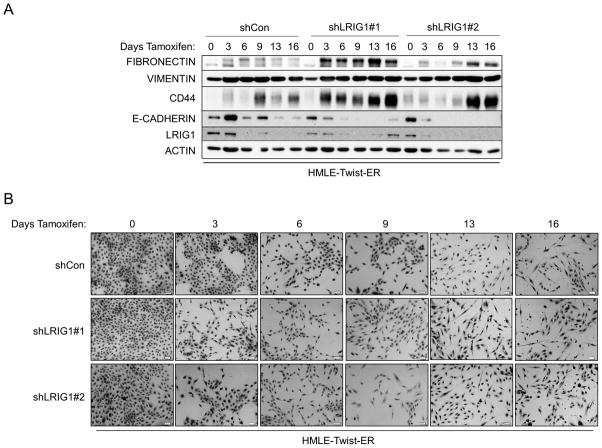
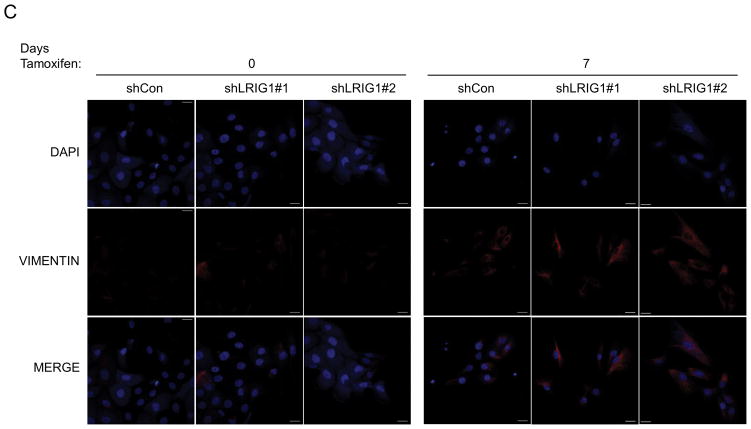
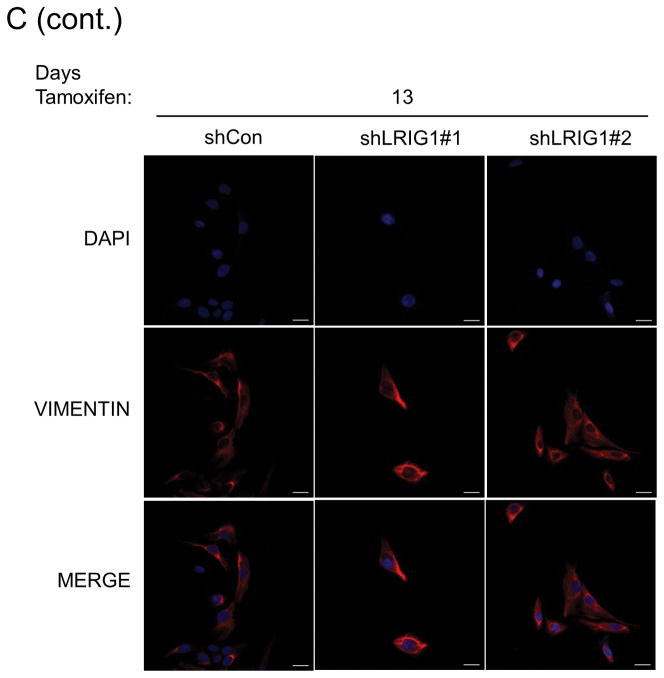
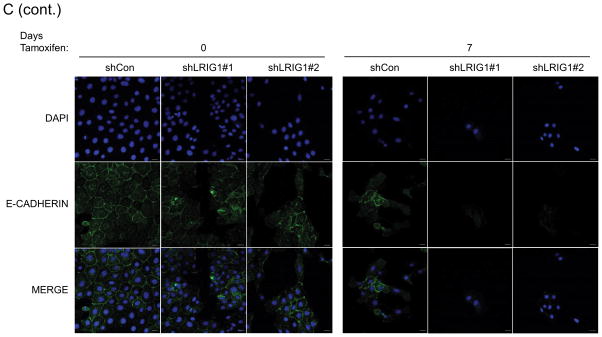
The epithelial to mesenchymal transition is a complex, reversible process that plays a critical role during developmental events such as gastrulation and neural crest formation (33). EMT is thought to be an essential step in the metastatic cascade and endows tumor cells with enhanced motility, invasiveness, tumor initiating capacity and resistance to therapy (33, 34). Hence, factors which regulate EMT are of intense interest. HMLE cells undergo a well-characterized EMT when the transcription factor Twist is ectopically expressed (35, 36). HMLE-Twist-ER cells express Twist fused to a modified estrogen receptor, enabling Tamoxifen-induced Twist activation and subsequent EMT (36). To determine whether LRIG1 expression represents a barrier to EMT, we generated pooled clones of HMLE-Twist-ER cells expressing control shRNA (shCon) or two distinct LRIG1 shRNAs (shLRIG1#1 and shLRIG1#2). HMLE-Twist-ER cells were induced to undergo EMT with Tamoxifen and followed over the course of sixteen days by western blotting (Figure 3A) or light microscopy (Figure 3B). As expected, during the process of EMT, cells down-regulated the epithelial marker E-cadherin and up-regulated the mesenchymal markers Vimentin and Fibronectin (36). There was also an increase in the expression of the stem cell marker, CD44, during EMT. Of note, endogenous LRIG1 protein was significantly down-regulated during EMT in control cells. In cells expressing LRIG1 shRNA, residual LRIG1 was further down-regulated during EMT. In LRIG1 depleted cells, the process of EMT was accelerated such that phenotypic changes indicative of EMT were evident at earlier time points (Figure 3B). These phenotypic changes were mirrored in the more rapid loss of E-cadherin in LRIG1-depleted cells and a more pronounced up-regulation of mesenchymal markers (Figure 3A). The accumulation of the stem cell marker CD44 in LRIG1-depleted cells was striking suggesting that LRIG1 loss may affect stemness of human mammary epithelial cells (examined in Figure 5). HMLE-Twist-ER cells undergoing EMT were also examined with immunofluorescence microscopy, as shown in Figure 3C and 3D. Vimentin staining was increased during EMT, as expected, and at Day 7, Vimentin staining was enhanced in LRIG1-depleted cells (Figure 3C). E-cadherin staining was evident in all cells at Day 0, as expected, but by Day 7, while E-cadherin staining could still be observed in control cells, it was below detection in LRIG1-depleted cells, even in those cells in which cell junctions were still intact.
Figure 3. LRIG1 knockdown accelerates EMT of human mammary epithelial cells.
(A) Western blot analysis of total cell lysates collected from stable pooled clones of HMLE-Twist-ER cells expressing control shRNA (shCon) or LRIG1-targeted shRNAs (shLRIG1# 1 and shLRIG1#2). Cell lysates were prepared pre-Twist induction (Day 0) and post-Twist induction (Days 3, 6, 9, 13, 16). Lysates were blotted as indicated with Actin as a loading control. (B) Images (10x objective) of HMLE-Twist-ER-shCon and HMLE-Twist-ER-shLRIG1#1 and shLRIG1#2 cells pre-Twist induction (Day 0) and post-Twist induction (Days 3, 6, 9, 13, 16). Scale bar = 20 μm. (C) Confocal immunofluorescence analysis of HMLE-Twist-ER-shCon and HMLE-Twist-ER-shLRIG1#1 and shLRIG1#2 cells pre-Twist induction (Day 0) and post-Twist induction (Days 7 and 13). Staining for Vimentin and E-cadherin, as shown. All data are representative of at least 3 independent experiments. Scale bar = 20 μm.
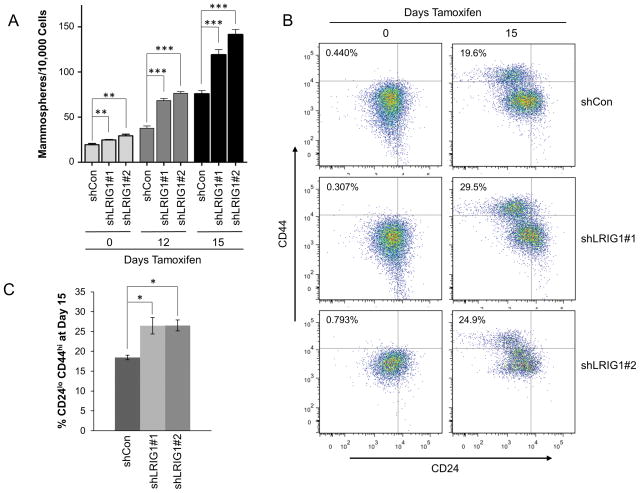
Figure 5. Loss of LRIG1 in HMLE-Twist-ER cells increases mammosphere formation and the population of cells bearing stem cell markers.
(A) Quantification of mammospheres formed by HMLE-Twist-ER-shCon and HMLE-Twist-ER-shLRIG1#1 and shLRIG1#2 cells at Day 0 or after induction of Twist for 12 and 15 days. (B) FACS detection of stem cell markers (CD44, CD24) in HMLE-Twist-ER-shCon cells and HMLE-Twist-ER-shLRIG1#1 and shLRIG1#2 cells at Day 0 and Day 15. (C) Quantification of HMLE-Twist-ER-shCon cells and HMLE-Twist-ER-shLRIG1#1 and shLRIG1#2 cells bearing the CD44hi/CD24lo/− configuration at Day 15 of Twist induction. All data are representative of at least 3 independent experiments. Data are presented as mean ± SEM, collected from 3 independent experiments. (* = p<0.05, ** = p<0.01–0.001, *** = p<0.001 by Student’s t-test).
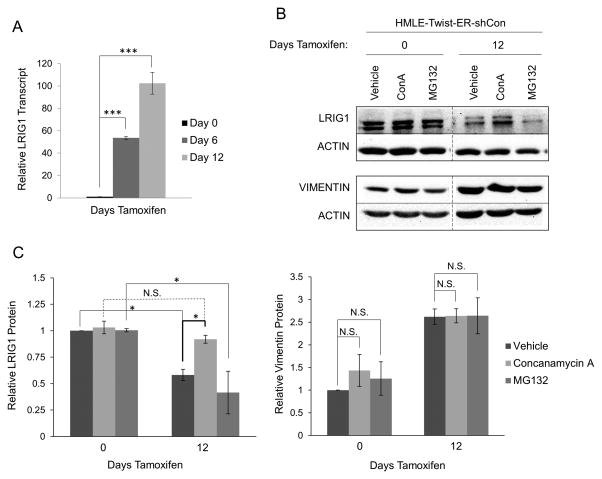
Given that HMLE-Twist-ER cells do not express endogenous estrogen receptor (37), the decrease in LRIG1 expression during EMT is likely a consequence of EMT rather than Tamoxifen-mediated ER-alpha modulation. Interestingly, while LRIG1 protein was clearly down-regulated during EMT, we found that LRIG1 transcript was significantly up-regulated during EMT (Figure 4A). This suggests that LRIG1 protein may be subject to stringent post-translational regulation in cells which are undergoing or have undergone EMT. Indeed, LRIG1 protein expression in HMLE cells which had undergone EMT was rescued by treatment with Concanamycin-A, an inhibitor of lysosomal degradation, but not by MG132, an inhibitor of proteasomal degradation (Figure 4B and C) (4). Vimentin, while up-regulated by EMT, was not significantly impacted by either inhibitor (Figure 4C). This suggests that LRIG1 protein is destabilized in HMLE cells which have undergone EMT and that increased lysosomal turnover contributes, at least in part, to decreased LRIG1 expression in mesenchymal cells. Indeed, decreased LRG1 protein expression in MDA-MB-231 and MDA-MB-157 cells relative to HMLE cells (Figure 2) is not explained by lower LRIG1 mRNA levels in these cells (Supplementary Figure 1), reinforcing the concept that post-translational regulation of LRIG1 contributes significantly to its expression level.
Figure 4. LRIG1 protein expression is increased by lysosomal inhibition in HMLE-Twist-ER cells.
(A) LRIG1 transcript expression was measured by quantitative real time PCR in HMLE-Twist-ER-shCon cells at Day 0, Day 6 or Day 12 post-Twist induction. (B) HMLE-Twist-ER-shCon cells at Day 0 or Day 12 post-Twist induction were treated with DMSO (Vehicle), 100 nM Concanamycin A (ConA) or 10 μM MG132 for 6hrs. Lysates were then probed for LRIG1, Vimentin and Actin. Samples pre- and post-Twist induction were run on the same blot and are directly comparable. (C) Quantification of data shown in (B) with LRIG1 on the left and Vimentin on the right. Data are presented as mean ± SEM, collected from 3 independent experiments. (* = p<0.05 by Student’s t-test).
Since EMT has been shown to increase the stem-like properties of HMLE cells (36), we next examined the impact of LRIG1 depletion on mammosphere formation of HMLE-Twist-ER cells (Figure 5A). As previously reported, Twist-dependent EMT resulted in a significant increase in the mammosphere-forming ability of HMLE cells. Notably, cells in which LRIG1 was depleted, with two different shRNAs (shLRIG1#1 or shLRIG1#2), showed a significantly greater increase in mammosphere-forming ability. As previously reported (36), Twist-dependent EMT of HMLE cells also resulted in an accumulation of cells bearing the stem cell marker configuration CD44hi/CD24lo/−, as assessed by flow cytometry (Figure 5B). Cells in which LRIG1 was depleted showed a greater accumulation of cells bearing CD44hi/CD24lo/− markers, in agreement with the increased mammosphere-forming ability of LRIG1-depleted cells (Figure 5C). Taken together, this suggests that LRIG1 depletion exacerbates EMT-dependent mammary stem cell expansion. Our results also demonstrate that LRIG1 is down-regulated before HMLE cells show evidence of EMT (Figure 3), which suggests that LRIG1 expression may represent an endogenous barrier to EMT.
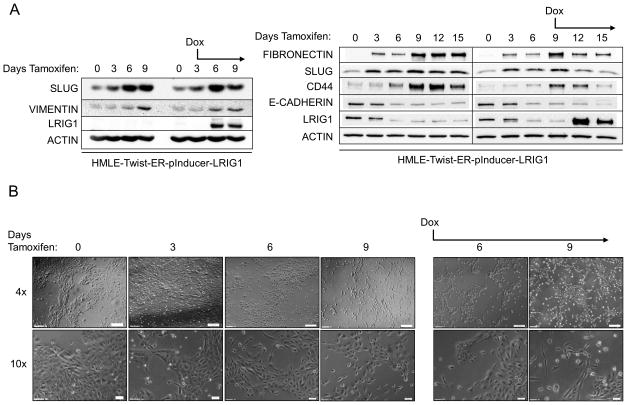
To investigate this further, we created HMLE-Twist-ER cells with doxycycline-inducible LRIG1 expression, as shown in Figure 6 (HMLE-Twist-ER-pInducer-LRIG1). Cells were treated with Tamoxifen to induce EMT and followed by western blotting (Figure 6A) and light microscopy (Figure 6B) for 15 days. Cells undergoing EMT down-regulated LRIG1 and E-cadherin and up-regulated the mesenchymal markers Fibronectin and Slug and the stem cell marker CD44. When LRIG1 expression was induced by treating cells with doxycycline (Figure 6A, the day at which doxycycline treatment was started is indicated), the expression of Fibronectin, Slug and CD44 was blunted, indicating that LRIG1 restricts full expression of EMT markers. In cells with LRIG1 expression, cells were less dispersed and tighter cell contacts could be visualized. Despite this, the level of LRIG1 achieved in this inducible system was unable to fully overcome the pleotropic effects of Twist in driving EMT.
Figure 6. LRIG1 induction in HMLE-Twist-ER cells limits expression of EMT markers.
(A) Western blot analysis of HMLE-Twist-ER-pInducer-LRIG1 cells. “Days Tamoxifen” indicates days of Twist induction. “Dox” indicates when LRIG1 expression was induced with Doxycycline. Total cell lysates were blotted as indicated. (B) Images (4x and 10x objective) of HMLE-Twist-ER-pInducer-LRIG1 cells treated with Tamoxifen to induce Twist (left) or with Tamoxifen and Doxycycline on the indicated day (Day 3, right). All data are representative of at least 3 independent experiments. Scale bar = 200 μm for 4x images, 20 μm for 10x images.
LRIG1 expression in Basal B breast cancer cells inhibits their growth, migration and invasion
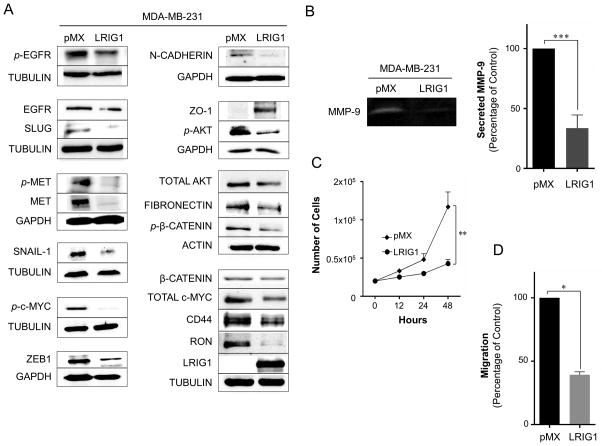
We next determined whether ectopic expression of LRIG1 is sufficient to inhibit the aggressive behavior of Basal B breast cancer cells. For these experiments, we chose two different cell lines in which endogenous LRIG1 was weakly expressed, MDA-MB-231 and MDA-MB-157 (Figure 2). Pooled clones transduced with either pMX (control virus) or pMX-LRIG1 virus were prepared and characterized. The impact of LRIG1 expression in MDA-MB-231 cells was first examined by western blotting (Figure 7A). As previously reported (2–4), LRIG1 decreased the expression and phosphorylation of both EGFR and Met receptor. LRIG1 expression also led to the down-regulation of the RON receptor tyrosine kinase, in agreement with the previous finding that LRIG1 knock-down increases RON expression (38). LRIG1 also decreased the expression and/or phosphorylation of several downstream signaling mediators, including Akt, β-catenin and c-Myc. In addition, LRIG1 decreased the expression of the mesenchymal marker N-cadherin (36) and the transcription factor ZEB1, which has been implicated in the promotion of EMT, cancer cell de-differentiation and repression of epithelial polarity (39–42). Furthermore, LRIG1 decreased the expression of SNAIL-1 and SLUG, master regulators of EMT. Expression of the mesenchymal marker Fibronectin and the stem cell marker CD44 was also decreased. In addition, LRIG1 decreased the secretion of MMP-9 (matrix metalloproteinase-9) which lies downstream of EGFR (43, 44) and Met receptor (45), is enriched in basal-like breast cancer and has been functionally implicated in 231 cell invasion and metastasis (Figure 7B) (46). Conversely, expression of ZO-1 (zonula occluden-1), an epithelial marker and component of epithelial tight junctions (47), was induced in LRIG1-expressing cells. In accordance with its impact on cell signaling, LRIG1 expression significantly decreased the proliferation and migration of 231 cells (Figure 7C and 7D).
Figure 7. LRIG1 suppresses proliferation and migration of MDA-MB-231 breast cancer cells.
(A) Western blot analysis of total cell lysates from MDA-MB-231-pMX control and –LRIG1 cells. Cells are stable, pooled clones. Cells were blotted as indicated. (B) Activity of secreted matrix metalloproteinase-9 (MMP-9) from MDA-MB-231-pMX control and MDA-MB-231-pMX-LRIG1 cells, measured by gelatin-substrate zymography. (C) Proliferation of MDA-MB-231-pMX control and MDA-MB-231-pMX-LRIG1 cells, measured by manual cell counting at the indicated time points. (D) Migration of MDA-MB-231-pMX control and MDA-MB-231-pMX-LRIG1 cells after 12 hrs (before cell division), measured by Boyden chamber transwell migration assay. Data are presented as mean ± SEM, collected from at least 3 independent experiments. (* = p<0.05, ** = p<0.01–0.001, *** = p<0.001 by Student’s t-test).
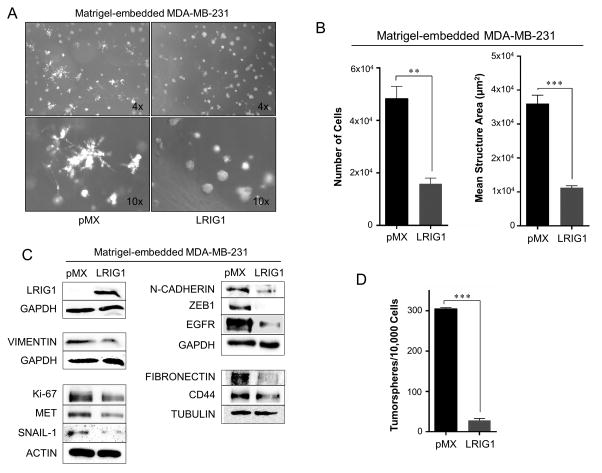
MDA-MB-231 cells are known to form highly invasive, stellate structures when cultured in 3D Matrigel (48). To determine if LRIG1 expression impacts 3D morphology of 231 cells, pooled clones transduced with either pMX or pMX-LRIG1 virus were grown in 3D Matrigel culture (Figure 8A). pMX cells demonstrated the expected invasive morphology while pMX-LRIG1 cells showed a striking loss of invasive morphology and instead grew predominantly as compact, rounded structures with few protrusions. LRIG1 decreased the proliferation of 231 cells in 3D and also decreased the average size of structures which did form (Figure 8B). Western blotting of lysates from cells grown in 3D showed a significant down-regulation of the mesenchymal markers Vimentin, Fibronectin and N-cadherin as well as the EMT-promoting transcription factors ZEB1 and SNAIL-1. The LRIG1 targets, EGFR and MET were also decreased as was expression of the stem cell marker CD44 and the marker of proliferation, Ki67 (Figure 8C). Since LRIG1 depletion was shown to augment EMT-dependent mammosphere formation, we also examined the impact of LRIG1 expression on tumorsphere formation of 231 cells. As shown in Figure 8D, LRIG1 expression led to a significant decrease in tumorsphere formation.
Figure 8. LRIG1 suppresses invasive 3D morphology of MDA-MB-231 breast cancer cells.
(A) Phase-contrast images (4x and 10x objectives, as indicated) of MDA-MB-231-pMX control (left) and MDA-MB-231-pMX-LRIG1 (right) cells grown in 3D Matrigel culture for 7 days. (B) Left panel: Proliferation of MDA-MB-231-pMX control and MDA-MB-231-pMX-LRIG1 cells was measured by manually counting cells recovered from 3D Matrigel culture after 7 days. Right panel: The area of structures observed in (A) were quantified (n ≥ 80 structures). (C) Western blot analysis of total cell lysates from MDA-MB-231-pMX control and –LRIG1 cells recovered after growing in 3D Matrigel culture for 7 days. (D) Quantification of tumorspheres formed by MDA-MB-231-pMX control and MDA-MB-231-pMX-LRIG1 cells. Data are presented as mean ± SEM, collected from at least 3 independent experiments. (** = p<0.01–0.001, *** = p<0.001 by Student’s t-test).
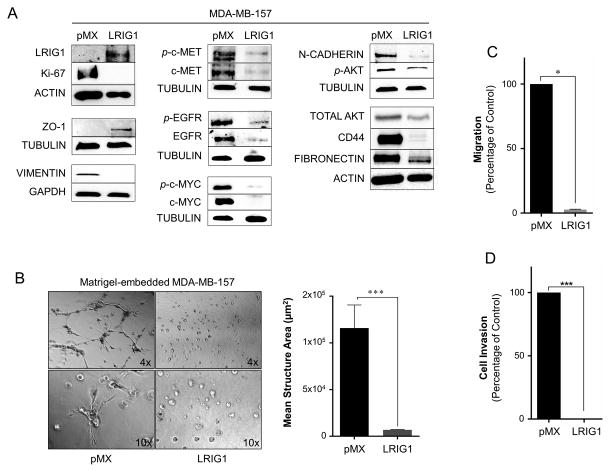
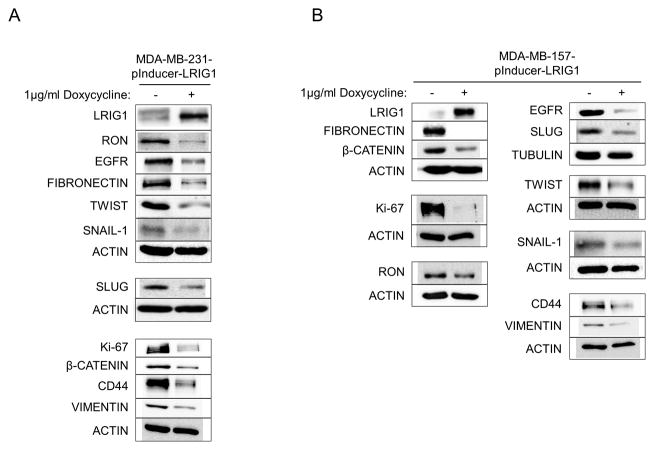
MDA-MB-157 is another highly invasive breast cancer cell line, established from a pleural effusion (49, 50), and belongs to the Basal B category (31). To determine if LRIG1 expression was also able to inhibit the invasion of MDA-MB-157 cells, pooled clones transduced with pMX (control virus) or pMX-LRIG1 were established. As shown in Figure 9A, LRIG1 expression led to the induction of the epithelial tight junction protein ZO-1 (51) and the down-regulation of the mesenchymal markers Vimentin, N-cadherin and Fibronectin. The expression of the stem cell marker CD44 was also dramatically decreased. The expression and phosphorylation of the LRIG1 targets EGFR, Met and c-Myc (52, 53) were also significantly decreased as was the phosphorylation of Akt. Furthermore, LRIG1 expression in 157 cells led to a dramatic loss of invasive morphology in 3D Matrigel culture and a near complete loss of migration as well as invasion through Collagen-I coated Boyden chambers (Figure 9B–D). Collagen-I is the major component of the stromal matrix and the ability of cancer cells to penetrate Collagen-I is distinct from their ability to invade through Matrigel (54–56). The effects of LRIG1 on mesenchymal marker expression, as described above, were recapitulated in MDA-MB-231 and MDA-MB-157 cells with inducible LRIG1 expression (Figure 10). A representation of various markers is shown in Figure 10A (231 cells) and B (157 cells). Of note, the level of LRIG1 expression achieved in the inducible system is less than that achieved with the pMX system and comparable to endogenous LRIG1 expression in human mammary epithelial cells and luminal breast cancer cells (Figure 2).
Figure 9. Lrig1 suppresses migration and invasion of MDA-MB-157 breast cancer cells.
(A) Western blot analysis of whole cell lysates from MDA-MB-157-pMX control and –LRIG1 cells. Cells were blotted as indicated. (B) Phase-contrast images (4x and 10x objectives, as indicated) of MDA-MB-157-pMX control (left) and MDA-MB-157-pMX-LRIG1 (right) cells grown in 3D Matrigel culture for 7 days. The area of structures observed were quantified (n ≥ 60 structures, as shown in far right panel). (C) Migration of MDA-MB-157-pMX control and MDA-MB-157-pMX-LRIG1 cells after 12 hrs, measured by Boyden chamber transwell migration assay. (D) Invasion of MDA-MB-157-pMX control and MDA-MB-157-pMX-LRIG1 cells after 24 hrs, measured by invasion through Collagen I-coated Boyden chambers. Data are presented as mean ± SEM, collected from at least 3 independent experiments (** = p<0.01–0.001, *** = p<0.001 by Student’s t-test).
Figure 10. Inducible expression of LRIG1 decreases expression of mesenchymal markers in MDA-MB-231 and MDA-MB-157 breast cancer cells.
MDA-MB-231-pInducer-LRIG1 (A) and MDA-MB-157-pInducer-LRIG1 (B) Cells were untreated or treated with Doxycycline to induce LRIG1 expression and blotted for various markers as indicated. All data are representative of at least 3 independent experiments.
Our results demonstrate that LRIG1 expression in Basal B breast cancer cells leads to the down-regulation of multiple signaling pathways involved in breast cancer cell growth, motility and invasion. Various mesenchymal markers and effectors are down-regulated by LRIG1 expression and behaviors/capabilities associated with the mesenchymal state, including migration, invasion, invasive growth in Matrigel and tumorsphere formation, are inhibited in LRIG1-expressing cells. The similarities we observed in two independent cell lines and with two different means of LRIG1 expression suggest that LRIG1 expression sets forth a common program which favors the epithelial end of the epithelial-mesenchymal plasticity continuum.
LRIG1 inhibits Basal B breast cancer cell migration through inhibition of c-Met
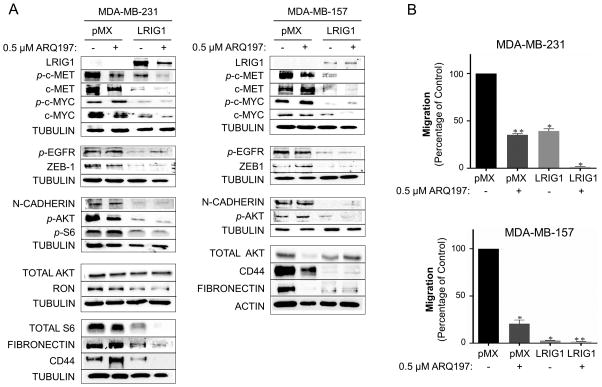
Met receptor is richly expressed in human basal-like breast cancer (55, 56) and has potential as a therapeutic target (57). ARQ197 (Tivantinib) is a small molecule Met inhibitor currently in clinical trials for a variety of tumor types (58), www.clinicaltrials.gov). In MDA-MB-231 and MDA-MB-157 breast cancer cells, models of Met-positive basal-like breast cancer, LRIG1 expression is at least as effective as a clinically achievable dose of ARQ197 at decreasing the expression of phospho-c-Met (Figure 11A) and inhibiting cellular migration (Figure 11B). In the case of LRIG1, the loss of phospho-c-Met signal is due to a simultaneous decrease in total c-Met levels. In MDA-MB-231 cells, residual phospho-c-Met was observed in both ARQ197 treated and LRIG1-expressing cells (Figure 11A, left panel) and in both cases, cells retained some migratory ability (Figure 11B, left panel). When ARQ197 treatment was combined with LRIG1 expression, phospho-c-Met levels were drastically decreased and migration was ablated, suggesting that LRIG1 inhibits cellular migration in 231 cells, at least in part, through its effects on Met receptor. In MDA-MB-157 cells, LRIG1 was more effective than ARQ197 at decreasing phospho-c-Met signal (Figure 11A, right panel) and was also more effective at decreasing migration (Figure 11B, bottom panel), with very little residual migration in LRIG1-expressing cells. Adding ARQ197 treatment to LRIG1 expression in MDA-MB-157 cells further decreased Met receptor phosphorylation but no further impact on migration was assessed due to the high sensitivity of MDA-MB-157 cells to LRIG1 expression. While the ability of ARQ197 and LRIG1 to inhibit cell migration correlates with their impact on Met receptor phosphorylation, LRIG1 inhibits the activation of multiple pathways. For example, ARQ197 had no effect on the phosphorylation of c-Myc while LRIG1 expression led to the down-regulation of c-Myc (52) and an accompanying loss of phospho-c-Myc in both cell lines (Figure 11A). Importantly, EGFR and Akt remained phosphorylated in ARQ197 treated cells (Figure 11A), providing a means to sustain survival signaling in the face of Met inhibition, while in LRIG1-expressing cells, phosphorylation of EGFR and Akt were decreased. ARQ197 treatment had no effect on the expression of the mesenchymal markers ZEB1 and N-cadherin while both were decreased in LRIG1-expressing cells. Interestingly, ARQ197 did decrease Fibronectin and CD44 expression in MDA-MB-157 cells but not in MDA-MB-231 cells, suggesting that this is not a consistent effect of ARQ197 treatment. Given the broad impact of LRIG1 on cell signaling pathways relevant to migration and invasion, LRIG1 should be effective in a variety of cellular contexts. In support of this, LRIG1 was previously found to inhibit the invasion of EGFRvIII-positive glioblastoma cells (59) and EGFR-expressing bladder cancer cells (60). Furthermore, LRIG1 knock-down in head and neck cancer cells led to increased migration and invasion through the EGFR/MAPK/SPHK1 pathway (14).
Figure 11. LRIG1 expression in Met receptor positive Basal B breast cancer cells is as effective as Met inhibition.
(A) Left panel: Western blot analysis of total cell lysates from MDA-MB-231-pMX control and –LRIG1 cells, treated with and without 0.5 uM ARQ197 for 24 hours, as indicated. Right panel: Western blot analysis of total cell lysates from MDA-MB-157-pMX control and –LRIG1 cells, treated with and without 0.5 uM ARQ197 for 24 hours, as indicated. (B) Migration of pMX control and LRIG1-expressing MDA-MB-231 (top panel) and MDA-MB-157 (bottom panel) cells with and without 0.5 μM ARQ197 was measured after 12 hrs by Boyden chamber transwell migration assay. Data are presented as mean ± SEM, collected from at least 3 independent experiments (** = p<0.01–0.001, *** = p<0.001 by Student’s t-test).
LRIG1 inhibits growth of MDA-MB-231 cells in vivo
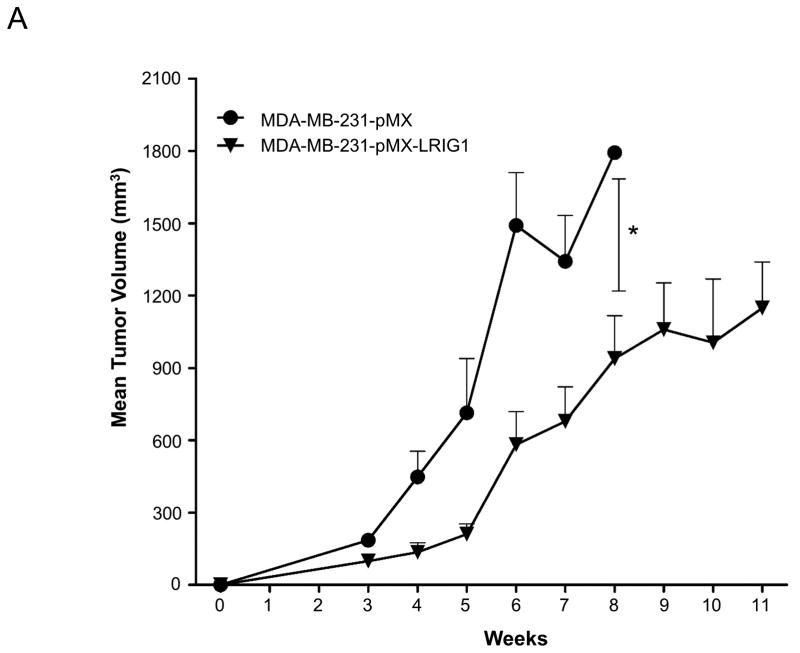
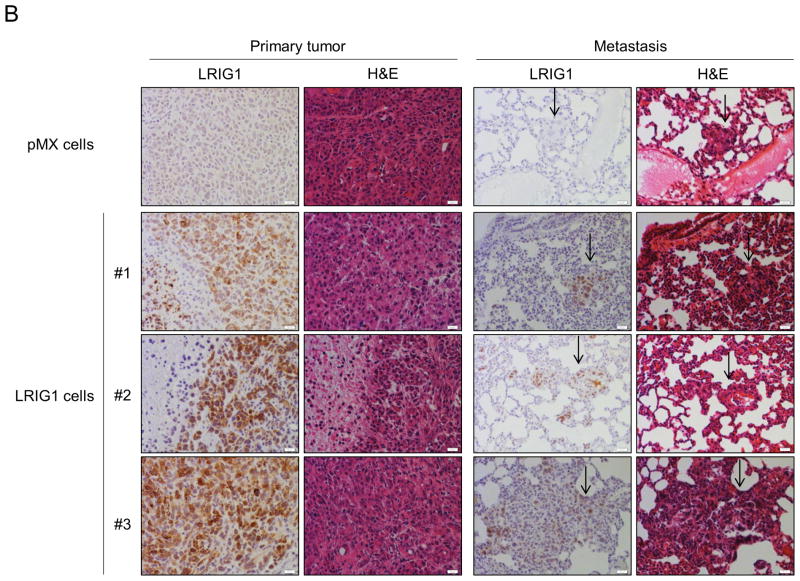
Finally, we examined the impact of LRIG1 expression on the growth and metastasis of MDA-MB-231 cells in vivo. Pooled clones of MDA-MB-231 cells expressing either pMX (control) virus or pMX-LRIG1 virus (Figure 2) were xenografted into the mammary fat pad of NOD.SCID female mice. MDA-MB-231 cells expressing pMX-LRIG1 virus were chosen for in vivo experiments due to their superior LRIG1 expression (Figure 2) and the potential complication of post-translational loss of LRIG1 (Figure 4). Tumor volume was followed over a period of eleven weeks, as shown in Figure 12A. We found that LRIG1 expression led to a significant decrease in tumor growth. Metastasis of MDA-MB-231 cells to the lung was examined and comparisons between pMX (control) and LRIG1 were made when primary tumors were of approximately the same size. No differences in the number (data not shown) or size of metastatic foci (Figure 12B) were observed between pMX and LRIG1 expressing cells. This was unexpected given the impact of LRIG1 on cellular behaviors which underlie metastasis. However, when examining LRIG1 expression in primary tumors and their matched metastases, we noted that in each case, LRIG1 staining was weaker in the metastases than in the primary tumors (representative images in Figure 12B). This suggests that cells which robustly express LRIG1 may be selected against during metastasis, in other words, a “failure to launch” of LRIG1-expressing cells. However, we cannot currently rule out other contributions to weak LRIG1 expression in metastatic foci, including the possibility that LRIG1 expression may be decreased during metastasis (after launching) and/or by factors which are expressed in the lung. Another possibility is that LRIG1 is decreased after cancer cells arrive at the lung, during the mesenchymal to epithelial transition (MET) which enables colonization of the metastatic tissue by cancer cells or conversely, that the weak LRIG1 expression we do observe in metastatic foci is a consequence of LRIG1 up-regulation by MET. Nevertheless, LRIG1 limited the primary tumor growth of highly aggressive MDA-MB-231 cells, underscoring the role of LRIG1 as a growth suppressor.
Figure 12. LRIG1 inhibits growth of MDA-MB-231 breast cancer cells in vivo.
(A) MDA-MB-231-pMX and MDA-MB-231-pMX-LRIG1 cells were xenografted into the mammary fat pad of NOD.SCID female mice and tumor volume was followed over time with caliper measurement. Data are presented as mean ± SEM, * = p<0.05 by two-way ANOVA. (B) Immunohistochemical (IHC) and hematoxylin and eosin (H&E) staining of primary tumors and metastatic lesions, as indicated. Top row: pMX (control) cell xenograft. #1–3: Representative primary tumors and matched metastatic lesions from LRIG1 xenografts. Scale bar = 20 μm.
DISCUSSION
LRIG1 was identified as a negative regulator of receptor tyrosine kinase signaling in 2004 (2, 3) and has since emerged as a tumor suppressor (21) and an important player in human malignancy (9). LRIG1 is frequently down-regulated in cancer and its depletion/loss correlates with poor patient prognosis across tumor types of diverse origin (10), emphasizing its fundamental importance. In breast cancer, LRIG1 expression is enriched in ERα-positive luminal disease, as a consequence of transcriptional regulation by ERα, where its intermediate/high expression correlates with prolonged relapse-free survival (15). LRIG1 mRNA expression is lowest in basal-like breast cancer (9), this study), an aggressive subtype of breast cancer with particularly poor prognosis (61, 62). Basal-like breast cancers are enriched for markers and effectors of EMT, including vimentin and ZEB1, and show significant enrichment for mesenchymal gene signatures related to stemness and angiogenesis (62–64). In cancer, EMT is likely a prerequisite to metastasis (65, 66) and while there is significant evidence to support this concept, it is not without controversy (67). EMT in cancer, as opposed to development, may be of a transient nature and hence, difficult to document (66). Furthermore, disseminated tumor cells are thought to undergo the process opposite to EMT, mesenchymal-to-epithelial transition (MET), during colonization of distant sites (65, 68), with the accompanying reemergence of epithelial markers (69). Direct in vivo evidence for EMT in mammary tumorigenesis was obtained using a cell-fate mapping approach in a Myc-driven transgenic model (70). In this same study, Myc amplification in human breast cancer was found to be associated with EMT which led the authors to suggest that Myc dys-regulation in particular may predispose to EMT. In this regard, it is notable that LRIG1 has been found to suppress Myc in keratinocytes (52), in human glioma cells (53) and in Basal B breast cancer cells (this study).
LRIG1 expression is strongly correlated with distant metastasis-free survival (DMFS) in breast cancer (n = 1,576, p = 9.5636×10−08) (30). Given the impact of LRIG1 on cellular processes which are fundamental to metastasis, including EMT, migration and invasion, our data suggest that LRIG1 contributes functionally to prolonged DMFS. We find that endogenous LRIG1 is down-regulated during EMT of human mammary epithelial cells and that its depletion accelerates EMT, strongly suggesting that LRIG1 expression represents a barrier to EMT, which is overcome by its down-regulation. In support of this, forced LRIG1 expression in human mammary epithelial cells blunts Twist-mediated induction of mesenchymal markers. Depletion of LRIG1 in human mammary epithelial cells also augments EMT-dependent stem cell expansion. Re-expression of LRIG1 in Basal B breast cancer cells, which have the greatest mesenchymal character and the lowest endogenous LRIG1 expression, leads to a striking reversion of their aggressive phenotype in 3D culture, loss of mesenchymal markers and re-expression of epithelial markers, and inhibition of migration, invasion and tumorsphere formation. Expression of LRIG1 in aggressive MDA-MB-231 cells limits their growth as tumors in vivo, providing the first such evidence for LRIG1 in breast cancer. However, LRIG1 expression did not decrease metastasis of MDA-MB-231 cells to the lungs. This was unexpected given the impact of LRIG1 on in vitro cellular behaviors which underlie metastasis. Our data suggest that cells expressing high levels of LRIG1 may have been selected against during the metastatic process, undermining the assessment of LRIG1 impact on metastasis. Indeed, we found that post-translational regulation of LRIG1 in mesenchymal cells significantly limits its expression and that metastatic foci showed only weak LRIG1 staining. This suggests that during the evolutionary process of metastasis, cells which expressed little to no LRIG1 had an advantage.
Met overexpression is linked to poor prognosis in breast cancer and its inhibition may be a viable approach for the management of basal-like breast cancer (71, 72). LRIG1 decreases Met expression and phosphorylation in Met-positive Basal B breast cancer cells but has the additional “benefit” of simultaneously inhibiting the EGF receptor. Met and EGFR are frequently co-expressed in basal-like breast cancer (56, 73) and undergo substantial cross-talk. Indeed, triple-negative breast cancer patients who co-express Met and EGFR show significantly worse disease-free survival than those who express EGFR alone (56). Inhibition of Met sensitizes breast cancer cells to EGFR-directed inhibitors, implicating Met in resistance to anti-EGFR therapy (56, 74–76). Conversely, depletion of EGFR sensitizes basal breast cancer cells to Met-directed inhibitors, implicating EGFR in resistance to anti-Met therapy (56). Combined treatment of basal breast cancer cells with the EGFR inhibitor Erlotinib and the Met inhibitor PHA-665752 synergistically inhibits cell growth, underscoring the potential of a combined approach in basal-like breast cancer (56). Given the importance of Met and EGFR in basal-like breast cancer, the unique ability of LRIG1 to inhibit both suggests that LRIG1-derived therapies, although currently not clinically feasible, may, in the future, hold promise.
In summary, this study is the first to demonstrate that LRIG1 is down-regulated during EMT of human mammary epithelial cells, providing one molecular explanation for its weak expression in mesenchymal-enriched, basal-like breast cancers. Furthermore, this study provides the first evidence that LRIG1 depletion accelerates EMT and expands the mammary stem cell population, demonstrating that LRIG1 may function as a molecular “brake” during EMT. This study is also the first to demonstrate that re-expression of LRIG1 in aggressive basal breast cancer cells is sufficient to promote MET (mesenchymal-to-epithelial transition) in vitro as evidenced by phenotype in 3D culture, re-expression of epithelial markers and loss of migratory, invasive and sphere forming ability. Finally, LRIG1 inhibits the growth of MDA-MB-231 cells as tumors in vivo and cells expressing LRIG1 may be selected against during breast tumor cell metastasis.
MATERIALS AND METHODS
Cell Culture and Drug Inhibition
Human primary epithelial cells (HMEC) were purchased from Invitrogen and human breast cancer MDA-MB-231, MDA-MB-157, BT549, MDA-MB-361, and T47D cells were purchased from ATCC (Rockville, MD). The cells were grown as recommended by the supplier with penicillin-streptomycin (Life Technologies Corporation, NY) at 37°C in 10% CO2. HMLE and HMLE-Twist-ER cells were generous contributions from Professor R. Weinberg (The Whitehead Institute, Cambridge, MA) and were grown in Mammary Epithelial Growth Medium (MEGM) from Lonza with penicillin-streptomycin. 50 nM 4-hydroxytamixofen (Sigma) was added to the HMLE-Twist-ER cells to induce Twist-ER expression. HMLE-Twist-ER cells were treated with DMSO or 100 nM Concanamycin-A (VWR International) or 10 μM MG132 (EMD Millipore) for six hours prior to harvesting of total cell lysates for western blotting. MDA-MB-231 and MDA-MB-157 cells were treated with 0.5 μM ARQ197 for 24 hrs to assess effect on c-Met phosphorylation.
Generation of Stable Cell Lines by Retroviral Transduction
The 293GPG packaging cell line and pMX-pie (pMX) cloning vector were generous gifts from Dr. Paola Marignani (Dalhousie University). The 293GPG cells were maintained in DMEM–10% FBS, 100 μg/ml G418 (Invitrogen), 2 μg/ml puromycin (Sigma), and 10 μg/ml tetracycline (Sigma). myc-LRIG1 subcloned into pMX was transfected as previously described (16). Production of retrovirus was initiated by removal of tetracycline from the medium. Collected supernatant from pMX- and pMX-LRIG1 retrovirus producing cells was then added to the medium of MDA-MB-231 and MDA-MB-157 cells, followed by selection with 2μg/ml puromycin. All puromycin-resistant clones were pooled to avoid clonal variation.
Generation of Stable Inducible LRIG1 Cell Lines
myc-LRIG1 was subcloned from pCDNA3.1-myc-LRIG1 (77) into donor vector pDONR221 and then pInducer20 lentiviral destination vector using BP and LR Gateway cloning reagents (Invitrogen). Lentivirus was produced by transfecting HEK-293T cells with pInducer-LRIG1, pVSV-g envelope, and PsPax2 packaging vectors. Viral supernatants were collected in serum free, antibiotic free DMEM media and added to MDA-MB-231, MDA-MB-157, and HMLE-Twist-ER cells in the presence of 2 μg/ml polybrene. Stable cells were selected for in G418, and LRIG1 expression was induced and maintained by adding 1–2 μg/mL of doxycycline (Sigma) every 12 hours.
Generation of Stable Cell Knockdown Cell Lines
shLRIG1 and scrambled control short hairpin RNA (shCon) lentiviral particles were purchased from Santa Cruz Biotechnology. The shRNA lentiviral particles were added to the medium of HMLE-Twist-ER cells in the presence of 2 μg/ml polybrene, followed by selection with 2 μg/ml puromycin.
Three-dimensional Culture Morphology and Cell Recovery
Three-dimensional (3D) Matrigel culture methods were adapted from previously described methods (78). To summarize, 2,500 single cells were seeded on a solidified layer of Growth Factor Reduced Matrigel (BD Bioscience San Diego, CA) and grown in DMEM containing 10% FBS and 2% Matrigel. After 7 days in culture, cells were imaged and quantified. The morphology was imaged by an Olympus IX81 inverted microscope with cellSens Entry software (the objective varies and is listed on the figure). BD cell recovery solution (BD Bioscience San Diego, CA) was used according to manufacturer’s instructions to harvest 3D structures from Matrigel for subsequent immunoblot and cell proliferation analysis. All data are representative of at least 3 independent experiments.
Gelatin Zymography
SDS-PAGE gelatin-substrate zymography was performed to detect the activity of MMP9 as described (79). Briefly, MDA-MB-231-pMX vector and MDA-MB-231-pMX-LRIG1 cells were cultured to 80% confluence, followed by collection of conditioned media. 20 μl of conditioned media were loaded in SDS-PAGE gels containing 0.1% gelatin. The gels were incubated in developing buffer (0.05 M Tris–HCl pH 8.0, 5 mM CaCl2) for 24 hrs followed by staining with Coomassie Brilliant Blue G-250 (Sigma, Missouri, USA). Gels were then destained using methanol:acetic acid:water (4.5:1:4.5, v:v:v). All data are representative of 3 independent experiments.
Western Blotting
For western blot, samples were resolved by SDS-PAGE, transferred to nitrocellulose membranes, and blotted with various antibodies; anti-GAPDH (#2118), N-cadherin (#13116), E-cadherin (#3195), Vimentin (#5741), Slug (#9585), Snail-1 (#3879), ZEB1 (#3396), ZO-1 (#8193), phospho-Met (Tyr1349) (#3121), Ron (#4269), pβ-catenin (Thr41 or Ser45) (#9565), β-catenin (#8480), S6 (#2217), total Akt (#9272), phospho-c-Myc (Thr58/Ser62) (#9401), Ki-67 (#9027), phospho-AKT (Ser473) (#9271), phospho-EGFR (Tyr1068) (#11862), LRIG1 (#12752), c-Met (#8198) and antibodies were purchased from Cell Signaling Technology. LRIG1 (G-20) (#sc-50075) and EGFR (#sc-03) antibodies were purchased from Santa Cruz Biotechnology. c-Myc antibody (clone 9E11) (#MS-127-P0) was purchased from Neomarkers. Fibronectin (#GTX112794), CD44 (#GTX102111) and Twist (#GTX127310) were purchased from Genetex (CA, USA). Actin (#A5441) and Tubulin (#T5168) were purchased from Sigma (MO, USA). All antibodies used horseradish peroxidase-conjugated secondary antibodies (Biorad), followed by developing with SuperSignal West chemicals (Pierce). An AlphaInnotech imaging station with FluorChem software was used to capture images. All data are representative of more than three independent experiments.
Cell Proliferation
For 2D cell culture cell proliferation; 2×10⁴ cells were seeded on 24-well plates. After the indicated time points, cells were trypsinized, washed with PBS, and counted using a hemocytometer. The experiments were done with two separately pooled clone populations and repeated at least three times. For three-dimensional (3D) Matrigel culture, the cells were grown as described above. After 7 days in culture, the cells were recovered by BD cell recovery solution (BD Bioscience San Diego, CA) and counted using a hemocytometer.
Migration and Invasion Assays
Cells transduced with LRIG1 or control pMX vector were plated at 40,000 cells/well in 24-well Boyden chambers with 8 μm-pore polycarbonate membranes (Corning, Lowell, MA, USA) according to the manufacturer’s protocol. Cells were seeded in serum-free media and allowed to migrate for 12 hrs toward the lower chamber containing media with 10% FBS. In some experiments, the c-Met-specific inhibitor 0.5 μM ARQ197 (Active Biochemicals, Selleck, USA) was added in the upper and low compartments. After 12 hrs, the cells were fixed and stained with Diff-Quick staining solution (Dade Behring, Newark, DE, USA). For the cell invasion assay, the chambers were pre-coated with collagen type I (BD Bioscience San Diego, CA). Migrated cells were imaged and counted in 10 microscopic fields on an Olympus IX81 inverted microscope with cellSens Entry software using a 10x objective. The results were averaged among three independent experiments.
Mammosphere Assay
Mammospheres were seeded at 1×10⁴ cells per well of a 12-well Ultra Low Cluster Plate (Corning) and grown for 7 days in MammoCult medium (StemCell Technologies). Wells were fed every third day with 1 mL media. After 7 days, spheres were counted as previously described (36, 80). Data are presented as mean ± SEM, n=3.
Immunofluorescence
Cells were fixed at the indicated time point in 4% paraformaldehyde, blocked in IF blocking buffer (1% BSA, 5% goat serum, 0.2% NP-40, 0.02% sodium azide), and stained with primary antibodies rabbit anti-Vimentin (#5741), or mouse anti-E-cadherin (#14472) (both from Cell Signaling Technology), followed fluorescently labeled anti-rabbit or anti-mouse secondary antibodies (Life Technologies) as appropriate. After washes, nuclei were stained with DAPI and mounted with Flouromount G (Southern Biotech). Images were captured on an LSM710 AxioObserver or a Leica TSC SP8 microscope confocal microscope and processed with ZenLite 2011 software. All data are representative of three independent experiments.
Flow Cytometric Analysis
Cells were collected on the indicated days and fixed in 4% paraformaldehyde. Cells were washed in PBS and resuspended in 1% FBS in PBS with 0.02% sodium azide. The fixed cells were stored at 4°C until completion of the 15 day time course so all cells could be stained together. The cells were stained with PacificBlue anti-mouse/human CD44 (#311119) and PE/Cy7 anti-human CD24 (#103020) (both from BD Bioscience, San Diego, CA) for 1 hr at 4°C, then washed 3 times in 1% FBS in PBS with 0.02% sodium azide. After staining, flow cytometric analysis was performed on a Fortessa Flow Cytometer (Becton Dickinson). Results were analyzed by FloJo 9.6. Data are presented as mean ± SEM, n=3.
Gene Expression Analysis
The publicly available Oncomine database (www.oncomine.org) was used to assess LRIG1 mRNA expression in the Neve dataset of 51 breast cancer cell lines (31). Breast cancer cell lines were sorted by gene cluster and the log expression of LRIG1 was compared. This database was also used to assess LRIG1 mRNA expression in the Curtis, Hatzis and Gluck datasets (not shown). Tumors were sorted by PAM50 molecular subtype into Normal, Basal-like, Her2, Luminal A and Luminal B and the log expression of LRIG1 was compared. The Breast Cancer Gene-Expression Miner Version 3.0 was also used to assess LRIG1 mRNA expression (32). The prognostic gene expression analysis tool was used with analysis by molecular subtype and RSSPC robust classification.
For real-time PCR (qPCR) analysis of LRIG1 expression in cell lines, RNA was isolated from cells using PureLink RNA Mini Kit (Life Technologies) according to manufacturer’s protocol. The High-Capacity cDNA reverse transcription kit (Applied Biosystems) was used to make cDNA, and qPCR was performed in a Bio-Rad iCycler CFX-96 using SsoAdvanced Universal Probes Supermix (Bio-Rad) and TaqMan gene specific probes (Applied Biosystems). Relative LRIG1 mRNA levels (probe: Hs00394267_m1) were normalized to glyceraldehyde-3-phosphate dehydrogenase (GAPDH) levels for each sample. Data are presented as mean ± SEM, n=3.
Human Breast Cancer Xenograft Experiments
Female NOD.SCID mice were purchased from The Jackson Laboratory. All animal studies were conducted according to protocols approved by the Institutional Animal Care and Use Committee of the University of California, Davis. The sample size was calculated by using power analysis and the minimum number of animals required to be considered clinically significant were used in the study. Cells were harvested using trypsin (0.05%) and washed twice with cold sterile PBS without calcium chloride and magnesium chloride (Sigma, MO). 2.5×10⁶ cells were mixed 50:50 (v/v) with Matrigel (Sigma, MO), and the mice were randomly chosen and injected with either pmx- or pmx-LRIG1 expressing MDA-MB-231 cells into the left #4 mammary fat pad of 10-week-old female NOD.SCID mice to establish primary tumors. Tumor volumes were measured by caliper and were calculated as an ellipsoid by the formula tumor volume (mm3) = [length (mm)] × [width (mm)]2 × 0.52. Animals that became sick for reasons judged to be independent of their tumors were sacrificed prior to the tumor reaching criterium and were excluded from the analysis. The final analysis contains 6 pmx tumors and 7 pmx-LRIG1 tumors. Each mouse was sacrificed when its primary tumor reached 1,500~2,000 mm3 in volume. At the end of the experiment, animals were euthanized and selected tissues were processed for subsequent histology.
Immunohistochemical (IHC) Staining
Xenograft tumors and associated lungs were fixed in 4% paraformaldehyde and paraffin embedded. 5 μm sections were stained with haematoxylin and eosin (H&E) to assess tissue cellular morphology or were used for IHC after heat-induced antigen retrieval. Four paraffin embedded sections from each group (6 pmx and 7 pmx-LRIG1 tumors) were randomly chosen for H&E and LRIG1 IHC stain. The slides were incubated in 3% H2O2 to quench endogenous peroxidase activity, permeabilized with Triton-X100 in PBS, followed with blocking with 5% goat normal serum in PBS + 0.05% Tween (PBST). Anti-human LRIG1 (1:100, Genetex, USA cat#GTX119485) was used in 5% goat normal serum in PBST. The sections were incubated with biotinylated secondary antibody (Jackson Labs, USA) and Streptavidin-Peroxidase-HRP (Invitrogen, USA). For all slides, final detectable signal was visualized by NovaRED substrate kit (Vector lab, USA). After counterstaining with haematoxylin, slides were mounted.
Whole-Lung Carmine Aluminum Stain
Whole mount analysis was performed on the lungs in order to identify and enumerate metastases. Briefly, lungs were fixed overnight in 4% paraformaldehyde, stored overnight in 70% ethanol, and stained 48 hrs in carmine aluminum solution (0.22% carmine, 0.55% aluminum potassium sulfate). The lungs were than dehydrated by 70%, 90%, 100% ethanol and xylene respectively. The tumor nodules in lungs were counted by a blinded observer on a dissection microscope.
Statistical Analyses
Graphs were prepared using Prism Graphing Software (V5; GraphPad Software, San Diego, CA, USA) and statistical analyses were performed using InStat Statistical Software (V3.0; GraphPad Software). Differences between data groups were evaluated for significance using Student’s t-test or one-way analysis of variance (ANOVA) and Bonferroni post-test. The tumor volume was analyzed with two-way ANOVA. p value of less than 0.05 (*) was considered significant, with other p values represented as p<0.01–0.001 (**) and p<0.001 (***). Data points and error bars represent mean values ± SEM.
Supplementary Material
Acknowledgments
The authors thank Dr. Robert Weinberg (Whitehead Institute) for the kind gift of the HMLE and HMLE-TwistER cells, Dr. Paola Marignani (Dalhousie University) for the kind gift of the 293GPG packaging cell line, and Dr. Ashley Hodel and Mr. Sina Azadi for technical support and advice. Dr. Nucharee Yokdang was a trainee on the T32 training grant in Oncogenic Signals and Chromosome Biology (CA108459). Dr. Joseph Tellez was supported by a Lawrence Livermore National Labs UC Davis Fitzpatrick Research Fellowship. This work was supported by NIH grants CA118384 (Sweeney) and CA166412 (Carraway). We acknowledge the UC Davis Comprehensive Cancer Center Support Grant (CCSG) awarded by the National Cancer Institute (NCI P30CA093373) for using the flow cytometer.
Footnotes
CONFLICT OF INTEREST
The authors declare no conflict of interest.
References
- 1.Hedman H, Henriksson R. LRIG inhibitors of growth factor signalling - double-edged swords in human cancer? Eur J Cancer. 2007;43(4):676–82. doi: 10.1016/j.ejca.2006.10.021. [DOI] [PubMed] [Google Scholar]
- 2.Gur G, Rubin C, Katz M, Amit I, Citri A, Nilsson J, et al. LRIG1 restricts growth factor signaling by enhancing receptor ubiquitylation and degradation. EMBO J. 2004;23(16):3270–81. doi: 10.1038/sj.emboj.7600342. [DOI] [PMC free article] [PubMed] [Google Scholar]
- 3.Laederich MB, Funes-Duran M, Yen L, Ingalla E, Wu X, Carraway KL, 3rd, et al. The leucine-rich repeat protein LRIG1 is a negative regulator of ErbB family receptor tyrosine kinases. J Biol Chem. 2004;279(45):47050–6. doi: 10.1074/jbc.M409703200. [DOI] [PubMed] [Google Scholar]
- 4.Shattuck DL, Miller JK, Laederich M, Funes M, Petersen H, Carraway KL, 3rd, et al. LRIG1 is a novel negative regulator of the Met receptor and opposes Met and Her2 synergy. Mol Cell Biol. 2007;27(5):1934–46. doi: 10.1128/MCB.00757-06. [DOI] [PMC free article] [PubMed] [Google Scholar]
- 5.Lee JM, Kim B, Lee SB, Jeong Y, Oh YM, Song YJ, et al. Cbl-independent degradation of Met: ways to avoid agonism of bivalent Met-targeting antibody. Oncogene. 2014;33(1):34–43. doi: 10.1038/onc.2012.551. [DOI] [PubMed] [Google Scholar]
- 6.Ledda F, Bieraugel O, Fard SS, Vilar M, Paratcha G. Lrig1 is an endogenous inhibitor of Ret receptor tyrosine kinase activation, downstream signaling, and biological responses to GDNF. J Neurosci. 2008;28(1):39–49. doi: 10.1523/JNEUROSCI.2196-07.2008. [DOI] [PMC free article] [PubMed] [Google Scholar]
- 7.Rondahl V, Holmlund C, Karlsson T, Wang B, Faraz M, Henriksson R, et al. Lrig2-deficient mice are protected against PDGFB-induced glioma. PLoS One. 2013;8(9):e73635. doi: 10.1371/journal.pone.0073635. [DOI] [PMC free article] [PubMed] [Google Scholar]
- 8.Nilsson J, Vallbo C, Guo D, Golovleva I, Hallberg B, Henriksson R, et al. Cloning, characterization, and expression of human LIG1. Biochem Biophys Res Commun. 2001;284(5):1155–61. doi: 10.1006/bbrc.2001.5092. [DOI] [PubMed] [Google Scholar]
- 9.Wang Y, Poulin EJ, Coffey RJ. LRIG1 is a triple threat: ERBB negative regulator, intestinal stem cell marker and tumour suppressor. Br J Cancer. 2013;108(9):1765–70. doi: 10.1038/bjc.2013.138. [DOI] [PMC free article] [PubMed] [Google Scholar]
- 10.Rouam S, Moreau T, Broet P. Identifying common prognostic factors in genomic cancer studies: a novel index for censored outcomes. BMC Bioinformatics. 2010;11:150. doi: 10.1186/1471-2105-11-150. [DOI] [PMC free article] [PubMed] [Google Scholar]
- 11.Tanemura A, Nagasawa T, Inui S, Itami S. LRIG-1 provides a novel prognostic predictor in squamous cell carcinoma of the skin: immunohistochemical analysis for 38 cases. Dermatol Surg. 2005;31(4):423–30. doi: 10.1111/j.1524-4725.2005.31108. [DOI] [PubMed] [Google Scholar]
- 12.Muller S, Lindquist D, Kanter L, Flores-Staino C, Henriksson R, Hedman H, et al. Expression of LRIG1 and LRIG3 correlates with human papillomavirus status and patient survival in cervical adenocarcinoma. Int J Oncol. 2013;42(1):247–52. doi: 10.3892/ijo.2012.1702. [DOI] [PubMed] [Google Scholar]
- 13.Lindquist D, Nasman A, Tarjan M, Henriksson R, Tot T, Dalianis T, et al. Expression of LRIG1 is associated with good prognosis and human papillomavirus status in oropharyngeal cancer. Br J Cancer. 2014;110(7):1793–800. doi: 10.1038/bjc.2014.87. [DOI] [PMC free article] [PubMed] [Google Scholar]
- 14.Sheu JJ, Lee CC, Hua CH, Li CI, Lai MT, Lee SC, et al. LRIG1 modulates aggressiveness of head and neck cancers by regulating EGFR-MAPK-SPHK1 signaling and extracellular matrix remodeling. Oncogene. 2014;33(11):1375–84. doi: 10.1038/onc.2013.98. [DOI] [PubMed] [Google Scholar]
- 15.Krig SR, Frietze S, Simion C, Miller JK, Fry WH, Rafidi H, et al. Lrig1 is an estrogen-regulated growth suppressor and correlates with longer relapse-free survival in ERalpha-positive breast cancer. Mol Cancer Res. 2011;9(10):1406–17. doi: 10.1158/1541-7786.MCR-11-0227. [DOI] [PMC free article] [PubMed] [Google Scholar]
- 16.Suzuki Y, Miura H, Tanemura A, Kobayashi K, Kondoh G, Sano S, et al. Targeted disruption of LIG-1 gene results in psoriasiform epidermal hyperplasia. FEBS Lett. 2002;521(1–3):67–71. doi: 10.1016/s0014-5793(02)02824-7. [DOI] [PubMed] [Google Scholar]
- 17.Jensen KB, Collins CA, Nascimento E, Tan DW, Frye M, Itami S, et al. Lrig1 expression defines a distinct multipotent stem cell population in mammalian epidermis. Cell stem cell. 2009;4(5):427–39. doi: 10.1016/j.stem.2009.04.014. [DOI] [PMC free article] [PubMed] [Google Scholar]
- 18.Wong VW, Stange DE, Page ME, Buczacki S, Wabik A, Itami S, et al. Lrig1 controls intestinal stem-cell homeostasis by negative regulation of ErbB signalling. Nat Cell Biol. 2012;14(4):401–8. doi: 10.1038/ncb2464. [DOI] [PMC free article] [PubMed] [Google Scholar]
- 19.Nakamura T, Hamuro J, Takaishi M, Simmons S, Maruyama K, Zaffalon A, et al. LRIG1 inhibits STAT3-dependent inflammation to maintain corneal homeostasis. J Clin Invest. 2014;124(1):385–97. doi: 10.1172/JCI71488. [DOI] [PMC free article] [PubMed] [Google Scholar]
- 20.Lu L, Teixeira VH, Yuan Z, Graham TA, Endesfelder D, Kolluri K, et al. LRIG1 regulates cadherin-dependent contact inhibition directing epithelial homeostasis and pre-invasive squamous cell carcinoma development. J Pathol. 2013;229(4):608–20. doi: 10.1002/path.4148. [DOI] [PMC free article] [PubMed] [Google Scholar]
- 21.Powell AE, Wang Y, Li Y, Poulin EJ, Means AL, Washington MK, et al. The pan-ErbB negative regulator Lrig1 is an intestinal stem cell marker that functions as a tumor suppressor. Cell. 2012;149(1):146–58. doi: 10.1016/j.cell.2012.02.042. [DOI] [PMC free article] [PubMed] [Google Scholar]
- 22.Watt FM, Jensen KB. Epidermal stem cell diversity and quiescence. EMBO Mol Med. 2009;1(5):260–7. doi: 10.1002/emmm.200900033. [DOI] [PMC free article] [PubMed] [Google Scholar]
- 23.Miller JK, Shattuck DL, Ingalla EQ, Yen L, Borowsky AD, Young LJ, et al. Suppression of the negative regulator LRIG1 contributes to ErbB2 overexpression in breast cancer. Cancer Res. 2008;68(20):8286–94. doi: 10.1158/0008-5472.CAN-07-6316. [DOI] [PMC free article] [PubMed] [Google Scholar]
- 24.Honeth G, Bendahl PO, Ringner M, Saal LH, Gruvberger-Saal SK, Lovgren K, et al. The CD44+/CD24− phenotype is enriched in basal-like breast tumors. Breast Cancer Res. 2008;10(3):R53. doi: 10.1186/bcr2108. [DOI] [PMC free article] [PubMed] [Google Scholar]
- 25.Nalwoga H, Arnes JB, Wabinga H, Akslen LA. Expression of aldehyde dehydrogenase 1 (ALDH1) is associated with basal-like markers and features of aggressive tumours in African breast cancer. Br J Cancer. 2010;102(2):369–75. doi: 10.1038/sj.bjc.6605488. [DOI] [PMC free article] [PubMed] [Google Scholar]
- 26.Sorlie T, Perou CM, Tibshirani R, Aas T, Geisler S, Johnsen H, et al. Gene expression patterns of breast carcinomas distinguish tumor subclasses with clinical implications. Proc Natl Acad Sci U S A. 2001;98(19):10869–74. doi: 10.1073/pnas.191367098. [DOI] [PMC free article] [PubMed] [Google Scholar]
- 27.Leidy J, Khan A, Kandil D. Basal-like breast cancer: update on clinicopathologic, immunohistochemical, and molecular features. Arch Pathol Lab Med. 2014;138(1):37–43. doi: 10.5858/arpa.2012-0439-RA. [DOI] [PubMed] [Google Scholar]
- 28.Sarrio D, Rodriguez-Pinilla SM, Hardisson D, Cano A, Moreno-Bueno G, Palacios J. Epithelial-mesenchymal transition in breast cancer relates to the basal-like phenotype. Cancer Res. 2008;68(4):989–97. doi: 10.1158/0008-5472.CAN-07-2017. [DOI] [PubMed] [Google Scholar]
- 29.Valentin MD, da Silva SD, Privat M, Alaoui-Jamali M, Bignon YJ. Molecular insights on basal-like breast cancer. Breast Cancer Res Treat. 2012;134(1):21–30. doi: 10.1007/s10549-011-1934-z. [DOI] [PubMed] [Google Scholar]
- 30.Thompson PA, Ljuslinder I, Tsavachidis S, Brewster A, Sahin A, Hedman H, et al. Loss of LRIG1 locus increases risk of early and late relapse of stage I/II breast cancer. Cancer Res. 2014;74(11):2928–35. doi: 10.1158/0008-5472.CAN-13-2112. [DOI] [PMC free article] [PubMed] [Google Scholar]
- 31.Neve RM, Chin K, Fridlyand J, Yeh J, Baehner FL, Fevr T, et al. A collection of breast cancer cell lines for the study of functionally distinct cancer subtypes. Cancer Cell. 2006;10(6):515–27. doi: 10.1016/j.ccr.2006.10.008. [DOI] [PMC free article] [PubMed] [Google Scholar]
- 32.Jezequel P, Campone M, Gouraud W, Guerin-Charbonnel C, Leux C, Ricolleau G, et al. bc-GenExMiner: an easy-to-use online platform for gene prognostic analyses in breast cancer. Breast Cancer Res Treat. 2012;131(3):765–75. doi: 10.1007/s10549-011-1457-7. [DOI] [PubMed] [Google Scholar]
- 33.Larue L, Bellacosa A. Epithelial-mesenchymal transition in development and cancer: role of phosphatidylinositol 3′ kinase/AKT pathways. Oncogene. 2005;24(50):7443–54. doi: 10.1038/sj.onc.1209091. [DOI] [PubMed] [Google Scholar]
- 34.Polyak K, Weinberg RA. Transitions between epithelial and mesenchymal states: acquisition of malignant and stem cell traits. Nat Rev Cancer. 2009;9(4):265–73. doi: 10.1038/nrc2620. [DOI] [PubMed] [Google Scholar]
- 35.Yang J, Mani SA, Donaher JL, Ramaswamy S, Itzykson RA, Come C, et al. Twist, a master regulator of morphogenesis, plays an essential role in tumor metastasis. Cell. 2004;117(7):927–39. doi: 10.1016/j.cell.2004.06.006. [DOI] [PubMed] [Google Scholar]
- 36.Mani SA, Guo W, Liao MJ, Eaton EN, Ayyanan A, Zhou AY, et al. The epithelial-mesenchymal transition generates cells with properties of stem cells. Cell. 2008;133(4):704–15. doi: 10.1016/j.cell.2008.03.027. [DOI] [PMC free article] [PubMed] [Google Scholar]
- 37.Shapiro IM, Cheng AW, Flytzanis NC, Balsamo M, Condeelis JS, Oktay MH, et al. An EMT-driven alternative splicing program occurs in human breast cancer and modulates cellular phenotype. PLoS Genet. 2011;7(8):e1002218. doi: 10.1371/journal.pgen.1002218. [DOI] [PMC free article] [PubMed] [Google Scholar]
- 38.Bai L, McEachern D, Yang CY, Lu J, Sun H, Wang S. LRIG1 modulates cancer cell sensitivity to Smac mimetics by regulating TNFalpha expression and receptor tyrosine kinase signaling. Cancer Res. 2012;72(5):1229–38. doi: 10.1158/0008-5472.CAN-11-2428. [DOI] [PMC free article] [PubMed] [Google Scholar]
- 39.Wang Y, Wen M, Kwon Y, Xu Y, Liu Y, Zhang P, et al. CUL4A induces epithelial-mesenchymal transition and promotes cancer metastasis by regulating ZEB1 expression. Cancer Res. 2014;74(2):520–31. doi: 10.1158/0008-5472.CAN-13-2182. [DOI] [PMC free article] [PubMed] [Google Scholar]
- 40.Aigner K, Dampier B, Descovich L, Mikula M, Sultan A, Schreiber M, et al. The transcription factor ZEB1 (deltaEF1) promotes tumour cell dedifferentiation by repressing master regulators of epithelial polarity. Oncogene. 2007;26(49):6979–88. doi: 10.1038/sj.onc.1210508. [DOI] [PMC free article] [PubMed] [Google Scholar]
- 41.Rhodes LV, Tate CR, Segar HC, Burks HE, Phamduy TB, Hoang V, et al. Suppression of triple-negative breast cancer metastasis by pan-DAC inhibitor panobinostat via inhibition of ZEB family of EMT master regulators. Breast Cancer Res Treat. 2014;145(3):593–604. doi: 10.1007/s10549-014-2979-6. [DOI] [PMC free article] [PubMed] [Google Scholar]
- 42.Cieply B, Riley Pt, Pifer PM, Widmeyer J, Addison JB, Ivanov AV, et al. Suppression of the epithelial-mesenchymal transition by Grainyhead-like-2. Cancer Res. 2012;72(9):2440–53. doi: 10.1158/0008-5472.CAN-11-4038. [DOI] [PMC free article] [PubMed] [Google Scholar]
- 43.Tsai PC, Hsieh CY, Chiu CC, Wang CK, Chang LS, Lin SR. Cardiotoxin III suppresses MDA-MB-231 cell metastasis through the inhibition of EGF/EGFR-mediated signaling pathway. Toxicon. 2012;60(5):734–43. doi: 10.1016/j.toxicon.2012.05.019. [DOI] [PubMed] [Google Scholar]
- 44.Chun J, Kim YS. Platycodin D inhibits migration, invasion, and growth of MDA-MB-231 human breast cancer cells via suppression of EGFR-mediated Akt and MAPK pathways. Chem Biol Interact. 2013;205(3):212–21. doi: 10.1016/j.cbi.2013.07.002. [DOI] [PubMed] [Google Scholar]
- 45.Lim YC, Han JH, Kang HJ, Kim YS, Lee BH, Choi EC, et al. Overexpression of c-Met promotes invasion and metastasis of small oral tongue carcinoma. Oral Oncol. 2012;48(11):1114–9. doi: 10.1016/j.oraloncology.2012.05.013. [DOI] [PubMed] [Google Scholar]
- 46.Mehner C, Hockla A, Miller E, Ran S, Radisky DC, Radisky ES. Tumor cell-produced matrix metalloproteinase 9 (MMP-9) drives malignant progression and metastasis of basal-like triple negative breast cancer. Oncotarget. 2014;5(9):2736–49. doi: 10.18632/oncotarget.1932. [DOI] [PMC free article] [PubMed] [Google Scholar]
- 47.Jimenez-Salazar JE, Posadas-Rodriguez P, Lazzarini-Lechuga RC, Luna-Lopez A, Zentella-Dehesa A, Gomez-Quiroz LE, et al. Membrane-initiated estradiol signaling of epithelial-mesenchymal transition-associated mechanisms through regulation of tight junctions in human breast cancer cells. Horm Cancer. 2014;5(3):161–73. doi: 10.1007/s12672-014-0180-3. [DOI] [PMC free article] [PubMed] [Google Scholar]
- 48.Wang F, Hansen RK, Radisky D, Yoneda T, Barcellos-Hoff MH, Petersen OW, et al. Phenotypic reversion or death of cancer cells by altering signaling pathways in three-dimensional contexts. J Natl Cancer Inst. 2002;94(19):1494–503. doi: 10.1093/jnci/94.19.1494. [DOI] [PMC free article] [PubMed] [Google Scholar]
- 49.Young RK, Cailleau RM, Mackay B, Reeves WJ. Establishment of epithelial cell line MDA-MB-157 from metastatic pleural effusion of human breast carcinoma. In Vitro. 1974;9(4):239–45. doi: 10.1007/BF02616069. [DOI] [PubMed] [Google Scholar]
- 50.Wang B, Lindley LE, Fernandez-Vega V, Rieger ME, Sims AH, Briegel KJ. The T box transcription factor TBX2 promotes epithelial-mesenchymal transition and invasion of normal and malignant breast epithelial cells. PLoS One. 2012;7(7):e41355. doi: 10.1371/journal.pone.0041355. [DOI] [PMC free article] [PubMed] [Google Scholar]
- 51.Van Itallie CM, Anderson JM. Architecture of tight junctions and principles of molecular composition. Semin Cell Dev Biol. 2014;36:157–65. doi: 10.1016/j.semcdb.2014.08.011. [DOI] [PMC free article] [PubMed] [Google Scholar]
- 52.Jensen KB, Watt FM. Single-cell expression profiling of human epidermal stem and transit-amplifying cells: Lrig1 is a regulator of stem cell quiescence. Proc Natl Acad Sci U S A. 2006;103(32):11958–63. doi: 10.1073/pnas.0601886103. [DOI] [PMC free article] [PubMed] [Google Scholar]
- 53.Xie R, Yang H, Xiao Q, Mao F, Zhang S, Ye F, et al. Downregulation of LRIG1 expression by RNA interference promotes the aggressive properties of glioma cells via EGFR/Akt/c-Myc activation. Oncol Rep. 2013;29(1):177–84. doi: 10.3892/or.2012.2102. [DOI] [PubMed] [Google Scholar]
- 54.Knopfova L, Benes P, Pekarcikova L, Hermanova M, Masarik M, Pernicova Z, et al. c-Myb regulates matrix metalloproteinases 1/9, and cathepsin D: implications for matrix-dependent breast cancer cell invasion and metastasis. Mol Cancer. 2012;11:15. doi: 10.1186/1476-4598-11-15. [DOI] [PMC free article] [PubMed] [Google Scholar]
- 55.Ho-Yen CM, Green AR, Rakha EA, Brentnall AR, Ellis IO, Kermorgant S, et al. C-Met in invasive breast cancer: is there a relationship with the basal-like subtype? Cancer. 2014;120(2):163–71. doi: 10.1002/cncr.28386. [DOI] [PubMed] [Google Scholar]
- 56.Kim YJ, Choi JS, Seo J, Song JY, Lee SE, Kwon MJ, et al. MET is a potential target for use in combination therapy with EGFR inhibition in triple-negative/basal-like breast cancer. Int J Cancer. 2014;134(10):2424–36. doi: 10.1002/ijc.28566. [DOI] [PubMed] [Google Scholar]
- 57.Gastaldi S, Comoglio PM, Trusolino L. The Met oncogene and basal-like breast cancer: another culprit to watch out for? Breast Cancer Res. 2010;12(4):208. doi: 10.1186/bcr2617. [DOI] [PMC free article] [PubMed] [Google Scholar]
- 58.Munshi N, Jeay S, Li Y, Chen CR, France DS, Ashwell MA, et al. ARQ 197, a novel and selective inhibitor of the human c-Met receptor tyrosine kinase with antitumor activity. Mol Cancer Ther. 2010;9(6):1544–53. doi: 10.1158/1535-7163.MCT-09-1173. [DOI] [PubMed] [Google Scholar]
- 59.Stutz MA, Shattuck DL, Laederich MB, Carraway KL, 3rd, Sweeney C. LRIG1 negatively regulates the oncogenic EGF receptor mutant EGFRvIII. Oncogene. 2008;27(43):5741–52. doi: 10.1038/onc.2008.185. [DOI] [PMC free article] [PubMed] [Google Scholar]
- 60.Chang L, Shi R, Yang T, Li F, Li G, Guo Y, et al. Restoration of LRIG1 suppresses bladder cancer cell growth by directly targeting EGFR activity. J Exp Clin Cancer Res. 2013;32:101. doi: 10.1186/1756-9966-32-101. [DOI] [PMC free article] [PubMed] [Google Scholar]
- 61.Hallett RM, Dvorkin-Gheva A, Bane A, Hassell JA. A gene signature for predicting outcome in patients with basal-like breast cancer. Sci Rep. 2012;2:227. doi: 10.1038/srep00227. [DOI] [PMC free article] [PubMed] [Google Scholar]
- 62.Marchini C, Montani M, Konstantinidou G, Orru R, Mannucci S, Ramadori G, et al. Mesenchymal/stromal gene expression signature relates to basal-like breast cancers, identifies bone metastasis and predicts resistance to therapies. PLoS One. 2010;5(11):e14131. doi: 10.1371/journal.pone.0014131. [DOI] [PMC free article] [PubMed] [Google Scholar]
- 63.Rody A, Karn T, Liedtke C, Pusztai L, Ruckhaeberle E, Hanker L, et al. A clinically relevant gene signature in triple negative and basal-like breast cancer. Breast Cancer Res. 2011;13(5):R97. doi: 10.1186/bcr3035. [DOI] [PMC free article] [PubMed] [Google Scholar]
- 64.Hennessy BT, Gonzalez-Angulo AM, Stemke-Hale K, Gilcrease MZ, Krishnamurthy S, Lee JS, et al. Characterization of a naturally occurring breast cancer subset enriched in epithelial-to-mesenchymal transition and stem cell characteristics. Cancer Res. 2009;69(10):4116–24. doi: 10.1158/0008-5472.CAN-08-3441. [DOI] [PMC free article] [PubMed] [Google Scholar]
- 65.Gunasinghe NP, Wells A, Thompson EW, Hugo HJ. Mesenchymal-epithelial transition (MET) as a mechanism for metastatic colonisation in breast cancer. Cancer Metastasis Rev. 2012;31(3–4):469–78. doi: 10.1007/s10555-012-9377-5. [DOI] [PubMed] [Google Scholar]
- 66.Creighton CJ, Chang JC, Rosen JM. Epithelial-mesenchymal transition (EMT) in tumor-initiating cells and its clinical implications in breast cancer. J Mammary Gland Biol Neoplasia. 2010;15(2):253–60. doi: 10.1007/s10911-010-9173-1. [DOI] [PubMed] [Google Scholar]
- 67.Tarin D, Thompson EW, Newgreen DF. The fallacy of epithelial mesenchymal transition in neoplasia. Cancer Res. 2005;65(14):5996–6000. doi: 10.1158/0008-5472.CAN-05-0699. discussion -1. [DOI] [PubMed] [Google Scholar]
- 68.Dave B, Mittal V, Tan NM, Chang JC. Epithelial-mesenchymal transition, cancer stem cells and treatment resistance. Breast Cancer Res. 2012;14(1):202. doi: 10.1186/bcr2938. [DOI] [PMC free article] [PubMed] [Google Scholar]
- 69.Chao YL, Shepard CR, Wells A. Breast carcinoma cells re-express E-cadherin during mesenchymal to epithelial reverting transition. Mol Cancer. 2010;9:179. doi: 10.1186/1476-4598-9-179. [DOI] [PMC free article] [PubMed] [Google Scholar]
- 70.Trimboli AJ, Fukino K, de Bruin A, Wei G, Shen L, Tanner SM, et al. Direct evidence for epithelial-mesenchymal transitions in breast cancer. Cancer Res. 2008;68(3):937–45. doi: 10.1158/0008-5472.CAN-07-2148. [DOI] [PubMed] [Google Scholar]
- 71.Ponzo MG, Park M. The Met receptor tyrosine kinase and basal breast cancer. Cell Cycle. 2010;9(6):1043–50. doi: 10.4161/cc.9.6.11033. [DOI] [PubMed] [Google Scholar]
- 72.Ponzo MG, Lesurf R, Petkiewicz S, O’Malley FP, Pinnaduwage D, Andrulis IL, et al. Met induces mammary tumors with diverse histologies and is associated with poor outcome and human basal breast cancer. Proc Natl Acad Sci U S A. 2009;106(31):12903–8. doi: 10.1073/pnas.0810402106. [DOI] [PMC free article] [PubMed] [Google Scholar]
- 73.Hochgrafe F, Zhang L, O’Toole SA, Browne BC, Pinese M, Porta Cubas A, et al. Tyrosine phosphorylation profiling reveals the signaling network characteristics of Basal breast cancer cells. Cancer Res. 2010;70(22):9391–401. doi: 10.1158/0008-5472.CAN-10-0911. [DOI] [PubMed] [Google Scholar]
- 74.Accornero P, Miretti S, Bersani F, Quaglino E, Martignani E, Baratta M. Met receptor acts uniquely for survival and morphogenesis of EGFR-dependent normal mammary epithelial and cancer cells. PLoS One. 2012;7(9):e44982. doi: 10.1371/journal.pone.0044982. [DOI] [PMC free article] [PubMed] [Google Scholar]
- 75.Mueller KL, Madden JM, Zoratti GL, Kuperwasser C, List K, Boerner JL. Fibroblast-secreted hepatocyte growth factor mediates epidermal growth factor receptor tyrosine kinase inhibitor resistance in triple-negative breast cancers through paracrine activation of Met. Breast Cancer Res. 2012;14(4):R104. doi: 10.1186/bcr3224. [DOI] [PMC free article] [PubMed] [Google Scholar]
- 76.Liu L, Shi H, Liu Y, Anderson A, Peterson J, Greger J, et al. Synergistic effects of foretinib with HER-targeted agents in MET and HER1- or HER2-coactivated tumor cells. Mol Cancer Ther. 2011;10(3):518–30. doi: 10.1158/1535-7163.MCT-10-0698. [DOI] [PubMed] [Google Scholar]
- 77.Rafidi H, Mercado F, 3rd, Astudillo M, Fry WH, Saldana M, Carraway KL, 3rd, et al. Leucine-rich repeat and immunoglobulin domain-containing protein-1 (Lrig1) negative regulatory action toward ErbB receptor tyrosine kinases is opposed by leucine-rich repeat and immunoglobulin domain-containing protein 3 (Lrig3) J Biol Chem. 2013;288(30):21593–605. doi: 10.1074/jbc.M113.486050. [DOI] [PMC free article] [PubMed] [Google Scholar]
- 78.Debnath J, Muthuswamy SK, Brugge JS. Morphogenesis and oncogenesis of MCF-10A mammary epithelial acini grown in three-dimensional basement membrane cultures. Methods. 2003;30(3):256–68. doi: 10.1016/s1046-2023(03)00032-x. [DOI] [PubMed] [Google Scholar]
- 79.Hawkes SP, Li H, Taniguchi GT. Zymography and reverse zymography for detecting MMPs and TIMPs. Methods Mol Biol. 2010;622:257–69. doi: 10.1007/978-1-60327-299-5_16. [DOI] [PubMed] [Google Scholar]
- 80.Dontu G, Abdallah WM, Foley JM, Jackson KW, Clarke MF, Kawamura MJ, et al. In vitro propagation and transcriptional profiling of human mammary stem/progenitor cells. Genes Dev. 2003;17(10):1253–70. doi: 10.1101/gad.1061803. [DOI] [PMC free article] [PubMed] [Google Scholar]
Associated Data
This section collects any data citations, data availability statements, or supplementary materials included in this article.


