

Abstract
Suppressors of cytokine signaling (SOCSs) are key regulators of cytokine-induced responses in hematopoietic as well as nonhematopoietic cells. SOCS1 and SOCS3 have been shown to modulate T-cell responses, whereas the roles of other SOCS family members in the regulation of lymphocyte function are less clear. Here, we report the generation of mice with a targeted disruption of the Socs5 gene. Socs5−/− mice were born in a normal Mendelian ratio and were healthy and fertile. We found that SOCS5 is expressed in primary B and T cells in wild-type mice. However, no abnormalities in the lymphocyte compartment were seen in SOCS5-deficient mice. We examined antigen- and cytokine-induced proliferative responses in B and T cells in the absence of SOCS5 and found no deviations from the responses seen in wild-type cells. Because SOCS5 has been implicated in Th1 differentiation, we also investigated the importance of SOCS5 in T helper cell responses. Unexpectedly, SOCS5-deficient CD4 T cells showed no abnormalities in Th1/Th2 differentiation and Socs5−/− mice showed normal resistance to infection with Leishmania major. Therefore, although SOCS5 is expressed in primary B and T cells, it appears to be dispensable for the regulation of lymphocyte function.
The suppressor of cytokine signaling (SOCS) proteins are a family of cytokine-inducible modulators of signaling containing eight known members (CIS and SOCS1 to SOCS7). They are characterized by a central SH2 domain and a C-terminal homology domain named the SOCS box (16), both of which are important for SOCS function. SOCS-mediated inhibition of cytokine signaling has been studied extensively, primarily by using overexpression of CIS, SOCS1, SOCS2, or SOCS3 in cell lines, whereas relatively few data have been generated to characterize SOCS4 to SOCS7. SOCS proteins bind via their SH2 domains to phosphorylated tyrosine residues in activated receptor/JAK kinase complexes and inhibit signaling by blocking access of other signaling molecules or by directly inhibiting JAK activity (35, 43, 45). In addition, the SOCS box specifically interacts with elongin B and elongin C proteins (18, 47), recruiting E3 ubiquitin ligase activity and targeting bound receptors or JAKs for polyubiquitination and proteasomal degradation, thereby terminating signaling.
When overexpressed in cell lines, SOCS1 and SOCS3 are potent inhibitors of signaling induced by many cytokines (1). To investigate the physiological role of SOCS, mice lacking individual Socs genes have been generated. Interestingly, these studies revealed much higher specificity in SOCS action in vivo than was first anticipated from in vitro studies. SOCS1-deficient mice die before weaning with fatty degeneration of the liver and hematopoietic infiltration of multiple organs (29, 40). This neonatal disease is prevented by establishing the mice on a gamma interferon (IFN-γ)-deficient background (4), but, later in life, Socs1−/− Ifng−/− mice develop chronic inflammatory lesions, probably due to the failure of γc-cytokine-dependent T-cell homeostasis (8, 9, 17, 28). SOCS3-deficient mice die in utero due to placental defects (33, 41), and the physiological role of SOCS3 in adult mice has required the use of conditional knockouts. Recent studies with mice lacking SOCS3 selectively in hepatocytes or in macrophages and neutrophils showed that SOCS3 is an important regulator of signaling by interleukin-6 (IL-6) but not by IFN-γ or IL-10 (10, 22, 44). Like SOCS1 and SOCS3, SOCS2 and SOCS6 seem to have very specific roles in vivo. Mice lacking SOCS2 display gigantism that is most likely caused by deregulated growth hormone signaling (15, 27), whereas SOCS6 interacts with IRS-4 and SOCS6-deficient mice have a mild growth defect (21). CIS knockout mice have also been generated but are reported to have no obvious phenotype (25).
Little is known about SOCS5 function. When overexpressed, SOCS5 suppresses IL-6- and leukemia inhibitory factor-induced signaling, albeit to a lesser extent than SOCS1 and SOCS3 (31). Human SOCS5 is expressed in many tissues, including heart, brain, placenta, and skeletal muscle, but its expression is especially high in lymphoid organs such as spleen, lymph nodes (LN), thymus, and bone marrow (BM) (24), indicating that SOCS5 might play a role in lymphocyte development or function. Recently, SOCS5 was reported to be a potential regulator of IL-4 signaling (38), an effect mediated through an SH2 domain-independent interaction between SOCS5 and the IL-4 receptor α chain. In the same study, SOCS5 expression was found in T helper 1 (Th1) cells and the authors of the study hypothesized that SOCS5 may be important for the generation of Th1 responses by repressing IL-4-induced signals that promote Th2 differentiation.
Naïve CD4+ T cells can differentiate into at least two distinct effector cell subsets, Th1 and Th2. Many factors influence whether cells become Th1 or Th2 cells, including the strength of antigen stimulation, costimulation, and adhesion molecules, but it is the presence of cytokines that plays the most critical role (32). The primary cytokines involved in Th1 polarization are IL-12 and IFN-γ, and the primary cytokine involved in Th2 polarization is IL-4. Because SOCS proteins influence cell responsiveness to these cytokines (11, 13, 23, 38, 39), these proteins could potentially be important regulators of Th1/Th2 differentiation. Like SOCS5, SOCS1 and SOCS2 were also reported to be expressed primarily in Th1 cells (12), whereas SOCS3 expression appeared to be Th2 specific (12, 37, 38). In vitro differentiation assays with CD4+ T cells from SOCS3 or SOCS5 transgenic mice showed that SOCS3 overexpression favors Th2 differentiation but that SOCS5-expressing cells are biased towards Th1 differentiation (37, 38). Infection of mice with Leishmania major is a frequently used model for investigating the importance of cytokines or intracellular factors in Th1/Th2 lineage commitment in vivo (34). To test the importance of SOCS1 and SOCS2 in the generation of Th1 responses, Bullen et al. infected Socs1+/− mice (because Socs1−/− mice die prematurely) or Socs2−/− mice with L. major and monitored the development of cutaneous lesions, parasite burdens, and cytokine responses (7). Both groups of mice mounted a protective Th1 response and cleared the parasites, suggesting that SOCS1 and SOCS2, even though they are expressed in T helper cells, may not be critical for the formation of a Th1 response. Rather, Socs1+/− mice seemed to be unable to turn off the T-cell response effectively and lesions persisted even after clearance of the parasites (7). Altered T-cell responses were also observed in SOCS1-deficient mice when an independent infectious model was used (14).
To define the role of SOCS5 in vivo, we generated SOCS5 knockout mice by using homologous recombination in embryonic stem cells. We show that SOCS5 is expressed in primary B and T cells. However, both B- and T-cell development were unaffected by SOCS5 deficiency and Socs5−/− B and T cells responded normally to mitogenic stimuli. When infected with the intracellular parasite L. major. Socs5−/− mice mounted a protective Th1 response and cleared the parasites normally.
MATERIALS AND METHODS
Generation of targeted ES cells and Socs5−/− mice.
A 1.9-kb fragment from the murine Socs5 locus that extended 5′ from the protein initiation ATG was generated by PCR and ligated directly upstream of the initiation codon of β-galactosidase (β-Gal) via a BamHI site in the plasmid pβgalpAloxneo, which also contains a PGKneo cassette flanked by loxP sites (40). Subsequently, a 3-kb fragment from the 3′ region of the Socs5 gene was ligated into a XhoI site 3′ of the PGKneo cassette (Fig. 1). This construct was linearized and electroporated into C57BL/6-derived embryonic stem (ES) cells (20). Clones surviving selection in 175 μg of G418/ml were screened by using Southern blots of HindIII-digested genomic DNA probed with a 0.2-kb genomic Socs5 fragment to find the clones in which the targeting vector had recombined with an endogenous Socs5 allele. A targeted ES cell clone in which homologous recombination had occurred at the Socs5 locus but in which a region of the targeting vector had been duplicated was identified (Fig. 1). This ES cell clone was injected into BALB/c blastocysts to generate chimeric mice, and the chimeric mice were mated with C57BL/6 mice to produce Socs5 heterozygotes. These mice were then interbred to produce wild-type (wt) (Socs5+/+), heterozygous (Socs5+/−), and homozygous mutant (Socs5−/−) mice. The genotypes of offspring were determined by Southern blot analysis of genomic DNA extracted from tail biopsy specimens as described above. The deletion of the Socs5 coding sequence and the absence of Socs5 mRNA in Socs5−/− mice was confirmed by using Southern and Northern blots. Northern blots were probed with probe B (Fig. 1) from the Socs5 coding region and then with a 1.2-kb PstI chicken glyceraldehyde-3-phosphate dehydrogenase (GAPDH) fragment. Socs5−/− mice were bred with deleter mice (36), which express cre recombinase at the earliest stages of embryogenesis, allowing excision of DNA located between the loxP sites at the targeted Socs5 locus. Subsequent to cre-mediated deletion, mice carried a targeted Socs5 locus (del Socs5−/−) in which the lacZ gene was fused to the Socs5 ATG without the adjacent PGKneo cassette or duplicated targeting vector sequences (Fig. 1). The structure of the targeted locus was confirmed by Southern blot analysis with a range of probes derived from the Socs5 locus and targeting vector (Fig. 1). Most studies described were performed with Socs5−/− mice, and key observations were confirmed with del Socs5−/− mice.
FIG. 1.

Disruption of the Socs5 gene by homologous recombination. (a) The Socs5 gene is shown with the exon containing the coding sequence (in black). In the targeted allele (Socs5−), homologous recombination occurred between the targeting vector and the homologous gene regions as expected, but a region of the targeting vector had been duplicated. The neo selectable marker cassette and the duplicated region were subsequently deleted by crossing Socs5−/− mice with CMV-cre mice (see Materials and Methods) to generate the Socs5del allele. Ns, NsiI; B, BamHI; Sc, ScaI. Positions of the 5′, coding region (cdr), and 3′ lacZ and neo probes used in Southern blot analysis are shown. (b) Southern blot analysis of genomic DNA from Socs5+/+, Socs5−/−, and heterozygous Socs5del/+ (del/+) mice confirming the organization of the wt (Socs5+), targeted (Socs5−), and post-cre deletion (Socs5del. Socs5 alleles. The genomic DNA was digested with NsiI and probed with the 5′ probe, confirming targeting of the Socs5 locus by the targeting vector. The cdr probe confirms the deletion of the Socs5 coding region in Socs5−/− mice. The 3′ lacZ and neo probes indicate the duplication of a region of the targeting vector in Socs5−/− mice and the deletion of neo and duplicated lacZ sequences following cre-mediated generation of the Socs5del allele. (c) The Socs5− allele is functionally null. No Socs5 RNA was detected by Northern blotting (upper panel) or quantitative PCR (lower panel) in any tissues of Socs5−/− mice, compared with widespread expression in the corresponding tissues of wt mice. Tes, testes; Thy, thymus; Mus, skeletal muscle; Bra, brain; Hrt, heart; Spl, spleen.
Hematological analysis.
The peripheral blood hematocrit and the white cell and platelet counts were determined by using either manual or automated (Advia 120; Bayer, Tarrytown, N.Y.) counting techniques. Manual leukocyte differential counts of a total of 100 to 400 cells for peripheral blood, BM, liver, and spleen were performed with smears or cytocentrifuge preparations stained with May-Grunwald-Giemsa stain.
Clonal cultures of hemopoietic cells were performed as previously described (3). Briefly, cultures of 2.5 × 10⁴ adult BM cells or 1 × 10⁵ spleen cells in 0.3% agar in Dulbecco's modified Eagle's medium supplemented with newborn calf serum (20%) were stimulated with individual cytokines at final concentrations of 100 ng of murine stem cell factor (SCF)/ml, 10 ng of murine IL-3/ml, 10 ng of human granulocyte colony-stimulating factor (G-CSF)/ml, 10 ng of murine granulocyte-macrophage CSF (GM-CSF)/ml, 10 ng of murine macrophage CSF (M-CSF)/ml, 100 ng of murine IL-6/ml, 2 × 10³ U of IFN-γ/ml or combinations of GM-CSF plus M-CSF, G-CSF plus SCF, or 500 ng of murine Flk ligand/ml plus 103 U of leukemia inhibitory factor/ml and incubated for 7 days at 37°C in a fully humidified atmosphere of 10% CO2 in air. Agar cultures were fixed and sequentially stained with acetylcholinesterase, Luxol fast blue, and hematoxylin, and the cellular composition of each colony was determined at 100- to 400-fold magnification. To enumerate erythroid colony-forming cells, methylcellulose cultures (1.5%) were performed with 2.5 × 10⁴ BM or 5 × 10⁴ spleen cells in Iscove's modified Dulbecco's medium containing 20% fetal calf serum and either 4 U of human erythropoietin/ml or a combination of erythropoietin, SCF, and IL-3 and incubated for 2 (erythroid CFU) or 7 days at 37°C in a humidified atmosphere of 5% CO2 in air. Day 7 colonies appearing to contain hemoglobinized erythroid cells were verified by staining with diaminofluorene.
Histological analysis.
Sections of sternum, femur, liver, spleen, heart, lung, thymus, kidney, brain, eyes, skin, pancreas, intestine, and reproductive organs were prepared by standard techniques. All sections were stained with hematoxylin and eosin and examined by light microscopy.
Flow cytometry.
Single-cell suspensions were prepared from spleen, thymus, LN, and BM from 8- to 12-week-old Socs5−/− or wt control mice. Spleen and BM suspensions were depleted of erythrocytes by lysis with 156 mM ammonium chloride (pH 7.3). Cells were stained with a saturating solution of fluorochrome-conjugated antibodies (Abs) specific for the surface markers of interest (CD3-fluorescein isothiocyanate [FITC], CD4-FITC, CD8-phycoerythrin [PE], IgM-FITC, B220-PE, and T-cell receptor β [TCRβ]-allophycocyanin from BD Pharmingen, San Diego, Calif.). Cy5-conjugated anti-immunoglobulin D (IgD) monoclonal antibody (MAb) was a generous gift from Andreas Strasser. Dead cells were excluded based on propidium iodide staining. Fluorescence-activated cell sorter (FACS) profiles shown are representative of three independent experiments with one or two mice of each genotype per experiment.
β-Gal activity was analyzed by the FACSgal assay. Single-cell suspensions were stained for surface markers and then loaded by incubation with an equal volume of 2 mM fluorescein di-β-d-galactopyranoside (FDG; Sigma, St. Louis, Mo.) under hypotonic conditions for 2 min at 37°C, immediately placed on ice, and incubated on ice for 2 h prior to the addition of propidium iodide and analysis by FACS.
Proliferation assays.
T cells were purified from pooled LN by using a mouse T-cell enrichment column kit (R&D Systems, Minneapolis, Minn.) according to the manufacturer's instructions (T-cell purity, >95%) and plated in 96-well plates at 5 × 10⁴ cells/well, with each well containing 100 μl of RPMI medium containing 10% (vol/vol) heat-inactivated fetal calf serum (FCS) (Sigma) and 50 μM 2-mercaptoethanol. For stimulation with anti-CD3 (clone KT3-1-1) or anti-CD28 (clone 37.51), 96-well plates were coated with antibodies by incubation overnight at 4°C with 100 μl of appropriate Ab dilutions/well. Recombinant mIL-2 (Peprotech, Rocky Hill, N.J.) or rmIL-4 (R&D Systems) was added to the cells at the start of the culture. After 2 days of culture, 1 μCi of [3H]thymidine (Amersham Biosciences, Buckinghamshire, United Kingdom) was added to each well for 24 h. Cells were transferred to glass fiber filters and counted with a scintillation counter (Perkin-Elmer). Results shown are representative of three independent experiments.
For purification of B cells, splenocytes were depleted for T cells by treatment with anti-Thy-1.2, anti-CD4, anti-CD8, and rabbit complement. To remove adherent cells, the cells were incubated in plates for 40 min at 37°C. B cells were then purified by centrifugation of the nonadherent cells through a Percoll gradient (purity, ∼90%). Purified B cells were labeled with 10 μM 5- (and 6-)carboxyfluorescein diacetate succinimidyl ester (CFSE; Molecular Probes, Eugene, Oreg.) by incubation for 10 min at 37°C (107 cells/ml in RPMI medium). Cells were then washed and plated in 96-well plates at 6 × 10⁴ cells/well in 200 μl of RPMI medium supplemented with 10% FCS (vol/vol), 50 μM 2-mercaptoethanol, and 2 mM l-glutamine. Cells were analyzed by flow cytometry after 3 days of culture. Results shown are representative of two independent experiments.
In vitro induction of T helper cell differentiation.
CD4+ T cells were purified from peripheral LN with a mouse CD4 T-cell subset column kit (R&D Systems) to a purity of >95% and plated in 24-well plates at 2.5 × 10⁵cells/ml, with each well containing 2 ml of RPMI medium containing 10% FCS and 50 μM 2-mercaptoethanol. Cells were activated for 3 days with plate-bound anti-CD3 (10 μg/ml) and anti-CD28 (10 μg/ml). The culture medium was supplemented with 10 ng of rmIL-12 (R&D Systems)/ml and 5 μg of anti-IL-4 (clone BVD4-1D11)/ml for Th1 cultures and with 10 ng of rmIL-4/ml and 5 μg of anti-IFN-γ (clone HB170)/ml for Th2 cultures. After activation, cells were allowed to sit for 3 days without anti-CD3 and anti-CD28 but in the presence of biasing cytokines and Abs. Th1 cultures were further supplemented with 10 ng of rmIL-2/ml. Cells were then restimulated for 8 h on plate-bound anti-CD3 (10 μg/ml). Golgistop (BD Pharmingen) was added to all cultures 4 h prior to harvest, and intracellular IFN-γ and IL-4 were detected by flow cytometry with a BD Cytofix/Cytoperm kit (BD Pharmingen) according to the manufacturer's instructions. IFN-γ-FITC and IL-4-PE MAbs were obtained from BD Pharmingen.
Infection of mice with L. major.
Eight-week-old mice were infected with 106 V121 L. major promastigotes at the base of the tail, and lesion size was monitored weekly and scored from 0 to 5. Parasite burdens in draining (inguinal) LN were determined by limiting dilution analysis as previously described (42). In brief, LN cells were titrated across a 96-well plate and the highest dilution containing parasites was determined. Parasite burdens per 106 LN cells were calculated.
Real-time PCR and Northern blotting.
Spleen cells were sorted into CD3+ and B220+ lymphocyte populations, and BM cells were sorted into intermediate- and high-B220 cells. Total RNA was isolated from cells by using the RNeasy kit (QIAGEN, Clifton Hill, Australia) according to the manufacturer's instructions. All RNA samples were DNase treated with DNA-free (Ambion, Austin, Tex.) prior to cDNA synthesis. SuperScriptII reverse transcriptase (Invitrogen, Carlsbad, Calif.) was used for reverse transcription of 1 μg of RNA per sample, and a negative control with no enzyme was included for all samples. Real-time PCR was performed with a Lightcycler (Roche Diagnostics, Castle Hill, Australia) with the forward and reverse primers GACGGCTTAGTATCGAAGAA and GCTTATACAATGGGTTGACC, respectively, for SOCS5 (93-bp amplified product) and CCTGGTTGTTCACTCCCTGA and CAACAGCATCACAAGGGTTTT, respectively, for porphobilinogen deaminase (PBGD) (98-bp amplified product). Cycling conditions consisted of initial denaturation (95°C for 15 min), followed by 45 cycles of 94°C for 15 s, 49°C (SOCS5) or 60°C (PBGD) for 20 s, and 72°C for 15 s with a transition rate of 20°C/s and a single-fluorescence-measurement melting curve program (65 to 95°C, with a heating rate of 0.1°C/s and continuous fluorescence measurement), followed by cooling to 40°C in a final step. All PCRs were performed with a QuantiTect SYBR Green PCR kit (QIAGEN). The specificity of the SYBR green reaction was assessed by melting point analysis and gel electrophoresis. SOCS5 mRNA levels were quantified with standard curves by using Roche Molecular Biochemicals Lightcycler software (version 3.5) and are presented as arbitrary units standardized against PBGD mRNA. Standard curves were generated by using dilutions of an oligonucleotide corresponding to the amplified fragments of both PBGD and SOCS5. Poly(A)+ mRNA was isolated from individual tissues, and Northern blotting was performed as previously described (2).
RESULTS
To study the actions of SOCS5 in vivo, we utilized gene targeting in ES cells to derive mice in which the Socs5 coding sequence was deleted (Fig. 1) (see Materials and Methods). Analysis of genotypes at weaning revealed that pups from heterozygous (Socs5+/−) parents were present in the proportions expected for normal Mendelian segregation of the targeted Socs5 allele (63:123:58 for Socs5+/+, Socs5+/−, and Socs5−/− mice, respectively). Northern blotting and quantitative reverse transcription-PCR measurements of SOCS5 RNA revealed the absence of SOCS5 transcripts in all tissues examined (Fig. 1), confirming functional disruption of the Socs5 gene. Mice lacking SOCS5 appeared to develop normally and displayed no signs of illness or disease, at least to the age of 6 months. The weights of all major organs in Socs5−/− mice were not significantly different from those in wt Socs5+/+ mice, and histological examination of organs from 26 Socs5−/− mice and 23 wt controls revealed no specific major pathology in young adult mice, with the exception of mildly increased erythropoiesis in the spleen (observed in 60% of Socs5−/− mice versus 5% of wt mice). Despite high levels of SOCS5 expression in the brains of normal mice (Fig. 1c), we observed no obvious neurological phenotype in Socs5−/− mice. Both male and female Socs5−/− mice were fertile.
Hematopoiesis in Socs5−/− mice.
The numbers of circulating white blood cells and platelets and the hematocrit for Socs5−/− mice were not significantly different from wt values, and neither were the frequencies of morphologically recognizable hematopoietic cells in the BM and spleen (Table 1). Enumeration of hematopoietic progenitor cells in the BM and spleens of Socs5−/− mice was performed with semisolid agar cultures. The numbers and differentiation potentials of progenitor cells responsive to GM-CSF, G-CSF, M-CSF, IL-3, IL-6, or IFN-γ were similar to those for wt mice. The expected synergistic responses to the cytokine combinations of GM-CSF plus M-CSF and G-CSF plus SCF were observed, and quantitative responses to GM-CSF and M-CSF were normal in Socs5−/− marrow cells (data not shown). Similarly, although histological examination suggested the possibility of mildly expanded erythropoiesis in the spleen, methylcellulose cultures of marrow and spleen cells revealed no significant differences in the numbers of erythroid CFU or erythroid blast CFU in Socs5−/− mice (data not shown). In addition, normal responses to phenylhydrazine were observed in Socs5−/− mice; the kinetics and magnitude of the development of anemia and the subsequent red blood cell recovery, as well as reticulocyte production, were indistinguishable from those for wt control mice (data not shown). Numbers of spleen CFU, scored as spleen colonies 8 days after transplantation of bone marrow cells into irradiated normal recipients, were also normal in Socs5−/− marrow.
TABLE 1.
Hematological profile of Socs5−/− mice
| Parameter | Value for micea
|
|||
|---|---|---|---|---|
| Male
|
Female
|
|||
| Socs5+/+ | Socs5−/− | Socs5+/+ | Socs5−/− | |
| Peripheral blood | ||||
| Platelets (10−6/ml) | 956 ± 164 | 1,031 ± 197 | 1,041 ± 150 | 873 ± 175 |
| Hematocrit (%) | 43.4 ± 1.5 | 42.2 ± 0.8 | 44.9 ± 0.4 | 43.6 ± 2.8 |
| White cell count (10−3/ml) | 6.5 ± 2.5 | 6.6 ± 2.0 | 4.9 ± 2.2 | 5.1 ± 2.1 |
| Neutrophils (10−3/ml) | 0.7 ± 0.3 | 1.0 ± 0.6 | 0.7 ± 0.4 | 0.5 ± 0.3 |
| Lymphocytes (10−3/ml) | 5.3 ± 2.1 | 4.8 ± 2.0 | 4.0 ± 1.8 | 3.7 ± 1.8 |
| Monocytes (10−3/ml) | 0.3 ± 0.2 | 0.6 ± 0.4 | 0.2 ± 0.1 | 0.3 ± 0.2 |
| Eosinophils (10−3/ml) | 0.1 ± 0.1 | 0.2 ± 0.1 | 0.1 ± 0.1 | 0.1 ± 0.1 |
| Bone marrow | ||||
| Cellularity (10−6/femur) | 38.1 ± 9.5 | 38.6 ± 8.1 | 42.5 ± 6.1 | 39.1 ± 11.3 |
| Blasts (%) | 2.7 ± 1.0 | 3.4 ± 1.8 | 2.6 ± 1.1 | 3.7 ± 1.2 |
| Promyelocytes/myelocytes (%) | 7.9 ± 1.8 | 10.7 ± 2.5 | 8.0 ± 3.2 | 8.8 ± 4.4 |
| Metamyelocytes/neutrophils (%) | 39.8 ± 7.7 | 40.0 ± 5.6 | 31.2 ± 5.7 | 29.7 ± 4.5 |
| Lymphocytes (%) | 20.9 ± 3.4 | 15.6 ± 5.5 | 23.8 ± 7.6 | 22.8 ± 5.3 |
| Monocytes (%) | 5.3 ± 2.3 | 7.7 ± 3.5 | 7.6 ± 1.9 | 6.2 ± 2.9 |
| Eosinophils (%) | 3.6 ± 1.5 | 3.3 ± 2.1 | 2.2 ± 1.1 | 4.0 ± 1.8 |
| Nucleated erythroid cells (%) | 19.9 ± 6.0 | 19.3 ± 3.1 | 24.6 ± 4.0 | 24.7 ± 2.7 |
| Spleen | ||||
| Weight (mg) | ||||
| Blasts (%) | 2.6 ± 1.0 | 2.6 ± 1.6 | 2.1 ± 0.7 | 2.1 ± 1.2 |
| Promyelocytes/myelocytes (%) | 0.1 ± 0.3 | 0.3 ± 0.6 | 0.1 ± 0.4 | 0.3 ± 0.5 |
| Metamyelocytes/neutrophils (%) | 3.0 ± 2.6 | 7.6 ± 6.2 | 2.3 ± 1.4 | 3.1 ± 1.3 |
| Lymphocytes (%) | 86.9 ± 4.8 | 69.4 ± 11.0 | 89.1 ± 3.7 | 81.4 ± 6.1 |
| Monocytes (%) | 1.9 ± 1.5 | 2.6 ± 1.6 | 1.0 ± 0.8 | 2.4 ± 1.5 |
| Eosinophils (%) | 0.6 ± 0.7 | 0.3 ± 0.9 | 0.9 ± 0.7 | 0.1 ± 0.4 |
| Nucleated erythroid cells (%) | 4.9 ± 3.3 | 17.1 ± 8.4 | 4.4 ± 3.3 | 10.4 ± 5.3 |
| Peritoneal cells (10−6) | ||||
| Cellularity | 7.1 ± 3.3 | 11.1 ± 3.7 | 10.3 ± 2.8 | 16.7 ± 7.6 |
| Neutrophils | 0 ± 0 | 0 ± 0 | 0 ± 0 | 0 ± 0 |
| Lymphocytes | 2.6 ± 1.7 | 5.3 ± 2.8 | 5.0 ± 1.9 | 9.8 ± 3.9 |
| Macrophages | 4.0 ± 1.7 | 5.6 ± 1.2 | 5.1 ± 1.0 | 6.6 ± 4.0 |
| Eosinophils | 0 ± 0 | 0 ± 0 | 0 ± 0 | 0.1 ± 0.1 |
| Mast cells | 0.2 ± 0.2 | 0.2 ± 0.2 | 0.2 ± 0.1 | 0.2 ± 0.2 |
Mean ± standard deviation for data from 7 to 11 mice of each genotype determined from histological sections at ×400 magnification.
SOCS5 expression in lymphocytes.
Northern analysis showed high expression of SOCS5 in human lymphoid tissues (24). Because the lacZ gene had been inserted into the targeted Socs5 locus, β-Gal expression could be used as a surrogate marker for SOCS5 expression in Socs5−/− mice. β-Gal expression in splenic T or B cells was analyzed by flow cytometry by gating on TCRβ+ or B220+ cells, respectively. Low staining was found in freshly isolated naïve T cells, whereas a large population of B220+ cells showed high β-Gal staining (Fig. 2). Similar results were obtained from analysis of β-Gal expression in LN cells (data not shown), and high SOCS5 expression in spleen and LN thus appears to be caused primarily by expression in B cells. These expression data for freshly isolated splenic T and B cells were confirmed by real-time PCR (Fig. 2b).
FIG. 2.
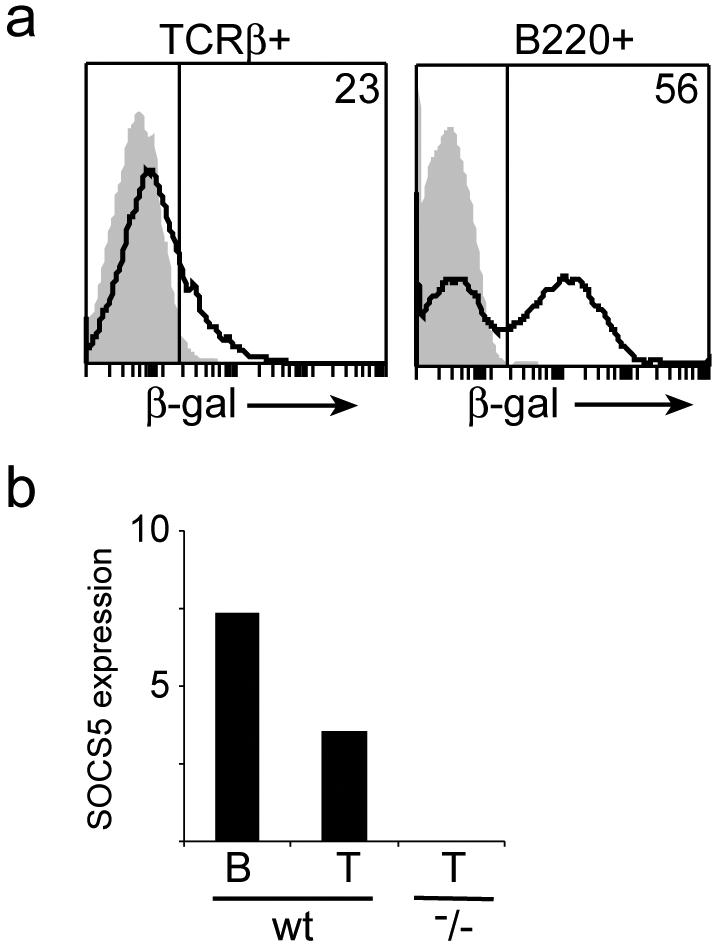
SOCS5 expression in B and T cells. (a) Splenocytes from wt (shaded area) or Socs5−/− (black line) mice were surface stained with fluorochrome-conjugated anti-TCRβ and anti-B220 antibodies, and β-Gal activity was measured by FACSgal assay as a surrogate marker of SOCS5 expression. (b) Total RNA was isolated from sorted splenic B220+ or CD3+ populations, and SOCS5 expression was measured by real-time PCR. SOCS5 expression was normalized to the expression of the PBGD housekeeping gene.
Normal T-cell development and proliferative responses.
To investigate whether T-cell development was affected in Socs5−/− mice, lymphoid populations from thymus, spleen, and peripheral LN were examined by flow cytometry. Representative profiles for each organ are presented in Fig. 3. Percentages of CD4 and CD8 double- or single-positive thymocytes in Socs5−/− mice were comparable to those in wt mice. Furthermore, there was no difference in percentages of double-negative T-cell subsets in relation to CD44 and CD25 expression on lineage-negative cells in the thymus (data not shown), suggesting that T-cell development in the thymus is SOCS5 independent. Likewise, spleen and peripheral LN contained normal proportions of B cells and T cells. No differences in CD4:CD8 ratios were found (Fig. 3b and c), and CD4 and CD8 T cells expressed normal levels of activation markers, including CD25, CD44, CD62L, and CD69 (data not shown).
FIG. 3.

Flow cytometric analysis of lymphocyte populations in Socs5−/− mice. Lymphocytes from thymus (a), spleen (b), or LN (c) were gated by forward and side scatter properties and analyzed for surface marker expression. Results are representative of three independent experiments.
Because SOCS5 expression was detected in T cells from spleen and LN (Fig. 2 and data not shown), SOCS5 may regulate TCR- or cytokine-induced signaling in primary T cells. The responsiveness of Socs5−/− T cells to TCR stimulation and/or cytokines was investigated by monitoring T-cell proliferation in vitro. As shown in Fig. 4a, we found no difference in anti-CD3-induced T-cell proliferation when we compared T cells isolated from wt mice with those isolated from SOCS5-deficient mice. Cytokines are poor proliferative stimuli for naïve T cells unless they are provided together with TCR stimulation. We tested T-cell responsiveness to IL-2, IL-4, and IL-6 with and without TCR stimulation, but again Socs5−/− T cell responses were indistinguishable from those seen with T cells from wt littermate controls (Fig. 4b to e and data not shown). Thus, although it has recently been reported that SOCS5 binds to the IL-4Rα chain and can inhibit IL-4 signaling when it is overexpressed in T helper cells (38), the absence of SOCS5 did not influence IL-4 responsiveness in primary T cells.
FIG. 4.

Antigen- and cytokine-induced proliferation in wt or Socs5−/− T cells. Purified lymph node T cells were stimulated with 10 μg of anti-CD28/ml plus titrated concentrations of anti-CD3 (a), cytokine alone (b and d), or 5 μg of anti-CD3/ml plus titrated concentrations of cytokine (c and e). Proliferation was measured by incorporation of [3H]thymidine for the last 24 h of the culture. Results are representative of three independent experiments.
SOCS5-deficient mice mount normal Th1 responses.
SOCS proteins are expressed in T helper cells (12, 37, 38), and their presence in Th1 or Th2 subsets was suggested to influence differentiation of cells by modulating cytokine sensitivities. To investigate whether SOCS5 expression is important for Th1 or Th2 differentiation, CD4+ T cells were activated under Th1 or Th2 biasing conditions in vitro. The differentiation efficiencies in Socs5−/− and wt cultures were determined by intracellular FACS staining for IFN-γ and IL-4 (Fig. 5). When activated in the presence of IL-12, the majority of cells differentiated into IFN-γ-producing Th1 cells irrespective of genotype. No differences between wt and Socs5−/− Th1 cultures were observed with regard to either percentages or mean fluorescence intensities of IFN-γ-positive cells (Fig. 5), indicating that SOCS5 is dispensable for the generation of Th1 cells. Cytokine production was less pronounced in IL-4-induced Th2 cultures, but levels of cytokine production did not differ between wt and Socs5−/− cells. These results show that CD4+ T cells are capable of differentiating into either subset independently of SOCS5 expression, suggesting that SOCS5 is not a critical factor in Th1/Th2 differentiation.
FIG. 5.

In vitro CD4+ T-cell differentiation assay. Purified CD4+ T cells from wt or Socs5−/− mice were stimulated to differentiate into Th1 or Th2 cells. Percentages of IFN-γ or IL-4 producing cells in the cultures were determined by intracellular flow cytometry.
In the in vitro differentiation assay, CD4+ cells were activated with a strong polyclonal signal in the presence of biasing cytokines. It is possible that minor differentiation defects caused by lack of SOCS5 expression were not detected under these nonphysiological conditions. To investigate whether SOCS5 is important for generation of Th1 responses in vivo, we used the L. major infection model. SOCS5-deficient mice with the Leishmania-resistant C57Bl/6 background and wt control mice were infected with L. major promastigotes by subcutaneous injection at the bases of their tails, and lesion size was monitored weekly (Fig. 6a). Both groups of mice developed lesions within the first 2 weeks of the infection, with lesion size peaking around the 3-week time point. Infection progression patterns in wt and Socs5−/− mice were similar, with none of the mice developing severe lesions. As expected for mice with a Leishmania-resistant background, lesions were no longer evident 8 weeks postinfection. Accordingly, parasite numbers had decreased after 8 weeks, and no differences were found between mice of the two genotypes with respect to either LN cellularity or parasite burdens in the draining LN (Fig. 6b). Analysis of parasite-specific immunoglobulins of the IgM, IgG1, and IgG2c isotypes in serum from infected mice showed no significant differences between wt and Socs5−/− mice (data not shown). SOCS5-deficient mice thus mounted a protective Th1 response similar to that of wt mice, showing that SOCS5 is dispensable for Th1 cell generation and function in vivo.
FIG. 6.

Infection of wt and Socs5−/− mice with 106 L. major promastigotes. (a) Lesion size was monitored weekly and scored from 0 to 5. Individual lesion scores (modified according to the following formula: lesion score = raw score + RND, where RND is a random number between 0 and 0.5) are shown. Closed circles, wt mice; open circles, Socs5−/− mice. Sample sizes ranged from six to eight mice. (b) Analysis of cellularity and parasite burdens in draining LN. Bars represent the total numbers of cells (mean ± standard deviation for two mice per time point), and points indicate the numbers of parasites per 106 cells (each point represents one mouse). Filled bars and circles, wt mice; open bars and circles, Socs5−/− mice.
SOCS5 expression is upregulated during B-cell development.
Little is known of the role of SOCS proteins in B-cell development or function. We found SOCS5 expression in a subset of B220+ splenocytes (Fig. 2). When B cells mature, they downregulate IgM and upregulate IgD surface receptor expression. Analysis of β-Gal expression in IgM- and IgD-expressing Socs5−/− splenocytes showed that SOCS5 is present in cells of all subsets (Fig. 7a). Interestingly, β-Gal expression was more prevalent in low-IgM, high-IgD mature B cells than in the more immature high-IgM, low-IgD cells (79 versus 48%). Furthermore, comparison of expression levels in B-cell populations in BM suggested that SOCS5 is expressed in intermediate-B220 pre-B and immature B cells but is further upregulated in the mature recirculating high-B220 cells (Fig. 7b). These results were confirmed by real-time PCR with sorted BM cells (Fig. 7c).
FIG. 7.

SOCS5 expression in B-cell subsets in spleen and BM. (a) Splenocytes from wt (shaded area) or Socs5−/− (black line) mice were surface stained with fluorochrome-conjugated anti-IgM and anti-IgD antibodies and loaded with FDG in a FACSgal assay. β-Gal expression in the indicated populations was analyzed by flow cytometry. hi, high; lo, low. (b) BM cells were surface stained for B220 expression. β-Gal expression was measured in a FACSgal assay gating on intermediate B220 (B220int; gate 1) or high B220 (B220hi; gate 2). (c) BM cells were sorted into intermediate- and high-B220 populations, and SOCS5 expression was measured by real-time PCR. SOCS5 expression was normalized to the expression of the PBGD housekeeping gene.
Because SOCS5 expression appeared to be upregulated during B-cell development, we were interested in determining whether a lack of SOCS5 had an impact on B-cell development and homeostasis. Percentages of B220-, CD19-, CD43-, IgM-, IgD-, and CD5-expressing B-cell populations in spleen, BM, and LN were analyzed by flow cytometry (Fig. 8 and data not shown). No significant differences between knockout and wt FACS profiles were observed when either pro-B, pre-B, immature, or mature B cell subsets were assessed by using these markers, indicating that SOCS5 is dispensable for B-cell development despite high SOCS5 expression in B cells. A slight increase in lymphocyte numbers was observed in the peritoneal cavities of Socs5−/− mice (Table 1), and this increase appeared to be due to increased numbers of conventional B cells. This trend was, however, very variable and was not seen in all Socs5−/− mice analyzed. Analysis of immunoglobulins in sera from Socs5−/− mice showed normal levels of IgM and IgG compared to levels for wt controls (data not shown).
FIG. 8.

Flow cytometric analysis of B-cell populations in Socs5−/− mice. BM and spleen cell suspensions from wt and Socs5−/− mice were analyzed for surface expression of B220 and IgM. Results are representative of three independent experiments.
Normal proliferative responses in Socs5−/− B cells.
It is not known whether SOCS proteins regulate antigen- or cytokine-induced signaling in B cells. To investigate B-cell responses in the absence of SOCS5, splenic B cells were purified from wt or Socs5−/− mice and stimulated in vitro with different mitogenic stimuli. Cells were labeled with CFSE, and proliferation was measured by flow cytometry, with the number of cell divisions being related to the decrease in fluorescent intensity. As shown in Fig. 9a, stimulation of the antigen receptor alone induced only low levels of proliferation, and no differences between cells from Socs5−/− mice and those from wt controls were seen. These results were confirmed in experiments in which [3H]thymidine incorporation was used as a measure of cell proliferation (data not shown). In addition to antigen receptor stimulation, potent B-cell mitogens also include lipopolysaccharide (LPS), the dinucleotide motif CpG, and CD40 ligand. To investigate the importance of SOCS5 in regulating B-cell responses to these agents, we stimulated B cells in vitro and monitored cell proliferation in the cultures. However, SOCS5 did not appear to influence these responses, because the proliferation seen in B cells lacking SOCS5 was comparable to that in wt cells (Fig. 9b). Moreover, titration of IL-4 into B-cell cultures stimulated with CD40L gave similar responses in wt and SOCS5-deficient cells in assays of both proliferation and isotype switching to IgG1 (data not shown). Therefore, although SOCS5 expression was found in B cells, the absence of SOCS5 had no influence on the proliferative responses of the cells.
FIG. 9.

Proliferative responses in wt or Socs5−/− B cells. CFSE-labeled splenic B cells were incubated for 3 days in the presence of anti-IgM (a) or CD40 ligand, CpG, and LPS (b) and analyzed by flow cytometry.
DISCUSSION
To investigate the role of SOCS5 in vivo, we generated mice lacking the Socs5 gene. SOCS5-deficient mice were healthy and fertile and exhibited no histological abnormalities or alterations in hematological parameters compared to wt control mice. We found that SOCS5 expression in lymphoid tissues was primarily due to SOCS5 expression in B cells. SOCS5 was expressed in all B220-positive cell subsets in BM, spleen, and LN, but expression was most pronounced in mature B cells. There have been no previous reports on SOCS expression in primary B cells, and it is not known whether SOCS proteins are important for B-cell development or function. The fact that SOCS5 expression is upregulated during B-cell development and maturation led us to investigate B-cell functions in SOCS5-deficient mice. Using surface marker analysis, we showed that Socs5−/− mice contained normal percentages of B-cell subsets in lymphoid tissues compared to wt control mice. B-cell development was thus not affected by the absence of SOCS5. Furthermore, B-cell proliferation levels in wt and SOCS5-deficient cells in response to various mitogenic stimuli were comparable. SOCS family members such as SOCS1 and SOCS3 are regulators of LPS and CpG responses in macrophages (6, 19, 30). Our findings that Socs5−/− B cells respond normally to stimulation with LPS and CpG indicate that SOCS5 is not essential for the regulation of these innate immune responses.
Stimulation of T cells through the antigen receptor affects the expression of SOCS family members such as CIS, SOCS1, SOCS2, and SOCS3 (5, 8, 26, 46), suggesting that SOCS proteins are likely to play a role in shaping cytokine responses in newly activated T cells. Our observation that SOCS5 is expressed in primary T cells suggests that SOCS5 could be a regulator of T-cell responses. Despite the fact that overexpression of SOCS5 inhibits signaling in response to IL-4 and IL-6 (31, 38), Socs5−/− T cells showed normal proliferative responses when stimulated with these cytokines, either alone or in combination with anti-CD3. Similarly, proliferation in response to anti-CD3 and anti-CD28 for Socs5−/− T cells was indistinguishable from that for wt T cells. Thus, SOCS5 is unlikely to be an indispensable regulator of TCR- or costimulation-induced signaling. Furthermore, analysis of lymphocyte surface marker expression revealed no alterations in T-cell development or activation status in SOCS5-deficient mice, indicating that SOCS5 is dispensable for T-cell homeostasis.
Seki et al. (38) recently reported that SOCS5 is a Th1-specific protein that inhibits Th2 differentiation by blocking signaling through the IL-4 receptor α chain. Our finding that SOCS5-deficient CD4+ T cells differentiate in vitro into either Th1 or Th2 cells with the same efficiency as wt cells indicates that SOCS5 is not essential for Th1 cell generation. Furthermore, infection of SOCS5-deficient mice with the intracellular parasite L. major showed that the mice mount a protective Th1 response independent of SOCS5. Thus, although overexpression of SOCS5 in T cells appeared to bias CD4+ cells towards Th1 (38), SOCS5 seems not to be required under physiological conditions for the development of Th1 responses in vivo.
The lack of an obvious lymphoid phenotype in SOCS5-deficient mice may reflect functional redundancy between SOCS family members. Expression of CIS, SOCS1, SOCS2, SOCS3, and SOCS6 in primary or effector T cells has previously been reported (12, 38, 46), and the presence of these SOCS proteins may compensate for the lack of SOCS5 in lymphocytes. In addition, SOCS4 and SOCS5 share significant homology and therefore may have similar or overlapping functions in some cell systems. Analyses of the expression of SOCS4 and other SOCS proteins, as well as their contributions to lymphoid regulation in the presence and absence of SOCS5, will be needed to fully investigate these possibilities.
Acknowledgments
We thank Janelle Lochland, Sally Cane, Naomi Sprigg, Sandra Mifsud, Ladina Di Rago, Joan Curtis, and Amanda Light for excellent technical assistance.
This work was supported by the Anti-Cancer Council of Victoria, Melbourne, Australia; The National Health and Medical Research Council, Canberra, Australia (Program Grant no. 257500); and the Australian Federal Government Cooperative Research Centres Program and AMRAD Operations Pty Ltd. C.B. is the recipient of a Ph.D. scholarship from the University of Copenhagen and support from the Knud Høojgaard Foundation. S.E.N. is supported by an Australian Postdoctoral Fellowship (ARC).
REFERENCES
- 1.Alexander, W. S. 2002. Suppressors of cytokine signaling (SOCS) in the immune system. Nat. Rev. Immunol. 2:410-416. [DOI] [PubMed] [Google Scholar]
- 2.Alexander, W. S., D. Metcalf, and A. R. Dunn. 1995. Point mutations within a dimer interface homology domain of c-Mpl induce constitutive receptor activity and tumorigenicity. EMBO J. 14:5569-5578. [DOI] [PMC free article] [PubMed] [Google Scholar]
- 3.Alexander, W. S., A. W. Roberts, N. A. Nicola, R. Li, and D. Metcalf. 1996. Deficiencies in progenitor cells of multiple hematopoietic lineages and defective megakaryocytopoiesis in mice lacking the thrombopoietic receptor c-Mpl. Blood 87:2162-2170. [PubMed] [Google Scholar]
- 4.Alexander, W. S., R. Starr, J. E. Fenner, C. L. Scott, E. Handman, N. S. Sprigg, J. E. Corbin, A. L. Cornish, R. Darwiche, C. M. Owczarek, T. W. Kay, N. A. Nicola, P. J. Hertzog, D. Metcalf, and D. J. Hilton. 1999. SOCS1 is a critical inhibitor of interferon gamma signaling and prevents the potentially fatal neonatal actions of this cytokine. Cell 98:597-608. [DOI] [PubMed] [Google Scholar]
- 5.Banerjee, A., A. S. Banks, M. C. Nawijn, X. P. Chen, and P. B. Rothman. 2002. Cutting edge: suppressor of cytokine signaling 3 inhibits activation of NFATp. J. Immunol. 168:4277-4281. [DOI] [PubMed] [Google Scholar]
- 6.Berlato, C., M. A. Cassatella, I. Kinjyo, L. Gatto, A. Yoshimura, and F. Bazzoni. 2002. Involvement of suppressor of cytokine signaling-3 as a mediator of the inhibitory effects of IL-10 on lipopolysaccharide-induced macrophage activation. J. Immunol. 168:6404-6411. [DOI] [PubMed] [Google Scholar]
- 7.Bullen, D. V., T. M. Baldwin, J. M. Curtis, W. S. Alexander, and E. Handman. 2003. Persistence of lesions in suppressor of cytokine signaling-1-deficient mice infected with Leishmania major. J. Immunol. 170:4267-4272. [DOI] [PubMed] [Google Scholar]
- 8.Cornish, A. L., M. M. Chong, G. M. Davey, R. Darwiche, N. A. Nicola, D. J. Hilton, T. W. Kay, R. Starr, and W. S. Alexander. 2003. Suppressor of cytokine signaling-1 regulates signaling in response to interleukin-2 and other gamma c-dependent cytokines in peripheral T cells. J. Biol. Chem. 278:22755-22761. [DOI] [PubMed] [Google Scholar]
- 9.Cornish, A. L., G. M. Davey, D. Metcalf, J. F. Purton, J. E. Corbin, C. J. Greenhalgh, R. Darwiche, L. Wu, N. A. Nicola, D. I. Godfrey, W. R. Heath, D. J. Hilton, W. S. Alexander, and R. Starr. 2003. Suppressor of cytokine sIgnaling-1 has IFN-γ-independent actions in T cell homeostasis. J. Immunol. 170:878-886. [DOI] [PubMed] [Google Scholar]
- 10.Croker, B. A., D. L. Krebs, J. G. Zhang, S. Wormald, T. A. Willson, E. G. Stanley, L. Robb, C. J. Greenhalgh, I. Forster, B. E. Clausen, N. A. Nicola, D. Metcalf, D. J. Hilton, A. W. Roberts, and W. S. Alexander. 2003. SOCS3 negatively regulates IL-6 signaling in vivo. Nat. Immunol. 4:540-545. [DOI] [PubMed] [Google Scholar]
- 11.Dickensheets, H. L., C. Venkataraman, U. Schindler, and R. P. Donnelly. 1999. Interferons inhibit activation of STAT6 by interleukin 4 in human monocytes by inducing SOCS-1 gene expression. Proc. Natl. Acad. Sci. USA 96:10800-10805. [DOI] [PMC free article] [PubMed] [Google Scholar]
- 12.Egwuagu, C. E., C. R. Yu, M. Zhang, R. M. Mahdi, S. J. Kim, and I. Gery. 2002. Suppressors of cytokine signaling proteins are differentially expressed in Th1 and Th2 cells: implications for Th cell lineage commitment and maintenance. J. Immunol. 168:3181-3187. [DOI] [PubMed] [Google Scholar]
- 13.Eyles, J. L., D. Metcalf, M. J. Grusby, D. J. Hilton, and R. Starr. 2002. Negative regulation of interleukin-12 signaling by suppressor of cytokine signaling-1. J. Biol. Chem. 277:43735-43740. [DOI] [PubMed] [Google Scholar]
- 14.Fujimoto, M., H. Tsutsui, S. Yumikura-Futatsugi, H. Ueda, O. Xingshou, T. Abe, I. Kawase, K. Nakanishi, T. Kishimoto, and T. Naka. 2002. A regulatory role for suppressor of cytokine signaling-1 in T(h) polarization in vivo. Int. Immunol. 14:1343-1350. [DOI] [PubMed] [Google Scholar]
- 15.Greenhalgh, C. J., P. Bertolino, S. L. Asa, D. Metcalf, J. E. Corbin, T. E. Adams, H. W. Davey, N. A. Nicola, D. J. Hilton, and W. S. Alexander. 2002. Growth enhancement in suppressor of cytokine signaling 2 (SOCS-2)-deficient mice is dependent on signal transducer and activator of transcription 5b (STAT5b). Mol. Endocrinol. 16:1394-1406. [DOI] [PubMed] [Google Scholar]
- 16.Hilton, D. J., R. T. Richardson, W. S. Alexander, E. M. Viney, T. A. Willson, N. S. Sprigg, R. Starr, S. E. Nicholson, D. Metcalf, and N. A. Nicola. 1998. Twenty proteins containing a C-terminal SOCS box form five structural classes. Proc. Natl. Acad. Sci. USA 95:114-119. [DOI] [PMC free article] [PubMed] [Google Scholar]
- 17.Ilangumaran, S., S. Ramanathan, J. La Rose, P. Poussier, and R. Rottapel. 2003. Suppressor of cytokine signaling 1 regulates IL-15 receptor signaling in CD8+CD44high memory T lymphocytes. J. Immunol. 171:2435-2445. [DOI] [PubMed] [Google Scholar]
- 18.Kamura, T., S. Sato, D. Haque, L. Liu, W. G. Kaelin, Jr., R. C. Conaway, and J. W. Conaway. 1998. The Elongin BC complex interacts with the conserved SOCS-box motif present in members of the SOCS, ras, WD-40 repeat, and ankyrin repeat families. Genes Dev. 12:3872-3881. [DOI] [PMC free article] [PubMed] [Google Scholar]
- 19.Kinjyo, I., T. Hanada, K. Inagaki-Ohara, H. Mori, D. Aki, M. Ohishi, H. Yoshida, M. Kubo, and A. Yoshimura. 2002. SOCS1/JAB is a negative regulator of LPS-induced macrophage activation. Immunity 17:583-591. [DOI] [PubMed] [Google Scholar]
- 20.Kontgen, F., G. Suss, C. Stewart, M. Steinmetz, and H. Bluethmann. 1993. Targeted disruption of the MHC class II Aa gene in C57BL/6 mice. Int. Immunol. 5:957-964. [DOI] [PubMed] [Google Scholar]
- 21.Krebs, D. L., R. T. Uren, D. Metcalf, S. Rakar, J. G. Zhang, R. Starr, D. P. De Souza, K. Hanzinikolas, J. Eyles, L. M. Connolly, R. J. Simpson, N. A. Nicola, S. E. Nicholson, M. Baca, D. J. Hilton, and W. S. Alexander. 2002. SOCS-6 binds to insulin receptor substrate 4, and mice lacking the SOCS-6 gene exhibit mild growth retardation. Mol. Cell. Biol. 22:4567-4578. [DOI] [PMC free article] [PubMed] [Google Scholar]
- 22.Lang, R., A. L. Pauleau, E. Parganas, Y. Takahashi, J. Mages, J. N. Ihle, R. Rutschman, and P. J. Murray. 2003. SOCS3 regulates the plasticity of gp130 signaling. Nat. Immunol. 4:546-550. [DOI] [PubMed] [Google Scholar]
- 23.Losman, J. A., X. P. Chen, D. Hilton, and P. Rothman. 1999. Cutting edge: SOCS-1 is a potent inhibitor of IL-4 signal transduction. J. Immunol. 162:3770-3774. [PMC free article] [PubMed] [Google Scholar]
- 24.Magrangeas, F., F. Apiou, S. Denis, U. Weidle, Y. Jacques, and S. Minvielle. 2000. Cloning and expression of CIS6, chromosome assignment to 3p22 and 2p21 by in situ hybridization. Cytogenet. Cell Genet. 88:78-81. [DOI] [PubMed] [Google Scholar]
- 25.Marine, J. C., C. McKay, D. Wang, D. J. Topham, E. Parganas, H. Nakajima, H. Pendeville, H. Yasukawa, A. Sasaki, A. Yoshimura, and J. N. Ihle. 1999. SOCS3 is essential in the regulation of fetal liver erythropoiesis. Cell 98:617-627. [DOI] [PubMed] [Google Scholar]
- 26.Matsumoto, A., Y. Seki, M. Kubo, S. Ohtsuka, A. Suzuki, I. Hayashi, K. Tsuji, T. Nakahata, M. Okabe, S. Yamada, and A. Yoshimura. 1999. Suppression of STAT5 functions in liver, mammary glands, and T cells in cytokine-inducible SH2-containing protein 1 transgenic mice. Mol. Cell. Biol. 19:6396-6407. [DOI] [PMC free article] [PubMed] [Google Scholar]
- 27.Metcalf, D., C. J. Greenhalgh, E. Viney, T. A. Willson, R. Starr, N. A. Nicola, D. J. Hilton, and W. S. Alexander. 2000. Gigantism in mice lacking suppressor of cytokine signaling-2. Nature 405:1069-1073. [DOI] [PubMed] [Google Scholar]
- 28.Metcalf, D., S. Mifsud, L. Di Rago, N. A. Nicola, D. J. Hilton, and W. S. Alexander. 2002. Polycystic kidneys and chronic inflammatory lesions are the delayed consequences of loss of the suppressor of cytokine signaling-1 (SOCS-1). Proc. Natl. Acad. Sci. USA 99:943-948. [DOI] [PMC free article] [PubMed] [Google Scholar]
- 29.Naka, T., T. Matsumoto, M. Narazaki, M. Fujimoto, Y. Morita, Y. Ohsawa, H. Saito, T. Nagasawa, Y. Uchiyama, and T. Kishimoto. 1998. Accelerated apoptosis of lymphocytes by augmented induction of Bax in SSI-1 (STAT-induced STAT inhibitor-1) deficient mice. Proc. Natl. Acad. Sci. USA 95:15577-15582. [DOI] [PMC free article] [PubMed] [Google Scholar]
- 30.Nakagawa, R., T. Naka, H. Tsutsui, M. Fujimoto, A. Kimura, T. Abe, E. Seki, S. Sato, O. Takeuchi, K. Takeda, S. Akira, K. Yamanishi, I. Kawase, K. Nakanishi, and T. Kishimoto. 2002. SOCS-1 participates in negative regulation of LPS responses. Immunity 17:677-687. [DOI] [PubMed] [Google Scholar]
- 31.Nicholson, S. E., T. A. Willson, A. Farley, R. Starr, J. G. Zhang, M. Baca, W. S. Alexander, D. Metcalf, D. J. Hilton, and N. A. Nicola. 1999. Mutational analyses of the SOCS proteins suggest a dual domain requirement but distinct mechanisms for inhibition of LIF and IL-6 signal transduction. EMBO J. 18:375-385. [DOI] [PMC free article] [PubMed] [Google Scholar]
- 32.O'Garra, A. 1998. Cytokines induce the development of functionally heterogeneous T helper cell subsets. Immunity 8:275-283. [DOI] [PubMed] [Google Scholar]
- 33.Roberts, A. W., L. Robb, S. Rakar, L. Hartley, L. Cluse, N. A. Nicola, D. Metcalf, D. J. Hilton, and W. S. Alexander. 2001. Placental defects and embryonic lethality in mice lacking suppressor of cytokine signaling 3. Proc. Natl. Acad. Sci. USA 98:9324-9329. [DOI] [PMC free article] [PubMed] [Google Scholar]
- 34.Sacks, D., and N. Noben-Trauth. 2002. The immunology of susceptibility and resistance to Leishmania major in mice. Nat. Rev. Immunol. 2:845-858. [DOI] [PubMed] [Google Scholar]
- 35.Sasaki, A., H. Yasukawa, A. Suzuki, S. Kamizono, T. Syoda, I. Kinjyo, M. Sasaki, J. A. Johnston, and A. Yoshimura. 1999. Cytokine-inducible SH2 protein-3 (CIS3/SOCS3) inhibits Janus tyrosine kinase by binding through the N-terminal kinase inhibitory region as well as SH2 domain. Genes Cells 4:339-351. [DOI] [PubMed] [Google Scholar]
- 36.Schwenk, F., U. Baron, and K. Rajewsky. 1995. A cre-transgenic mouse strain for the ubiquitous deletion of loxP-flanked gene segments including deletion in germ cells. Nucleic Acids Res. 23:5080-5081. [DOI] [PMC free article] [PubMed] [Google Scholar]
- 37.Seki, Y., H. Inoue, N. Nagata, K. Hayashi, S. Fukuyama, K. Matsumoto, O. Komine, S. Hamano, K. Himeno, K. Inagaki-Ohara, N. Cacalano, A. O'Garra, T. Oshida, H. Saito, J. A. Johnston, A. Yoshimura, and M. Kubo. 2003. SOCS-3 regulates onset and maintenance of T(H)2-mediated allergic responses. Nat. Med. 9:1047-1054. [DOI] [PubMed] [Google Scholar]
- 38.Seki, Y.-I., K. Hayashi, A. Matsumoto, N. Seki, J. Tsukada, J. Ransom, T. Naka, T. Kishimoto, A. Yoshimura, and M. Kubo. 2002. Expression of the suppressor of cytokine signaling-5 (SOCS5) negatively regulates IL-4-dependent STAT6 activation and Th2 differentiation. Proc. Natl. Acad. Sci. USA 99:13003-13008. [DOI] [PMC free article] [PubMed] [Google Scholar]
- 39.Song, M. M., and K. Shuai. 1998. The suppressor of cytokine signaling (SOCS) 1 and SOCS3 but not SOCS2 proteins inhibit interferon-mediated antiviral and antiproliferative activities. J. Biol. Chem. 273:35056-35062. [DOI] [PubMed] [Google Scholar]
- 40.Starr, R., D. Metcalf, A. G. Elefanty, M. Brysha, T. A. Willson, N. A. Nicola, D. J. Hilton, and W. S. Alexander. 1998. Liver degeneration and lymphoid deficiencies in mice lacking suppressor of cytokine signaling-1. Proc. Natl. Acad. Sci. USA 95:14395-14399. [DOI] [PMC free article] [PubMed] [Google Scholar]
- 41.Takahashi, Y., N. Carpino, J. C. Cross, M. Torres, E. Parganas, and J. N. Ihle. 2003. SOCS3: an essential regulator of LIF receptor signaling in trophoblast giant cell differentiation. EMBO J. 22:372-384. [DOI] [PMC free article] [PubMed] [Google Scholar]
- 42.Titus, R. G., M. Marchand, T. Boon, and J. A. Louis. 1985. A limiting dilution assay for quantifying Leishmania major in tissues of infected mice. Parasite Immunol. 7:545-555. [DOI] [PubMed] [Google Scholar]
- 43.Yasukawa, H., H. Misawa, H. Sakamoto, M. Masuhara, A. Sasaki, T. Wakioka, S. Ohtsuka, T. Imaizumi, T. Matsuda, J. N. Ihle, and A. Yoshimura. 1999. The JAK-binding protein JAB inhibits Janus tyrosine kinase activity through binding in the activation loop. EMBO J. 18:1309-1320. [DOI] [PMC free article] [PubMed] [Google Scholar]
- 44.Yasukawa, H., M. Ohishi, H. Mori, M. Murakami, T. Chinen, D. Aki, T. Hanada, K. Takeda, S. Akira, M. Hoshijima, T. Hirano, K. R. Chien, and A. Yoshimura. 2003. IL-6 induces an anti-inflammatory response in the absence of SOCS3 in macrophages. Nat. Immunol. 4:551-556. [DOI] [PubMed] [Google Scholar]
- 45.Yoshimura, A., T. Ohkubo, T. Kiguchi, N. A. Jenkins, D. J. Gilbert, N. G. Copeland, T. Hara, and A. Miyajima. 1995. A novel cytokine-inducible gene CIS encodes an SH2-containing protein that binds to tyrosine-phosphorylated interleukin 3 and erythropoietin receptors. EMBO J. 14:2816-2826. [DOI] [PMC free article] [PubMed] [Google Scholar]
- 46.Yu, C. R., R. M. Mahdi, S. Ebong, B. P. Vistica, I. Gery, and C. E. Egwuagu. 2003. Suppressor of cytokine signaling 3 regulates proliferation and activation of T-helper cells. J. Biol. Chem. 278:29752-29759. [DOI] [PubMed] [Google Scholar]
- 47.Zhang, J. G., A. Farley, S. E. Nicholson, T. A. Willson, L. M. Zugaro, R. J. Simpson, R. L. Moritz, D. Cary, R. Richardson, G. Hausmann, B. J. Kile, S. B. Kent, W. S. Alexander, D. Metcalf, D. J. Hilton, N. A. Nicola, and M. Baca. 1999. The conserved SOCS box motif in suppressors of cytokine signaling binds to elongins B and C and may couple bound proteins to proteasomal degradation. Proc. Natl. Acad. Sci. USA 96:2071-2076. [DOI] [PMC free article] [PubMed] [Google Scholar]