Abstract
Weight and 34 morphological measures were obtained from 103 vervet monkeys living either in the wild or in captive colonies derived from the wild populations on the island of St. Kitts in the Eastern Caribbean. All measures were taken during the same week, eliminating bias that might result from changing seasonal environmental conditions. Vervets on St. Kitts are all descended from a small number of individuals brought to the island approximately 400 years ago from West Africa, thus also eliminating bias that might result from subspecific size differences. We conducted a principal components analysis (PCA) and compared individual traits between captive and wild adult animals. Morphological measures such as body length, arm and leg length did not differ significantly between animals living in the wild and animals in captivity. Weight and measures indicating condition- including BMI, chest girth, thigh girth, and upper arm girth were all higher for animals living in captivity. More consistent available food is probably the cause of differences in measures reflecting condition.
Keywords: vervet monkey, adult body size, captive, wild
Introduction
Studies of growth, development and adult body size are major components of an analysis of life history variation in nonhuman primates. Natural selection can operate on immature individuals allowing only some to reach maturity and reproduce (Bolter and Zihlman, 2011). Growth rates and patterns illustrate the life history trade-offs that occur during the maturation process and lead to differences in adult body size in males and females. Size differences in adult individuals may also indicate condition that in turn affects reproduction. For example, among semi-free ranging macaques, females that are larger live longer and give birth to more offspring (Bloomquist and Turnquist, 2011). Growth and development studies require either multiple measures of the same individuals over the course of time or a cross sectional analysis of many individuals of differing ages at a single point in time. Such studies, especially the longitudinal studies, are most easily conducted on captive animals even though crucial information on life history (e.g. predation risk, food-search time budgets) can only be obtained from animals living in natural habitats. In addition, it has long been recognized that animals housed in a captive environment differ from those in the wild in multiple growth related parameters (Sigg et al., 1982). Some studies have been conducted to assess the degree of difference between wild and captive individuals. Studies on baboons (Altmann et al., 1981; Phillips-Conroy and Jolly, 1988), vervets (Cheney et al, 1988; Bolter and Zihlman, 2003), macaques (Cheverud et al. 1992), and chimpanzees (Zihlman et al., 2004, 2007; Bolter and Zihlman, 2011) all indicate that captive primates have accelerated rates of growth in comparison to their wild counterparts. Differences in adult body size have also been examined in a variety of environmental conditions. In the wild, animals that have greater access to food resources are heavier (Sailer et al., 1985). This may reflect better condition that results from social factors such as maternal condition (Setchell et al., 2001; Garcia et al., 2009) feeding competition (Uehara and Nishida, 1987) and access to human food (Pusey et al., 2005; Altmann et al., 1993) all of which may influence reproduction.
While multiple studies indicate the accelerated growth of primates incaptivity, little is known about the differences in adult body size between captive and wild individuals. Studies of captive animals rarely provide data on measures beyond mean weight for age class (exceptions include Harvey, et al., (1991); Hamada and Udono (2002), and especially, Schoonaert, et al., (2007)). Body weight alone is too simplistic to capture the differences between captive and wild animals (Strum 1991). For example, abundant food obtained with little effort means that in most cases captive animals in good conditions will weigh more than wild animals, but without other measurements we cannot say if wild and captive animals have similar body proportions. Both life history theory and sexual selection theory predict sex differences in conversion of food into soma and lead us to expect that males and females may utilize the extra energy available in captive situations in different ways. These theories cannot be tested without data on comprehensive suite of body measurements
This study was conducted to determine if adult animals differing in captive or free ranging living situations differ in body weight and proportion. In our study we have controlled for potential sources of variability, including seasonality and genetic background. We were able to control for any potential genetic differences in size between different subspecies of vervets because all vervets on St. Kitts are descendants of a small founding group of animals brought to the island nearly 400 years ago. We have previously observed differences in size among subspecies of vervets living in South Africa, the Gambia, Ethiopia and Kenya (Turner et al., 2014). Having all animals descended from a small founding population from a single area mitigates any subspecific genetic differences that might be found in a sample of animals from multiple locations.
Methods
Selection of study species
This project is part of a larger study by the International Vervet Research Consortium (http://www.genomequebec.mcgill.ca/compgen/vervet_research/) on the genetics, genomics, incidence of SIV infection and population biology of vervet monkeys in Africa and the Caribbean (Jasinska et al., 2013). Vervets are one of the most common Old World monkeys. Even though the major vervet subspecies are listed on CITES Appendix 2, they are not threatened anywhere in their range.
It is estimated that there are upwards of 30,000 vervets on St. Kitts, even though the island is only 69 square miles in area. From the 1600s, when a small number of vervets were introduced, until relatively recently when the sugar plantations were dissolved, vervets were found primarily in the mountainous interior of the island. Contact with humans was minimal, although periodically bounties were placed on vervets to reduce the population. During the time of the sugar plantations, vervets were kept away from the sugar fields by guards and dogs. Since the relatively recent dissolution of the sugar plantations, vervets have been moving into farms in the low lying areas where they are coming into increased conflict with humans (Dore, 2013). There are two research facilities on St. Kitts that have been in operation for over 40 years that house and breed vervet monkeys. Vervets are abundant on St.Kitts. It has been estimated that approximately 5000 vervets could be removed from St. Kitts per year without affecting the viability or diversity of the population (Erwin and Palmour, 2003).
Sample collection
Samples were collected from animals housed in the St Kitts Biomedical Research Foundation and in the wild. All data were collected from the research facility and animals trapped by commercial trappers during the same week. In order to assess body size differences between adult wild and captive individuals, we weighed and measured 103 vervet monkeys (captive – 11 males, 38 females; wild – 25 males, 29 females) on the island of St. Kitts in the Eastern Caribbean during a single week. This tight schedule controlled for variables of rainfall, seasonality and temperature
St. Kitts Biomedical Research Foundation
The research facility houses vervets in group cages. Females are housed separately from males, except for breeding groups. In breeding groups, one male is isolated from, but adjacent to, a group of females. Group cages are located outside and are 8 ft. high and made of chain link fencing with a cement foundation. They have drains, automatic watering, chow dispensers, slight barriers, perches and swings. The cage sizes range from 10 ft to 24 ft by 15 ft to 24 ft. Males, if housed separately, are in stainless steel squeeze cages that are 33 by 30 by 30 inches. If the facility is in need of infants, the animals are allowed to breed. The animals are fed Harlan Teklad 8773 NIB Primate Diet in biscuit form with enrichment supplements of local fruits and vegetables. Only animals that had been housed in the research facility for more than two years were included in this study as part of the captive sample. None of the animals were born in captivity. Some entered the facility as juveniles, others as subadults or young adults. Further dividing the sample into age categories at the time of entry into the facility would have made each category too small for analysis. Rodriguez, et al (2015) has indicated that growth in vervet monkeys can continue beyond the early adult phase (defined by dental eruption sequences), so choosing animals who were relatively young when entering the facility allowed for somatic changes while in the facility. Only animals that were dentally adult at the time of data collection are included in this study.
Animals in the wild
There are numerous commercial trappers on St. Kitts who work with the various research facilities on the island. Large wire mesh traps are set up in forested locations and baited. When vervets are needed, trappers manually close the traps and sedate the animals. Whole groups of animals are trapped at once. Animals for this study were tagged with a microchip and were released back into the wild after processing (Jasinska et al., 2013). Only adult animals were included in this study. None of the females were pregnant. All protocols for capture, sedation, and sampling were approved by the Animal Research Committee of the University of California-Los Angeles and the IACUC of the St. Kitts Biomedical Research Foundation. Animals were sedated with a combination of Ketamine (10mg/kg BW and Xylazine (0,05 mg/kg BW).
Measurements
We took a series of 30 body measurements in addition to weight on each animal during January, 2010. The measures are described in the protocols produced by the Bones and Behavior Working Group (http://www.bonesandbehavior.org/protocol.pdf). These measures were defined by the working group in order to standardize the techniques used by individuals studying morphological variation in modern humans, primates and fossils and are freely available online. Every animal was measured by TRT and JDC sequentially to ensure that measuring techniques were identical. In the few cases of disagreement, both investigators re-measured. All animals were adults as defined by dental eruption sequences (Cramer et al, 2013). There were no old animals (as defined by dental wear) or pregnant females.
Traits included in the analyses (all measurements are lengths and all units are in cm unless otherwise indicated) are either standard morphological traits or traits that indicate condition. Standard morphological traits include: head length, body length, upper and lower arm length, hand length, bi-iliac breadth, sternal notch to pubic symphasis (sternum-pubis) length, upper and lower leg length, tail length, foot length, and canine length. Traits indicating condition include: testes volume (cc), body mass (kg), shoulder breadth, upper arm girth, chest girth, waist girth, thigh girth.
Statistical analysis
To evaluate the influence of potential outliers, we standardized each variable and eliminated any animals with an absolute z score higher than 4.0 for any trait. No males were eliminated by this procedure, but three captive females were removed. We report the results with these three outliers. We used both parametric (t-test and F-test) and nonparametric (Mann-Whitney test and Ansari-Bradley test) tests to investigate sex differences in the mean and variances of each trait. The bivariate tests were conducted using base statistics in R (R Core Team, 2014). Some animals were missing data on a few measurements, so the sample sizes fluctuated between tests. The parametric and nonparametric tests led to the same conclusions for all variables, and we therefore report the parametric results.
Principal component analyses were conducted on four subsets of the data: female morphological traits, female condition traits, male morphological traits, and male condition traits. To compare the male PCA on condition traits to the female PCA on those traits we ran the two analyses, one omitting testes volume and the other containing the trait. The PCAs were run on cases with no missing data for the traits under consideration and variables were standardized. V-tests (Lě et al., 2008) were used to test the statistical significance of the correlation of each variable with each principal component and to determine if wild and captive groups differed significantly on the first two principal components. The PCAs were done with the FactoMineR package for R (Husson et al., 2011, 2015; Lě et al., 2008).
Results
All traits were sexually dimorphic, with males being larger than females(Table 1). Six traits exhibited sexual dimorphism in variation, with males being more variable for four (lower arm length, lower leg length, foot length, and bi-iliac breadth) and females for two (tail length and waist girth). The PCA analysis was only performed for all animals having all measurements. Outliers were removed. For each sex we performed separate principal components analyses on the suites of morphological and condition traits. Tables 2 and 3 display the summary data for the individual variables in each suite of traits and statistical tests for differences in center and variance between the wild and captive states.
Table 1.
Sex differences in morphological and condition traits: Values in second and third columns include number of animals and mean (sd). Column four reports the t statistic and p value for t-tests of different means assuming unequal variances. Column five reports the F statistic and p value for tests of homogeneity of variances. The p values below 0.05 are bolded.
| Trait | Females | Males | t statistic | F statistic | |
|---|---|---|---|---|---|
| Morphological Traits | |||||
| Head Length (cm) | N = 63 9.30 (0.44) | N = 36 10.08 (0.54) | -7.40 <0.0000 | 0.65 0.1352 | |
| Body Length (cm) | N = 63 34.44 (2.00) | N = 36 39.54 (2.36) | -10.93 <0.0000 | 0.72 0.2487 | |
| Upper Arm Length (cm) | N = 63 13.96 (0.66) | N = 36 16.62 (0.82) | -16.61 <0.0000 | 0.65 0.1336 | |
| Lower Arm Length (cm) | N = 63 12.98 (0.68) | N = 36 15.65 (0.92) | -15.28 <0.0000 | 0.55 0.0403 | |
| Hand Length (cm) | N = 63 8.61 (0.53) | N = 36 10.06 (0.60) | -12.05 <0.0000 | 0.81 0.4560 | |
| Bi-iliac Breadth (cm) | N = 58 7.15 (0.82) | N = 22 8.84 (3.11) | -2.51 0.0199 | 0.07 <0.0000 | |
| Sternum-pubis Length (cm) | N = 58 31.14 (1.46) | N = 23 36.96 (1.96) | -12.88 <0.0000 | 0.56 0.0819 | |
| Upper Leg Length (cm) | N = 63 15.24 (0.87) | N = 36 18.38 (1.02) | -15.54 <0.0000 | 0.73 0.2808 | |
| Lower Leg Length (cm) | N = 63 16.06 (0.62) | N = 36 19.38 (1.05) | -17.32 <0.0000 | 0.34 0.0002 | |
| Tail Length (cm) | N = 59 55.53 (8.80) | N = 34 68.48 (5.18) | -8.94 <0.0000 | 2.89 0.0015 | |
| Foot Length (cm) | N = 63 12.60 (0.65) | N = 36 14.53 (1.52) | -7.27 <0.0000 | 0.18 <0.0000 | |
| Canine Length (cm) | N = 49 0.56 (0.10) | N = 25 0.81 (0.12) | -8.93 <0.0000 | 0.62 0.1595 | |
| Condition Traits | |||||
| Body Mass (kg) | N = 64 3.79 (0.92) | N = 36 5.63 (1.22) | -7.87 <0.0000 | 0.57 0.0552 | |
| Shoulder Breadth (cm) | N = 58 9.01 (0.93) | N = 23 11.30 (1.00) | -9.46 <0.0000 | 0.86 0.6336 | |
| Upper Arm Girth (cm) | N = 59 12.38 (1.64) | N = 23 15.11 (1.51) | -7.17 <0.0000 | 1.19 0.6702 | |
| Chest Girth (cm) | N = 62 29.38 (2.16) | N = 36 34.47 (1.92) | -12.10 <0.0000 | 1.27 0.4530 | |
| Waist Girth (cm) | N = 59 24.97 (3.41) | N = 24 27.42 (1.92) | -4.12 0.0001 | 3.16 0.0034 | |
| Thigh Girth (cm) | N = 59 18.14 (2.65) | N = 23 22.27 (1.90) | -7.88 <0.0000 | 1.95 0.0864 | |
Table 2.
Status differences for captive and wild females with complete data for morphological and condition traits. Values in second and third columns are mean (sd). Column four reports the t statistic and p value for t-tests of different means assuming unequal variances. Column five reports the F statistic and p value for tests of homogeneity of variances. The p values below 0.05 are bolded.
| Trait | Captive | Wild | t statistic | F statistic |
|---|---|---|---|---|
| Morphological Traits (captive = 23; wild = 22) | ||||
| Head Length (cm) | 9.37 (0.43) | 9.09 (0.37) | 2.34 0.0242 | 1.39 0.4526 |
| Body Length (cm) | 34.85 (1.45) | 33.58 (2.19) | 2.27 0.0289 | 0.44 0.0603 |
| Upper Arm Length (cm) | 14.15 (0.61) | 13.84 (0.66) | 1.64 0.1090 | 0.85 0.7136 |
| Lower Arm Length (cm) | 13.06 (0.68) | 12.89 (0.72) | 0.85 0.3976 | 0.88 0.7744 |
| Hand Length (cm) | 8.43 (0.43) | 8.84 (0.54) | -2.76 0.0086 | 0.64 0.3061 |
| Bi-iliac Breadth (cm) | 7.66 (0.81) | 6.65 (0.58) | 4.82 <0.0000 | 1.93 0.1361 |
| Sternum-pubis Length (cm) | 31.37 (1.31) | 30.75 (1.60) | 1.42 0.1639 | 0.67 0.3515 |
| Upper Leg Length (cm) | 15.50 (0.92) | 15.18 (0.92) | 1.16 0.2518 | 0.99 0.9856 |
| Lower Leg Length (cm) | 16.15 (0.51) | 15.98 (0.68) | 0.97 0.3371 | 0.56 0.1855 |
| Tail Length (cm) | 54.91 (8.00) | 58.18 (4.30) | -1.72 0.0949 | 3.46 0.0060 |
| Foot Length (cm) | 12.54 (0.58) | 12.64 (0.73) | -0.47 0.6395 | 0.64 0.3091 |
| Canine Length (cm) | 0.55 (0.12) | 0.57 (0.08) | -0.69 0.4924 | 2.37 0.0523 |
| Condition Traits (captive = 34; wild = 24) | ||||
| Body Mass (kg) | 4.36 (0.56) | 3.02 (0.60) | 8.63 <0.0000 | 0.88 0.7179 |
| Shoulder Breadth (cm) | 9.27 (0.95) | 8.64 (0.76) | 2.78 0.0075 | 1.55 0.2733 |
| Upper Arm Girth (cm) | 13.32 (1.13) | 10.96 (1.16) | 7.72 <0.0000 | 0.96 0.8882 |
| Chest Girth (cm) | 30.59 (1.66) | 27.98 (1.87) | 5.48 <0.0000 | 0.79 0.5310 |
| Waist Girth (cm) | 26.60 (2.14) | 22.25 (2.60) | 6.75 <0.0000 | 0.68 0.2981 |
| Thigh Girth (cm) | 19.74 (1.95) | 15.85 (1.73) | 7.97 <0.0000 | 1.28 0.5445 |
Table 3.
Status differences for captive and wild males with complete data for morphological and condition traits. Values in second and third columns are mean (sd). Column four reports the t statistic and p value for t-tests of different means assuming unequal variances. Column five reports the F statistic and p value for tests of homogeneity of variances. The p values below 0.05 are bolded.
| Trait | Captive | Wild | t statistic | F statistic |
|---|---|---|---|---|
| Morphological Traits (captive = 8; wild = 10) | ||||
| Head Length (cm) | 10.12 (0.58) | 10.25 (0.63) | -0.43 0.6697 | 0.84 0.8398 |
| Body Length (cm) | 39.62 (1.71) | 39.50 (2.24) | 0.13 0.8947 | 0.58 0.4880 |
| Upper Arm Length (cm) | 16.81 (0.88) | 16.30 (0.79) | 1.28 0.2204 | 1.26 0.7333 |
| Lower Arm Length (cm) | 15.88 (0.99) | 15.35 (0.75) | 1.24 0.2365 | 1.76 0.4225 |
| Hand Length (cm) | 10.06 (0.42) | 9.85 (0.75) | 0.76 0.4578 | 0.31 0.1386 |
| Bi-iliac Breadth (cm) | 9.59 (3.97) | 8.65 (3.04) | 0.55 0.5908 | 1.70 0.4495 |
| Sternum-pubis Length (cm) | 38.69 (1.39) | 36.00 (1.45) | 4.00 0.0011 | 0.91 0.9238 |
| Upper Leg Length (cm) | 18.81 (1.13) | 18.35 (0.97) | 0.92 0.3752 | 1.35 0.6580 |
| Lower Leg Length (cm) | 19.19 (0.96) | 19.05 (0.68) | 0.34 0.7388 | 1.97 0.3393 |
| Tail Length (cm) | 70.69 (6.11) | 66.50 (5.36) | 1.52 0.1494 | 1.30 0.6974 |
| Foot Length (cm) | 13.94 (2.92) | 14.95 (0.50) | -0.97 0.3633 | 34.50 <0.0000 |
| Canine Length (cm) | 0.84 (0.10) | 0.80 (0.13) | 0.70 0.4919 | 0.57 0.4730 |
| Condition Traits (captive = 11; wild = 12) | ||||
| Body Mass (kg) | 4.36 (0.86) | 3.02 (1.56) | 2.87 0.0104 | 0.31 0.0744 |
| Shoulder Breadth (cm) | 11.71 (1.05) | 10.92 (0.82) | 2.01 0.0591 | 1.65 0.4231 |
| Upper Arm Girth (cm) | 16.09 (1.18) | 14.21 (1.20) | 3.80 0.0010 | 0.97 0.9731 |
| Chest Girth (cm) | 35.64 (1.83) | 34.25 (1.50) | 1.98 0.0626 | 1.49 0.5215 |
| Waist Girth (cm) | 28.73 (1.68) | 26.25 (1.39) | 3.84 0.0011 | 1.46 0.5440 |
| Thigh Girth (cm) | 23.50 (1.47) | 21.17 (1.56) | 3.70 0.0013 | 0.89 0.8575 |
| Testes (cc) | 13.27 (3.20) | 13.09 (4.01) | 0.12 0.9076 | 0.64 0.4856 |
The analysis for the morphological traits of 23 captive and 22 wild females are presented in Figures 1 and 2. The first two principal components explain about 45% of the variance. As is usual for most PCA of anthropometric measures, the first principal component is a size factor. The second PC exhibits an opposition between hand and foot lengths in the upper half of the plot and upper arm length, body length and bi-iliac breadth in the plot's lower half.
Figure 1.
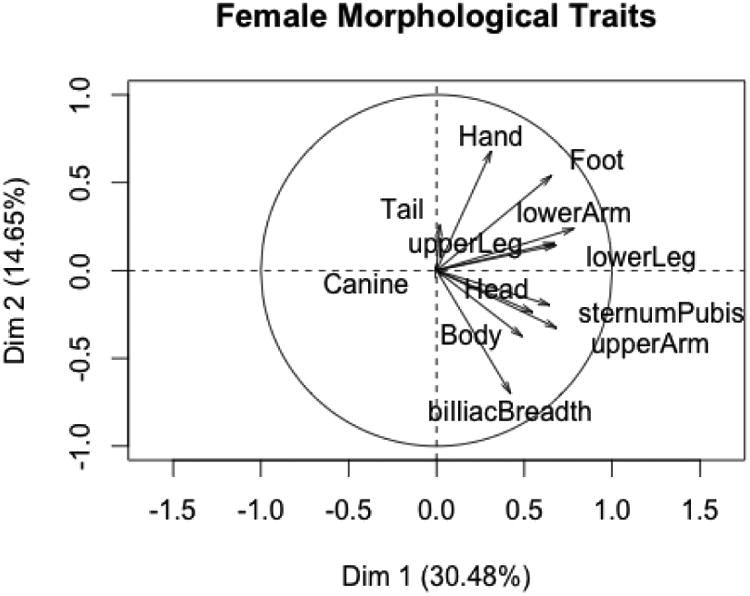
PC1 and PC2 for female morphological variables.
Figure 2.
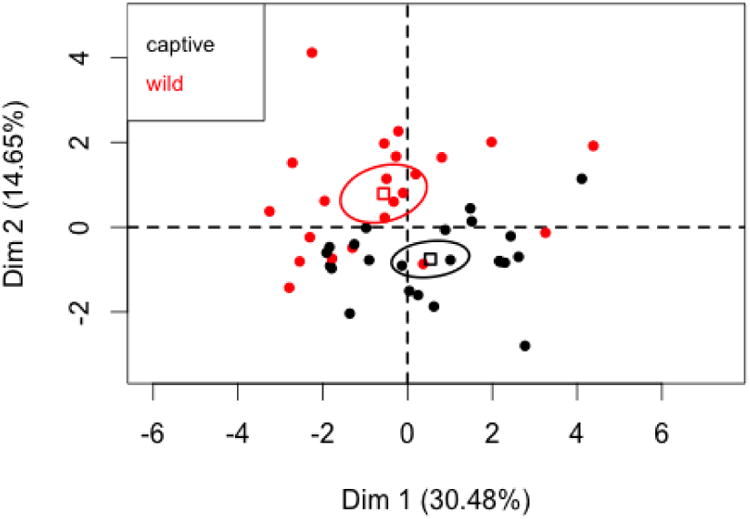
PC1 and PC2 coordinates for female morphological variables with 95% confidence ellipses for captive and wild states.
The v-tests indicate that all traits except for and canine length are correlated with the first PC, while only hand length, foot length, upper arm length, body length and bi-iliac breadth are correlated with the second PC. Figure 2 shows the 95% confidence ellipses for the barycenter of the captive and wild states. The ellipses indicate that the two states do not differ on the first PC, a conclusion supported by the v-tests. In other words, captive and wild females do not differ in over-all body size. The ellipses and v-tests indicate that captive and wild animals do differ on the second PC: compared to wild females (after factoring in over-all body size), captive females tend to exhibit longer upper arms, longer bodies, and wider bi-iliac breadths, but shorter hands and feet. V-tests indicate that captive and wild states did not differ on the third PC.
There were 34 captive and 24 wild females in the condition subset. The first two components of the PCA (Figures 3 and 4) explain about 82% of the variation in traits signaling condition. All traits correlate strongly with PC1, which again is an over-all size factor. There is a statistically significant difference between captive and wild females on this dimension, with captive females being larger. T tests for the research hypothesis that captive females were larger than wild females demonstrated statistically significant differences in the means of each of the six condition variables. The captive and wild states do not differ on either the second or third principal components.
Figure 3.
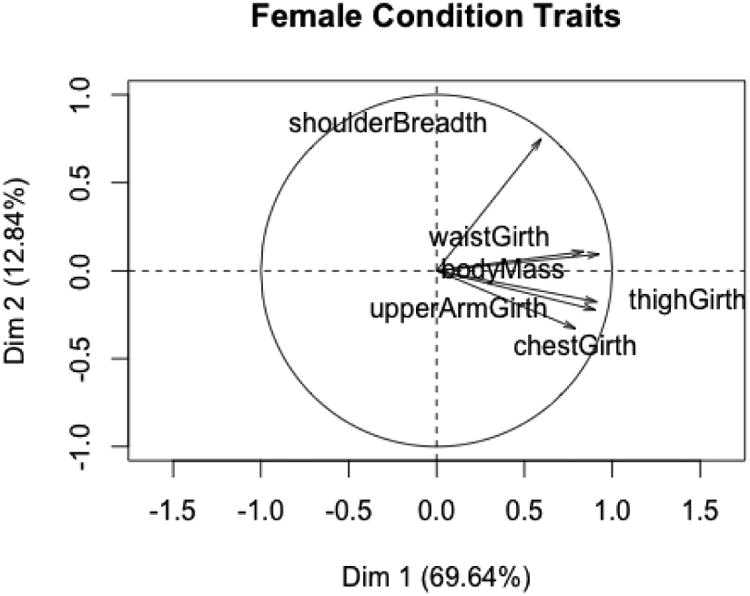
PC1 and PC2 for female condition variables.
Figure 4.
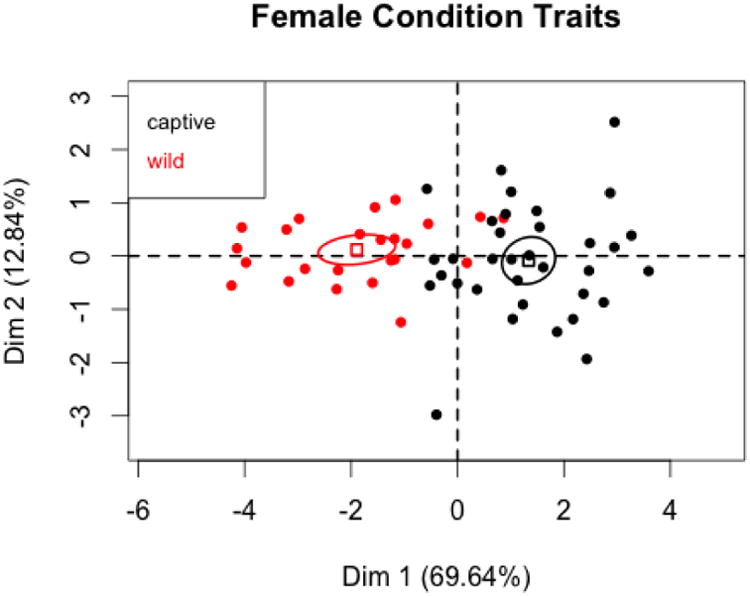
PC1 and PC2 coordinates for female condition variables with 95% confidence ellipses for captive and wild states.
The PCAs for males must be viewed with caution due to small sample sizes. There are only eight captive and ten wild males with data on all morphological traits (Figures 5 and 6). The first PC is again an over-all size factor, with foot's placement on the left side of the graph probably being the result of small sample size. The first two PCs account for about 52% of the variation in the variables. V-tests find that captive and wild states do not differ significantly on any of the first three PCs (and also that the correlation between foot and the first PC is not significant). These results suggest that captive and wild males do not differ on the suite of morphological variables.
Figure 5.
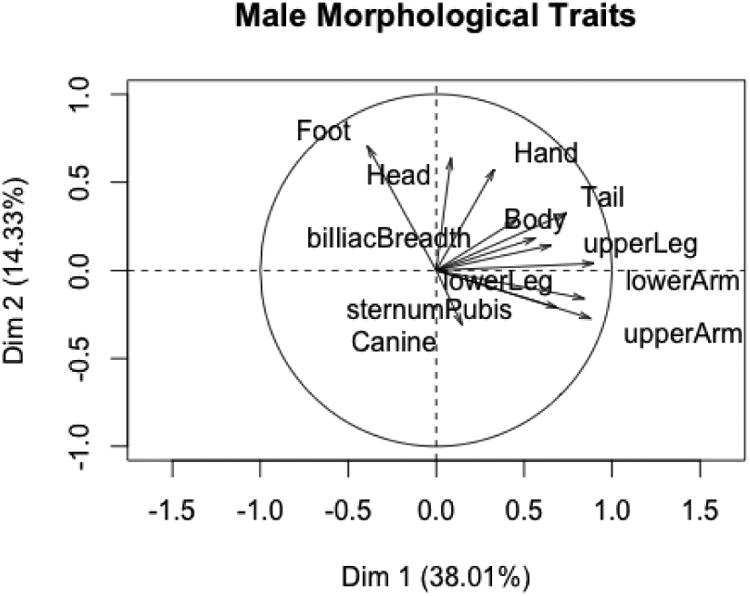
PC1 and PC2 for male morphological variables.
Figure 6.
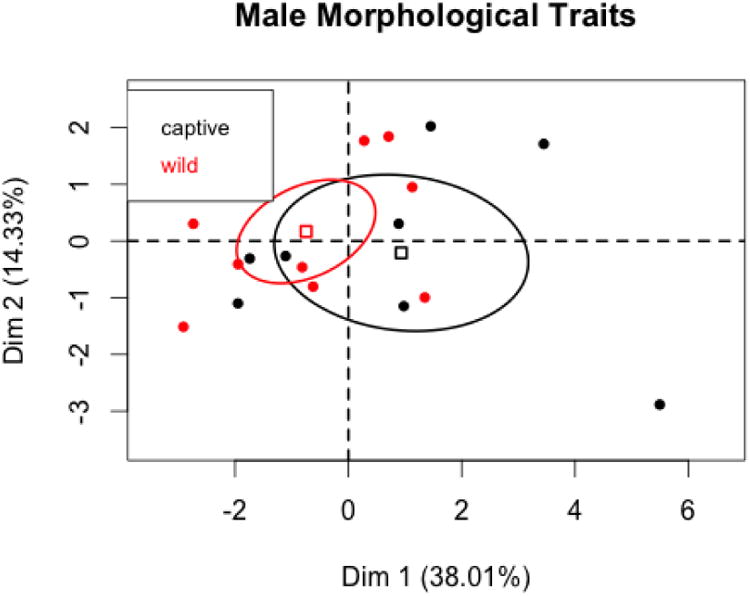
PC1 and PC2 coordinates for male morphological variables with 95% confidence ellipses for captive and wild states.
To compare results with female condition variables, we first ran PCA on male condition variables omitting testes volume. There were eleven captive and 25 wild males in the analysis (Figures 7 and 8) and the first two PC accounted for about 75% of the variation in the variables. The results paralleled those obtained from females, with captive males being significantly larger than wild males. As with the females, all six t-tests for the individual condition variables were statistically significant. There were no differences between captive and wild males on the second or third principal components.
Figure 7.
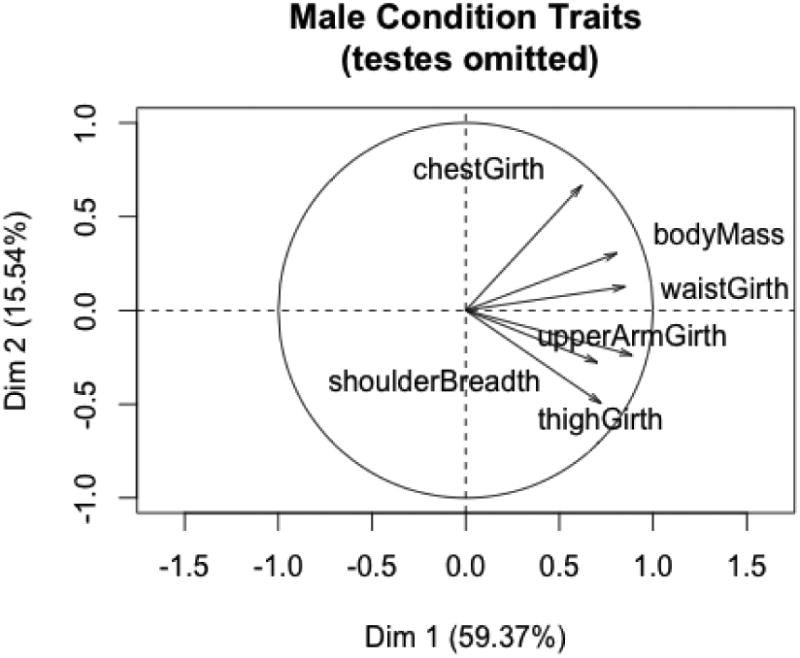
PC1 and PC2 for male condition variables (with testes omitted).
Figure 8.
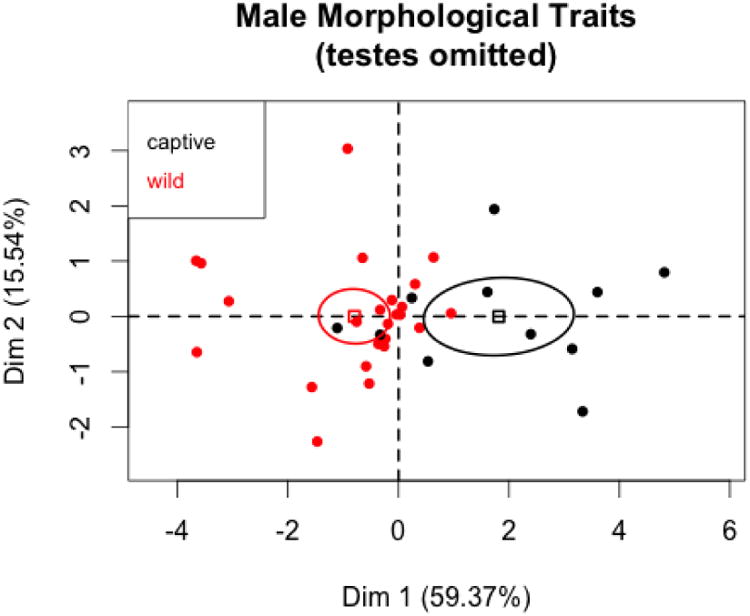
PC1 and PC2 coordinates for male condition variables (testes omitted) with 95% confidence ellipses for captive and wild states.
Adding testes volume to the male condition variable suite reduced our sample size to 11 captive and 12 wild males. The first two PCs explain about 72% of the variance and wild and captive males again differ only on the first PC. While the correlation of testes volume with the first PC is statistically significant, it is lower than the correlation of the other six variables. A t test shows that captive and wild males differ in testes volume.
Discussion
All measures of adult body mass and condition were greater in captive animals than in animals in the wild, although morphological measures that indicate length such as body length, leg length and arm length were not statistically different between animals in the wild and in captivity. Since all measures were taken during the same week, differences between animals in captivity and animals in the wild cannot be linked to differences in season or climate. The main difference between these two groups of animals was the presence of a consistent, available food resource. Animals in captivity are routinely provisioned and do not need to expend energy to search for food. Since food is readily available to all animals in captivity, any differences in feeding competition such as priority of access to food due to social factors such as rank would not exist. In addition, stresses associated with the search for food are also eliminated. Some troops of wild living vervets in St. Kitts do have access to human food through crop raiding. There are, however, stresses associated with crop raiding in St. Kitts, as farmers are diligent about keeping animals away from their crops. Even when animals do feed on crops, they consume only a small portion of the stolen fruit (Dore, 2013). While crop raiding may supplement the diet of wild vervets, it does not provide the same consistency of resources as does captivity.
These same kinds of differences—in mass and weight and not in length and morphological measures were also observed in a series of wild populations in Kenya where some groups of animals were exposed to human food while other populations were not (Turner et al., 1997). In this case, animals with access to human food were heavier than those without access. The current study indicates that captivity would only enhance the difference between wild, crop raiding and captive animals with captive animals being heaviest.
Increase in girth is often associated with an increase in condition (Rutenberg et al., 1987). This increase would suggest that larger, better-fed animals could reproduce more consistently than animals less well fed and in poorer condition. In a study of wild vervet monkeys in Kenya, the lower ranking vervet monkeys, who did not have priority of access to food resources did not reproduce yearly while higher-ranking animals did (Turner et al., 1987). Since females were housed separately from males in captivity in St. Kitts we were not able to test whether indicators of condition translated into greater reproductive success in these groups.
Our principal components analyses suggest while compared to wild vervets, both males and females become heavier in captivity, there is not a sex difference in the patterning of the weight gain in these animals. Life history theory should lead us to expect that males and females might apportion nutritional resources to body growth differently. Our failure to find such a sex difference requires further investigation. It may be that sex differences in morphological or condition variables will be seen only when examining infants or juveniles raised in different nutritional conditions. Another possibility is that there are species differences in this area and that vervets do not exhibit sex differences in adulthood.
Conclusions
Consistent and abundant food resources available in captivity lead to significant difference in mass and measures associated with condition between animals in the wild and in captive situations. Consistent, high quality food available without the stresses of rank related feeding competition or crop raiding led to differences in condition. In addition, activity levels in the wild differ markedly from those in captivity. In the wild, these condition differences would likely havean effect on reproductive parameters. These results do indicate that caution must be observed when utilizing captive animals for an examination of life history variables. It has long been established that growth and development trajectories differ between wild and captive animals. There has been little evidence to date of differences in adult body size between wild and captive adult animals. Our results confirm that these differences do exist in a situation where several variables, including genetic history, seasonality and climate are kept constant and that these differences must be recognized when using captive animals as a proxy for animal is the wild.
Acknowledgments
We are very grateful to Dr. Eugene Redmond and the staff of the St Kitts Biomedical Research Foundation who worked with us while we were conducting this research. We acknowledge with gratitude the help of and discussion with Dr. Rafael Rodriguez of the University of Wisconsin-Milwaukee. We are also grateful to Yoon Jung, project manager for this collection. The comments of anonymous reviewers are gratefully acknowledged. This research was funded by NIH RR016300/OD010980 to Dr. Nelson Freimer, UCLA.
Footnotes
Compliance with Ethical Standards: All applicable international, national and/or institution guidelines for the care and use of animals were followed. All procedures performed in studies involving animals were in accordance with the ethical standards of the institution or practice at which the studies were conducted. Protocols were approved by the Animal Research Committee at UCLA; Protocol 2009-053-02A and the IACUC of the St. Kitts Research Foundation.
References
- Altmann J, Altmann SA, Hausfater G. Physical maturity and age estimates of yellow baboons, Papio cynocephalus, in Amboseli National Park, Kenya. Am J Primatol. 1981;1:389–399. doi: 10.1002/ajp.1350010404. [DOI] [PubMed] [Google Scholar]
- Altmann J, Schoeller D, Altmann SA, Muruthi P, Sapolsky RM. Body size and fatness of free-living baboons reflect food availability and activity levels. Am J Primatol. 1993;30:149–161. doi: 10.1002/ajp.1350300207. [DOI] [PubMed] [Google Scholar]
- Bloomquist GE, Turnquist JE. Selection on adult female body size in rhesus macaques. J human Evol. 2011;60:677–683. doi: 10.1016/j.jhevol.2010.05.010. [DOI] [PubMed] [Google Scholar]
- Bolter DR, Zihlman AL. Morphometric analysis of growth and development in wild-collected vervet monkeys (Cercopithecus aethiops), with implications for growth patterns in Old World monkeys, apes and humans. J Zool Lond. 2003;260:99–110. [Google Scholar]
- Bolter DR, Zihlman AL. Brief communication: Dental development timing in captive Pan paniscus with comparison to Pan troglodytes. Am J phys Anthrop. 2011;145:647–652. doi: 10.1002/ajpa.21517. [DOI] [PubMed] [Google Scholar]
- Bones and Behavior Working Group. http://www.bonesandbehavior.org.
- Cheney DL, Seyfarth RM, Andelman SJ, Lee PC. Reproductive success in vervet monkeys. In: Clutton Brock TH, editor. Reproductive success: Studies of individual variation in contrasting breeding systems. University of Chicago Press; Chicago, IL: 1988. pp. 384–402. [Google Scholar]
- Cheverud JM, Wilson P, Dittus WPJ. Primate population studies at Polonnaruwa. III. Somatometric growth in a natural population of toque macaques (Macaca sinica) J human Evol. 1992;23:51–77. doi: 10.1002/ajp.1350270209. [DOI] [PubMed] [Google Scholar]
- Cramer JD, Gaetano TJ, Gray JP, Grobler JP, Lorenz J, Freimer N, Schmitt CA, Turner TR. Variation in scrotal color among widely distributed vervet monkey populations (Chlorocebus aethiops pygerythrus and C. a. sabaeus) Am J Primatol. 2013;75:752–762. doi: 10.1002/ajp.22156. [DOI] [PubMed] [Google Scholar]
- Dore KM. Unpublished PhD dissertation. UWM; 2013. An anthropological investigation of the dynamic human-vervet monkey (Chlorocebus aethiops sabaeus) interface in St. Kitts, West Indies. [Google Scholar]
- Erwin F, Palmour R. (Anonymous) International perspectives for the future of non-human primate resources, April 17-19, 2002, Bogor, Indonesia. National Academic Press; Washington DC: 2003. Primates for 20th century biomedicine: The St. Kitts vervet (Chlorocebus aethiops sabaeus SK) pp. 49–53. [Google Scholar]
- Garcia C, Lee PC, Rosetts L. Growth in colony living Anubis baboon infants and its relationship with maternal activity budgets and reproductive status. Am J phys Anthrop. 2009;138:123–135. doi: 10.1002/ajpa.20909. [DOI] [PubMed] [Google Scholar]
- Hamada Y, Udono T. Longitudinal analysis of length growth in chimpanzee (Pan troglodytes) Am J phys Anthrop. 2002;118:268–284. doi: 10.1002/ajpa.10078. [DOI] [PubMed] [Google Scholar]
- Harvey NC, Clarke AS, Lindburg DG. Brief Communication: Morphometric data for adult lion-tailed macaques (Macaca silenus) Am J phys Anthrop. 1991;85:233–236. doi: 10.1002/ajpa.1330850212. [DOI] [PubMed] [Google Scholar]
- Husson F, Lě S, Pagès J. Exploratory Multivariate Analysis by Example using R 2011 [Google Scholar]
- Husson F, Josse J, Lě S, Mazet J. FactoMineR: Multivariate Exploratory Data Analysis and Data Mining. R package version 1.29. 2015 http://CRAN.R-project.org/package=FactoMineR.
- Jasinska AJ, Schmitt CA, Service SK, Cantor RM, Dewar K, Jentsch JD, Kaplan JR, Turner TR, Warren WC, Weinstock GM, Woods RP, Freimer NB. Systems biology of the vervet monkey. ILAR Journal. 2013;54:122–143. doi: 10.1093/ilar/ilt049. [DOI] [PMC free article] [PubMed] [Google Scholar]
- Lě S, Josse J, Husson F. FactoMineR: An R package for multivariate analysis. J Stat Software. 2008;25(1):1–18. [Google Scholar]
- Phillips-Conroy JE, Jolly CJ. Dental eruption schedules of wild and captive baboons. Am J Primatol. 1988;15:17–29. doi: 10.1002/ajp.1350150104. [DOI] [PubMed] [Google Scholar]
- Pusey AE, Oehlert GW, Williams JM, Goodall J. Influence of ecological and social factors on body mass of wild chimpanzees. Int J Primatol. 2005;26:3–31. [Google Scholar]
- R Core Team. R: A language and environment for statistical computing. R Foundation for Statistical Computing; Vienna, Austria: 2014. URL http://www.R-project.org/ [Google Scholar]
- Rodriguez R, Cramer JD, Schmitt CA, Gaetano TJ, Grobler JP, Freimer NB, Turner TR. The static allometry of sexual and non-sexual traits in vervet monkeys. Biol J Linn Soc. 2015;114(3):527–537. doi: 10.1111/bij.12440. [DOI] [PMC free article] [PubMed] [Google Scholar]
- Rutenberg GW, Coelho AM, Lewis DS, Carey KD, McGill HC. Body composition in baboons: Evaluating a morphometric method. Am J Primatol. 1987;12:275–285. doi: 10.1002/ajp.1350120305. [DOI] [PubMed] [Google Scholar]
- Sailer LD, Gaulin SJC, Boster JS, Kurland JA. Measuring the relationship between dietary quality and body size in primates. Primates. 1985;26:14–27. [Google Scholar]
- Schoonaert K, D'Aout K, Aeerts P. Morphometrics and inertial properties in the body segments of chimpanzees (Pan troglodytes) J Anat. 2007;210:518–531. doi: 10.1111/j.1469-7580.2007.00720.x. [DOI] [PMC free article] [PubMed] [Google Scholar]
- Setchell JM, Lee PC, Wickings J, Dixon AF. Growth and ontogeny of sexual size dimorphism in the mandrill (Mandrillus sphinx) Am J phys Anthrop. 2001;115:349–360. doi: 10.1002/ajpa.1091. [DOI] [PubMed] [Google Scholar]
- Sigg H, Stolba A, Abegglen JJ, Dasser V. Life history of hamadryas baboons: physical development, infant mortality, reproductive parameters and family relationships. Primates. 1982;23:473–487. [Google Scholar]
- Strum SC. Weight and age in wild olive baboons. Am J Primatol. 1991;25:219–237. doi: 10.1002/ajp.1350250403. [DOI] [PubMed] [Google Scholar]
- Turner TR, Schmitt CA, Cramer JD, Lorenz J, Grobler JP, Freimer NB. Comparative developmental morphology within the genus Chlorocebus. Am J phys Anthrop. 2014;153:S58. doi: 10.1002/ajpa.23459. [DOI] [PMC free article] [PubMed] [Google Scholar]
- Turner TR, Whitten PL, Jolly CJ, Else JE. Pregnancy outcomes in free-ranging vervet monkeys: A preliminary report. Am J Primatol. 1987;12:197–203. doi: 10.1002/ajp.1350120207. [DOI] [PubMed] [Google Scholar]
- Turner TR, Anapol F, Jolly CJ. Growth, development and sexual dimorphism in vervet monkeys (Cercopithecus aethiops) at four sites in Kenya. Am J phys Anthrop. 1997;103:17–29. doi: 10.1002/(SICI)1096-8644(199705)103:1<19::AID-AJPA3>3.0.CO;2-8. [DOI] [PubMed] [Google Scholar]
- Uehara S, Nishida T. Body weights of wild chimpanzees (Pan troglodytes schweinfurthii) of the Mahale Mountains National Park, Tanzania. Am J phys Anthrop. 1987;72:315–321. doi: 10.1002/ajpa.1330720305. [DOI] [PubMed] [Google Scholar]
- Zihlman AL, Bolter DR, Boesch C. Skeletal and dental development in wild chimpanzees from Tai National Forest, Ivory Coast and Gombe Reserve, Tanzania. Am J phys Anthrop. 2004;123 S38:215. [Google Scholar]
- Zihlman AL, Bolter DR, Boesch C. Skeletal and dental growth and development in chimpanzees of the Tai National Park, Cote D'Ivoire. J Zool. 2007;273:63–73. [Google Scholar]


