Significance
The ability to resist impulsive responses matures late in life, after puberty. This longitudinal study of the prefrontal cortex in monkeys shows that behavioral response inhibition improves not because the adult prefrontal cortex is better able to inhibit the effects of a prepotent stimulus but rather because it can more readily form an alternative plan of action. The finding is revealing about the nature of cognitive maturation and the conditions in which it is impaired that have clinical and social implications.
Keywords: prefrontal, antisaccade, monkey, neurophysiology, adolescence
Abstract
Executive functions including behavioral response inhibition mature after puberty, in tandem with structural changes in the prefrontal cortex. Little is known about how activity of prefrontal neurons relates to this profound cognitive development. To examine this, we tracked neuronal responses of the prefrontal cortex in monkeys as they transitioned from puberty into adulthood and compared activity at different developmental stages. Performance of the antisaccade task greatly improved in this period. Among neural mechanisms that could facilitate it, reduction of stimulus-driven activity, increased saccadic activity, or enhanced representation of the opposing goal location, only the latter was evident in adulthood. Greatly accentuated in adults, this neural correlate of vector inversion may be a prerequisite to the formation of a motor plan to look away from the stimulus. Our results suggest that the prefrontal mechanisms that underlie mature performance on the antisaccade task are more strongly associated with forming an alternative plan of action than with suppressing the neural impact of the prepotent stimulus.
Behavioral response inhibition, and cognitive task performance more generally, improves substantially between the time of puberty and adulthood (1–4). Risky decision-making peaks in adolescence, the time period between puberty and adulthood that is most closely linked to delinquent behavior in humans (5–7). Performance in tasks that assay response inhibition, such as the antisaccade task, improves into adulthood, reflecting the progressive development of behavioral control (3). This period of cognitive enhancement parallels the maturation of the prefrontal cortex (8–11). Anatomical changes in the prefrontal cortex continue during adolescence, involving gray and white matter volumes and myelination of axon fibers within the prefrontal cortex and between the prefrontal cortex and other areas (8–15). Changes in prefrontal activation, including increases (12, 16–20) and decreases (21, 22), have been documented in imaging studies for tasks that require inhibition of prepotent behavioral responses and filtering of distractors.
Much less is known about how the physiological properties of prefrontal neurons develop after puberty. Similar to the human pattern of development, the monkey prefrontal cortex undergoes anatomical maturation in adolescence and early adulthood (23, 24). Male monkeys enter puberty at ∼3.5 y of age and reach full sexual maturity at 5 y, approximately equivalent to the human ages of 11 y and 16 y, respectively (25, 26). By some accounts, biochemical and anatomical changes characteristic of adolescence in humans occur at an earlier, prepubertal age in the monkey prefrontal cortex (27, 28), so it is not known if cognitive maturation or neurophysiological changes occur in monkeys after puberty. The contribution of prefrontal cortex to antisaccade performance has also been a matter of debate, with contrasting views favoring mechanisms of inhibiting movement toward the visual stimulus or enhancing movement away from it (29–31). Potential maturation of behavioral response inhibition may therefore be associated with a more efficient suppression of the stimulus representation in neural activity (weaker visual responses to stimuli inside the receptive field), stronger motor responses (higher activity to saccades), or enhancement of the appropriate goal representation (stronger activity for planning a saccade away from the stimulus). To examine the mechanisms that facilitate the mature ability to resist generating a response toward a salient stimulus, we used developmental markers to track transition from puberty to adulthood in monkeys and sought to identify neural correlates of changes in antisaccade performance within the visual and saccade-related activations of prefrontal neurons.
Results
Developmental Profiles.
Four male macaque monkeys (Macaca mulatta) were used in this study. Times of puberty and full sexual maturity can vary considerably between individuals, so we used morphometric, radiographic, and hormonal measures to determine the onset of puberty in each (SI Materials and Methods). Behavioral and neural experiments were performed at two stages of development: after the onset of puberty and in adulthood.
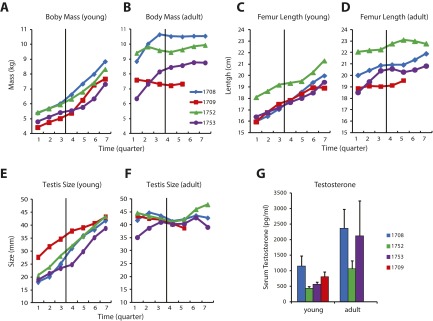
Measures such as body mass, femur length, and testis size were all rapidly increasing at the first stage of experiments, consistent with individuals in a growth trajectory (Fig. S1). Canines had not erupted in three of four monkeys, and epiphyseal plates of extremities were open in all four, also signs of continued growth. We refer to this as the “young” stage. Initial behavioral training was performed around this time, and neurophysiological recordings were obtained beginning at a median age of 4.3 y (last measurement before the onset of neurophysiological recordings; range, 4.0–5.2 y). Recordings lasted one to two quarters of a year. After that time period, recordings ceased for ∼1 y, a period during which the monkeys received no further exposure to the task or training of any kind. They remained housed in the same animal colony.
Fig. S1.
Developmental profile. (A) Body mass of each monkey depicted as a function of time (in quarters of a year) in the young stage. Data are aligned to the onset of recordings (vertical line). Data shown have been filtered with a three-point, triangular filter. (B) Body mass for the same subjects, now aligned relative to the onset of recording in the adult stage. (C and D) Femur length, presented in the same fashion as in A and B. (E and F) Testis size (length of longer dimension), presented in the same fashion as in A and B. (G) Serum testosterone concentration. Average values (and SEM) of three measurements around the onset of recordings in the young and adult stages are shown.
The monkeys were then briefly reintroduced to the behavioral tasks, and a second round of recordings was obtained. The median age of animals at the onset of the second stage of experiments was 6.3 y (range, 5.6–7.3 y; range of intervals from young stage, 1.6–2.1 y). We refer to this as the “adult” stage. Morphometric measures had plateaued at the time of recordings in the adult stage (Fig. S1 B, D, and F), as expected of mature adults. Serum testosterone level, which fluctuates hourly and is therefore a less reliable indicator, was nevertheless also higher around the time of the adult-stage recordings compared with that of the young stage (Fig. S1G).
Behavioral Performance.
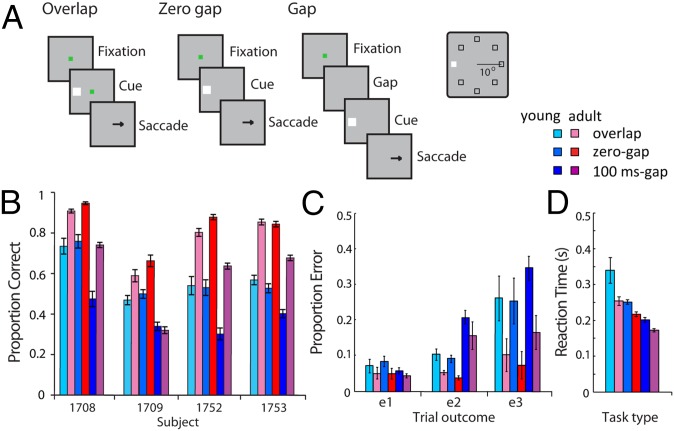
The antisaccade task (32) requires an eye movement to a location diametrically opposed to a salient visual cue, and we observed performance on this task to improve significantly between the time of puberty and adulthood (Fig. 1). We assessed performance for three temporal variants of the antisaccade task: the “overlap” variant (Fig. 1A, Left), in which the visual cue and fixation point overlapped for 100 ms before both turning off; the “zero-gap” variant (Fig. 1A, Middle), in which onset of the visual cue and offset of the fixation point occurred simultaneously; and the “gap” variant (Fig. 1A, Right), in which the visual cue was presented 100 or 200 ms after the fixation point was extinguished. The latter represented the most difficult condition, as no fixation point was present to hold the gaze at the time of stimulus onset. We manipulated the gap in this fashion because we did not know at the outset of the experiments if behavioral improvements would only be evident for the most difficult conditions of the task. Additionally, the cue could appear at any of eight locations in these experiments (rather than two locations often used in antisaccade paradigms; Fig. 1A, Inset), again making the task more difficult for the animals. On average, asymptotic performance in the young stage was 56.6% correct for the overlap variant of the task (chance performance corresponds to 12.5%). When the same animals were tested in the adult stage, performance improved to an average of 79.6% correct responses (Fig. 1B). Similar improvements were observed for the zero-gap and gap variants (Fig. 1B). The effect of developmental stage was highly significant (three-way ANOVA of performance with factors young/adult stage, task variant, and individual monkey, F1,912 = 545.6; P < 10−10). The improvement was evident across task variants; no significant interaction was present between the young/adult stage factor and task variant (F2,912 = 1.96; P > 0.1). On the contrary, a significant three-way interaction was present between the young/adult stage, task variant, and individual monkeys (F6,912 = 2.95; P < 0.01), suggestive of individual differences in maturation.
Fig. 1.
(A) Sequence of events in the antisaccade task. (Left) Overlap variant: the cue and fixation point overlap for 100 ms before they both turn off and signal the requirement for a saccade away from the cue. (Middle) Zero-gap variant: the fixation point turns off simultaneously with the cue. (Right) The 100-ms gap variant: the fixation point turns off, and after a 100-ms gap, the cue appears. (Inset) Possible locations of the target in the screen. (B) Individual performance in the antisaccade task. Mean performance (and SEM) is shown for each monkey (n = 134 sessions for young, n = 179 for adult). (C) Proportions of trials that ended in different types of errors (e1–e3) for each task variant. Histograms represent means of all sessions during which recordings were obtained. Error bars represent SEM across individual monkeys. (D) Mean value of reaction time in correct trials, defined as the interval between the cue presentation and onset of the saccade. Error bars represent SEM across monkeys.
From the perspective of the saccade endpoint alone, most of the adult-stage improvement could be attributed to a reduced propensity to look directly toward the visual cue, or to a location other than the visual cue or the correct antisaccade goal, which are “e2” and “e3” error types, respectively (Fig. 1C). Young animals were also more likely to commit a less commonly observed nonspatial error of failing to maintain gaze for sufficient duration on the antisaccade goal (Fig. 1C, e1).
Performance on the antisaccade task may have improved in adulthood via at least two mechanisms (not mutually exclusive). First, monkeys may have delayed their responses to have more time to view the cue and plan the saccade. The benefit of longer reaction times can be demonstrated by the lower performance in task conditions associated with shorter reaction times (Fig. 1 C and D). Alternatively, the adult-stage performance gains could have been the result of an increase in the speed at which the antisaccade planning was carried out. Our findings (Fig. 1D) were more consistent with the latter explanation, as reaction times were significantly reduced in adulthood, across all task conditions (three-way ANOVA, F1,30442 = 1,413.6; P < 10−10). A significant three-way interaction was present between the young/adult stage, task variant, and individual monkeys (F6,30442 = 82.04; P < 10−10), suggesting different patterns of reaction time improvement across tasks for individual animals.
Overview of Neuronal Activity in the Antisaccade Task.
Neuronal responses recorded during these tasks allowed us to determine the nature of activity changes associated with cognitive development after the onset of puberty. We recorded a total of 607 neurons from areas 8a and 46 of the dorsolateral prefrontal cortex (Fig. 2A) in the young stage (33, 133, 158, and 283 neurons from the four monkeys, respectively). We subsequently recorded from 830 neurons in the adult stage from the same monkeys (133, 41, 238, and 418, respectively). To perform a comparison of responses in the antisaccade task when the stimulus appeared in the receptive field and outside it, we distinguished between three categories of neurons: those with visual responses, those with perisaccadic responses (referred to hereafter as “motor” neurons for brevity, even though we did not have direct evidence of influence of these neurons onto eye movements), and those with visuomotor responses. We identified neurons that responded significantly to at least one task epoch of the oculomotor delayed response (ODR) task compared with baseline activity (paired t test, P < 0.05). A total of 364 neurons in the young stage and 444 neurons in adult stage were thus selected. The overall pattern of activity did not differ appreciably if we included all neurons recorded in the antisaccade task, breaking down responses based on the ipsilateral and contralateral field (SI Text).
Fig. 2.
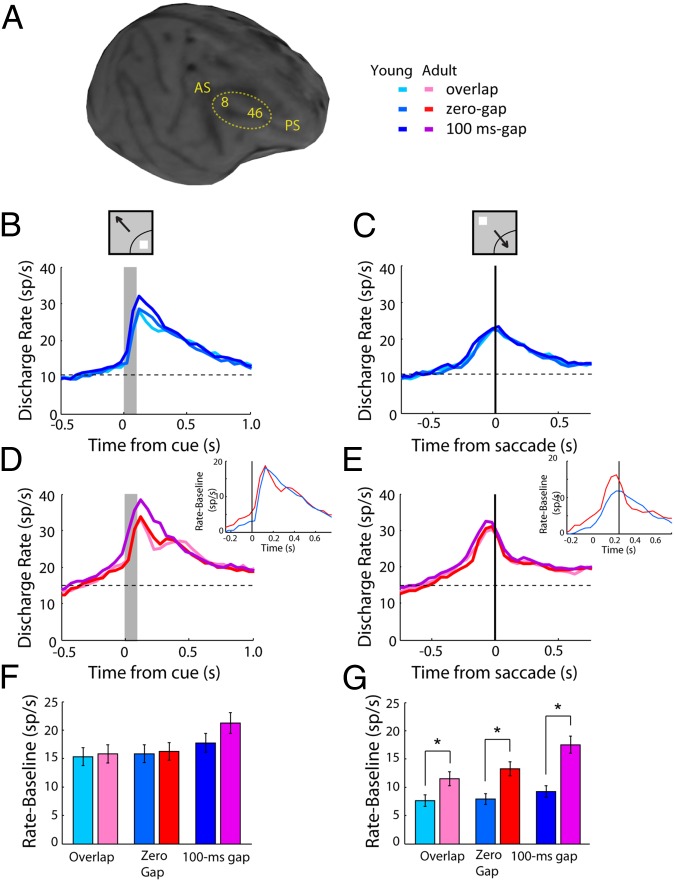
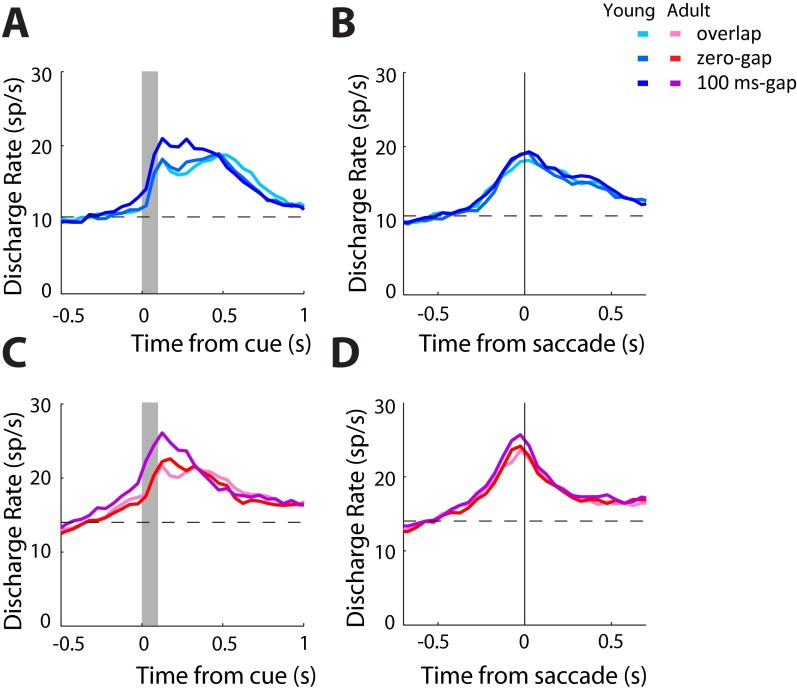
(A) MRI image of one young monkey with areas of recording indicated. (B) Average population peristimulus time histogram for neurons recorded during the three variants of the antisaccade task in the young stage (n = 364) when a stimulus appeared in the receptive field. Activity is synchronized to the cue (gray bar). (Insets) Schematic illustration of the stimulus and saccade location relative to the receptive field (arc), which varied for each neuron. (C) As in B, for a stimulus appearing away from the receptive field, requiring an eye movement toward it. Activity is synchronized to the onset of the saccade (vertical line). (D and E) As in B and C, for neurons recorded in the adult stage (n = 444). (Insets) Average discharge rate minus baseline rate for the zero-gap condition, plotted in the same axes for the young and adult stages. (F) Average activity during the stimulus presentation in the receptive field, after subtracting the baseline firing rate, from neurons recorded in sessions matched for behavioral performance (n = 89 for the young, n = 118 for the adult stage). (G) As in F, for stimulus presentation out of the receptive field.
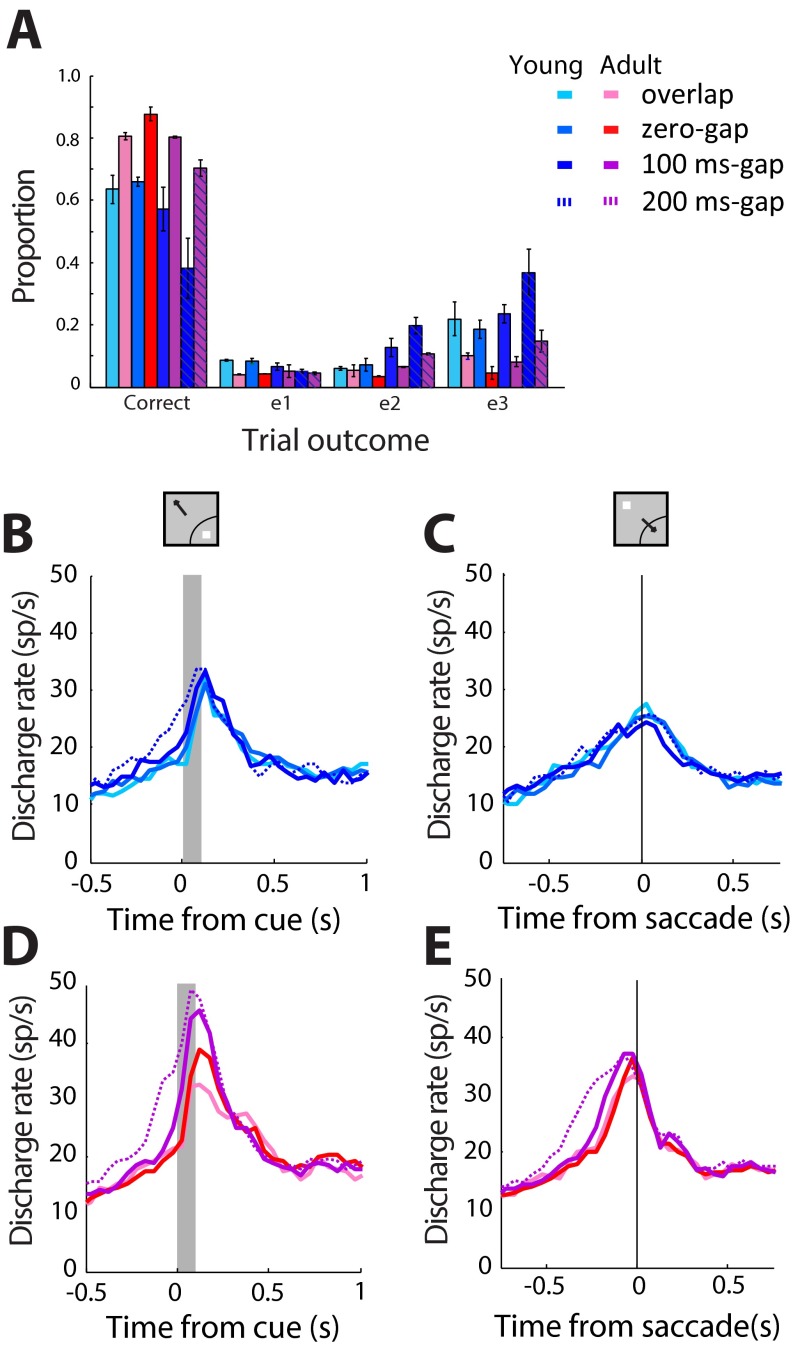
Neural activity recorded during correct trials is shown in Fig. 2 B–E. At the young and adult stages, when the stimulus appeared in the receptive field, activity was highest for the most difficult condition, the gap condition (Fig. 2 B and D). In other words, increased activation elicited by the stimulus was associated with difficulty in making a correct saccade away from it. When the stimulus appeared out of the receptive field, activity appeared earlier for the gap condition, in which the fixation point turned off before the stimulus appearance, even though peak firing rate differed little between conditions synchronized to the saccade (Fig. 2 C and E). These effects were even more pronounced for the 200-ms gap variant for the two monkeys that were tested with it (Fig. S2).
Fig. S2.
Performance and neural activity in antisaccade task with 200-ms gap. (A) Proportions of trials that ended in different types of behavioral outcomes are shown for the variants of the antisaccade task, including the 200-ms gap, for monkeys tested with all variants. Conventions are the same as in Fig. 1B. (B) Average population peristimulus time histogram for neurons that responded to the visual stimulus, recorded during the antisaccade task in the young stage (n = 94 neurons from two monkeys). Responses are shown for a stimulus in the neuron’s receptive field, requiring an eye movement away from it. Four variants of the antisaccade task (overlap, zero-gap, 100-ms gap, 200-ms gap) are shown. Gray bar represents the interval of stimulus presentation. (Insets) Schematic illustration of stimulus location and direction of eye movement relative to the receptive field (arc), which varied for each neuron. (C) As in B, for a stimulus appearing away from the receptive field, requiring an eye movement toward it. (D and E) As in B and C, for the adult stage (n = 122 from two monkeys).
To determine the changes between stages, we compared activity in three time periods. Baseline firing rate, before the cue presentation, was significantly higher in the adult stage compared with the young stage (t test, t631 = 7.56; P < 10−12). Firing rate driven by the saccade in the receptive field (above the baseline) was also considerably higher in the adult (Fig. 2E, Inset). On the contrary, little difference was present between stages for firing rate following the cue in the receptive field, above the baseline (Fig. 2D, Inset).
Comparison Between Stages.
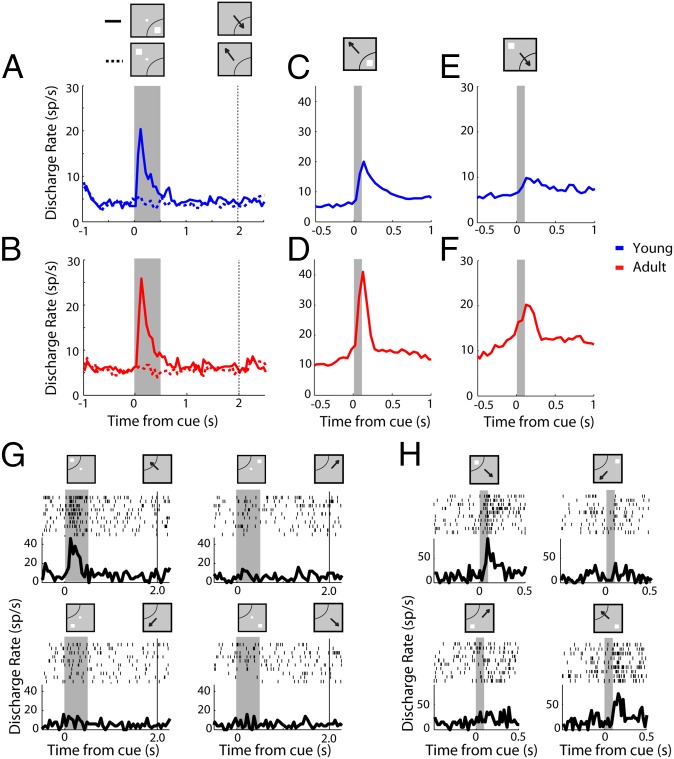
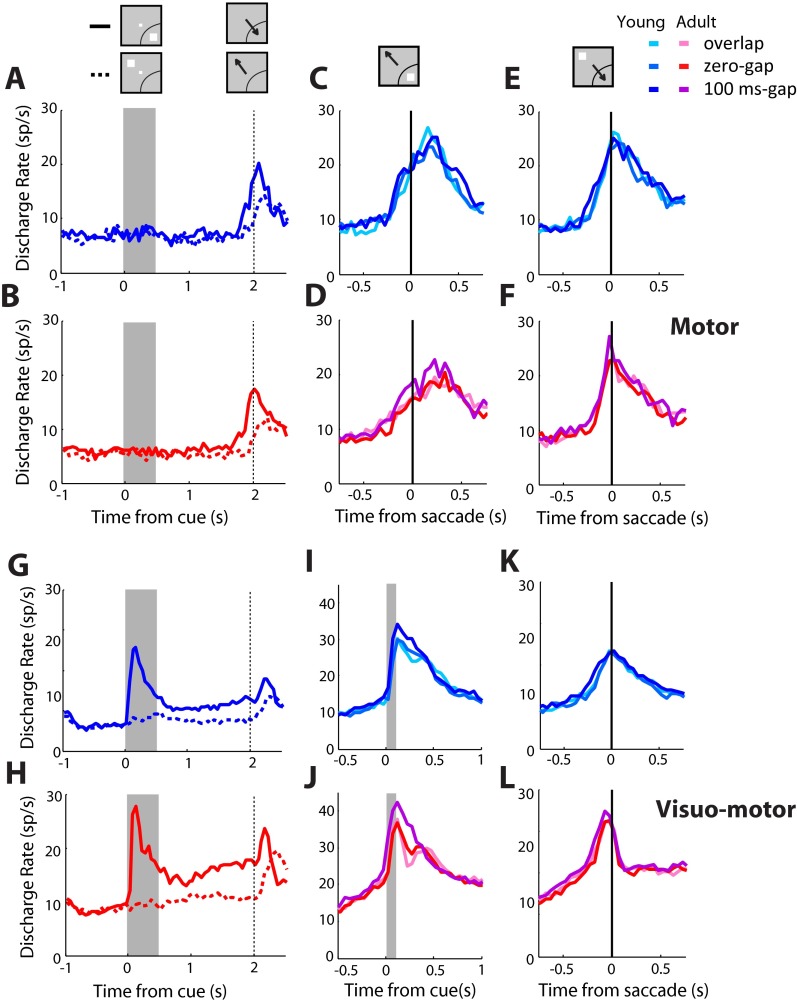
Differences between stages may be influenced by the mixture of response properties present in each population sample, so we examined activity separately for neurons with visual, motor, or visuomotor activity in the ODR task and well-defined receptive and motor fields that did not encompass the location diametric to the best response location (Fig. 3 and Fig. S3). Visual neurons selected in this fashion (n = 53 in the young stage, n = 38 in the adult) exhibited stimulus-driven activity in the antisaccade task that was increased in adulthood compared with the young stage (Fig. 3 C and D). Some of these neurons also exhibited elevated activity in the antisaccade task even without a stimulus in the receptive field (Fig. 3 G and H). Such activity would be expected by neurons mediating vector inversion, the planning of an eye movement away from the trigger stimulus (33). Importantly, across the population, this activity was significantly higher in the adult stage vs. the young stage (Fig. 3 E and F). A two-way ANOVA for firing rate elicited by the stimulus out of the receptive field after subtracting the baseline rate revealed a significant effect of stage (factors young/adult stage and task variants, F1,264 = 29.93 for stage; P < 10−6). In contrast to the dramatic changes observed in visual neurons, the activity of motor neurons was virtually identical between the young and adult stages (n = 55 in the young stage, n = 68 in the adult). Analysis of activity synchronized to the onset of the saccade (Fig. S3 E and F) revealed no significant difference in mean firing rate between stages (two-way ANOVA, F1,519 = 0.1 for main effect of stage; P > 0.7). Finally, activity of visuomotor neurons (n = 121 in the young stage, n = 188 in the adult) mirrored the changes of visual neurons, with an increase in firing rate for the stimulus (Fig. S3 I and J) and saccade in the receptive field (Fig. S3 K and L).
Fig. 3.
(A) Average population peristimulus time histogram for neurons with visual but no motor activity, tested with the ODR task in the young stage (n = 53). Activity is synchronized to the stimulus presentation (indicated as a gray bar). Dotted vertical bar represents the time point when the fixation point turns off, which cues the monkey to perform an eye movement. (B) As in A, for the adult stage (n = 38). (C and D) Activity for the same neurons as in A and B during the appearance of the stimulus in the receptive field in the antisaccade task. Responses from all antisaccade task variants have been averaged together. (E and F) Average activity for the same neurons as in A and B during the appearance of the stimulus out of the receptive field in the antisaccade task. (G) Rasters and peristimulus time histograms for a neuron with visual but no motor activity in the ODR task. The neuron responds only to a stimulus in the receptive field (Top Left). (H) Responses of the same neuron in the antisaccade task. The neuron responds strongly to a stimulus in its receptive field (Top Left), but also to a diametric stimulus that instructs an eye movement toward the receptive field (Bottom Right).
Fig. S3.
Activity of visual, motor, and visuomotor neurons. (A) Average population peristimulus time histogram for neurons with motor but not visual activity, tested with the ODR task in the young stage (n = 55). (B) As in A, for the adult stage (n = 68). (C–F) Average activity for the same neurons as in A and B in the antisaccade task. Activity is synchronized to the onset of the saccade (indicated as a vertical line). (G) Average population peristimulus time histogram in the ODR task for neurons that exhibited visual and motor-related activity in the young stage (n = 160). (H) As in G, for the adult stage (n = 215). (I–L) Average activity for the same neurons as in G and H in the antisaccade task. Activity is synchronized to the stimulus presentation in I and J and to onset of the saccade in K and L.
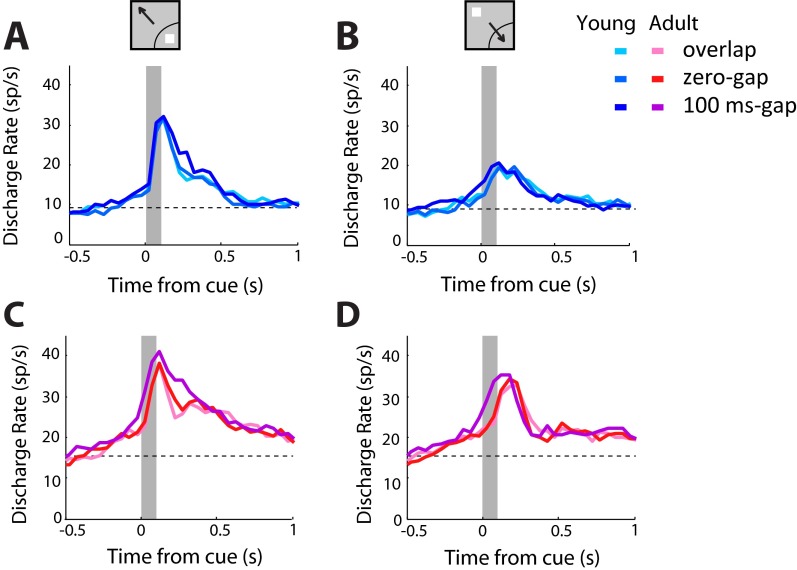
The observed differences in firing activity may be related not only to age but also to behavioral performance. To distinguish the impact of these factors, we modified the analysis in three ways. First, we excluded neurons with purely motor activity, which did not differ between stages. This yielded a sample of 309 neurons in the young stage and 324 neurons in the adult stage. Second, we compared firing rates between stages in sessions matched for behavioral performance by selecting neurons recorded in the highest young sessions and lowest adult ones. Performance in this subset of sessions was 71% for the young and 70% for the adult. Third, we subtracted the baseline firing rate from the activity recorded before the stimulus presentation. Mean firing rates computed in this manner were then compared by using a two-way ANOVA with factors young/adult stage and task variant (Fig. 2 F and G and Fig. S4). In the condition involving a stimulus out of the receptive field, requiring a saccade into the receptive field, the effect of stage was highly significant (F1,615 = 32.98; P < 10−7). A post hoc Tukey test confirmed a significant increase for each of the task variants (P < 0.05, P < 0.005, and P < 0.0005 for the overlap, zero-gap, and gap conditions, respectively; Fig. 2G). In contrast, when the stimulus appeared in the receptive field, there was no significant main effect of stage in the two-way ANOVA (F1,615 = 1.14; P > 0.2). These results identify changes in firing activity that are likely a result of maturation.
Fig. S4.
Neural activity in antisaccade sessions matched for behavioral performance. (A and B) Average population responses in sessions of the antisaccade task from three monkeys in the young stage, matched for behavioral performance with sessions in the adult stage (n = 89 neurons). Conditions are shown for stimulus in the receptive field (A) and out of the receptive field (B). (C and D) As in A and B, for responses of the same monkeys in the adult stage (n = 118 neurons).
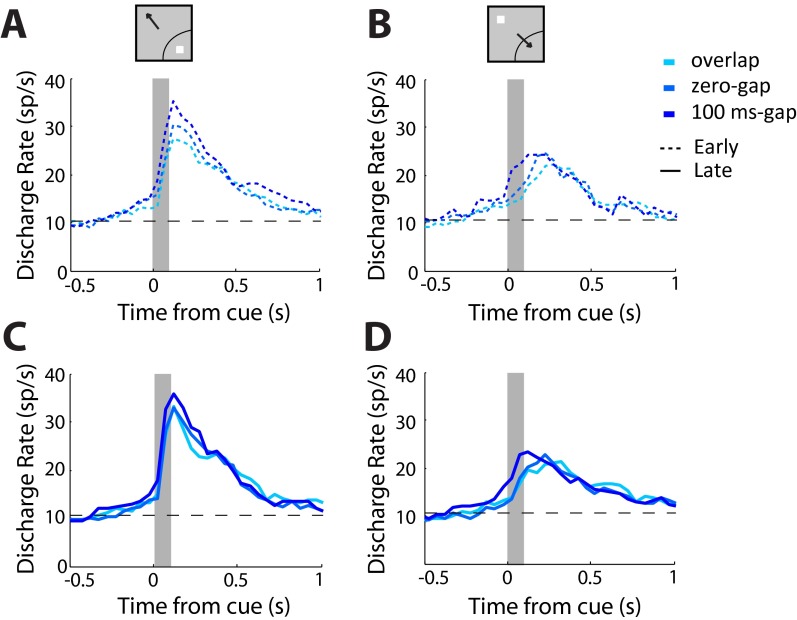
An important consideration for a longitudinal study of this sort is that differences between the young and adult monkeys may reflect the cumulative exposure to the task, rather than developmental stage itself. To test for this possibility, we separated sessions in the young stage between early and late phases of recordings, relying on a median split (Fig. S5). A two-way ANOVA revealed no significant differences in firing rate between early and late sessions for the condition involving the stimulus in the receptive (F1,743 = 2.62; P > 0.1) or for the saccade in the receptive field (F1,729 = 0.49; P > 0.4).
Fig. S5.
Neural activity in early and late recordings. (A) Average firing rate in each of the variants of the antisaccade task in the young stage, for correct trials in behavioral sessions that were recorded in the first half of sessions in three monkeys with sufficient recordings for this analysis. All responses involve the stimulus appearing in the receptive field (n = 102). (B) Average firing rate for the same neurons as in A, when the stimulus appeared away from the receptive field, requiring a saccade into the receptive field. (C) Average firing rate in the second half of sessions in the young stage. Average firing rate is shown for stimulus appearing in the receptive field (n = 146). (D) Average firing rate for the same neurons as in C when the stimulus appeared out of the receptive field.
Finally, we saw consistent results across individual monkeys. In two monkeys, we collected sufficient recordings in the young and adult stages to make possible a comparison in sessions matched for performance between stages (monkey 1752, young performance, 71%; adult performance, 69%; and monkey 1753, young performance, 69%; adult performance, 70%). In both monkeys, a significant increase in firing rate was present when the stimulus appeared out of the receptive field (two-way ANOVA, P < 0.01 and P < 10−7 for the two animals) but not when the stimulus appeared in the receptive field (P > 0.4 and P > 0.2, respectively).
Relationship Between Performance and Firing Rate.
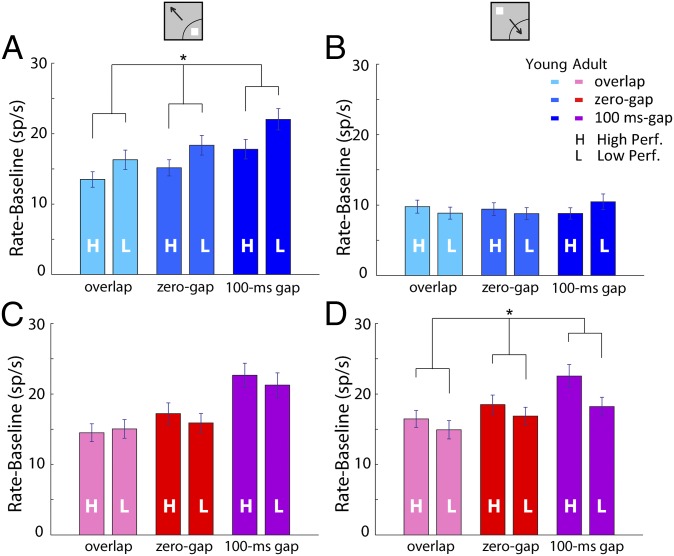
Task performance improved greatly between the young and adult stages, so it was important to identify aspects of activity associated with high and low levels of performance. We first examined the young stage by splitting the recording sessions down the median (Fig. 4 A and B). In the condition of a stimulus appearing in the receptive field (Fig. 4A), a two-way ANOVA of firing rate relative to baseline, with factors high/low performance and task variant, revealed a significant effect of performance (F1,921 = 9.92; P < 0.005). In contrast, we found no effect in the condition involving the saccade in the receptive field (F1,921 = 0.2; P > 0.9). The higher cue-driven activity in trials with lower performance is also consistent with the overall trend observed earlier between firing activity and task difficulty: when the stimulus was in the receptive field, higher activity was observed for the gap condition vs. the zero-gap and overlap conditions (Fig. 2).
Fig. 4.
(A) Average firing rate in each of the variants of the antisaccade task in the young stage for correct trials in behavioral sessions that exhibited above-average (labeled “H”, n = 153 neurons) or below-average performance (labeled “L”, n = 156 neurons). All responses involve the stimulus appearing in the receptive field. Asterisk indicates significant effect on two-way ANOVA. (B) Average firing rate for the same neurons as in A, when the stimulus appeared away from the receptive field. (C) Average firing rate in each of the variants of the antisaccade task in the adult stage for correct trials in behavioral sessions that exhibited above-average (n = 155) or below-average performance (n = 163). All responses involve the stimulus appearing in the receptive field. (D) Average firing rate for the same neurons as in C when the stimulus appeared away from the receptive field.
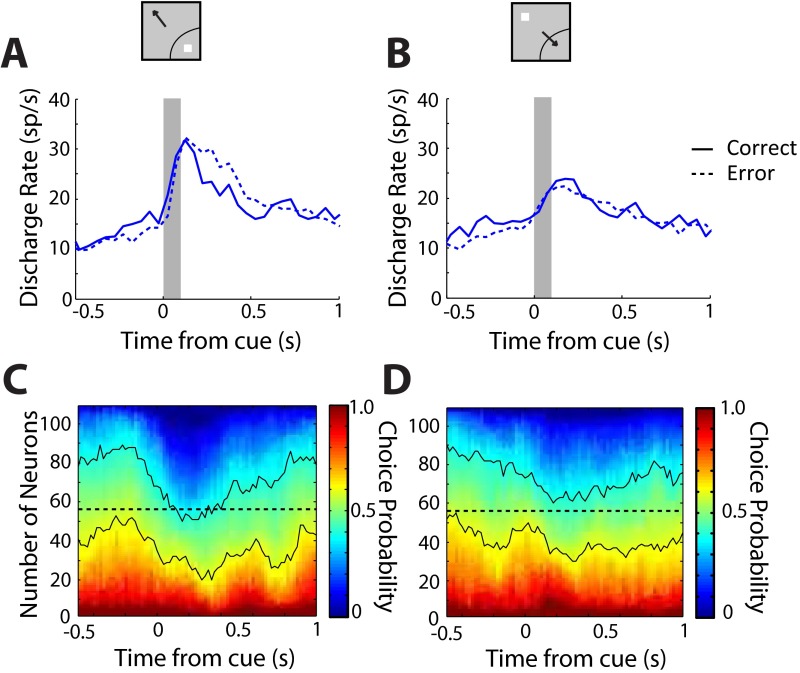
We reached the same conclusions when we analyzed error responses (Fig. S6), considering trials specifically involving incorrect saccades toward the stimulus (e2 errors). We identified neurons with such error trials in each of the spatial configurations involving a stimulus in the receptive field and saccade in the receptive field. In the condition requiring a saccade toward the receptive field (Fig. S6B), we found no significant difference between correct and error trials (paired t test, t107 = 0.15; P > 0.8). However, error trials were associated with increased activity in the condition involving a stimulus in the receptive field (paired t test, t107 = 2.62; P < 0.01). This difference between correct and incorrect responses was also evident when quantified with choice probability (SI Text) after the stimulus appeared in the receptive field (Fig. S6C). No equivalent differences were present for a saccade toward the receptive field (Fig. S6D). In other words, trials in which stimulus-driven activity was higher than average tended to result in errors (Fig. S6A).
Fig. S6.
Neural activity in error trials. (A) Average firing rate in correct (solid lines) and error trials (dotted lines) in the 100-ms gap condition in the young stage. Only e2 errors, specifically involving incorrect saccades toward the stimulus, are included. Average firing rate is shown for a stimulus appearing in the receptive field (n = 108). (B) Average firing rate for the same neurons as in A when the stimulus appeared out of the receptive field. (C) Each time bin represents cumulative distribution of choice probability values for all neurons with error trials in the young stage for the stimulus in the receptive field. Dotted horizontal line represents median population value of choice probability. Continuous black lines represent ROC values between 0.4 and 0.6. (D) As in C, for the stimulus out of the receptive field.
The difference in activity between low- and high-performance sessions displayed a qualitatively different pattern in the adult stage (Fig. 4 C and D). Adult high-performance sessions were now primarily characterized by increased responses in the condition involving the saccade into the receptive field (Fig. 4D). A two-way ANOVA of firing rate after subtracting the baseline with factors high/low performance and task type revealed a significant effect of performance (F1,948 = 10.7; P < 0.005). No significant effect of performance was now present for responses to the cue in the receptive field (two-way ANOVA, P > 0.5). Analysis of errors in the adult stage, in which a smaller sample of trials was available for direct comparison of the two conditions, was inconclusive; no significant difference was present for the condition with the stimulus in the receptive field (paired t test, t50 = 0.15; P > 0.8) or the condition with the stimulus out of the receptive field (paired t test, t50 = 0.85; P > 0.4).
These results suggest that sensory-driven and goal-related responses may contribute to variability in behavioral performance. Ultimately, the monkey’s choice is likely to be determined by the relative difference between these two representations. For this reason, we quantified the difference in activity evoked by the stimulus inside the receptive field vs. the stimulus outside by a receiver operating characteristic (ROC) analysis (Fig. 5). Values greater than 0.5 indicate higher activity for the stimulus inside the receptive field, and values lower than 0.5 indicate higher activity for the stimulus outside. This measure showed that the stimulus representation dominated early in the trial. In the young stage, ROC values peaked at 120 ms and then decreased toward 0.5 to signal a somewhat weaker representation of the visual stimulus (Fig. 5, blue curves). In the adult stage, the representation of the stimulus peaked at ∼90 ms (Fig. 5, red curves), a significantly earlier time point (evaluated with a bootstrap test at the α = 0.001 significance level). After that, the signal decreased sharply, and, in the overlap and zero-gap conditions, even dipped below the 0.5 value to signal a stronger representation of the goal relative to that of the stimulus (Fig. 5). The relative strength of the goal-related activation decreased with increasing task difficulty for both age groups (Fig. 5 A–C). This greater reversal in favor of the goal in correct trials was mediated mostly by the visual and visuomotor neurons (Fig. S7). For the motor neurons, little difference in the timing or peak (minimum) of the ROC curves was observed (Fig. S7B). Importantly, in error trials, reaction times occurred before this reversal, and no difference between young and adult groups was present (Fig. S8). These results show that the representation of the saccadic goal overcomes the stimulus-related signal earlier and more strongly in the adult monkeys than in the young monkeys.
Fig. 5.
(A) Area under ROC curve comparing the distribution of firing rates for the conditions with the stimulus in the receptive field and saccade in the receptive field in the overlap variant of the antisaccade task. Average ROC area values are shown for neurons in the young (n = 309) and adult stages (n = 324) in successive 100-ms windows, stepped every 10 ms, synchronized to the onset of the cue (time 0). Values greater than 0.5 are indicative of neurons generating a greater response for a stimulus in the receptive field; values lower than 0.5 indicate greater response for a saccade toward the receptive field. Vertical lines represent mean reaction times in the task. (B) Average ROC area values for the same neurons as in A in the zero-gap condition. (C) Average ROC area values in the 100-ms gap condition.
Fig. S7.
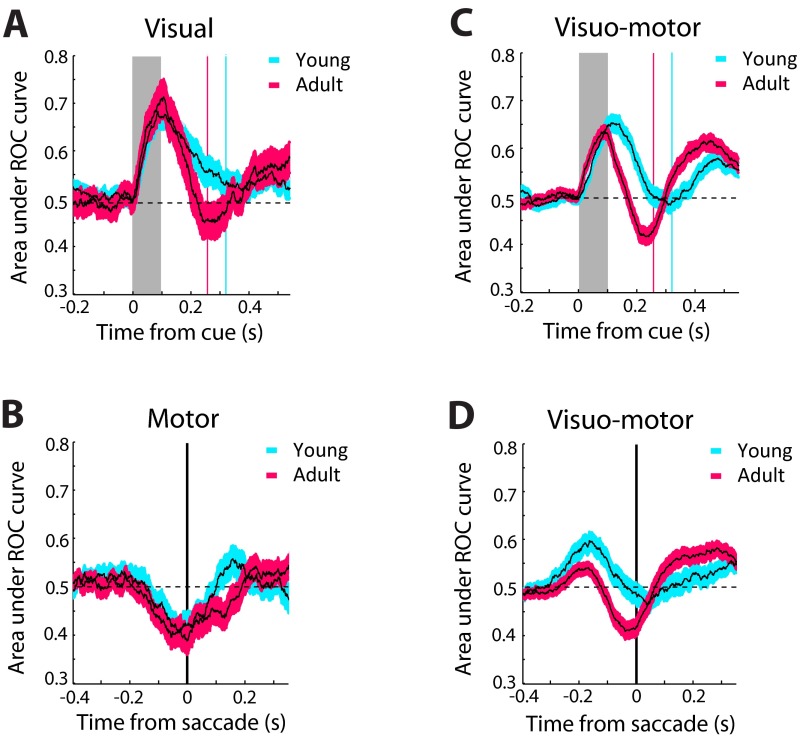
ROC analysis for visual and visuomotor neurons. (A) Area under ROC curve comparing the distribution of firing rates for the conditions with the stimulus in the receptive field and the saccade in the receptive field in the overlap variant of the antisaccade task. Average area under the ROC curve values are shown for neurons with pure visual responses in the young stage (n = 53) and adult stage (n = 38) in successive 100-ms windows, stepped every 10 ms, synchronized to the onset of the stimulus (gray bar). Blue and red vertical lines represent the mean times of saccade onset in this task. (B). Average area under the ROC curve values for neurons with purely motor responses in the young stage (n = 55) and adult stage (n = 68) in the overlap variant of the antisaccade task. Data are synchronized to the time of saccade onset (vertical line) (C). Average area under the ROC curve values for neurons that exhibited visual and motor-related activity in the young stage (n = 160) and the adult stage (n = 215) in the overlap variant of the antisaccade task. Data are synchronized to the onset of the stimulus (gray bar). (D). Area under the ROC curve for the same neurons as in C, now synchronized to the saccade.
Fig. S8.
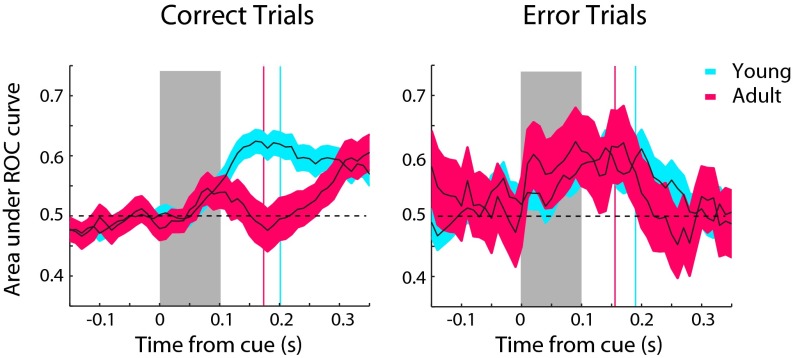
ROC analysis in correct and error trials. Area under ROC curve comparing the distribution of firing rates for the conditions with the stimulus in the receptive field and the saccade in the receptive field in the 100-ms gap variant of the antisaccade task. Average ROC area values are shown for neurons in the young stage (n = 110) and adult stage (n = 51) in successive 100-ms windows, stepped every 10 ms, synchronized to the onset of the cue (time 0). Values greater than 0.5 are indicative of neurons generating a greater response for a stimulus in the receptive field; values lower than 0.5 indicate greater response for a saccade toward the receptive field. Vertical lines represent mean reaction times in the task. Data are plotted from neurons with available error trials in each of the two conditions involving the cue appearing in the receptive field and out of the receptive field (Right). Only e2-type error trials are included here, involving an error toward the cue location. Correct trials from the same neurons are also shown (Left).
Discussion
Our findings demonstrate that cognitive development in nonhuman primates mirrors the progression of response inhibition observed in humans during adolescence (1, 2, 34). We relied on the antisaccade task, used widely in the human literature for its simplicity, as performance of the task does not require mastery of complex rules requiring extensive instruction but rather the ability to resist a prepotent stimulus and plan a movement away from it (3, 4, 35–37). Our longitudinal study was designed to track the same individuals at different stages to minimize interindividual variability, which is considerable around puberty (38). Inevitably, this means that our subjects had more experience in the task as adults. However, we should note that we allowed the monkeys to reach asymptotic performance before the onset of recordings and that experiments at each stage were separated by 1–1.5 y of no exposure to the task. No appreciable differences in neural activity were observed in early and late recordings in the young stage (Fig. S5), even though the 3–6-mo period of our recordings represents a significant period for monkey development during which a continuous improvement in performance would be expected. In contrast, prominent differences in firing rate were present between the young and adult stages when comparing across sessions equated for performance (Fig. 2 F and G and Fig. S4) and across behavioral outcomes (Fig. 4). This suggests that the observed changes in prefrontal activity between the young and adult stages were a result of developmental maturation. Our results, most importantly, revealed little evidence that the adult prefrontal cortex improves in its ability to suppress the effects of a prepotent stimulus; instead, it appears to form a stronger plan of action toward the appropriate goal, consistent with its broader functional role (39).
Response Inhibition in Adolescence.
Performance on the antisaccade task exhibits significant improvements in adolescence in humans (3, 4) and is impaired in childhood conditions such as attention deficit/hyperactivity disorder (35) and mental illnesses such as schizophrenia, which typically manifest in early adulthood (36, 37). Young monkeys are able to master tasks that require response inhibition, such as the stop signal task and the object retrieval detour, and performance has been shown to improve with age around the time of puberty (38). The present findings show that performance in the antisaccade task also improves markedly between puberty and adulthood. A relatively uniform increase in performance was observed for several variants of the task, which differed in absolute difficulty. Performance benefits were observed for all types of errors, including the ability to resist making an eye movement toward the cue. This enhanced control was not achieved through a general slowing of reaction times in the adult stage; to the contrary, adult monkeys needed less time to process the cue and plan a correct saccade.
Neural Changes in Antisaccade Task.
The adult stage was characterized by a number of changes in neuronal activity. We first observed an increase in the baseline activity, even before the appearance of the cue (Fig. 2). This is important because low levels of baseline activity were predictive of errors (Fig. S6), as found in other studies (40), and because baseline activity is likely related to response preparation, which has been identified as a critical parameter for the developmental improvement of inhibitory control (41, 42). Baseline activity in our data may represent preparation for the task by virtue of representing the task rules ahead of the stimulus presentation.
We also observed increased activity preceding a saccade into the receptive field (higher activity following a stimulus in the ipsilateral field; Fig. S9). This increase was not driven by the activity of motor neurons (Fig. S3 E and F). Instead, we found increased activation of purely visual neurons (Fig. 3F). It is likely that this change between stages is associated with the neural representation of the goal through processes such as shifting of attention and vector inversion, which correspond to the encoding of a spatial location away from the stimulus (33). Similar activation by stimuli that the monkey is explicitly instructed not to foveate has been previously reported in the prefrontal cortex (43). Activity associated with vector inversion has also been reported in the Lateral Intraparietal Area (44), at least for a memory-guided antisaccade task, which allows the monkey considerable time to plan the response away from the stimulus. We now report that neurons in areas 8a and 46 of the dorsolateral prefrontal cortex (Fig. S10) exhibit vector-inversion–related activity for an antisaccade task that imposes no delay between the stimulus presentation and response. Furthermore, we found that this was enhanced in adulthood, providing a possible substrate for the ability to plan an appropriate response away from the salient stimulus.
Fig. S9.
Ipsilateral and contralateral responses for all neurons. (A). Average population peristimulus time histogram for all neurons recorded during the antisaccade task in the young stage (n = 607). Responses for a stimulus in the visual field contralateral to the recording site are shown for the three task variants. Activity is synchronized to the stimulus presentation (gray bar). (B) As in A, for a stimulus appearing in the ipsilateral field, requiring a saccade toward the contralateral field. Activity is synchronized to the onset of the saccade (vertical line). (C and D) As in A and B, for neurons recorded in the adult stage (n = 830).
Fig. S10.
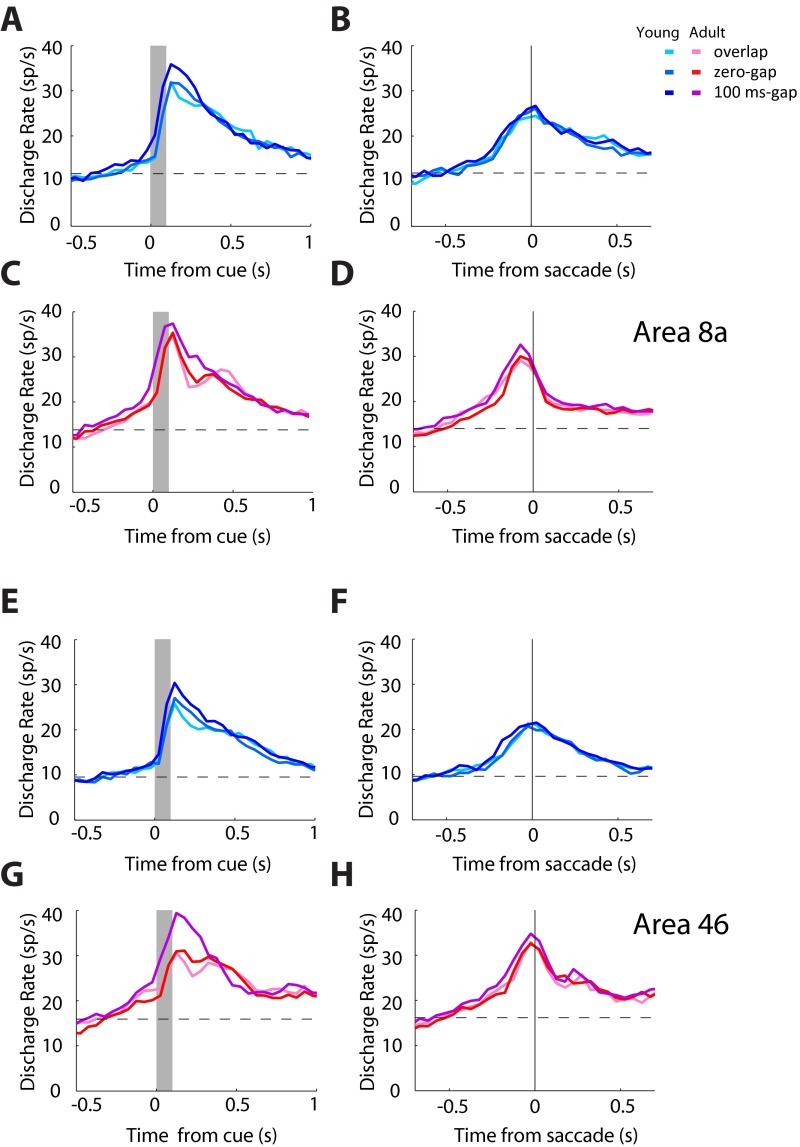
Responses in areas 8a and 46. (A) Average population peristimulus time histogram for neurons recorded in area 8a in the young stage (n = 265). Responses for a stimulus in the neuron’s receptive field, requiring a saccade away from it, for the three task variants. Activity is synchronized to the stimulus presentation (gray bar). (Insets) Schematic illustration of stimulus location and direction of eye movement relative to the receptive field (arc), which varied for each neuron. (B) As in A, for a stimulus appearing away from the receptive field, requiring an eye movement toward it. Activity is synchronized to the onset of the saccade (vertical line). (C and D) As in A and B, for neurons recorded in area 8a in the adult stage (n = 172). (E–H) As in A–D, for neurons recorded in area 46 in the young stage (n = 144) and the adult stage (n = 208).
In principle, the improved adult performance could have also been the result of more efficient suppression of neuronal responses representing the stimulus. In the young stage, higher levels of visual activity were observed in the most difficult task variants (Fig. 2), in sessions that resulted in lower overall performance (Fig. 4A), and in error trials (Fig. S6). However, explicit suppression of visual responses was not observed in the adult stage. In general, evoked visual responses (relative to baseline levels of activity) exhibited very little difference between stages (Fig. 2D, Inset). Among visual neurons, higher levels of activity were observed in adulthood (Fig. 3D). The interpretation of this absolute increase in visual activity between stages is not clear; what matters the most is likely the relative balance between the cue-driven activity and the internal representation of the saccadic goal. Even among purely visual neurons, the goal was represented to a greater extent in adulthood (Fig. 5 and Fig. S7A).
The prefrontal cortex was initially thought to inhibit the ipsilateral superior colliculus for generating an eye movement in the contralateral field, which could serve as an inhibitory signal to avert a saccade toward the stimulus (30, 31). However, recent evidence supports the idea that prefrontal cortex exerts a net excitatory effect on the ipsilateral superior colliculus (29). In this context, the prefrontal cortex provides the target of the correct saccade, which is to be directly translated into motor output in the superior colliculus. Our results are consistent with the latter interpretation, as we found that, between puberty and adulthood, there is an increase in the prefrontal activity associated with the internal representation of the correct target location, which could direct or reinforce the appropriate movement. The prefrontal cortex is part of a broader network activated during the antisaccade task, and including the superior colliculus (45), basal ganglia (46), frontal eye fields (47), supplementary eye fields (48), and posterior parietal cortex (49). Our results do not preclude the possibility that developmental changes in neurophysiological activity occur in areas outside the prefrontal cortex, and that these may additionally affect motor or visual-related activity related to the task. It is upon future studies to investigate if this is the case.
Materials and Methods
All surgical and animal use procedures were approved by the Wake Forest University Institutional Animal Care and Use Committee in accordance with the US Public Health Service Policy on Humane Care and Use of Laboratory Animals. We tracked developmental measures of monkeys in a quarterly basis before, during, and after neurophysiological recordings. The monkeys were initially naïve to behavioral training or task execution. They were trained in the ODR task and subsequently in three different variants for the antisaccade task during the young stage. When the animals had reached asymptotic performance in the ODR and antisaccade tasks, a 20-mm-diameter recording cylinder was implanted over areas 8a and 46 of the prefrontal cortex. At the conclusion of these recordings, the animals were no longer tested or trained for a period of ∼1 y; they were tested again after reaching adulthood. In the ODR task, visual neurons were defined as having significant elevation of firing rate in the 500-ms presentation of the cue over the 1-s baseline fixation period (paired t test, P < 0.05), no saccadic activity in the 250-ms response epoch, and no significant activity in the 1,500-ms delay period (that could be related to saccade preparation). In the antisaccade task, firing rates in a 200-ms window were subjected to a two-way ANOVA, using as factors the three variants of the task (overlap, zero-gap, and 100-ms gap) and the young/adult stage. In some analysis, we subtracted the baseline firing rate (computed in the 1-s fixation period) and then performed the ANOVA. Analysis was also performed on neural responses aligned to the onset of the saccade. In this case, firing rate was calculated in the 200 ms preceding the saccade onset. An ROC analysis was used to compare the distributions of firing rates of a neuron to two stimulus conditions, in a time-resolved fashion, using a 100-ms-long moving window. The stimulus location that elicited the best stimulus response during the ODR task was determined. We then compared responses in the antisaccade task involving a stimulus at the best location and at its diametric location. Detailed methods are provided in SI Materials and Methods.
SI Materials and Methods
Developmental Profiles.
Four male rhesus monkeys (Macaca mulatta) were used in this study. All surgical and animal use procedures were reviewed and approved by the Wake Forest University Institutional Animal Care and Use Committee, in accordance with the US Public Health Service Policy on humane care and use of laboratory animals and the National Research Council’s Guide for the Care and Use of Laboratory Animals. The objective of this study was to compare behavioral performance and neural activity in nonhuman primates during puberty and adulthood. Monkeys have a median life span of 25 y and can live as long as 40 y in captivity, suggesting that their rate of aging is approximately three times that of humans (50); however, the age of puberty and full sexual maturity can vary considerably between individuals, making chronological age an imprecise index. We therefore tracked developmental measures in a quarterly basis over a period before, during, and after neurophysiological recordings. Morphometric measures obtained included body weight, crown-to-rump length, chest circumference, and ulna and femur length. We ascertained testicular volume with a Prader Orchidometer (ESP Limited). We also checked for visible eruption of canine teeth and determined bone maturation by X-rays of the upper and lower extremities. We additionally obtained blood samples and determined serum concentration of circulating hormones including testosterone and dihydrotestosterone through extraction and enzyme immunoassay (performed at the Assay Services Unit of the Wisconsin National Primate Research Center). Developmental data were plotted relative to the onset of neurophysiological recordings in the adolescent and adult stages. Considerable day-to-day variability is present in several of these measures, so we smoothed the corresponding data points with a three-point triangular filter.
Behavioral Tasks.
Four monkeys were trained to perform the ODR task and antisaccade tasks. The ODR task is a spatial working memory task requiring subjects to remember the location of a cue stimulus flashed on a screen for 0.5 s. The cue was a 1° white square stimulus that could appear at one of eight locations arranged on a circle of 10° eccentricity. After a 1.5-s delay period, the fixation point was extinguished and the monkey was trained to make an eye movement to the remembered location of the cue within 0.6 s. In the antisaccade task, each trial starts with the monkey fixating a central green point on the screen. After 1 s fixation, the cue appears, consisting of a 1° white square stimulus that could appear at one of four locations arranged on a circle of 10° eccentricity for 0.1 s. The monkey is required to make a saccade at the location diametric to the cue. The saccade needed to terminate on a 5–6° radius window centered on the stimulus (within 3–4° from the edge of the stimulus), and the monkey was required to hold fixation within this window for 0.1 s. Animals were rewarded with fruit juice for successful completion of a trial. Eye position was monitored with an infrared eye tracking system (model RK-716; ISCAN). Breaking fixation at any point before the offset of the fixation point aborted the trial and resulted in no reward.
We used three different variants for the antisaccade task: overlap, zero-gap, and gap, differing in the sequence of the cue onset relative to the fixation point offset (Fig. 1A). In the overlap condition, the cue appears first, and then and fixation point and cue are simultaneously extinguished. In the zero gap condition, the fixation offset and the cue onset occur at the same time. In the gap condition, the fixation turns off and a 100-ms blank screen is inserted before the cue onset. Two of the four monkeys were tested with an additional gap condition for the antisaccade task, in which the gap period was extended from 100 ms to 200 ms. The monkeys were trained in the antisaccade task with the stimulus appearing at any of the eight stimulus locations also used in the ODR task. During recordings, four possible cue locations for each condition were used, involving the cardinal axes or the diagonal axes so there are 3 × 4 types of trials in each recording block. The sequence of these 12 trials was randomized in each block. During each recording session, monkeys first performed the ODR task to determine the receptive field of neurons recorded online, and then performed the antisaccade task.
Surgery and Neurophysiology.
The monkeys were initially naïve to behavioral training or task execution of any kind. They were first trained in the ODR and subsequently in the antisaccade tasks during the young stage. When the animals had reached asymptotic performance in the ODR and antisaccade tasks, a 20-mm-diameter recording cylinder was implanted over the prefrontal cortex of each animal. Localization of the recording cylinder and of electrode penetrations within the cylinder was based on MRI imaging, processed with the BrainSight system (Rogue Research). Recordings were collected with Epoxylite-coated tungsten electrodes with a diameter of 250 μm and an impedance of 4 MΩ at 1 KHz (FHC). Electrical signals recorded from the brain were amplified, band-pass filtered between 500 and 8 kHz, and stored through a modular data acquisition system at 25-μs resolution (APM system; FHC). Recordings analyzed here were obtained from areas 8a and 46 of the dorsolateral prefrontal cortex. At the conclusion of these recordings, the animals were no longer tested or trained for a period of ∼1 y During that period, the monkeys did not perform the antisaccade task or the ODR task or participate in training of any other experiment. The monkeys were not even brought to the recording suite. They remained housed in the same monkey colony as in the young stage. They continued to receive environmental enrichment, under the supervision of the Wake Forest Environmental Enrichment supervisor, before, during, and after the experiments. Enrichment intervention was maximal when the animal first arrived to the colony at a very young age, before the onset of the initial training and recordings. After reaching adulthood, determined with the developmental indexes described earlier, the animals were again tested in the same tasks that they were originally trained. They were generally able to quickly remaster the tasks. A new phase of recordings was then performed from the same areas by using identical recording methods.
Behavioral Data Analysis.
We analyzed performance in each variant of the antisaccade task by expressing performance as the overall percentage of trials that resulted in correct responses. Statistical comparisons were performed by using a three-way ANOVA with factors young/adult stage, the variant of antisaccade task, and individual monkey. Error trials were distinguished in three main categories. We defined type 1 errors as those trials that involved an initial eye movement in the direction of the correct target location (away from the stimulus) but resulted in an error because the monkey either did not stay for the required time interval (0.1 s) in the target window, e.g., only transiently swept his gaze through the target location or followed the initial saccade by a rapid second saccade toward an incorrect location. Type 2 errors involved an eye movement toward the location of the stimulus. This type also included trials where the monkey tried to correct its error by a saccade in the opposite direction. Finally, type 3 errors involved an eye movement to a location other than the stimulus or the target location. We often observed errors of this type in the young monkeys, directed to locations orthogonal to the stimulus–target axis. The total duration of trials was brief in the antisaccade task, so other types of errors, such as blinks or breaks in fixation after the stimulus onset, were negligible, and we do not report these separately.
Neural Data Analysis.
Recorded spike waveforms were sorted into separate units by using an automated cluster analysis method based on the KlustaKwik algorithm. Firing rate of units was then determined by averaging spikes in each task epoch. In the ODR task, we identified neurons with significant elevation of firing rate in the 500-ms presentation of the cue, the 1,500-ms delay period, and the 250-ms response epoch, after the offset of the fixation point. Firing rate in this period was compared with the 1-s baseline fixation period, before the presentation of the cue, and neurons with significant difference in firing rate were identified (paired t test, P < 0.05). Neurons selected for further analysis were those that responded during the stimulus presentation of the ODR task, provided that these neurons also continued to be responsive during the antisaccade task (which was as evidenced by significantly elevated responses in the 250-ms window following the onset of the cue) to ensure that we had not lost isolation of the neuron in the interim.
Visual neurons included in the analysis were neurons without motor responses in the ODR task (Fig. 3 A and B), no delay activity that could be related to motor preparation, and clearly defined receptive fields that did not encompass the location diametric to the best response location. We used an analogous approach to examine neurons with purely motor-driven responses (Fig. S3 A and B). We thus identified neurons without visual responses in the ODR task and clearly defined motor fields with presaccadic activity. Finally, we identified visuomotor neurons (Fig. S3 G and H) with visual and motor activity and clearly defined receptive and motor fields.
Firing rates in a 200-ms window were subjected to a two-way ANOVA using as factors the three variants of the task (overlap, zero-gap, and 100-ms gap) and the young/adult stage. As the baseline of firing rate differed systematically between stages, we first subtracted the baseline firing rate (computed in the 1-s fixation period that preceded the cue) and then performed the ANOVA for some comparisons. We also compared the firing rate preceding the cue; this involved an averaged firing rate in the 200 ms preceding the cue presentation. Finally, some analysis was performed on neural responses aligned to the onset of the saccade. In this case, firing rate was calculated in the 200 ms preceding the saccade onset.
Analysis of error trials was performed in neurons for which error trials were collected involving a stimulus presentation in the receptive field and for trials with a saccade in the receptive field. In this analysis, we used a 200-ms window, offset by 100 ms after the onset of the stimulus, as this was the time period in which the greatest difference between correct and error trials was observed. The same interval was used for comparisons between sessions with high and low performance.
Some comparisons involved responses recorded in sessions equated for performance, selecting those separately from each monkey. Sufficient data from two monkeys were available for these comparisons. We identified the set of highest-performance sessions during the young stage and lowest-performance sessions in the adult stage, and matched them so that there was no significant difference in performance drawn from the two phases. We then proceeded to analyze neuronal responses drawn from these sessions, as described earlier.
An ROC analysis was used to compare the distributions of firing rates of a neuron to two stimulus conditions, as we have done previously for prefrontal data (51). The area under the ROC curve represents the probability that an ideal observer can discriminate between the two stimuli based on their firing rate in each trial. For each neuron, we first determined the stimulus location that elicited the best stimulus response during the ODR task. We then compared responses in the antisaccade task involving a stimulus at the best location and at its diametric location (corresponding to the saccade in the receptive field). The analysis was performed in a time-resolved fashion, comparing responses in a 100-ms-long moving window computed in 10-ms steps.
We similarly computed choice probability, the area under the ROC curve comparing distributions of firing rates between correct and error trials for the same stimulus condition. A choice probability value of 1 in our analysis indicates that there is a perfect correlation between higher firing rate for the condition being analyzed and a correct choice; a value of 0.5 indicates a random correlation between the two; a value of 0 indicates a perfect correlation between lower firing rate in this condition and a correct choice. Time-resolved choice probabilities were computed from the spikes comparing responses in a 100-ms-long moving window computed in 10-ms steps.
SI Results
Ipsilateral vs. Contralateral Responses.
The analysis reported in the main text relies on a sample of 364 neurons recorded in the young stage and 444 neurons recorded in the adult stage for which responses in the ODR task were available, and it was thus possible to map the location of the receptive field (and/or response field). Most comparisons of firing rate relied on responses recorded when the stimulus appeared in the receptive field and when it appeared at its diametric location, allowing for a precise characterization of stimulus- and goal-driven responses. Additionally, we wished to characterize whether a neuron was visual, motor, or visuomotor to gain a deeper understanding on processes such as vector inversion. For these reasons, it was essential to identify neurons that were tested and activated during the ODR task. Nonetheless, we wanted to ensure that the differences between stages we report here were not skewed or biased by this additional requirement of response in the ODR task. We thus repeated the analysis for all 607 neurons recorded during the young stage and 830 neurons recorded in the adult stage and distinguished activity for the stimulus appearance in the left and right visual fields (i.e., ipsilateral or contralateral to the recording site). Recordings obtained with the stimulus appearing in the up and down positions were ignored. The results are presented in Fig. S9. The overall pattern of responses mirrored what was presented in the main text (Fig. 2), with the highest activity present for the most difficult condition, the gap condition, in the young and adult stages. Comparison between stages also replicated the findings we report in the main text. A two-way ANOVA of firing rate elicited by the stimulus out of the receptive field (Fig. S9 B–D) after subtracting the baseline fixation firing rate revealed a highly significant difference between stages (F1,4289 = 30.2; P < 10−10). We conclude that restricting the analysis to those neurons responsive in the ODR task does not distort the results between stages, while offering the advantages of identifying the neuron receptive field and response profile during discrete visual and motor phases of the task.
Areas 8a and 46.
Results from areas 8a and 46 are pooled for all analyses in the main text. Histological verification that would allow precise localization of areas was not available, but we distinguished between anterior recordings in the principal sulcus region (area 46) and posterior sites between the caudal end of the principal sulcus and the arcuate sulcus (area 8a) in each monkey. Recordings for which the localization was ambiguous were omitted from this analysis. Peri-stimulus time histograms computed from the corresponding populations of neurons revealed similar trends in both areas (Fig. S10 A–D vs. Fig. S10 E–H) and similar changes between stages in each area (e.g., Fig. S10 B and D and Fig. S10 F and H, respectively).
Acknowledgments
We thank Kathini Palaninathan for technical assistance in experiments, Karen Klein for editorial assistance, and David Blake for helpful comments on the manuscript. This work was supported by the Tab Williams Family Endowment Fund, the Harry O’Parker Neurosciences Fund, National Institutes of Health (NIH) Award R33MH86946, and NIH Grant P51 RR000167 to the Wisconsin National Primate Research Center (University of Wisconsin–Madison). This research was conducted in part at a facility constructed with support from Research Facilities Improvement Program Grants RR15459-01 and RR020141-01.
Footnotes
The authors declare no conflict of interest.
This article is a PNAS Direct Submission. A.D.W. is a guest editor invited by the Editorial Board.
This article contains supporting information online at www.pnas.org/lookup/suppl/doi:10.1073/pnas.1518147113/-/DCSupplemental.
References
- 1.Fry AF, Hale S. Relationships among processing speed, working memory, and fluid intelligence in children. Biol Psychol. 2000;54(1-3):1–34. doi: 10.1016/s0301-0511(00)00051-x. [DOI] [PubMed] [Google Scholar]
- 2.Mischel W, Shoda Y, Rodriguez MI. Delay of gratification in children. Science. 1989;244(4907):933–938. doi: 10.1126/science.2658056. [DOI] [PubMed] [Google Scholar]
- 3.Kramer AF, de Sather JC, Cassavaugh ND. Development of attentional and oculomotor control. Dev Psychol. 2005;41(5):760–772. doi: 10.1037/0012-1649.41.5.760. [DOI] [PubMed] [Google Scholar]
- 4.Davidson MC, Amso D, Anderson LC, Diamond A. Development of cognitive control and executive functions from 4 to 13 years: Evidence from manipulations of memory, inhibition, and task switching. Neuropsychologia. 2006;44(11):2037–2078. doi: 10.1016/j.neuropsychologia.2006.02.006. [DOI] [PMC free article] [PubMed] [Google Scholar]
- 5.Van Leijenhorst L, Westenberg PM, Crone EA. A developmental study of risky decisions on the cake gambling task: Age and gender analyses of probability estimation and reward evaluation. Dev Neuropsychol. 2008;33(2):179–196. doi: 10.1080/87565640701884287. [DOI] [PubMed] [Google Scholar]
- 6.Casey BJ, Jones RM, Hare TA. The adolescent brain. Ann N Y Acad Sci. 2008;1124:111–126. doi: 10.1196/annals.1440.010. [DOI] [PMC free article] [PubMed] [Google Scholar]
- 7.Cauffman E, et al. Age differences in affective decision making as indexed by performance on the Iowa Gambling Task. Dev Psychol. 2010;46(1):193–207. doi: 10.1037/a0016128. [DOI] [PubMed] [Google Scholar]
- 8.Pfefferbaum A, et al. A quantitative magnetic resonance imaging study of changes in brain morphology from infancy to late adulthood. Arch Neurol. 1994;51(9):874–887. doi: 10.1001/archneur.1994.00540210046012. [DOI] [PubMed] [Google Scholar]
- 9.Jernigan TL, et al. Cerebral structure on MRI, Part I: Localization of age-related changes. Biol Psychiatry. 1991;29(1):55–67. doi: 10.1016/0006-3223(91)90210-d. [DOI] [PubMed] [Google Scholar]
- 10.Sowell ER, Delis D, Stiles J, Jernigan TL. Improved memory functioning and frontal lobe maturation between childhood and adolescence: a structural MRI study. J Int Neuropsychol Soc. 2001;7(3):312–322. doi: 10.1017/s135561770173305x. [DOI] [PubMed] [Google Scholar]
- 11.Chugani HT, Phelps ME, Mazziotta JC. Positron emission tomography study of human brain functional development. Ann Neurol. 1987;22(4):487–497. doi: 10.1002/ana.410220408. [DOI] [PubMed] [Google Scholar]
- 12.Luna B, et al. Maturation of widely distributed brain function subserves cognitive development. Neuroimage. 2001;13(5):786–793. doi: 10.1006/nimg.2000.0743. [DOI] [PubMed] [Google Scholar]
- 13.Olesen PJ, Nagy Z, Westerberg H, Klingberg T. Combined analysis of DTI and fMRI data reveals a joint maturation of white and grey matter in a fronto-parietal network. Brain Res Cogn Brain Res. 2003;18(1):48–57. doi: 10.1016/j.cogbrainres.2003.09.003. [DOI] [PubMed] [Google Scholar]
- 14.Yakovlev PI, Lecours AR, editors. The Myelogenetic Cycles of Regional Maturation of the Brain. Blackwell; Oxford: 1967. [Google Scholar]
- 15.Ordaz SJ, Foran W, Velanova K, Luna B. Longitudinal growth curves of brain function underlying inhibitory control through adolescence. J Neurosci. 2013;33(46):18109–18124. doi: 10.1523/JNEUROSCI.1741-13.2013. [DOI] [PMC free article] [PubMed] [Google Scholar]
- 16.Klingberg T, Forssberg H, Westerberg H. Training of working memory in children with ADHD. J Clin Exp Neuropsychol. 2002;24(6):781–791. doi: 10.1076/jcen.24.6.781.8395. [DOI] [PubMed] [Google Scholar]
- 17.Bunge SA, Dudukovic NM, Thomason ME, Vaidya CJ, Gabrieli JD. Immature frontal lobe contributions to cognitive control in children: Evidence from fMRI. Neuron. 2002;33(2):301–311. doi: 10.1016/s0896-6273(01)00583-9. [DOI] [PMC free article] [PubMed] [Google Scholar]
- 18.Olesen PJ, Macoveanu J, Tegnér J, Klingberg T. Brain activity related to working memory and distraction in children and adults. Cereb Cortex. 2007;17(5):1047–1054. doi: 10.1093/cercor/bhl014. [DOI] [PubMed] [Google Scholar]
- 19.Kwon H, Reiss AL, Menon V. Neural basis of protracted developmental changes in visuo-spatial working memory. Proc Natl Acad Sci USA. 2002;99(20):13336–13341. doi: 10.1073/pnas.162486399. [DOI] [PMC free article] [PubMed] [Google Scholar]
- 20.Satterthwaite TD, et al. Functional maturation of the executive system during adolescence. J Neurosci. 2013;33(41):16249–16261. doi: 10.1523/JNEUROSCI.2345-13.2013. [DOI] [PMC free article] [PubMed] [Google Scholar]
- 21.Durston S, Thomas KM, Worden MS, Yang Y, Casey BJ. The effect of preceding context on inhibition: An event-related fMRI study. Neuroimage. 2002;16(2):449–453. doi: 10.1006/nimg.2002.1074. [DOI] [PubMed] [Google Scholar]
- 22.Luna B, Velanova K, Geier CF. Development of eye-movement control. Brain Cogn. 2008;68(3):293–308. doi: 10.1016/j.bandc.2008.08.019. [DOI] [PMC free article] [PubMed] [Google Scholar]
- 23.Bourgeois JP, Goldman-Rakic PS, Rakic P. Synaptogenesis in the prefrontal cortex of rhesus monkeys. Cereb Cortex. 1994;4(1):78–96. doi: 10.1093/cercor/4.1.78. [DOI] [PubMed] [Google Scholar]
- 24.Fuster JM. Frontal lobe and cognitive development. J Neurocytol. 2002;31(3-5):373–385. doi: 10.1023/a:1024190429920. [DOI] [PubMed] [Google Scholar]
- 25.Plant TM, Ramaswamy S, Simorangkir D, Marshall GR. Postnatal and pubertal development of the rhesus monkey (Macaca mulatta) testis. Ann N Y Acad Sci. 2005;1061:149–162. doi: 10.1196/annals.1336.016. [DOI] [PubMed] [Google Scholar]
- 26.Herman RA, Zehr JL, Wallen K. Prenatal androgen blockade accelerates pubertal development in male rhesus monkeys. Psychoneuroendocrinology. 2006;31(1):118–130. doi: 10.1016/j.psyneuen.2005.06.004. [DOI] [PubMed] [Google Scholar]
- 27.Lewis DA. Development of the prefrontal cortex during adolescence: Insights into vulnerable neural circuits in schizophrenia. Neuropsychopharmacology. 1997;16(6):385–398. doi: 10.1016/S0893-133X(96)00277-1. [DOI] [PubMed] [Google Scholar]
- 28.Hoftman GD, Lewis DA. Postnatal developmental trajectories of neural circuits in the primate prefrontal cortex: Identifying sensitive periods for vulnerability to schizophrenia. Schizophr Bull. 2011;37(3):493–503. doi: 10.1093/schbul/sbr029. [DOI] [PMC free article] [PubMed] [Google Scholar]
- 29.Johnston K, Koval MJ, Lomber SG, Everling S. Macaque dorsolateral prefrontal cortex does not suppress saccade-related activity in the superior colliculus. Cereb Cortex. 2014;24(5):1373–1388. doi: 10.1093/cercor/bhs424. [DOI] [PubMed] [Google Scholar]
- 30.Ploner CJ, Gaymard BM, Rivaud-Péchoux S, Pierrot-Deseilligny C. The prefrontal substrate of reflexive saccade inhibition in humans. Biol Psychiatry. 2005;57(10):1159–1165. doi: 10.1016/j.biopsych.2005.02.017. [DOI] [PubMed] [Google Scholar]
- 31.Ettinger U, et al. Decomposing the neural correlates of antisaccade eye movements using event-related FMRI. Cereb Cortex. 2008;18(5):1148–1159. doi: 10.1093/cercor/bhm147. [DOI] [PubMed] [Google Scholar]
- 32.Hallett PE. Primary and secondary saccades to goals defined by instructions. Vision Res. 1978;18(10):1279–1296. doi: 10.1016/0042-6989(78)90218-3. [DOI] [PubMed] [Google Scholar]
- 33.Munoz DP, Everling S. Look away: The anti-saccade task and the voluntary control of eye movement. Nat Rev Neurosci. 2004;5(3):218–228. doi: 10.1038/nrn1345. [DOI] [PubMed] [Google Scholar]
- 34.Casey B, Jones RM, Somerville LH. Braking and accelerating of the adolescent brain. J Res Adolesc. 2011;21(1):21–33. doi: 10.1111/j.1532-7795.2010.00712.x. [DOI] [PMC free article] [PubMed] [Google Scholar]
- 35.Munoz DP, Armstrong IT, Hampton KA, Moore KD. Altered control of visual fixation and saccadic eye movements in attention-deficit hyperactivity disorder. J Neurophysiol. 2003;90(1):503–514. doi: 10.1152/jn.00192.2003. [DOI] [PubMed] [Google Scholar]
- 36.Smyrnis N, et al. Attentional facilitation of response is impaired for antisaccades but not for saccades in patients with schizophrenia: Implications for cortical dysfunction. Exp Brain Res. 2004;159(1):47–54. doi: 10.1007/s00221-004-1931-0. [DOI] [PubMed] [Google Scholar]
- 37.McDowell JE, et al. Neural correlates of refixation saccades and antisaccades in normal and schizophrenia subjects. Biol Psychiatry. 2002;51(3):216–223. doi: 10.1016/s0006-3223(01)01204-5. [DOI] [PubMed] [Google Scholar]
- 38.Soto PL, et al. Long-term exposure to oral methylphenidate or dl-amphetamine mixture in peri-adolescent rhesus monkeys: Effects on physiology, behavior, and dopamine system development. Neuropsychopharmacology. 2012;37(12):2566–2579. doi: 10.1038/npp.2012.119. [DOI] [PMC free article] [PubMed] [Google Scholar]
- 39.Miller EK, Cohen JD. An integrative theory of prefrontal cortex function. Annu Rev Neurosci. 2001;24:167–202. doi: 10.1146/annurev.neuro.24.1.167. [DOI] [PubMed] [Google Scholar]
- 40.Everling S, Munoz DP. Neuronal correlates for preparatory set associated with pro-saccades and anti-saccades in the primate frontal eye field. J Neurosci. 2000;20(1):387–400. doi: 10.1523/JNEUROSCI.20-01-00387.2000. [DOI] [PMC free article] [PubMed] [Google Scholar]
- 41.Ordaz S, Davis S, Luna B. Effects of response preparation on developmental improvements in inhibitory control. Acta Psychol (Amst) 2010;134(3):253–263. doi: 10.1016/j.actpsy.2010.02.007. [DOI] [PMC free article] [PubMed] [Google Scholar]
- 42.DeSouza JF, Menon RS, Everling S. Preparatory set associated with pro-saccades and anti-saccades in humans investigated with event-related FMRI. J Neurophysiol. 2003;89(2):1016–1023. doi: 10.1152/jn.00562.2002. [DOI] [PubMed] [Google Scholar]
- 43.Hasegawa RP, Peterson BW, Goldberg ME. Prefrontal neurons coding suppression of specific saccades. Neuron. 2004;43(3):415–425. doi: 10.1016/j.neuron.2004.07.013. [DOI] [PubMed] [Google Scholar]
- 44.Zhang M, Barash S. Neuronal switching of sensorimotor transformations for antisaccades. Nature. 2000;408(6815):971–975. doi: 10.1038/35050097. [DOI] [PubMed] [Google Scholar]
- 45.Everling S, Dorris MC, Klein RM, Munoz DP. Role of primate superior colliculus in preparation and execution of anti-saccades and pro-saccades. J Neurosci. 1999;19(7):2740–2754. doi: 10.1523/JNEUROSCI.19-07-02740.1999. [DOI] [PMC free article] [PubMed] [Google Scholar]
- 46.Ford KA, Everling S. Neural activity in primate caudate nucleus associated with pro- and antisaccades. J Neurophysiol. 2009;102(4):2334–2341. doi: 10.1152/jn.00125.2009. [DOI] [PubMed] [Google Scholar]
- 47.Funahashi S, Chafee MV, Goldman-Rakic PS. Prefrontal neuronal activity in rhesus monkeys performing a delayed anti-saccade task. Nature. 1993;365(6448):753–756. doi: 10.1038/365753a0. [DOI] [PubMed] [Google Scholar]
- 48.Schlag-Rey M, Amador N, Sanchez H, Schlag J. Antisaccade performance predicted by neuronal activity in the supplementary eye field. Nature. 1997;390(6658):398–401. doi: 10.1038/37114. [DOI] [PubMed] [Google Scholar]
- 49.Gottlieb J, Goldberg ME. Activity of neurons in the lateral intraparietal area of the monkey during an antisaccade task. Nat Neurosci. 1999;2(10):906–912. doi: 10.1038/13209. [DOI] [PubMed] [Google Scholar]
- 50.Roth GS, et al. Aging in rhesus monkeys: Relevance to human health interventions. Science. 2004;305(5689):1423–1426. doi: 10.1126/science.1102541. [DOI] [PubMed] [Google Scholar]
- 51.Qi XL, Meyer T, Stanford TR, Constantinidis C. Changes in prefrontal neuronal activity after learning to perform a spatial working memory task. Cereb Cortex. 2011;21(12):2722–2732. doi: 10.1093/cercor/bhr058. [DOI] [PMC free article] [PubMed] [Google Scholar]


