Abstract
Cell reprogramming technology has allowed the in vitro control of cell fate transition, thus allowing for the generation of highly desired cell types to recapitulate in vivo developmental processes and architectures. However, the precise molecular mechanisms underlying the reprogramming process remain to be defined. Here, we show that depleting p53 and p21, which are barriers to reprogramming, yields a high reprogramming efficiency. Deletion of these factors results in a distinct mitochondrial background with low expression of oxidative phosphorylation subunits and mitochondrial fusion proteins, including mitofusin 1 and 2 (Mfn1/2). Importantly, Mfn1/2 depletion reciprocally inhibits the p53-p21 pathway and promotes both the conversion of somatic cells to a pluripotent state and the maintenance of pluripotency. Mfn1/2 depletion facilitates the glycolytic metabolic transition through the activation of the Ras-Raf and hypoxia-inducible factor 1α (HIF1α) signaling at an early stage of reprogramming. HIF1α is required for increased glycolysis and reprogramming by Mfn1/2 depletion. Taken together, these results demonstrate that Mfn1/2 constitutes a new barrier to reprogramming, and that Mfn1/2 ablation facilitates the induction of pluripotency through the restructuring of mitochondrial dynamics and bioenergetics.
Cell fate transition occurs under various developmental, physiological, and pathological conditions, including normal embryonic development, aging, and tissue regeneration, as well as tumor initiation and progression. Defining the cellular and molecular mechanisms of cell fate transition and learning to control these mechanisms may be essential for treating abnormal pathological conditions resulting from improper regulation of cell fate. The recent development of induced pluripotent stem cell (iPSC) technology has allowed for the reprogramming of somatic cells to pluripotent stem cells through the use of defined pluripotency factors, and has allowed us to more closely mimic and recapitulate the conditions of cell fate transitions.1 In studying aspects of somatic cell reprogramming related to pluripotency, dramatic and complex molecular changes at the genetic, epigenetic, and metabolic levels have been observed during the initial stage of reprogramming.2 Cell reprogramming faces the challenge of balancing stability and plasticity and must overcome critical barriers, such as cell cycle checkpoints, the mesenchymal–epithelial transition, and metabolic reprogramming, to progress cell fate conversion from a stochastic early phase toward pluripotency.3
The p53 pathway limits cell fate transition by inducing classical signaling that leads to cell cycle arrest, senescence, or apoptosis to maintain genome stability in the face of reprogramming-induced stress. Thus, compromising p53 signaling accelerates the reprogramming process.4, 5, 6 Recent reports have provided data showing that the fast-cycling population is enriched in p53 knockdown cells, which secures the transition to pluripotency.7 It has also been observed that p53 induces the differentiation of damaged embryonic stem cells (ESCs) by suppressing the pluripotency factors, Nanog and Oct4.8 Moreover, p53 governs cellular state homeostasis, which constrains the mesenchymal–epithelial transition by inhibiting Klf4-mediated expression of epithelial genes early in the reprogramming process,9 and opposes glycolytic metabolic reprogramming, thereby playing an oncosuppressive role.10 Through the regulation of these canonical and emergent functions, p53 maintains cellular integrity and stability under conditions of cell fate transition.
Highly proliferative cells, such as iPSCs and tumor cells, prefer to undergo glycolysis and decrease their dependency on mitochondrial ATP production, which requires the biosynthesis of macromolecules and the alleviation of mitochondrial oxidative stress in rapidly growing cells.11 Furthermore, there are substantial mitochondrial structural changes that interconnected mitochondrial network of somatic cells transforms into an immature phenotype during metabolic reprogramming.12 These morphological and functional changes in mitochondria are controlled by fusion and fission processes, which are primarily mediated by the dynamin-related GTPases, mitofusins (Mfn) and dynamin-related protein 1 (Drp1), respectively.13 Our previous data demonstrated that Drp1 activation via the pluripotency factor Rex1 promotes mitochondrial fragmentation, which contributes to the acquisition and maintenance of stem cell pluripotency.14 Balancing mitochondrial dynamics is crucial for maintaining cellular homeostasis, and an abnormal mitochondrial dynamic can result in numerous diseases. However, the relevant roles of mitochondrial structural proteins in the cell fate conversion process are not completely understood.
Here, we decipher an early stage of cellular reprogramming in a p53 knockout (KO) context related to its function as a cell fate transition checkpoint. p53- and p21-KO cells express low levels of Mfn1/2 at an early stage of reprogramming, and restructuring mitochondrial dynamics and bioenergetics by ablating Mfn promotes the conversion of these cells to a pluripotent cell fate. Our work reveals novel roles of the mitochondrial fusion proteins Mfn1/2 driving entry to and exit from pluripotency by the coordinated integration of p53 signaling.
Results
Mitochondrial function is downregulated during early-stage reprogramming of p53- and p21-KO somatic cells
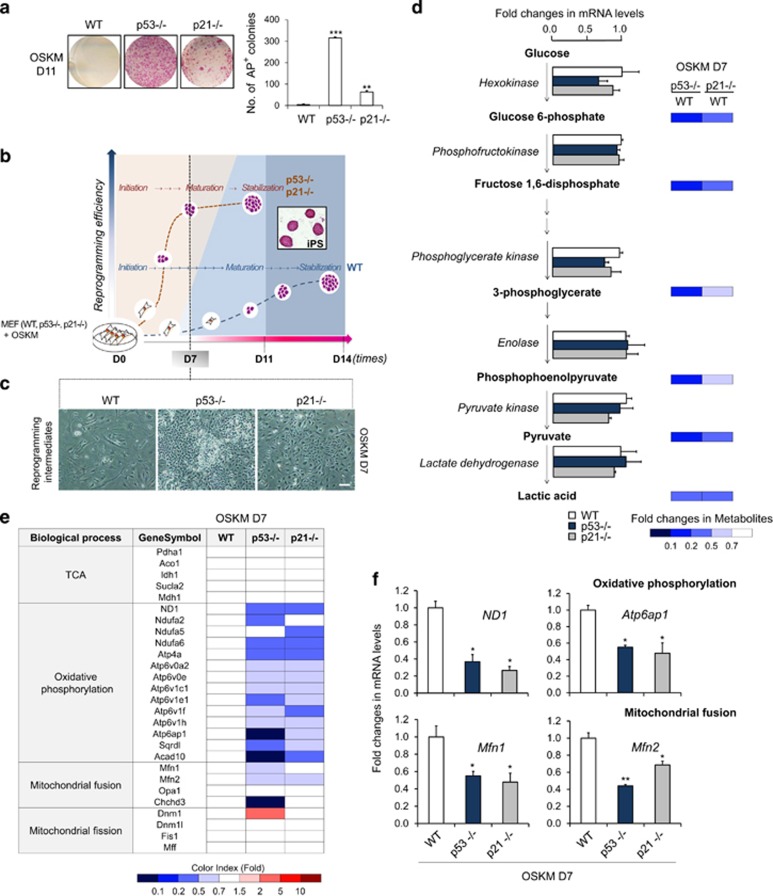
As expected, the reprogramming efficiency of iPSCs, as determined by alkaline phosphatase (AP) staining, was substantially increased in p53- and p21-KO mouse embryonic fibroblasts (MEFs; Figure 1a). Beginning in the early stage of reprogramming, around day 7 (D7; Figure 1b), dramatic morphological changes and a substantial increase in cell numbers were observed in p53- and p21-KO cells compared with the wild-type control (WT; Figure 1c). To elucidate the mechanisms underlying of early-stage reprogramming, microarray-based transcriptome and mass spectrometry-based metabolome analyses was performed on WT, p53-KO, and p21-KO MEFs at D7 of reprogramming. Transcriptome analysis showed that p53- and p21-KO cells reprogrammed for 7 days were positioned at an intermediate stage between initiation (early) and maturation (late), as determined by comparing the levels of markers discriminating the stages of reprogramming (Supplementary Figure s1a). As expected, the expression of gene sets related to cell growth, adhesion, RNA splicing, and the cell cycle was markedly increased; conversely, differentiation-related genes were downregulated in reprogramming intermediates of p53- and p21-KO cells compared with those of WT cells (Supplementary Figure s1b). However, within the central carbon metabolic network, glycolysis showed no significant changes in the reprogramming intermediates of p53- and p21-KO cells (Figure 1d and Supplementary Figure s1c). The expression of genes encoding major enzymes involved in glycolysis remained unchanged, and the relative quantity of metabolites of each step of glycolysis was decreased in reprogramming intermediates from p53- and p21-KO cells compared with WT cells (Figure 1d). Unsurprisingly, the intracellular production of lactate—the end product of glycolysis—was sequentially increased upon reprogramming and was promoted by p53- and p21-KO (Supplementary Figure s2a), whereas cellular reprogramming was substantially decreased by the glycolysis inhibitor 2-DG (Supplementary Figure s2b). Like this, glycolytic conversion was essential for somatic cell reprogramming, which was accelerated in the p53- and p21-KO contexts, but we were unable to detect a promoting effect of p53- and p21-KO cells over the WT control in our setting of early-stage reprogramming. In contrast, gene expression related to mitochondrial function was markedly suppressed in reprogramming intermediates of p53- and p21-KO cells compared with WT (Figure 1e). The expression levels of tricarboxylic acid cycle-related genes remained unchanged (Figure 1e). Notably, mitochondrial-encoded oxidative phosphorylation (OXPHOS) subunits, including ND1 (complex I) and Atp6ap1 (ATP6 family in complex V), were markedly downregulated, whereas nuclear-encoded genes were not (Sdhb in complex II, Uqcrc1, and the ATP5 family in complex V; Figure 1f and Supplementary Figures s3a and b). Importantly, mitochondrial fusion genes, including Mfn1/2 and Chchd3, showed significantly decreased levels in reprogramming intermediates from p53- and p21-KO cells, whereas the levels of fission genes, including Dnm1, Dnm1l (Drp1), Fis1, and Mff, were increased or remained unchanged (Figures 1e and f). Furthermore, a reduced ADP/ATP ratio (an energy turnover index) was found in reprogramming intermediates from p53-KO cells compared with the WT control (Supplementary Figure s3c). These results suggest that a metabolic shift from mitochondrial dependence to independence occurs more rapidly and efficiently during the reprogramming of p53- and p21-KO cells compared with WT cells. Therefore, we next attempted to investigate mitochondrial changes more precisely during the early stage of reprogramming using the p53- and p21-KO cell system.
Figure 1.
Mitochondrial function is downregulated during early-stage reprogramming of p53- and p21-KO somatic cells. (a) WT, p53−/−, and p21−/− MEFs were reprogrammed via retroviral transduction of the OSKM reprogramming factors. Representative images of AP+ colonies (left). The total numbers of AP+ colonies were determined on day 11 (D11) of reprogramming (right). (b) The stages of sample preparation for the transcriptome and metabolome analyses are depicted. (c) Representative cell morphology on D7 of reprogramming. (d) The expression of genes encoding major enzymes (left) and the relative quantities of each metabolite (right) related to glycolysis were determined through real-time PCR analysis and capillary electrophoresis time-of-flight mass spectrometry, respectively. The fold changes of metabolites in p53−/− and p21−/− reprogramming cultures compared with the WT control at D7 are represented by a color-coded index bar. (e) Transcriptome analysis of mitochondrial function in OSKM-transduced WT, p53−/−, and p21−/− MEFs on D7 of reprogramming. (f) Real-time PCR analysis of the mitochondria-encoded OXPHOS subunits ND1 and Atp6ap1 and the mitochondrial fusion genes Mfn1/2 in WT, p53−/−, and p21−/− D7 reprogramming cultures. The data are presented as the mean±S.E. (n= 3). *P<0.05; **P<0.01 (Student's t-test). Scale bar=50 μm
p53- and p21-KO cells and pluripotent reprogramming intermediates express low levels of mitochondrial fusion proteins
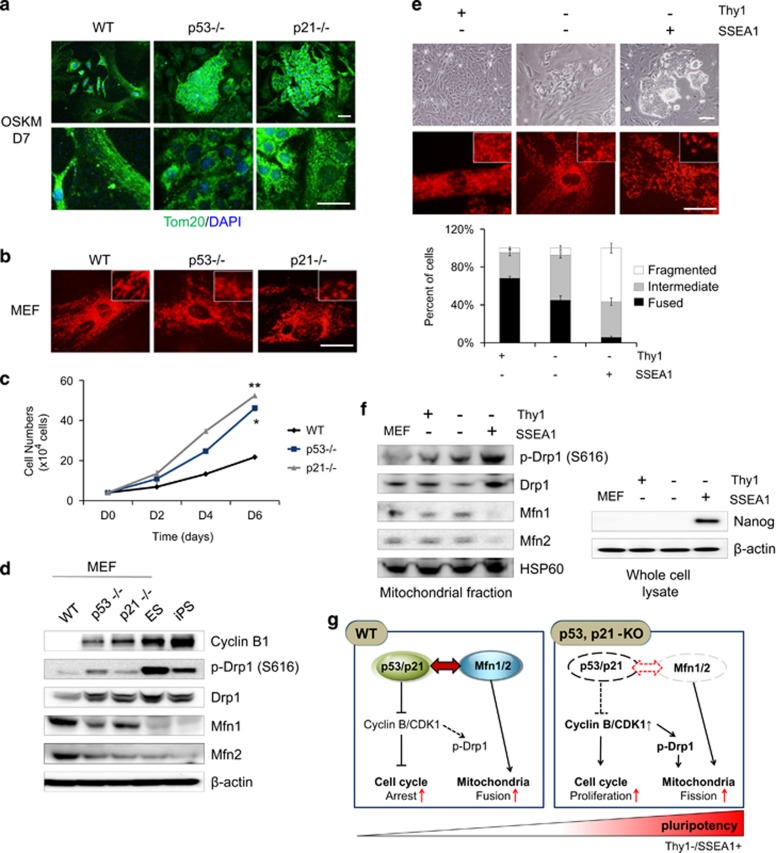
On D7 after reprogramming, reprogramming intermediates of p53- and p21-KO cells displayed some fragmented and punctate mitochondria, which is characteristic of pluripotent cells, whereas reprogramming intermediates from WT cells did not (Figure 2a). In the initial cell populations, fragmented mitochondria (Figure 2b) and increased cell proliferation (Figure 2c) were detected in p53- and p21-KO MEFs compared with WT cells. The expression of mitochondrial structural components between somatic WT MEFs, p53- and p21-KO MEFs, and pluripotent stem cells (PSCs (ESCs and iPSCs)) exhibited large differences at the protein level (Figure 2d). Cyclin B1-dependent Drp1 phosphorylation and Drp1 protein expression was higher in p53- and p21-KO MEFs and PSCs than in WT MEFs. Conversely, Mfn1/2 expression was significantly lower in PSCs and p53- and p21-KO MEFs than in WT MEFs (Figure 2d). To further examine the correlation between pluripotency induction and mitochondrial dynamics, reprogramming intermediates were sorted on D11 of reprogramming via magnetic-activated cell sorting (MACS) based on the expression of the somatic cell marker Thy1 and the early-stage pluripotency marker SSEA1 (Figure 2e). The mitochondrial morphology of the Thy1+/SSEA1− (somatic), Thy1−/SSEA1− (early intermediate), and Thy1−/SSEA1+ (late intermediate) subpopulations was scored and quantified as fused(somatic)/intermediate/fragmented(pluripotent). Upon reprogramming, the fragmented phenotype was markedly increased in the Thy1−/SSEA1+ subpopulation, whereas the fused form gradually disappeared (Figure 2e). Drp1 expression and the phosphorylation levels were significantly increased in the mitochondrial fraction of the Thy1−/SSEA1+ subpopulation, while expression of Mfn1/2 was decreased (Figure 2f). Together, these findings suggest that p53- and p21-KO cells are in a reprogramming-favorable state with a distinct mitochondrial background having low expression of Mfns, which is similar to the state observed for pluripotent reprogramming intermediates (Figure 2g).
Figure 2.
p53- and p21-KO cells and pluripotent reprogramming intermediates express low levels of mitochondrial fusion proteins. (a) OSKM-transduced WT, p53−/−, and p21−/− MEFs on D7 of reprogramming were stained with Tom20 (mitochondria, green) and DAPI (nuclei, blue) (top). High-magnification images (bottom). (b) Mitochondrial morphology of WT, p53−/−, and p21−/− MEFs stained with Mitotracker (red) and enlarged images (inset in top right corner). (c) Cell proliferation of WT, p53−/−, and p21−/− MEFs were determined by cell number counting. (d) Western blot analysis of Cyclin B1 and mitochondrial fission (Drp)-fusion (Mfn) components. β-actin was used as an internal control. (e) Reprogramming intermediates were sorted based on Thy1 and SSEA1 expression using MACS on D11. Representative images of each subgroup (top), the mitochondrial morphology stained with Mitotracker (red) (middle), and enlarged images (inset in middle right corner) on D14. The percentages of cells with fragmented/intermediate/fused mitochondria were determined in each subgroup (bottom). (f) Western blot analysis of mitochondrial fission (Drp)-fusion (Mfn) components in the mitochondrial fraction and of the pluripotency marker Nanog in the whole-cell lysates of MEFs and each subpopulation. HSP60 and β-actin were used as internal controls. (g) Schematic presentation of the p53- and p21-KO cells. Scale bar=50 μm
Ablation of Mfn1/2 promotes pluripotency acquisition and maintenance
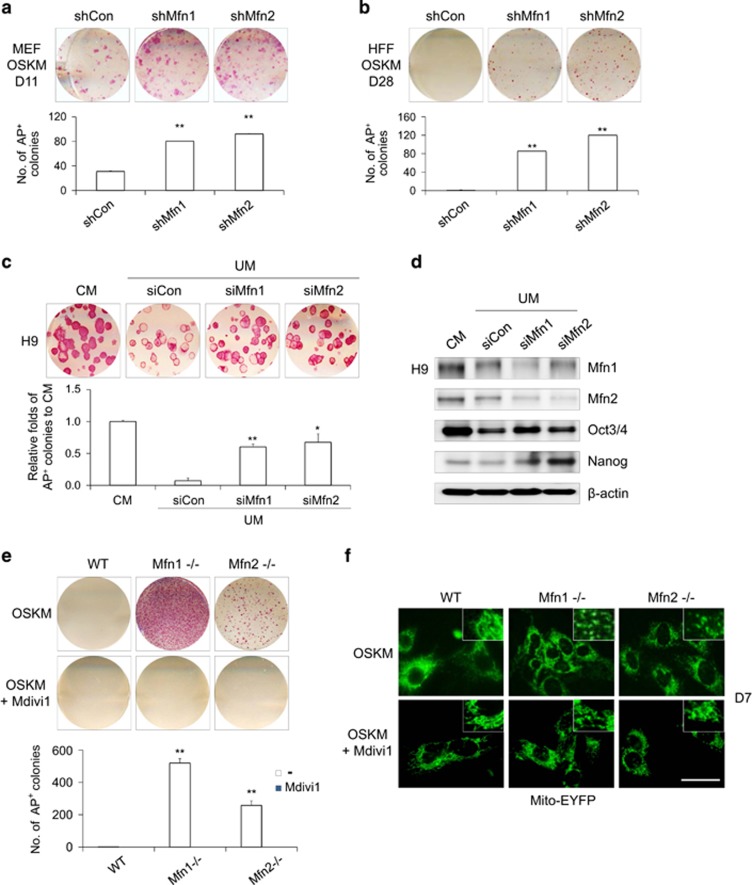
We next questioned whether Mfn1/2 downregulation contributes to somatic cell reprogramming (Figure 3). Knockdown of Mfn1/2 with shRNA strongly enhanced the observed reprogramming efficiency in both mouse (Figure 3a) and human cell systems (Figure 3b), as assayed by AP staining, whereas control shRNA did not. In addition, in culture conditions with unconditioned medium (UM) leading to hESC differentiation, Mfn1/2 knockdown with siRNA was beneficial for maintaining human ESCs (hESCs) in the undifferentiated state (Figure 3c). Under UM culture conditions, the expression of pluripotency-associated markers such as Oct3/4 and Nanog was maintained well in hESCs upon knockdown of Mfn1/2 (Figure 3d and Supplementary Figure s4). Furthermore, complete knockout via the genetic ablation of Mfn1/2 yielded a significantly higher reprogramming efficiency (Figure 3e) and a fragmented mitochondrial morphology (Figure 3f) compared with WT MEFs. These effects were blocked by treatment with Mdivi1, a pharmacological inhibitor of mitochondrial fission (Figures 3e and f), and this result is consistent with a previous report.15 These results demonstrate that the inhibition of mitochondrial fusion via Mfn ablation instigated reprogramming and maintenance of pluripotency.
Figure 3.
Mfn1/2 ablation promotes the acquisition and maintenance of pluripotency. (a) MEFs and (b) HFFs were transduced with control (shCon), Mfn1 (shMfn1), and Mfn2 (shMfn2) lentiviral shRNAs together with retroviral OSKM reprogramming factors. Representative images of AP+ colonies (each top). The total numbers of AP+ colonies were determined on D11 (a) and D28 (b) of reprogramming, respectively (each bottom). (c) H9 hESCs were transfected with control (siCon), Mfn1 (siMfn1), and Mfn2 (siMfn2) siRNAs and cultured with unconditioned medium (UM; differentiated). Conditioned medium (CM)-cultured hESCs were used as an undifferentiated control. Representative images of AP+ colonies (top) and the relative fold difference in AP+ colonies under feeder-free conditions on D5 (bottom). (d) Western blot analysis of Mfn1/2 and the pluripotency markers Oct3/4 and Nanog in siRNA-transfected hESCs on D5. β-actin was used as an internal control. (e) WT, Mfn1−/−, and Mfn2−/− MEFs were reprogrammed via retroviral transduction of OSKM in the absence (top) and presence (middle) of 50 μM Mdivi1, an inhibitor of mitochondrial division. Representative images of AP+ colonies (top and middle). The total numbers of AP+ colonies were determined on D11 of reprogramming (bottom). (f) The mitochondrial morphology of each reprogramming culture was observed using stably expressed Mito-EYFP (green) on D7. Enlarged images (inset in right corner). The data are presented as the mean±S.E. (n=3). *P<0.05; **P<0.01 (Student's t-test). Scale bar=50 μm
Mfn1/2 knockdown facilitates glycolytic conversion in early-stage reprogramming
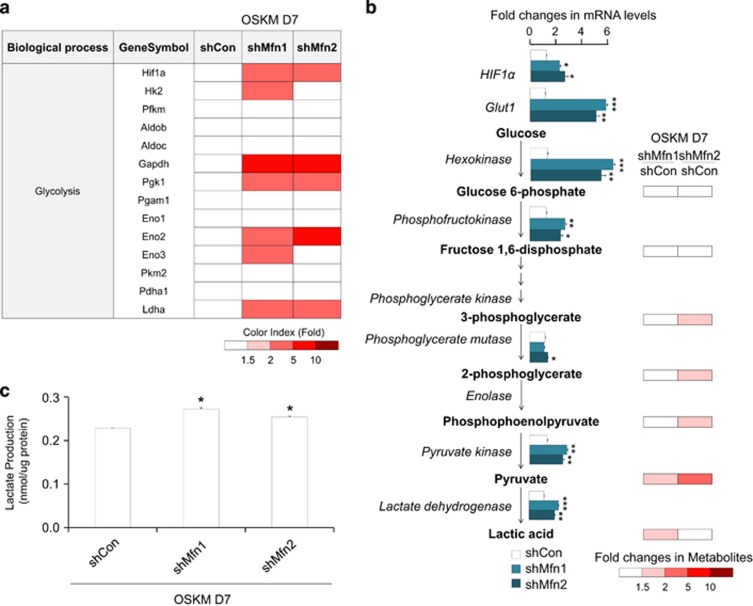
To clarify the mechanism promoting the cell fate transition to pluripotency induced by Mfn1/2 knockdown, transcriptome and metabolome analyses were performed in D7 reprogramming cultures of Mfn1/2 shRNA-transduced cells (Figure 4). As expected, gene expression profiling of the OXPHOS complex following Mfn1/2 knockdown revealed the overall downregulation of genes specifying mitochondrial energy metabolism (Supplementary Figure s5a). However, the expression of genes encoding major enzymes involved in glycolysis and the relative quantity of metabolites in each step of glycolysis were dramatically increased in Mfn1/2 knockdown cells compared with the control (Figures 4a and b), and intracellular lactate production was indeed increased by Mfn1/2 knockdown (Figure 4c). These findings reveal that the suppression of mitochondrial fusion through Mfn1/2 ablation promotes a glycolytic bioenergetic transition to meet the energy demands of highly proliferating pluripotent cells such as pluripotent iPSCs.
Figure 4.
Mfn1/2 knockdown facilitates glycolytic conversion in early-stage reprogramming. (a) Transcriptome analysis of gene sets related to glycolysis in MEFs transduced with OSKM and the indicated shRNAs on D7 of reprogramming. The ratios are indicated by a color-coded index bar. (b) The expression of genes encoding major enzymes (left) and the relative quantity of each metabolite (right) related to glycolysis were determined via real-time PCR analysis and capillary electrophoresis time-of-flight mass spectrometry, respectively. The fold changes of metabolites in Mfn1/2 shRNA-transduced reprogramming cultures compared with the control at D7 are represented by a color-coded index bar. (c) Lactate production was determined in the cell lysates of each group. The data are presented as the mean±S.E. (n=3). *P<0.05; **P<0.01; ***P<0.001 (Student's t-test)
Reciprocal inhibition of p53/p21 and Mfn1/2 activates Ras-Raf-HIF1α signaling
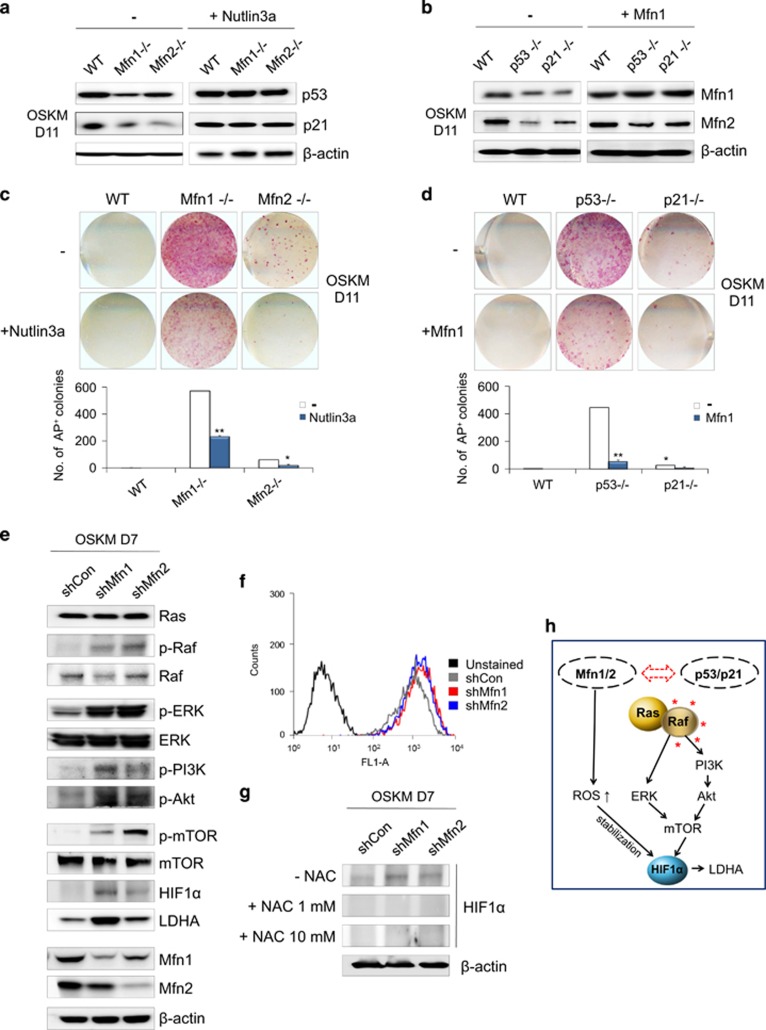
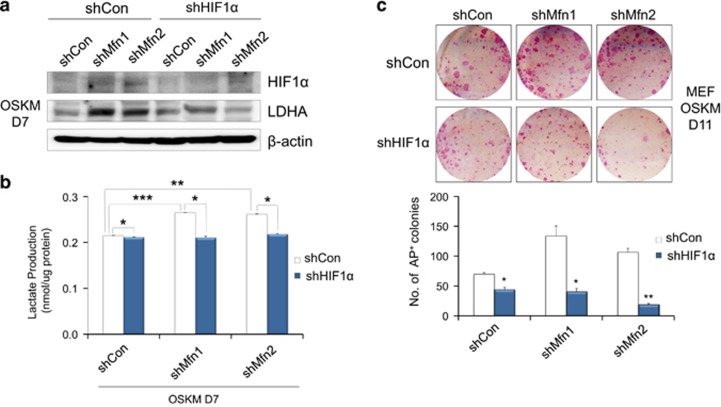
Because p53 is also known to be a key metabolic regulator, we investigated the correlation between Mfn1/2 and p53 signaling. Gene expression profiling showed that the expression of p53 (Trp53), p21 (Cdkn1a), and p16 (Cdkn2a) was significantly downregulated in Mfn1/2 knockdown cells compared with WT cells (Supplementary Figures s5b and c). Similarly, the expression of p53 and p21 protein was markedly downregulated in Mfn1- and 2-KO cells compared with WT cells (Figure 5a), and Mfn1/2 expression was reciprocally suppressed during the reprogramming of p53- and 21-KO cells compared with WT cells (Figure 5b). The suppression of either Mfn1/2 (Figures 3a, b, and e) or p53/p21 (Figures 1a–c) was sufficient to achieve the efficient reprogramming of somatic cells into iPSCs. Conversely, either the pharmacological reactivation of p53 or the overexpression of Mfn1 effectively blocked the iPSC reprogramming promoted by Mfn1/2 (Figure 5c) or by p53 and p21 ablation (Figure 5d). Overexpression of Mfn1 partially restored mitochondrial fusion, even in the p53- and 21-KO background (Supplementary Figure s6), although there was no change in the Mfn2 level (Figure 5b). These findings suggest the presence of cross-talk between Mfn1/2 and p53/p21 signaling during the reprogramming process. It is already well established that Mfn2 is a direct p53-inducible target gene,16 and that Mfn2 and Mfn1 (which shares a high degree of homology with Mfn2) directly bind Ras and Raf, resulting in the inhibition of cell proliferation via sequestration of Ras-Raf-ERK signaling.17, 18 Under our experimental conditions, we observed a dramatic increase in the levels of phosphorylated Raf, ERK, PI3K, Akt, and mTOR proteins in the reprogramming intermediates of Mfn1/2 knockdown cells on D7 of reprogramming (Figure 5e). Moreover, the expression of HIF1α, which is a downstream effector of mTOR and an important metabolic target of a glycolytic shift, appeared during the early reprogramming process,19, 20 and a downstream target of HIF1α, that is, lactate dehydrogenase isoform A (LDHA),21 was also significantly increased at the protein level in the reprogramming intermediates of Mfn1/2 knockdown cells at D7 of reprogramming (Figure 5e). Likewise, an increase in the expression of HIF1α and its target Glut1 at the gene level was detected in the reprogramming intermediates of Mfn1/2 knockdown cells at D7 of reprogramming (Figure 4b). Given evidence that reactive oxygen species (ROS) stabilize HIF1α,22 we examined the cellular ROS production and expression of HIF1α upon ROS scavenger treatment in Mfn1/2 knockdown cells. The ROS levels were significantly increased in Mfn1/2 knockdown cells compared with the control (Figure 5f), and treatment with the ROS scavenger N-acetylcysteine attenuated the ROS levels (Supplementary Figure s7a) and markedly reduced the HIF1α levels (Figure 5g) in both Mfn1/2 knockdown cells. The increased reprogramming efficiency caused by Mfn1/2 knockdown was also decreased by N-acetylcysteine treatment (Supplementary Figure s7b). More direct evidence that HIF1α knockdown using shRNA resulted in the prevention of increased LDHA expression (Figure 6a), lactate production (Figure 6b), and efficiency of reprogramming (Figure 6c) in Mfn1/2 knockdown cells. Taken together, these results demonstrate that during the early stage of reprogramming, reciprocal inhibition of the Mfn1/2 and p53/p21 pathways activates Ras-Raf signaling and leads to ROS-mediated HIF1α stabilization (Figure 5h), indicating that it is possible to mimic hypoxic conditions, which are favorable for efficient reprogramming.23
Figure 5.
Reciprocal inhibition of p53/p21 and Mfn1/2 activates the Ras-Raf-HIF1α pathway. (a) WT, Mfn1−/−, and Mfn2−/− MEFs were reprogrammed via retroviral transduction of OSKM in the absence and presence of 25 μM Nutlin3a, an MDM2 inhibitor that stabilizes p53. Western blot analysis of p53 and p21 on D11 of reprogramming. (b) WT, p53−/−, and p21−/− MEFs were reprogrammed via retroviral transduction of OSKM with or without retroviral Mfn1 overexpression. Western blot analysis of Mfn1/2 on D11 of reprogramming. (c and d) Representative images of AP+ colonies (top and middle) and the total numbers of AP+ colonies (bottom) were obtained in each indicated group. (e) Western blot analysis of the indicated Ras-Raf signaling proteins in MEFs transduced with OSKM and Mfn1/2 shRNAs on D7 of reprogramming. (f) Cellular ROS levels in MEFs transduced with OSKM and Mfn1/2 shRNAs on D7 of reprogramming. (g) Western blot analysis of HIF1α in Mfn1/2 knockdown reprogramming cultures absence and presence of indicated concentration of N-acetylcysteine. (h) Model showing the activation of Ras-Raf-HIF1α signaling and ROS-mediated HIF1α stabilization in Mfn1/2-depleted cells. β-actin was used as an internal control. The data are presented as the mean±S.E. (n=3). *P<0.05; **P<0.01 (Student's t-test)
Figure 6.
Increased glycolysis and reprogramming by Mfn1/2 knockdown is HIF1α-dependent. (a) MEFs were transduced with OSKM and the indicated shRNAs. Western blot analysis was performed on D7 of reprogramming. β-actin was used as an internal control. (b) Lactate production was determined in the cell lysates of each group. (c) Representative images of AP+ colonies (top and middle) and the total numbers of AP+ colonies (bottom) were obtained in each indicated group. The data are presented as the mean±S.E. (n=3). *P<0.05; **P<0.01; ***P<0.001 (Student's t-test)
Hypoxia decreases Mfn1/2 expression, and compounds that inhibit Mfn1 expression facilitate pluripotency acquisition and maintenance
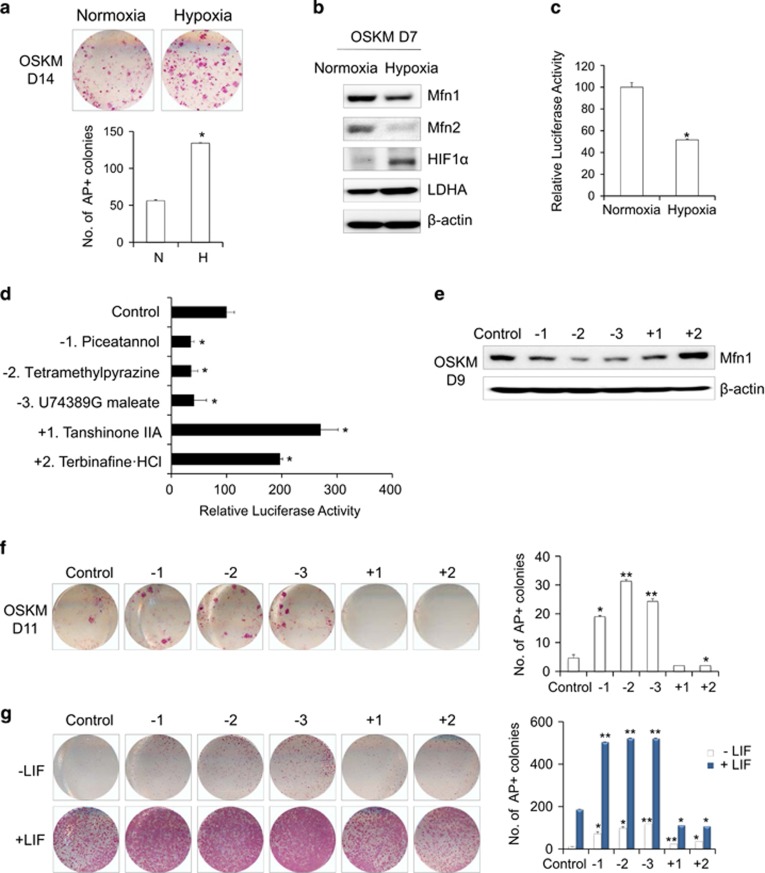
Although the mode of action is not fully understood, it is known that hypoxic conditions and HIF1α enhance somatic cell reprogramming.20, 23 We also observed a significant increase in iPSC generation (Figure 7a) and a related increase in the HIF1α and LDHA proteins under hypoxic conditions (Figure 7b). Under the same conditions, the promoter activity of Mfn1 was significantly downregulated (Figure 7c), and the expression of Mfn1/2 protein was markedly decreased (Figure 7b). These findings suggest that the effects of Mfn1/2 on reprogramming are closely related to the HIF1α-dependent induction of hypoxia-mimicking conditions, possibly via modulation of the cross-talk between key components that are involved in the regulation of p53-dependent signaling and a metabolic switch to glycolysis. Thus, Mfn1/2 downregulation can be an efficient and easy way to switch the cell fate to pluripotency. In an attempt to further understand the role of Mfn in reprogramming and achieve better reprogramming, we screened chemicals with the aim of altering the promoter activity of Mfn1 using 84 focused redox library compounds (Figure 7d). The top three downregulated hits and the top two upregulated hits controlling Mfn1 promoter activity were identified (Figure 7d). In accordance with Mfn1 promoter activity, the expression of the Mfn1 protein was down- or upregulated after treatment with the selected top hit compounds during reprogramming (Figure 7e). Chemicals showing no effect on Mfn1 promoter activity did not alter Mfn1 protein expression (data not shown). Notably, compounds that inhibited Mfn1 promoter activity enhanced the reprogramming efficiency of both mouse (Figure 7f) and human (Supplementary Figure s8a) somatic cells, whereas compounds that stimulated Mfn1 promoter activity blocked reprogramming (Figure 7f and Supplementary Figure s8a). Inhibitors of Mfn1 promoter activity were also beneficial for the maintenance of both mouse (Figure 7g) and hESCs (Supplementary Figure s8b) in an undifferentiated state. It is worth noting that treatment with Mfn1-inhibiting compounds increased the ROS levels, whereas Mfn1-increasing compounds did not (Supplementary Figure s9). Therefore, the redox imbalance caused by Mfn1 depletion may partially contribute to the control of cell fate. Collectively, these findings demonstrate that Mfn1/2 constitute a novel barrier to reprogramming and that their ablation is advantageous for pluripotency acquisition and maintenance (Figure 8).
Figure 7.
Hypoxia decreases Mfn1/2 expression, and chemicals that inhibit Mfn1 expression promote the acquisition and maintenance of stem cell fate. (a) MEFs were reprogrammed via the retroviral transduction of OSKM under normoxia (N) and hypoxia (H, 5% O2). Representative images of AP+ colonies (top). The total number of AP+ colonies was counted on D11 (bottom). (b) Western blot analysis of Mfn1/2, HIF1α, and LDHA on D7 of reprogramming in cultures under normoxia and hypoxia. (c) Mfn1 promoter activity was determined in Mfn1−/− MEFs stably expressing an Mfn1 promoter reporter construct after 48 h of normoxic or hypoxic culture. (d) Relative luciferase activity was determined in Mfn1−/− MEFs carrying the Mfn1 promoter reporter, at 48 h after treatment with 84 redox library compounds. The top three downregulated (−1, −2, and −3) and the top two upregulated (+1 and +2) hits controlling Mfn1 promoter activity are presented. (e) MEFs were reprogrammed via retroviral transduction of OSKM together with treatment with the selected top hits, and Mfn1 protein expression was determined on D9 of reprogramming by western blot analysis. (f) Representative images of AP+ colonies were obtained (left) and the total number of AP+ colonies was counted (right) on D11 of reprogramming under treatment with the selected top hits. (g) J1 mESCs were cultured with (+ self-renewing condition, bottom left) or without LIF (− non-self-renewing condition, top left). Representative images of AP+ colonies were obtained (left) and the total number of AP+ colonies was counted (right) on D5 under treatment with the selected top hits. β-actin was used as an internal control. The data are presented as the mean±S.E. (n=3). *P<0.05; **P<0.01 (Student's t-test)
Figure 8.
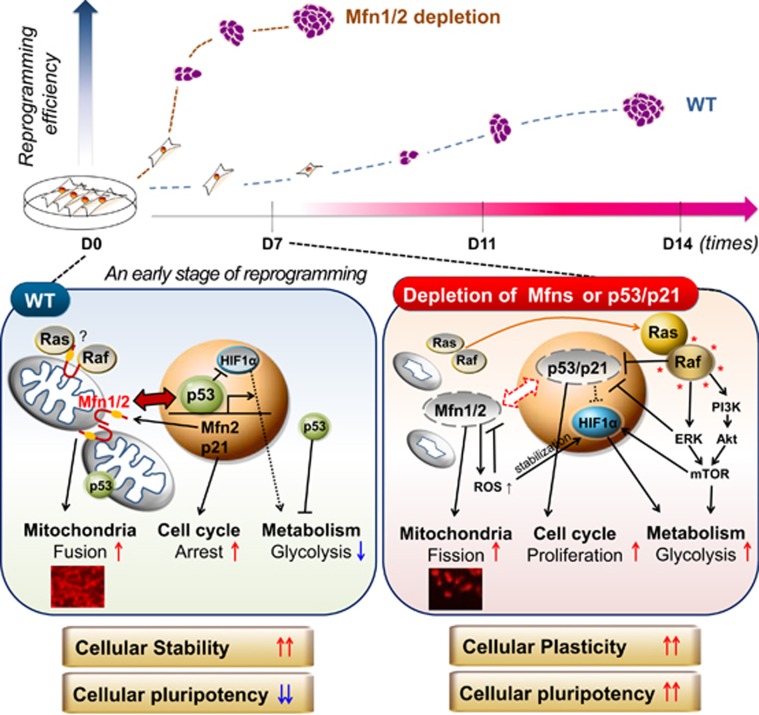
Proposed model for the control of cellular stability and plasticity via the reciprocal interaction of the p53/p21 and Mfn1/2 pathways. Depletion of Mfn1/2 promoted somatic cell reprogramming (top), which increases plasticity, allowing reprogramming barriers, such as mitochondrial fusion, cell cycle arrest, and/or failure of metabolic reprogramming, to be overcome (bottom)
Discussion
Increasing evidence suggests that the roles that originally ascribed to mitochondrial structural proteins in controlling mitochondrial dynamics and energy production emphasize their integrating roles, particularly in relation to cell fate transition. Here, we demonstrate a novel comprehensive role of Mfn1/2 in the cellular reprogramming process. Depletion of Mfn1/2 leads to the inhibition of the p53-p21 pathway, another key barrier to reprogramming. This reciprocal inhibition provides more favorable reprogramming conditions for a transition from the somatic to the pluripotent state via facilitating the induction of the following: (i) a distinct stem cell-like mitochondrial structural background with low levels of mitochondrial fusion proteins, such as Mfn1/2; (ii) a defective cell cycle checkpoint; and (iii) transition from oxidative to glycolytic metabolism attributed by Ras-Raf activation and subsequent HIF1α stabilization (Figure 8). Therefore, WT cells carrying Mfn1/2 and p53/p21 stand as a barrier in the fate transition and maintain cellular stability, whereas in Mfn1/2- or p53/p21-KO cells, cellular plasticity is permitted (Figure 8).
Mfn1/2 depletion, which triggers a loss of mitochondrial function via downregulation of the expression of genes related to mitochondrial energy metabolism (Supplementary Figure s5a), induces HIF1α stabilization (Figures 5e–h), which is a necessary mediator of the metabolic switch to glycolysis, and the consequent reprogramming of cellular metabolism (Figure 4). In accordance, our previous data demonstrated that interference with mitochondrial bioenergetics using canonical mitochondrial inhibitors can fuel reprogramming to pluripotency via facilitation of the glycolytic transition.24 Hypoxia is not sufficient to induce pluripotency20 but provides permissive conditions for cell fate changes, such as a tumor microenvironment and stem cell niche. Mfn depletion is clearly beneficial for iPSC generation (Figure 5c); however, Mfn depletion alone fails to induce pluripotency (data not shown). Hence, it is conceivable that downregulation of mitochondrial fusion proteins sustains a reinforcement loop in cooperation with Ras-Raf signaling. Metabolically reprogrammed cells, as a requisite event, are then conferred selective advantages in proceeding to the later stages of reprogramming toward induced pluripotency. Here, we also note that a transcriptional increase in HIF1α (Figures 4a and b) was stabilized by increased ROS in Mfn1/2 knockdown cells, even under the normoxic condition (Figures 5e–g). In addition, regardless of their anti-oxidant roles, compounds leading to a ROS increase suppressed Mfn1 expression (Supplementary Figure s9) and were effective in acquiring and maintainining stemness (Figures 7f and g and Supplementary Figure s8). Therefore, a redox imbalance caused by Mfn depletion, or vice versa, may be a mechanism leading to cellular plasticity, with ROS acting in part as a signaling molecule to stabilize HIF-1α (Figure 8).
Outer mitochondrial membrane fusion is performed by homo- and heterodimers between Mfn1 and Mfn2.25, 26 Notably, Mfn1-KO cells are more efficient for iPSC generation than are Mfn2-KO (Figures 3e and 5c). It is possible that these proteins play distinct roles in reprogramming processes in addition to mitochondrial fusion. Mfn1 positively regulates mitochondrial antiviral signaling protein (MAVS)-mediated antiviral responses, whereas Mfn2 plays an opposing role in viral innate immunity.27 Therefore, we questioned whether retroviral OSKM particles could be easily used to infect Mfn1-KO MEFs, owing to abolishing innate antiviral immunity. However, the retroviral transduction efficiency of red fluorescence protein was not considerably different between Mfn1- and Mfn2-KO MEFs (data not shown), indicating that the promoting effect of Mfn1-KO on iPSC generation is independent of the function of Mfn1 in mitochondrial antiviral immunity. Although we did not observe the reprogramming process in the presence of a complete fusion defect induced by Mfn1/2-double KO, given the major role of Mfn1 in mitochondrial tethering,25 mitochondrial fusion and subsequent bioenergetic competence are more likely to be important than other functions. Our data also indicated that the overexpression of Mfn1 alone could partially restore the mitochondrial fusion phenotype (Figure 5b and Supplementary Figure s6) and inhibit the increase in reprogramming efficiency caused by p53- and p21-KO (Figure 5d). Thus, we suggest that Mfn1 is a translational target to control cell fate.
Prolonged disruption of mitochondrial fusion-fission dynamics is detrimental to cellular function,25, 28 and temporally gating the inhibition of Mfn expression may thus be a safe method for achieving fine control of cell fate transition. Notably, the top Mfn1-inhibiting compound identified in this work, piceatannol (Figure 7d), has been confirmed to facilitate Drp1-dependent mitochondrial fission.29 In this regard, developing selective compounds such as Mfn-targeting inhibitors that control mitochondrial dynamics without affecting basal mitochondrial functions is of great interest, and such compounds could be applied to the treatment of diseases that are accompanied by mitochondrial dysfunction, including neurodegenerative disorders, aging, and cancer.
Overall, restructuring mitochondrial dynamics and bioenergetics provides adaptive power for somatic cell reprogramming, which promotes the acquisition and maintenance of stem cell fate. We suggest a link between the mitochondrial structural proteins Mfn1/2 and the p53/p21 pathways during early reprogramming and propose the mitochondria as a central gateway for the systemic reconfiguration of cellular stability and the control of plasticity (Figure 8). The promotion of mitochondrial reprogramming via Mfn1/2 or p53/p21 knockdown can initiate a switch in changing cellular status. Continued investigation of the interrelationships between nuclear/cytoplasmic/mitochondrial p53 and Mfn, Mfn regulation and pluripotency induction, mitophagy, ER stress, and Ca2+ signaling will help further elucidate the mitochondrial functions involved in controlling cell fate transition.
Materials and Methods
Reagents
Mdivi1, 2-deoxy-D-glucose (2-DG), and lentiviral vectors expressing each shRNA for gene knockdown were purchased from Sigma (St. Louis, MO, USA). siRNAs used for Mfn1/2 knockdown were purchased from Dharmacon (Lafayette, CO, USA). Nutlin3a was purchased from Cayman Chemical Co (Ann Arbor, MI, USA). A Screen-Well REDOX library was purchased from Enzo Life Sciences (Farmingdale, NY, USA).
Mice and cell culture
All animal experimental protocols were approved by the bioethics committee of KRIBB. MEFs were isolated from embryonic day 12.5 embryos obtained from WT, p53-KO, or p21-KO mice (The Jackson Laboratory, Bar Harbor, ME, USA) and maintained in DMEM (Invitrogen, Grand Island, NY, USA) supplemented with 10% fetal bovine serum (Invitrogen), 1% non-essential amino acids (NEAA, Invitrogen), 0.1 mM β-mercaptoethanol (Sigma), and 1% penicillin/streptomycin (Invitrogen). The mouse ESC line J1 (ATCC, Manassas, VA, USA) and iPSC lines were routinely maintained on γ-irradiated MEFs or Matrigel (BD Biosciences, Franklin Lakes, NJ, USA)-coated plates in DMEM (Invitrogen) supplemented with 15% fetal bovine serum, 1% NEAA, 1% L-glutamine (Invitrogen), 20 mM HEPES (Invitrogen), 0.1 mM β-mercaptoethanol, 1% penicillin/streptomycin, and 1000 U/ml LIF (Millipore, Billerica, MA, USA). The culture medium was changed every other day. Human H9 ESC lines (WiCell Research Institute, Madison, WI, USA) were routinely maintained on γ-irradiated MEFs in hESC culture medium (unconditioned medium; UM) or Matrigel-coated plates in MEF-CM (conditioned medium) as previously described.30 The culture medium was changed daily, and cells were passaged every 5–7 days following collagenase IV (1 mg/ml; Invitrogen) or dispase (1 mg/ml; Invitrogen) treatment. Human foreskin fibroblasts (ATCC) were maintained in DMEM containing 10% fetal bovine serum, 1% NEAA, 1 mM L-glutamine, and 0.1 mM β-mercaptoethanol.
Virus production and iPSC generation
GP2-293 packaging cells were co-transfected with pMX vectors containing the human cDNAs for Oct4 (POU5F1), Sox2, Klf4, and c-Myc (OSKM, Addgene, Cambridge, MA, USA) and the VSV-G envelope vector using Lipofectamine 2000 transfection reagent (Invitrogen). Virus-containing supernatants were collected at 48 and 72 h after transfection and concentrated via ultracentrifugation (Beckman Coulter, Brea, CA, USA) at 25 000 r.p.m. for 90 min. To generate iPSCs, MEFs were seeded at 1 × 10⁵ cells per well in 6-well plates the day before transduction and were subsequently transduced with concentrated virus at a multiplicity of infection of 1 in the presence of Polybrene (8 μg/ml). Four days after transduction, the MEFs were trypsinized and reseeded at a density of 3 × 10⁴ cells per well in Matrigel-coated 12-well plates. On the next day, the medium was replaced with mouse ESC medium, and the medium was changed every other day thereafter.
Alkaline phosphatase (AP) staining
AP staining was performed with a commercially available AP kit according to the manufacturer's protocol (Sigma). Cells were fixed with a citrate-acetone-formaldehyde solution for 30 s and then stained with AP staining solution (Naphthol/Fast Red Violet) for 15 min in the dark, as described previously.24 Images of AP+ cells were obtained with an HP Scanjet G4010 (Hewlett-Packard, Palo Alto, CA, USA).
RNA extraction, real-time polymerase chain reaction (PCR), and microarray analysis
Total RNA was isolated from cells with the RNeasy Mini Kit (Qiagen, Valencia, CA, USA) and reverse-transcribed with the SuperScript First-Strand Synthesis System Kit (Invitrogen) according to the manufacturers' protocols. Quantitative real-time PCR was performed with Fast SYBR Green Master Mix (Life Technologies, Grand Island, NY, USA) on a 7500 Fast Real-Time PCR System (Applied Biosystems, Waltham, MA, USA). The primer sequences used in these experiments are presented in Supplementary Table 1. Transcriptome analysis was conducted with Agilent (Santa Clara, CA, USA) Mouse Genome 44k Arrays.
Metabolome analysis
Cells were washed with a 5% mannitol solution (Wako, Osaka, Japan) and scraped in MeOH (Wako) containing internal standards. The aqueous layer was separated via centrifugation at 3200 r.p.m. for 10 min. Metabolite extracts were prepared using 5 kDa-cutoff ultrafilter tips (Millipore) at 9100 × g for 2.5 h, then evaporated in a centrifugal evaporator SCANVAC (Scientific Laboratory Supplies, East Riding of Yorkshire, England). Capillary electrophoresis time-of-flight mass spectrometry was conducted according to the recommended protocols (Human Metabolome Technologies, Yamagata, Japan).
Lactate and ATP assays
The intracellular lactate contents were quantified from 10 μg of protein using a Lactate Assay Kit (BioVision, Milpitas, CA, USA) according to the manufacturer's protocol. ATP was measured from 0.1 μg of protein using an ADP/ATP Ratio Assay Kit (Abcam, Cambridge, MA, USA). The luminescence intensity was quantified using a SpectraMax microplate reader (Molecular Devices, Sunnyvale, CA, USA).
Mitochondrial staining
Cells were fixed in 4% paraformaldehyde for 10 min at room temperature (RT) and then in MeOH for 15 min at −20 °C, after which they were permeabilized with 0.3% Triton X-100 in PBS for 30 min and blocked with 4% BSA for 2 h at RT. The samples were stained with the anti-Tom20 antibody diluted in blocking buffer at 4 °C overnight. After washing, the cells were stained with Alexa 488-conjugated secondary antibodies (Invitrogen) for 45 min at RT. The nuclei were counterstained with 10 μg/ml DAPI. For live cell imaging, the cells were incubated with 200 nM MitoTracker Red CMXRos (Invitrogen) for 30 min at 37 °C. Florescent images were captured under an IX51 microscope (Olympus, Shinjuku, Tokyo, Japan) or an Axiovert 200M microscope (Carl Zeiss, Oberkochen, Germany). The antibodies used in these assays are listed in Supplementary Table 2.
Cell sorting and mitochondrial morphology analysis
For magnetic cell sorting, single-cell suspensions of reprogramming cultures on day 11 were labeled with anti-Thy1-PE antibodies (BD Biosciences) for 20 min at RT, then incubated with anti-PE microbeads (Miltenyi Biotec, Bergisch Gladbach, Germany) for 15 min at 4 °C and sorted using a MACS separation system (Miltenyi Biotec), following the manufacturer's protocol. Thy1-negative populations were then labeled with anti-SSEA1 microbeads (Miltenyi Biotec) for 20 min at RT and sorted using MACS. To ensure a high purity of the sorted populations, we used two separation columns consecutively. The sorted cells were reseeded at a density of 3 × 10⁴ cells per well in Matrigel-coated 12-well plates or used for mitochondrial fractionation. Three days after reseeding, mitochondria were visualized via MitoTracker staining under a fluorescent microscope, and cell numbers were counted according to the observed mitochondrial morphology as fragmented/intermediate/fused. Over 30 cells per sorted subpopulation were scored.
Mitochondrial fractionation and western blot analysis
Mitochondria were fractionated from each MACS-sorted subpopulation using a mitochondria isolation kit (Thermo, Waltham, MA, USA), as per the manufacturer's protocol. For western blot analysis, whole-cell lysates were obtained using RIPA buffer, and proteins were separated via SDS-PAGE and electrotransferred to PVDF membranes (Millipore), as previously described.30 The antibodies used in these assays are listed in Supplementary Table 2.
Measurement of ROS levels
Reprogramming cultures were dissociated into single cells and stained with 2.5 mM CellRox Green (Life Technologies) for 30 min at 37 °C. Fluorescence was measured with a BD Accuri C6 flow cytometer (BD Biosciences).
Promoter assay and chemical screening
Mfn1-KO MEFs were stably transfected with an Mfn1 promoter reporter construct (Genecopoeia, Rockville, MD, USA) and then treated with the Screen-Well REDOX library of 84 compounds for 48 h. Mfn1 promoter activity was measured in culture supernatants with the Secrete-Pair Dual Luminescence and Gaussia Luciferase Assay Kits (Genecopoeia) using a SpectraMax microplate reader.
Statistics
The data are presented as the mean±S.E. (n=3). Student's t-test was applied to evaluate between-group comparisons. A value of P<0.05 was considered significant.
Acknowledgments
This work was supported by the National Research Foundation of Korea (NRF; 2010-020272(3), and 2012M3A9C7050224) and the KRIBB/NST research initiative program (NAP-09-3) grants funded by the Korea government (MSIP).
Author Contributions
Myung Jin Son: conception and design, collection and/or assembly of data, data analysis and interpretation, manuscript writing, final approval of manuscript. Youjeong Kwon: collection and/or assembly of data, data analysis and interpretation. Mi-Young Son, Hoon-Sung Choi, and Binna Seol: collection and/or assembly of data. Seung-Wook Ryu: conception and design, data interpretation, final approval of manuscript. Chulhee Choi: conception and design, final approval of manuscript. Yee Sook Cho: financial support, data analysis and interpretation, manuscript writing, final approval of manuscript.
Glossary
- 2-DG
2-deoxy-D-glucose
- AP
alkaline phosphatase
- CM
conditioned medium
- Drp1
dynamin-related protein 1
- ESCs
embryonic stem cells
- hESCs
human ESCs
- HIF1α
hypoxia-inducible factor 1α
- iPSC
induced pluripotent stem cell
- KO
knockout
- LDHA
lactate dehydrogenase isoform A
- MACS
magnetic-activated cell sorting
- MEFs
mouse embryonic fibroblasts
- Mfn1/2
mitofusin 1 and 2
- NEAA
non-essential amino acids
- OSKM
Oct4, Sox2, Klf4, and c-Myc
- OXPHOS
oxidative phosphorylation
- PSCs
pluripotent stem cells
- ROS
reactive oxygen species
- RT
room temperature
- UM
unconditioned medium
- WT
wild-type
The authors declare no conflict of interest.
Footnotes
Supplementary Information accompanies this paper on Cell Death and Differentiation website (http://www.nature.com/cdd)
Edited by DR Green
Supplementary Material
References
- Takahashi K, Yamanaka S. Induction of pluripotent stem cells from mouse embryonic and adult fibroblast cultures by defined factors. Cell 2006; 126: 663–676. [DOI] [PubMed] [Google Scholar]
- Theunissen TW, Jaenisch R. Molecular Control of Induced Pluripotency. Cell Stem Cell 2014; 14: 720–734. [DOI] [PMC free article] [PubMed] [Google Scholar]
- Buganim Y, Faddah DA, Cheng AW, Itskovich E, Markoulaki S, Ganz K et al. Single-cell expression analyses during cellular reprogramming reveal an early stochastic and a late hierarchic phase. Cell 2012; 150: 1209–1222. [DOI] [PMC free article] [PubMed] [Google Scholar]
- Kawamura T, Suzuki J, Wang YV, Menendez S, Morera LB, Raya A et al. Linking the p53 tumour suppressor pathway to somatic cell reprogramming. Nature 2009; 460: 1140–1144. [DOI] [PMC free article] [PubMed] [Google Scholar]
- Utikal J, Polo JM, Stadtfeld M, Maherali N, Kulalert W, Walsh RM et al. Immortalization eliminates a roadblock during cellular reprogramming into iPS cells. Nature 2009; 460: 1145–1148. [DOI] [PMC free article] [PubMed] [Google Scholar]
- Hong H, Takahashi K, Ichisaka T, Aoi T, Kanagawa O, Nakagawa M et al. Suppression of induced pluripotent stem cell generation by the p53-p21 pathway. Nature 2009; 460: 1132–1135. [DOI] [PMC free article] [PubMed] [Google Scholar]
- Guo S, Zi X, Schulz VP, Cheng J, Zhong M, Koochaki SH et al. Nonstochastic reprogramming from a privileged somatic cell state. Cell 2014; 156: 649–662. [DOI] [PMC free article] [PubMed] [Google Scholar]
- Lin T, Chao C, Saito S, Mazur SJ, Murphy ME, Appella E et al. p53 induces differentiation of mouse embryonic stem cells by suppressing Nanog expression. Nat Cell Biol 2005; 7: 165–171. [DOI] [PubMed] [Google Scholar]
- Brosh R, Assia-Alroy Y, Molchadsky A, Bornstein C, Dekel E, Madar S et al. p53 counteracts reprogramming by inhibiting mesenchymal-to-epithelial transition. Cell Death Differ 2013; 20: 312–320. [DOI] [PMC free article] [PubMed] [Google Scholar]
- Bieging KT, Mello SS, Attardi LD. Unravelling mechanisms of p53-mediated tumour suppression. Nat Rev Cancer 2014; 14: 359–370. [DOI] [PMC free article] [PubMed] [Google Scholar]
- Folmes CD, Nelson TJ, Martinez-Fernandez A, Arrell DK, Lindor JZ, Dzeja PP et al. Somatic oxidative bioenergetics transitions into pluripotency-dependent glycolysis to facilitate nuclear reprogramming. Cell Metab 2011; 14: 264–271. [DOI] [PMC free article] [PubMed] [Google Scholar]
- Prigione A, Fauler B, Lurz R, Lehrach H, Adjaye J. The senescence-related mitochondrial/oxidative stress pathway is repressed in human induced pluripotent stem cells. Stem Cells 2010; 28: 721–733. [DOI] [PubMed] [Google Scholar]
- Westermann B. Mitochondrial fusion and fission in cell life and death. Nat Rev Mol Cell Biol 2010; 11: 872–884. [DOI] [PubMed] [Google Scholar]
- Son MY, Choi H, Han YM, Cho YS. Unveiling the critical role of REX1 in the regulation of human stem cell pluripotency. Stem Cells 2013; 31: 2374–2387. [DOI] [PubMed] [Google Scholar]
- Vazquez-Martin A, Cufi S, Corominas-Faja B, Oliveras-Ferraros C, Vellon L, Menendez JA. Mitochondrial fusion by pharmacological manipulation impedes somatic cell reprogramming to pluripotency: new insight into the role of mitophagy in cell stemness. Aging 2012; 4: 393–401. [DOI] [PMC free article] [PubMed] [Google Scholar]
- Wang W, Cheng X, Lu J, Wei J, Fu G, Zhu F et al. Mitofusin-2 is a novel direct target of p53. Biochem Biophys Res Commun 2010; 400: 587–592. [DOI] [PubMed] [Google Scholar]
- Chen KH, Guo X, Ma D, Guo Y, Li Q, Yang D et al. Dysregulation of HSG triggers vascular proliferative disorders. Nat Cell Biol 2004; 6: 872–883. [DOI] [PubMed] [Google Scholar]
- Chen KH, Dasgupta A, Ding J, Indig FE, Ghosh P, Longo DL. Role of mitofusin 2 (Mfn2) in controlling cellular proliferation. FASEB J 2014; 28: 382–394. [DOI] [PMC free article] [PubMed] [Google Scholar]
- Prigione A, Rohwer N, Hoffmann S, Mlody B, Drews K, Bukowiecki R et al. HIF1alpha modulates cell fate reprogramming through early glycolytic shift and upregulation of PDK1-3 and PKM2. Stem Cells 2014; 32: 364–376. [DOI] [PMC free article] [PubMed] [Google Scholar]
- Mathieu J, Zhou W, Xing Y, Sperber H, Ferreccio A, Agoston Z et al. Hypoxia-inducible factors have distinct and stage-specific roles during reprogramming of human cells to pluripotency. Cell Stem Cell 2014; 14: 592–605. [DOI] [PMC free article] [PubMed] [Google Scholar]
- Wenger RH, Stiehl DP, Camenisch G. Integration of oxygen signaling at the consensus HRE. Sci STKE 2005; 2005: re12. [DOI] [PubMed] [Google Scholar]
- Chandel NS, McClintock DS, Feliciano CE, Wood TM, Melendez JA, Rodriguez AM et al. Reactive oxygen species generated at mitochondrial complex III stabilize hypoxia-inducible factor-1alpha during hypoxia: a mechanism of O2 sensing. J Biol Chem 2000; 275: 25130–25138. [DOI] [PubMed] [Google Scholar]
- Yoshida Y, Takahashi K, Okita K, Ichisaka T, Yamanaka S. Hypoxia enhances the generation of induced pluripotent stem cells. Cell Stem Cell 2009; 5: 237–241. [DOI] [PubMed] [Google Scholar]
- Son MJ, Jeong BR, Kwon Y, Cho YS. Interference with the mitochondrial bioenergetics fuels reprogramming to pluripotency via facilitation of the glycolytic transition. Int J Biochem Cell Biol 2013; 45: 2512–2518. [DOI] [PubMed] [Google Scholar]
- Chen H, Detmer SA, Ewald AJ, Griffin EE, Fraser SE, Chan DC. Mitofusins Mfn1 and Mfn2 coordinately regulate mitochondrial fusion and are essential for embryonic development. J Cell Biol 2003; 160: 189–200. [DOI] [PMC free article] [PubMed] [Google Scholar]
- Naon D, Scorrano L. At the right distance: ER-mitochondria juxtaposition in cell life and death. Biochim Biophys Acta 2014; 1843: 2184–2194. [DOI] [PubMed] [Google Scholar]
- West AP, Shadel GS, Ghosh S. Mitochondria in innate immune responses. Nat Rev Immunol 2011; 11: 389–402. [DOI] [PMC free article] [PubMed] [Google Scholar]
- Detmer SA, Chan DC. Functions and dysfunctions of mitochondrial dynamics. Nat Rev Mol Cell Biol 2007; 8: 870–879. [DOI] [PubMed] [Google Scholar]
- Farrand L, Byun S, Kim JY, Im-Aram A, Lee J, Lim S et al. Piceatannol enhances cisplatin sensitivity in ovarian cancer via modulation of p53, X-linked inhibitor of apoptosis protein (XIAP), and mitochondrial fission. J Biol Chem 2013; 288: 23740–23750. [DOI] [PMC free article] [PubMed] [Google Scholar]
- Son MJ, Son MY, Seol B, Kim MJ, Yoo CH, Han MK et al. Nicotinamide overcomes pluripotency deficits and reprogramming barriers. Stem Cells 2013; 31: 1121–1135. [DOI] [PubMed] [Google Scholar]
Associated Data
This section collects any data citations, data availability statements, or supplementary materials included in this article.


