Abstract
The Ebola virus disease (EVD) epidemic in West Africa is the largest on record, responsible for >28,599 cases and >11,299 deaths 1. Genome sequencing in viral outbreaks is desirable in order to characterize the infectious agent to determine its evolutionary rate, signatures of host adaptation, identification and monitoring of diagnostic targets and responses to vaccines and treatments. The Ebola virus genome (EBOV) substitution rate in the Makona strain has been estimated at between 0.87 × 10⁻³ to 1.42 × 10⁻³ mutations per site per year. This is equivalent to 16 to 27 mutations in each genome, meaning that sequences diverge rapidly enough to identify distinct sub-lineages during a prolonged epidemic 2-7. Genome sequencing provides a high-resolution view of pathogen evolution and is increasingly sought-after for outbreak surveillance. Sequence data may be used to guide control measures, but only if the results are generated quickly enough to inform interventions 8. Genomic surveillance during the epidemic has been sporadic due to a lack of local sequencing capacity coupled with practical difficulties transporting samples to remote sequencing facilities 9. In order to address this problem, we devised a genomic surveillance system that utilizes a novel nanopore DNA sequencing instrument. In April 2015 this system was transported in standard airline luggage to Guinea and used for real-time genomic surveillance of the ongoing epidemic. Here we present sequence data and analysis of 142 Ebola virus (EBOV) samples collected during the period March to October 2015. We were able to generate results in less than 24 hours after receiving an Ebola positive sample, with the sequencing process taking as little as 15-60 minutes. We show that real-time genomic surveillance is possible in resource-limited settings and can be established rapidly to monitor outbreaks.
Conventional sequencing technologies are difficult to deploy in developing countries, where availability of continuous power and cold chains, laboratory space, and trained personnel is restricted. In addition, some genome sequencer instruments, such as those utilising optical readings, for example the Illumina platform, require precise microscope alignment and repeated calibration by trained engineers 7,10. Recently, a new highly portable genome sequencer has become available. The MinION (Oxford Nanopore Technologies, Oxford, UK) weighs less than 100 grams. Data is read off the MinION from a laptop via a Universal Serial Bus (USB) port from which the instrument also draws power. The MinION works by taking high-frequency electrical current measurements as a single strand of DNA passes through a protein nanopore at 30 bases per second. DNA strands in the pore disrupts ionic flow, resulting in detectable changes in current dependent on the nucleotide sequence. Because the MinION detects single molecules it has a much higher error rate (between 10-20% 11,12) compared with high-throughput instruments that read clonal copies of DNA molecules. Single molecule sequencing has the advantage of being able to read extremely long molecules of DNA (50kb or longer 12,13) . In order to generate accurate sequences, genomic regions must be read many times, with errors eliminated through consensus averaging. This system has previously been used to investigate a bacterial outbreak, but not yet a viral outbreak 14.
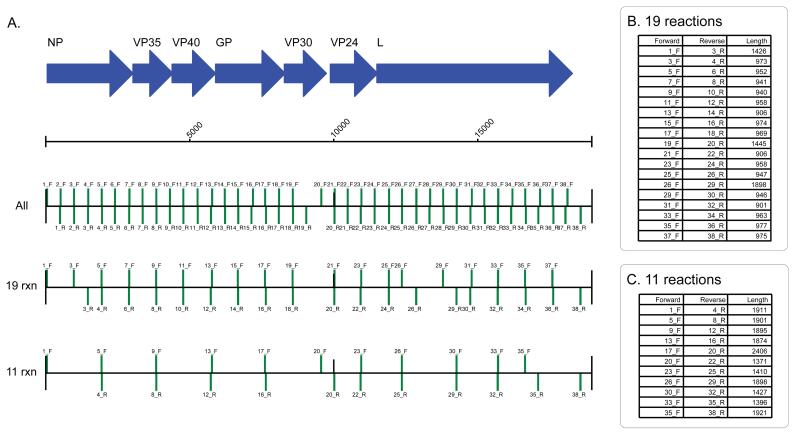
We designed a laboratory protocol to permit EBOV genome sequencing on the MinION that employed a targeted reverse transcriptase polymerase chain reaction (RT-PCR) in order to isolate sufficient DNA for sequencing. We considered and rejected an alternative approach; that of total RNA sequencing, as this approach also amplifies human-derived transcripts and dilutes viral signal 15. We designed a panel of 38 primer pairs that would span the EBOV genome (Extended Figure 1A, Supplementary Table 1). In pilot experiments at Defence Science and Technology Laboratory (Dstl) Porton Down, UK we sequenced a historic Zaire Ebolavirus using MinION as well as the Illumina MiSeq. Due to difficulties obtaining equal balancing of each of the 38 amplicon pairs only 65.7% of the EBOV genome was covered by at least 25 reads, compared with 87.4% on Illumina. However, nucleotide variants in those high covered regions were concordant with those obtained from Illumina sequencing, with the exception of a single variant in a homopolymeric region. MinION sequencing currently cannot easily resolve the length of homopolymers of 5 bases or greater 16.
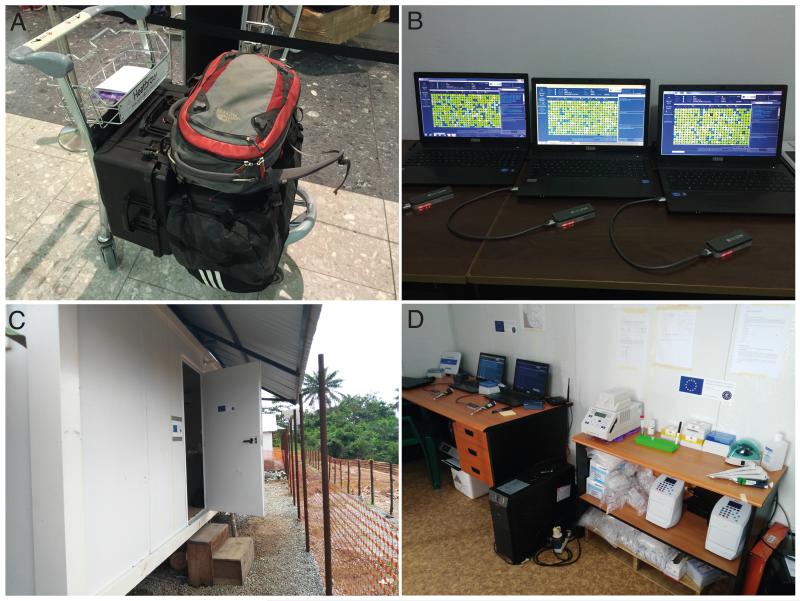
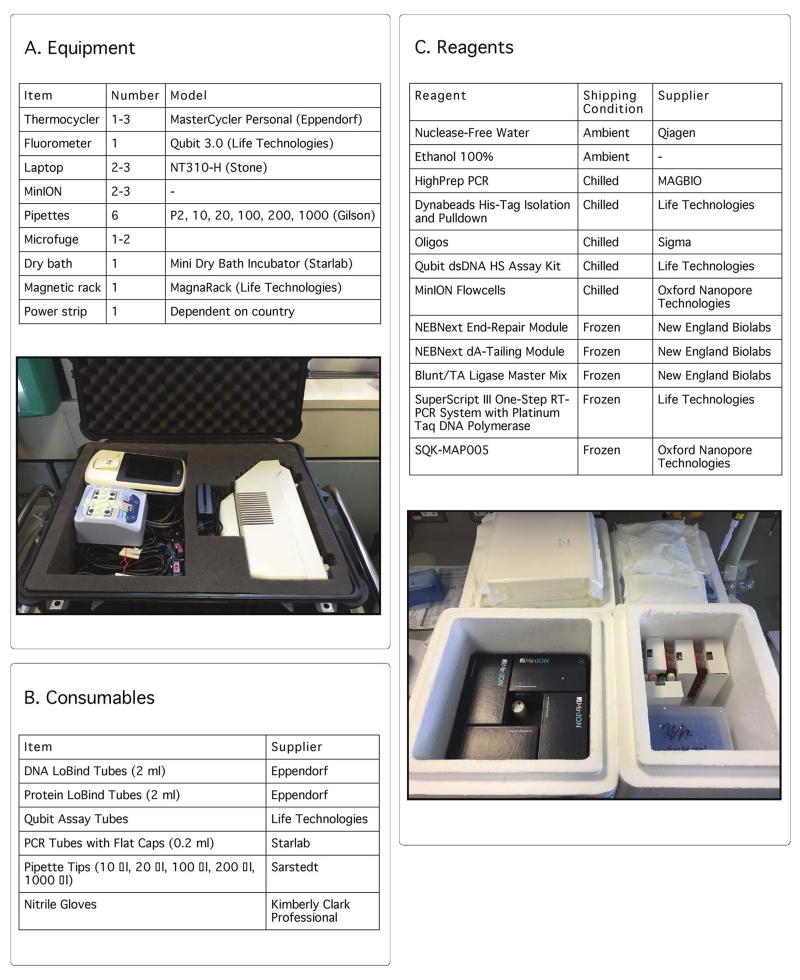
Next, we designed a genome surveillance system that could be transported to West Africa. The system consisted of three MinION instruments (Oxford Nanopore Technologies, UK), four laptops, a thermocycler, a heat block, pipettes and sufficient reagents and consumables to perform sequencing (a full list of equipment is shown in Extended Figure 2). We were able to pack this into <50kg of standard airline travel luggage (Figure 1A). We initially installed the genome surveillance system in the European Mobile Laboratory in Donka Hospital in Conakry, Guinea (Figure 1B). Later on, the equipment was moved to a dedicated laboratory, located within the Coyah Ebola Treatment Unit (Figure 1C and D).
Figure 1. Deployment of the portable genome surveillance system in Guinea.
We were able to pack all instruments, reagents and disposable consumables within aircraft baggage (Panel A). We initially established the genomic surveillance laboratory in Donka Hospital, Conakry (Panel B). Later we moved the laboratory to a dedicated sequencing laboratory in Coyah prefecture (Panel C). Within this laboratory (Panel D) we separated the sequencing instruments (on the left) from the PCR bench (to the right). An uninterruptable power supply can be seen in the middle which provides power to the thermocycler. (Photographs taken by Josh Quick and Sophie Duraffour.)
We started sequencing genomes within 2 days of arriving in Guinea. We found early on that we were able to reliably generate long amplicons (up to 2300 bases in length) using primer pairs (Supplementary Table 4) in different combinations (Extended Figure 1B and 1C). Using as few amplicons as possible significantly reduces effort when preparing samples. We found a combination of 11 amplicons that reliably amplified >97% of the EBOV genome.
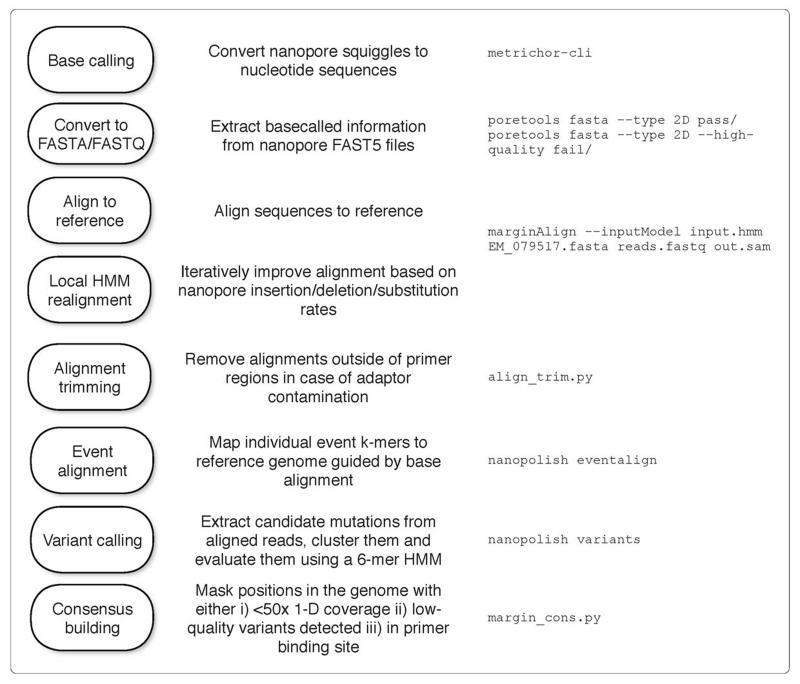
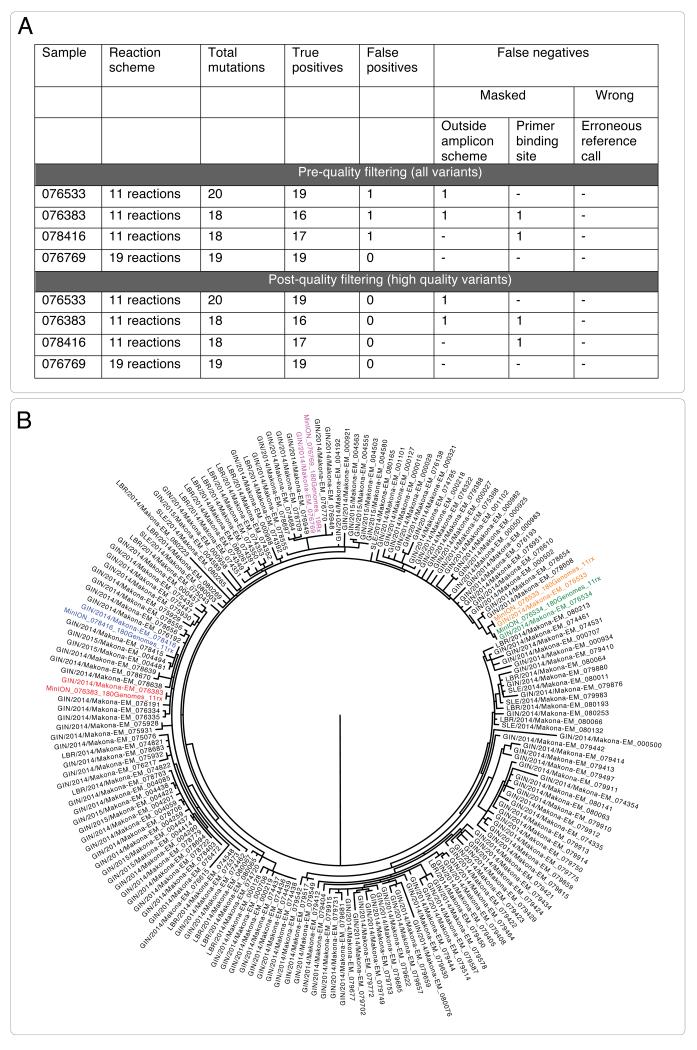
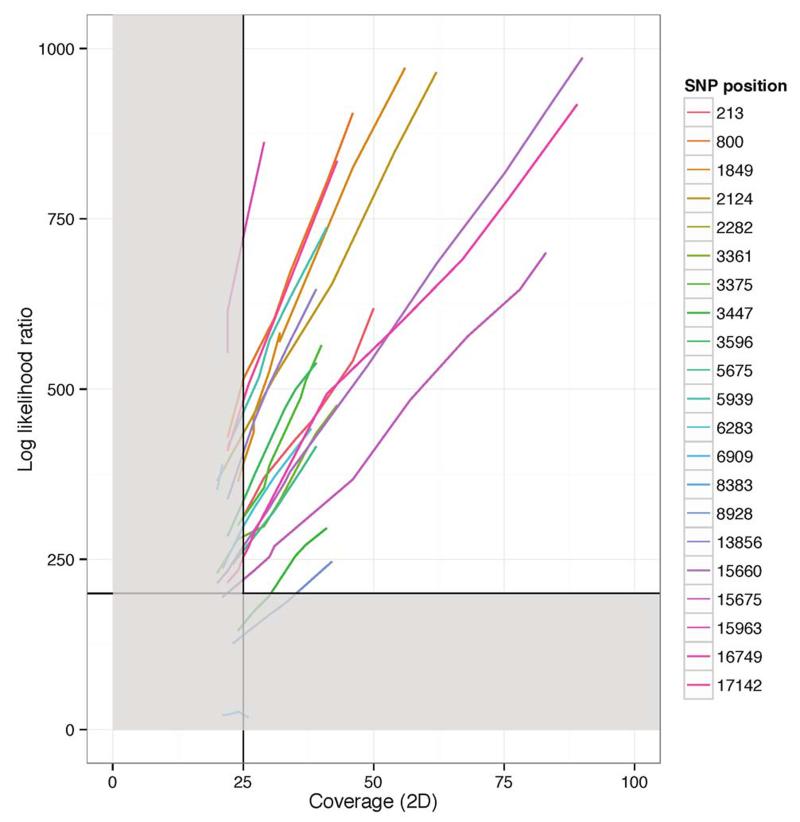
We developed a bioinformatics approach that would yield accurate genotypes, and validated this using Makona virus samples from a previous study 3. The bioinformatics workflow is detailed in the Online Methods and summarized in Extended Figure 3. This validation process demonstrated that our bioinformatics analysis approach was robust. We compared our consensus sequences to those generated using Illumina sequencing and found that our approach was highly concordant, with no false positive variant calls. In several cases, we were unable to determine variants because they fell either within the primer binding region, or they were outside of the regions of the EBOV genome covered by our amplicon set (Extended Figure 4 Panel A). These positions are represented as ambiguous nucleotides in the final consensus sequences used for analysis. Despite these masked positions, phylogenetic inference determined that samples clustered identically (Extended Figure 4 Panel B). We determined that, despite the instrument’s high error rate, use of electrical current information meant that 25-fold read coverage of genome positions was sufficient to determine accurate genotypes (Extended Figure 5).
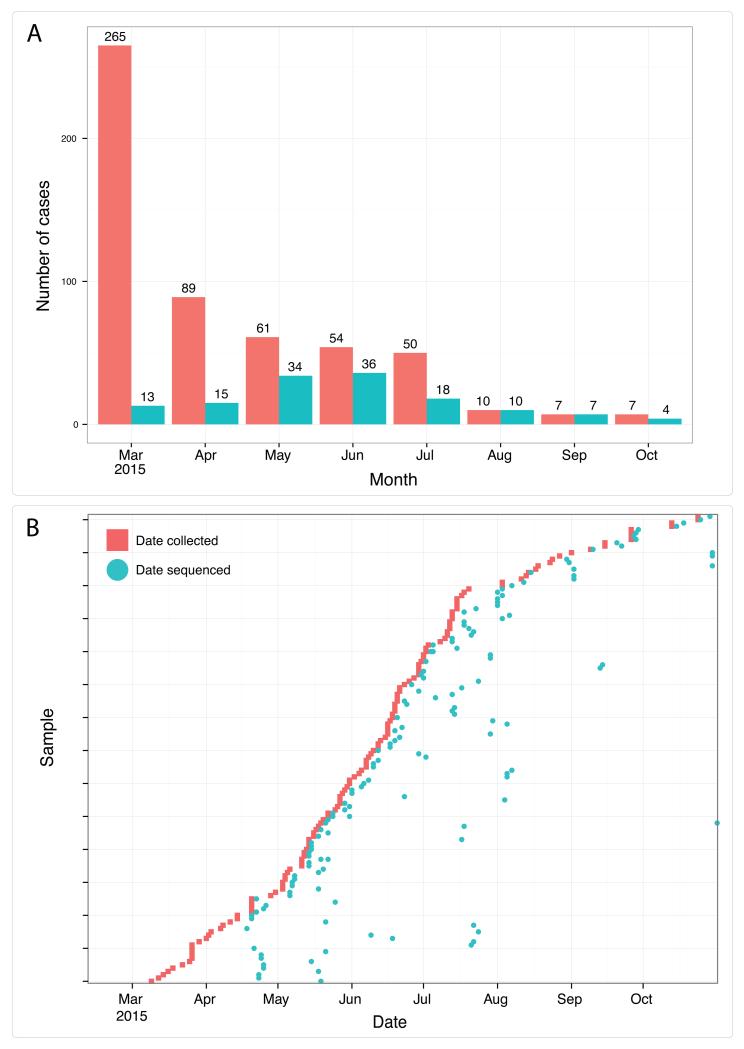
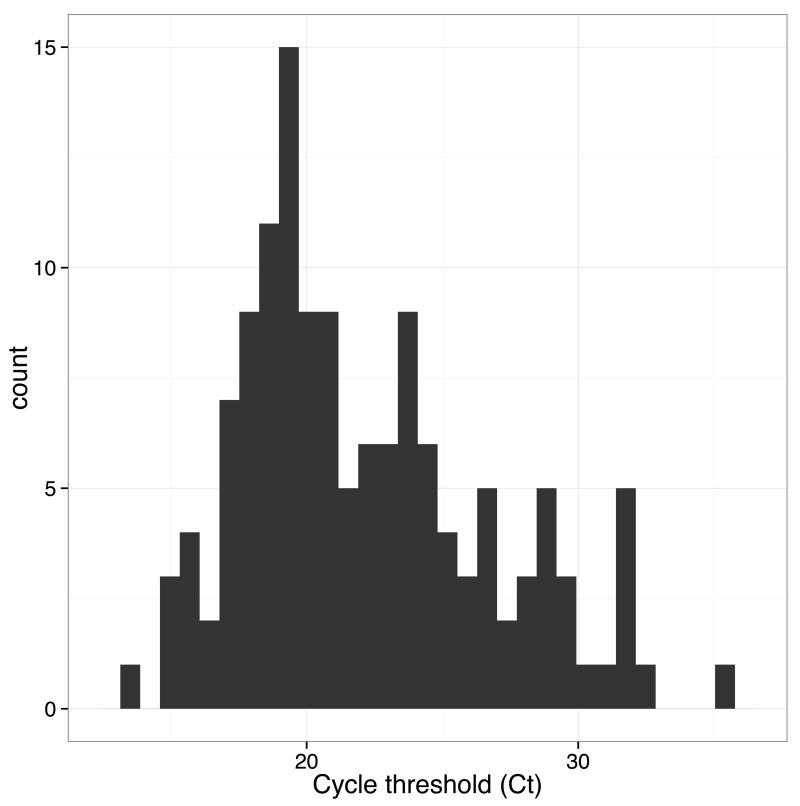
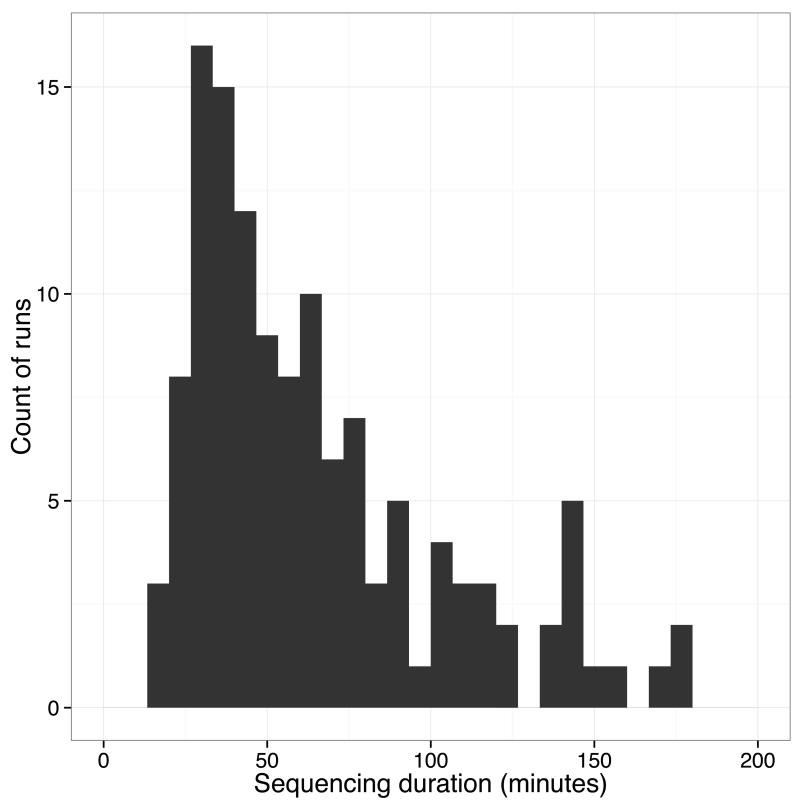
After deployment of the genome surveillance system, we worked in partnership with diagnostic laboratories in Guinea to provide real-time sequencing results to National Coordination in Guinea and the World Health Organisation. Collaborating laboratories provided leftover diagnostic RNA extracts for sequencing. The genome sequencing workflow including amplification, sequence library preparation and sequencing could be accomplished within a working day. In one case, including remote bioinformatics analysis, the fastest time from patient sample to answer was achieved in <24 hours (Supplementary Table 1) although the protocol was more usually performed over two working days. We found that in half of cases, we were able to generate sufficient reads on the MinION (between around 5000 and 10000) in less than an hour (Extended Figure 6). In total, 142 samples were sequenced over 148 MinION runs during the 6 month period, providing extensive coverage of reported cases in the outbreak (Figure 2). Full details of samples and runs are in the Supplementary Data. We failed to generate amplicons for some samples, resulting in missing regions of the genome. Such samples often corresponded to those with a high RT-PCR cycle threshold (Ct) value, suggestive of lower viral loads (Extended Figure 7). For these we used a modified RT-PCR scheme using 19 shorter amplicons. We assumed that difficulties generating long amplicons related to low numbers of starting molecules of that length in the original sample. We excluded 17 samples due to quality control issues, for example SNP calling sensitivity of less than 75%. We found that in-field performance of the system was comparable with validation experiments performed in the UK, suggesting that the system tolerated transportation well (Extended Figure 8).
Figure 2. Real-time genomics surveillance in context of the Guinea EVD epidemic.
Here we show the number of reported cases of EVD in Guinea (red) in relation to the number of EBOV new patient samples (n=137, in blue) generated during this study (Panel A). For each of the 142 sequenced samples, we show the relationship between sample collection date (red) and the date of sequencing (blue) (Panel B). Twenty-eight samples were sequenced within three days of the sample being taken, and sixty-eight samples within a week. Larger gaps represent retrospective sequencing of cases to provide additional epidemiological context.
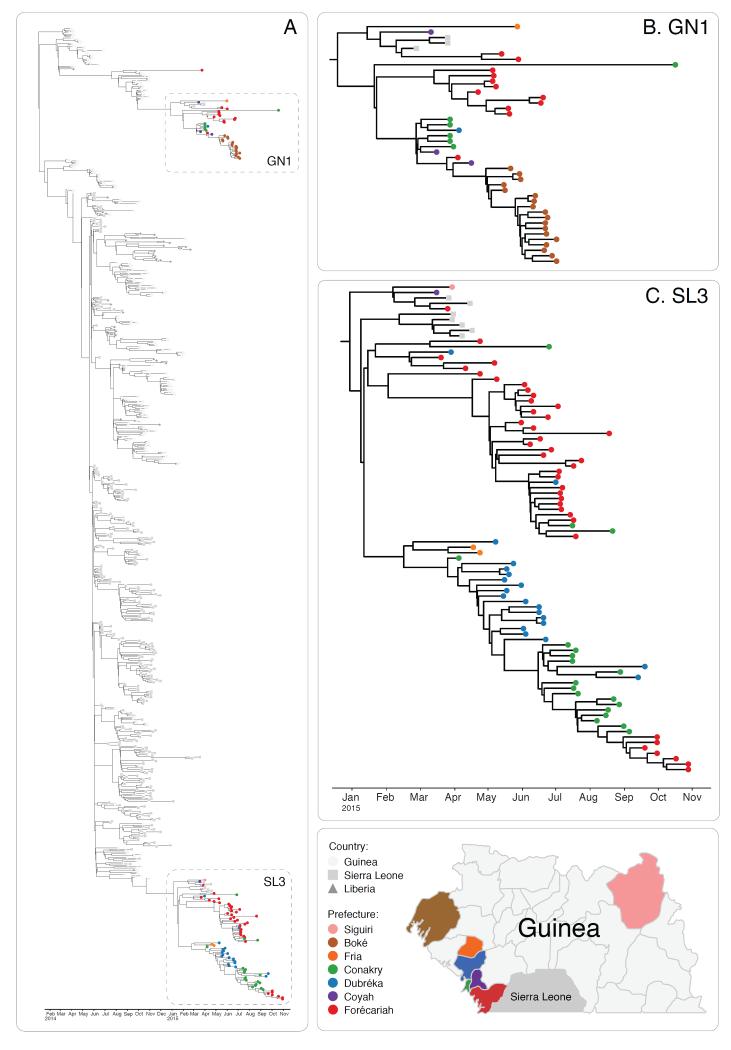
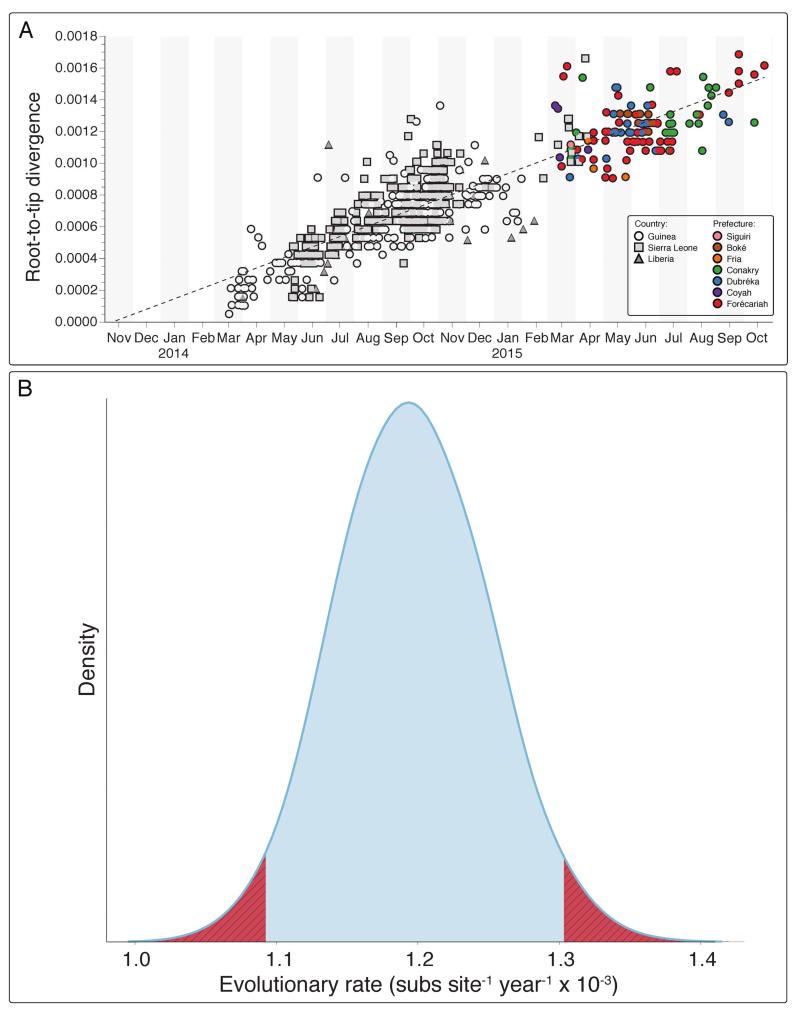
We combined our sequencing dataset with 603 samples from other studies and inferred a time-scaled phylogenetic tree using the BEAST software package (Figure 3). A Maximum Likelihood analysis and root-to-tip analysis showed good agreement between sampling date and root-to-tip divergence (Extended Figures 9 and 10A). We estimated a substitution rate of 1.19 × 10⁻³ (95% interval, 1.09 × 10⁻³, 1.29 × 10⁻³) of the combined dataset (Extended Figure 10B). This is consistent with rates from previous studies 2-7. Results generated within the first 10 days of starting real-time sequencing indicated that the persisting Guinean cases belonged to two major lineages, named GN1 and SL3, that had been established near the beginning of the epidemic (Figure 3). Lineage GN1 is deeply branching from early cases in Guinea and has been infrequently seen in Sierra Leone 2, suggesting that it has been largely confined to Guinea. The second lineage identified here was derived from lineage SL3 which was first detected in Sierra Leone by Gire et al., but was later seen circulating in Conakry towards the end of 2014 3. Through integration of our dataset with those generated by a different group operating in Sierra Leone we detected that both GN1 and SL3 had also been seen in Sierra Leone early in 2015, suggestive of transmission between the countries 17.
Figure 3. Evolution of EBOV over the course of the EVD epidemic.
Time-scaled phylogeny of 603 published sequences with 125 high quality sequences from this study (Panel A). The shape of nodes on the tree demonstrates country of origin. Our results show Guinean samples (coloured circles) belong to two previously identified lineages, GN1 and SL3. GN1 is deeply branching with early epidemic samples (Panel B). SL3 is related to cases identified in Sierra Leone (Panel C). Samples are frequently clustered by geography (indicated by colour of circle) and this provides information as to origins of new introductions, such as in the Boké epidemic in May 2015. Map figure adapted from SimpleMaps website (http://simplemaps.com/resources/svg-gn).
This work demonstrates a step change in our ability to perform genomic surveillance prospectively during outbreaks under resource-limited conditions. However, numerous obstacles remain before such genomically informed investigations are routine. In practical terms, we encountered significant logistical issues when performing this work, notably the absence of reliable, continuous AC power, forcing a dependence on unreliable electrical generators and uninterruptable power supplies (UPS) unit, particularly for the bulky PCR thermocyclers. However, portable, battery powered thermocyclers are in development, and isothermal approaches may be preferable for future work 18. By contrast, the MinION sequencer was unaffected by power outages and surges. We faced consistent issues with Internet connectivity, which is currently required for analysis. There is a pressing need for a fully offline version of the analysis presented here. This would reduce the dependence on high bandwidth connections. However it is likely that phylogenetic analysis will continue to be performed remotely (discussed further in the supplementary Field Guide to Portable Sequencing). In this analysis we focused on variant calling approaches. A de novo approach to analysis would be preferable, but this would currently result in insertion and deletion errors due to poor resolution of homopolymeric tracts on the MinION. Our approach relies on amplification of genetic material before sequencing. In other epidemics, where the causative pathogen may be unidentified this is a drawback due to the need to have a priori knowledge of the pathogen genome sequence. In this event, sequencing directly from clinical material may be better, although sensitivity issues persist 15.
Real-time genomic surveillance is a new tool in our arsenal to assist difficult epidemiological investigations, and to provide an international and environmental context to emerging infectious diseases. This may improve the efficiency of resource allocation and the timeliness of epidemiological investigations; through genomically informed investigations of transmission chains. It also increases the possibility of identifying previously unidentified chains of transmission. By integrating our dataset, in real time, with that of a second group performing sequencing in Sierra Leone we identified evidence of frequent transmissions across the border with Guinea. Crucially, we released data at regular intervals throughout this project through Github, integrating our results with that of others and interactively displayed at http://ebola.nextflu.org. We employed the Virological web forum to discuss complex cases (http://virological.org). This system will continue to support the West African epidemic response and will serve as a template for genomic surveillance of future outbreaks. The Ebola outbreak in West Africa is likely to be soon declared over. Future cases will raise pressing questions about links to previously infected individuals, such as in Liberia 19, or even the possibility of a new zoonotic spillover event. We are now poised to answer such questions quickly.
Online Methods
Ethics statement
The National Committee of Ethics in Medical Research of Guinea (permit N°11/CNERS/14) approved the use of diagnostic leftover samples and corresponding patient data for this study. As the samples had been collected as part of the public health response to control the outbreak in West Africa, informed consent was not obtained from patients.
Transportation
All equipment was loaded into a Pelican 1610 case (Pelican, Torrance, USA), cold chain reagents were packed into two polystyrene boxes with either ice or cool packs. These were sealed and placed in a holdall with the plastic consumables. Both pieces of luggage were flown by air as normal checked baggage.
RNA extraction
RNA was extracted from 50 μl whole blood, 140 μl serum, 140 μl of resuspended swab or 140 μl urine using the QIAamp Viral RNA Mini Kit (Qiagen, Manchester, UK), following the manufacturer’s instructions. Samples were inactivated by adding 560 μl of Buffer AVL (Qiagen) and 560 μl of 100% ethanol while still in a glove box, this method has been shown to inactivate EBOV in blood samples 20. Following inactivation, samples were handled on the bench employing standard laboratory safety precautions.
RT-PCR
Individual 25 μl RT-PCR reactions were performed using the SuperScript III One-Step RT-PCR System with Platinum Taq DNA Polymerase (Life Technologies Ltd., Paisley, UK). Each reaction was made up by adding 12.5 μl 2 × reaction mix, 1 μl enzyme mix, 1 μl primers (10 μM), 0.5 μl RNA extract and nuclease-free water. Thermocycling was performed on an Eppendorf Master Cyler Personal instrument with the following program: 60 °C for 30 mins, 94 °C for 2 mins followed by 45 cycles of 94 °C for 15 secs, 55 °C for 30 secs, 68 °C for 2 mins and a final extension of 68 °C for 5 min.
MinION library preparation
Each reaction was quantified on a Qubit 3.0 fluorimeter using the dsDNA HS assay (Life Technologies). Equimolar amounts of each amplicon product to a total DNA mass of 1 μg was pooled into a single tube and cleaned-up using an equal volume of MAGBIO HighPrep PCR beads (AutoQ Biosciences, Reading, UK). Pooled amplicons were diluted to 85 μl, and end-repaired in a total volume of 100 μl, using the NEBNext End Repair Module (New England Biolabs, Hitchin, UK) before being cleaned up using an equal volume of HighPrep PCR beads and eluting in 25μl nuclease-free water. 3′ dA-tailing was performed using the NEBNext dA-Tailing Module (New England Biolabs) in a volume of 30 μl, before being cleaned up using an equal volume of HighPrep PCR beads and eluting in 30μl nuclease-free water. 10 μl of ‘Adapter mix’ and 10 μl ‘HP adapter’ supplied in the SQK-MAP005 library preparation kit (Oxford Nanopore Technologies, Oxford, UK) were added to the dA-tailed amplicons along with 50 μl, Blunt/TA Ligase Master Mix (New England Biolabs) in a Protein LoBind tube (Eppendorf UK) and incubated for 10 minutes. The resulting sequencing library was purified using Dynabeads His-Tag Isolation and Pulldown beads (Life Technologies, Stevenage, UK) according the SQK-MAP005 protocol supplied by Oxford Nanopore Technologies as part of the MinION Access Program. The final library was quantified using the Qubit to confirm the process had been successful. 6 μl, of library was diluted using 75 μl ‘2x Running Buffer’, 66 μl Nuclease-free water (Promega UK, Chilworth, UK) and 3 μl, ‘Fuel Mix’.
MinION sequencing
A new flowcell was unpackaged and fitted onto the MinION device. The flowcell was primed with a blank sample created as described above, and left to incubate for 10 minutes. The priming process was repeated a second time before the sample was loaded. Running MinKNOW version 0.49.2.9 and starting the protocol ‘MAP_48Hr_Sequencing_Run.py’ initiated the sequencing run. An offline-capable version of MinKNOW, with internet ‘ping’ disabled and online updates disabled was made available to us by Oxford Nanopore Technologies specifically for the project (available on request from Oxford Nanopore Technologies).
Data transfer
With no method of offline analysis available for the majority of the outbreak period, there was a dependency on local internet connectivity to facilitate the upload of the raw FAST5 files produced by MinKNOW. A variety of methods were used depending on location and circumstances with the vast majority of the data being uploaded from the European Mobile Laboratories staff accommodation in Coyah via a mobile internet 3G hotspot (TP-LINK M5350 3G hotspot on the MTN mobile network). At times due to unknown factors the upload speed was limited to 2G and took significantly longer. Using Cygwin version 2.0.0 and the Linux tar command a compressed archive containing the first 5000 to 10000 .fast5 read files generated by each run was created. This was uploaded to a Google Drive shared directory. Eventually in Coyah we were provided access to a broadband connection (MTN network, 5Mb/sec, established by the World Food Program), which proved to be more reliable than mobile internet.
Data handling
Data was downloaded onto a Linux server on the MRC Cloud Infrastructure for Microbial Bioinformatics located in Birmingham, UK. Files were unpacked and basecalled using the Metrichor command-line interface and the workflow 2D Basecalling for MAP-005 (vrsions 1.14, 1.24 and 1.34). This software was provided by ONT (available on request) for the project in order to permit basecalling to be carried out through the Linux command line as part of a pipeline. The MinION generates one direction (1D) and two direction reads (2D). 2D reads are higher quality and were used for analysis. 2D reads that were in the pass filter folder and 2D reads designated as high-quality (due to having more complement events than template events) in the fail folder as determined by poretools were extracted into FASTA (for nanopolish) and FASTQ format (for marginAlign) with poretools version 0.5.1 21.
Bioinformatics analysis
We use a reference mapping approach to detect single nucleotide variants through alignment to a reference strain from early in the outbreak (EM_079517) 11. Due to the nature of the sequencing data, which is dominated by insertion and deletion errors, we do not attempt to call insertion or deletions 14. Variants were detected using the variants module of the nanopolish software package. Initial nucleotide base alignment was carried out with MarginAlign 12. Nanopolish then uses the event-level (‘squiggle’) data generated by the MinION to evaluate candidate variants found in the aligned reads as described in the following section. Variants with a log likelihood ratio of >200 and coverage depth of >50x (25x 2D coverage) are accepted and a consensus sequence is generated for each sample. Regions of uncertainty (for example in difficult to sequence homopolymeric regions or primer binding sites), or with low coverage (<50x, or 25x 2D coverage) are masked with an N character. Assuming sufficient genomic coverage is present over a specific amplified variant this approach gives a high true positive variant calling rate. However, failure of individual amplicons to amplify, or unbalanced coverage of regions may reduce this figure. This is assessed, on each individual sample, by artificially mutating the reference genome with 30 randomly chosen mutations. Mutated positions in the references should be detected as variants, using the simplifying assumption that these variants are unlikely to be present in the sample. Any positions not covered by the tiling amplicon scheme (i.e. the extreme 5′ and 3′ ends) are not considered in the true positive rate calculation. Each sample is therefore assigned a quality indicator. Those with a true positive rate (TPR, i.e. sensitivity) of >=75% are included in phylogenetic inferences. Samples with TPR <75% were not used for the phylogenetic analysis presented here.
Signal-based SNP calling
SNPs were called using the “variants” module from the nanopolish package (manuscript in preparation, https://github.com/jts/nanopolish, branch snp_calling_alternative_models, commit ID 25ea7bac3ab9e1d266079ac105ab2005cfa39a14).
The nanopolish variants program first finds candidate SNPs by finding mismatches between the aligned nanopore reads and the reference genome. These candidate SNPs are clustered into sets of nearby SNPs, an exhaustive set of candidate haplotypes are derived from the possible combinations of SNPs and the haplotype that maximizes the probability of the event-level data called as the sequence for region. We describe each step in detail below.
Candidate SNP generation
We iterate over the entire reference genome and examine positions covered by at least 20 nanopore reads. At these well-covered positions were considered any non-reference base that was seen in at least 20% of the nanopore reads to be a candidate SNP. These candidates were passed to the next stage of the pipeline.
Candidate haplotype generation
As the MinION sequencer does not measure single bases, but rather current signals dependent on a short sequence of nucleotides that are in the pore, we could not assess each SNP individually. Instead, we partitioned the set of candidate SNPs into groups whose signals may interact and overlap. We determined that SNPs separated by at least 10bp could be treated independently; therefore we partitioned the candidate SNP set into subsets of SNPs that are within 10bp of each. For each subset of candidate SNPs we exhaustively generated all possible haplotype sequences by including/excluding the individual SNPs in the subset. As the number of possible combinations of n SNPs is 2n, we had to discard subsets that contained more than 10 candidate SNPs or spanned a reference region greater than 100bp. For each derived haplotype sequence S, we calculate the likelihood of S using a modified version of the hidden Markov model (HMM) we previously described 16.
Haplotype likelihoods
The nanopolish HMM calculates the probability of observing a sequence of events emitted by the nanopore, which we denote as D, given an arbitrary sequence S. The structure of the HMM is as previously described but now allows events to be “soft-clipped” to better handle uncertainty about where the event-to-sequence alignment starts and ends. In addition, we incorporated a new model from Oxford Nanopore that models the event signals to be dependent on six base pair subsequences rather than five base pair subsequences. To use this model on SQK-MAP-005 data we calculated a global shift parameter (shift_offset) that rescales SQK-MAP-005 data to the 6bp emission functions. We otherwise did not train the emission functions, per-read scaling parameters or transition probabilities of our hidden Markov model.
Variant Calls
For each subset of candidate SNPs, the haplotype with the largest likelihood is called as the sequence for the region. The SNPs contained on the called haplotype (if any) are output in VCF format. The log likelihood ratio between the called haplotype and the reference haplotype (containing no SNPs) was output as the score for each variant to facilitate downstream filtering. Metadata such as the total depth of the region and the number of reads that support the called haplotype over the reference sequence is also output.
Validation experiments
Dstl Amplicons
Archived Zaire Ebolavirus was amplified using 38 primer pairs, giving approximately 500 base pair amplicons, according to the study protocol. As this work was prior to in-field sequencing, different versions of the MinKNOW software and Metrichor basecaller were used. Amplicons were sequenced by both MinION. An Illumina library was constructed from the same amplicon pool and tagmented using the Nextera XT library preparation kit. The library was sequenced on the Illumina MiSeq. Because of the huge excess of coverage generated, this dataset was subsampled to 400,000 paired reads before aligning to the EM_079517 reference sequence using BWA-MEM 22. After sorting and converting the resulting alignment to BAM using samtools, variants were determined using FreeBayes 23. A consensus sequence was generated using the vcf2fasta component of vcflib (https://github.com/ekg/vcflib). The MinION data was analysed as per the study methods, except for a modification to nanopolish to allow it to consider up to 15 variants per segment in order to account for the increased divergence between the genome and the reference. The MinION and Illumina consensus sequencs were aligned using the nucmer component of MUMMER and variants determined using the show-snps module 24. Scripts and documentation for this analysis are in the Github notebook Dstl validation.ipynb
180 Genome Analysis
Leftover RNA of six samples of RNA from a previously performed sequencing study 3 were processed at Public Health England Porton Down, as per the methods described in the manuscript. One sample did not yield any sequenceable products, so five genomes (EM_076534, EM_076533, EM_076383, EM_078416, EM_076769) were sequenced on MinION at PHE Porton Down. The 11 reaction scheme was used except for sample 076769 when the 19 reaction scheme was used. These sequences were compared with Illumina consensus sequences from the previously published dataset in Carroll et al. Variants were identified between the reference genome (EM_079517) and each of the successfully samples using the show-snps component of MUMMER 24. Variants detected by our pipeline were compared against expected variants, before and after quality filtering, using custom Python scripts deposited in the Github repository and documented in the IPython Notebook. A phylogeny was inferred using RaXML 25 including the consensus sequences from the validation set along with all of the consensus sequences from Carroll et al. MinION sequence accuracy rates for two-direction (2D) reads were determined using Aaron Quinlan’s count-errors.py script (http://github.com/arq5x/nanopore-scripts) as described in Quick et al. 11. Scripts and documentation for this analysis are in the Github notebook: Examine validation runs.ipynb
Analysis of SNP calling sensitivity
Reads were subsampled at collection time intervals using the poretools times command 21, simulating the order reads are obtained by real-time sequencing on the nanopore, to demonstrate the effect of coverage on SNP calling sensitivity and log likelihood ratio.
Analysis of samples from the same patient
Samples were analysed as part of the real-time surveillance work. The consensus sequences from four pairs of samples each from four individuals were generated. Each pair was compared individually using the show-snps module of MUMmer to investigate differences.
Detection of putative transmission events from Sierra Leone
We downloaded the 74 genome sequences made available on Virological.org (http://virological.org/t/direct-deep-sequencing-in-sierra-leone-yields-73-new-ebovgenomes-from-february-may-2015/134 and aligned them against sequences from our analysis using MUSCLE 26. We then generated a phylogenet ) ic tree using FastTree 2 with the GTR model 27. Any sequences that fell into the GN1 or SL3 lineages were included in future analysis.
Phylogenetic inferences
Consensus sequences from real-time sequencing were aligned with previously published genome sequences from Guinea, Sierra Leone and Liberia 7. To address the over-representation of Sierra Leone sequences in this set we randomly down-sampled available sequences, resulting in a total of 313 sequences from Sierra Leone. Maximum-likelihood trees are produced using RAxML 8.2.3 using the GTRGAMMA model and 200 bootstrap replicates 25. Time-scaled trees were produced with BEAST v1.8.2 28using a HKY+gamma substitution model 29,30 partitioned by first, second and third codon positions and intergenic regions, a Skygrid tree prior 31 and an uncorrelated lognormal clock 32, and an uninformative prior on the mean of the molecular clock rate (XML file available at https://github.com/nickloman/ebov). The maximum clade credibility tree was recovered using TreeAnnotator. Phylogenetic trees were annotated using the ete3 Python package.
Data Deposition and Reproducibility
Reproducible workflows for the analysis presented here and consensus sequences can be found at http://github.com/nickloman/ebov. The complete set of bioinformatics scripts are available in a Github repository with associated IPython Notebooks to regenerate the figures and tables presented in this manuscript can be found at http://github.com/nickloman/ebov
Extended Data
Extended Figure 1. Primer schemes employed during the study.
We designed PCR primers to generate amplicons that would span the EBOV genome. We initially designed 38 primer pairs which were used in the initial validation study and which cover >98% of the EBOV genome (Panel A). During in-field sequencing we used a 19 reaction scheme or 11 reaction scheme which generated longer products. The predicted amplicon products are shown with forward primers and reverse primers indicated by green bars on the forward and reverse strand respectively, scaled according to the EBOV virus coordinates. The amplicon product sizes expected are shown for the 19 reaction scheme (Panel B) and the 11 reaction scheme (Panel C). No amplicon covers the extreme 3′ region of the genome. The last primer pair, 38_R, ends at position 18578, 381 bases away from the end of the virus genome. The primer diagram was created with Biopython 33.
Extended Figure 2. List of equipment and consumables to establish the genome surveillance system.
We show the list of equipment (Panel A), disposable consumables (Panel B) and reagents (Panel C) to establish in-field genomic surveillance. Sufficient reagents were shipped for 20 samples. MinION sequencing requires a mix of chilled and frozen reagents. Recommended shipping conditions are specified. The picture underneath depicts MinION flowcells ready for shipping with insulating material (left) and frozen reagents (right).
Extended Figure 3. Bioinformatics workflow.
This figure summarises the steps performed during bioinformatics analysis (ordered from top to bottom), in order to generate consensus sequences. The right column shows the example UNIX command executed at each step.
Extended Figure 4. Results of MinION validation.
The results of comparing four MinION sequences with Illumina sequences generated as part of a previous study 3 are shown in Panel A. Each row in the table demonstrates the number of true positives, false positives and false negatives for a sample. False negatives may result in masked sequences, due to being outside of regions covered by the amplicon scheme, having low coverage or falling within a primer binding site. Results before and after quality filtering (log-likelihood ratio of >200) are shown. After quality filtering, no false positive calls were detected. All detected false negatives were masked with Ns in the final consensus sequence. No positions were called incorrectly. The four consensus sequences, plus an additional sample that had missing coverage in one amplicon are shown as part of a phylogenetic reconstruction with genomes from Carroll et al. 3. Sample labels in red, blue, pink, yellow and blue represent pairs of sequences generated on MinION and llumina that fall into identical clusters.
Extended Figure 5. Relationship between coverage and log-likelihood ratio for sample 076769.
Line-plot showing the relationship between sequence depth of coverage (x axis) and the log-likelihood ratio for detected SNPs derived by subsampling reads from a single sequencing run to simulate the effect of low coverage. The horizontal and vertical line indicates the cut-offs (quality and coverage respectively) for consensus calling. Therefore, all variants are detected below 25x coverage, and the vast majority meet the threshold quality at 25x coverage or slightly above. Any combination of log likelihood ratio or coverage which placed variants in the grey box would be represented as a masked position in the final consensus sequence.
Extended Figure 6. Duration of MinION sequencing runs.
For each sequence run the sequencing duration, measured as the difference between timestamp of the first read seen and the last read transferred for analysis. 127 runs are shown, with 15 outliers with duration greater than 200 minutes excluded.
Extended Figure 7. Histogram of Ct values for study samples.
Ct values for samples in the study (where information was available) ranged between 13.8 and 35.7, with a mean of 22.
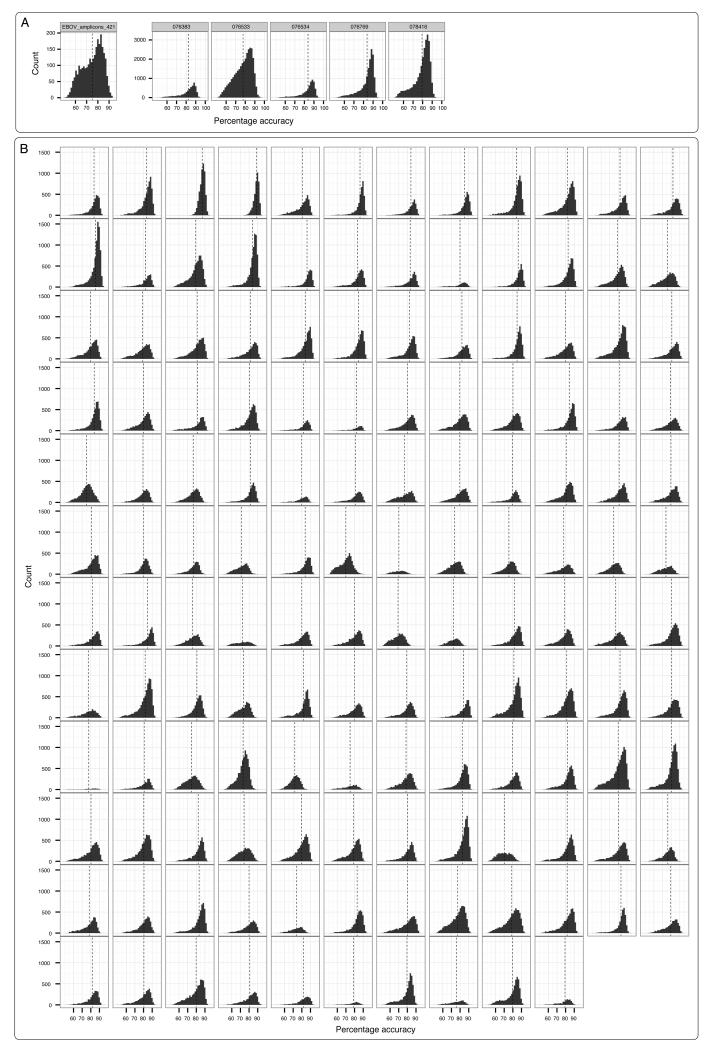
Extended Figure 8. Sequence accuracy for samples.
Accuracy measurements for the entire set of two-direction reads were made for the validation samples, sequenced in the United Kingdom (Panel A) and each of the 142 samples from real-time genomic surveillance (Panel B). Accuracy is defined according to the definition from Quick et al. 11. Vertical dashed lines indicate the mean accuracy for the sample.
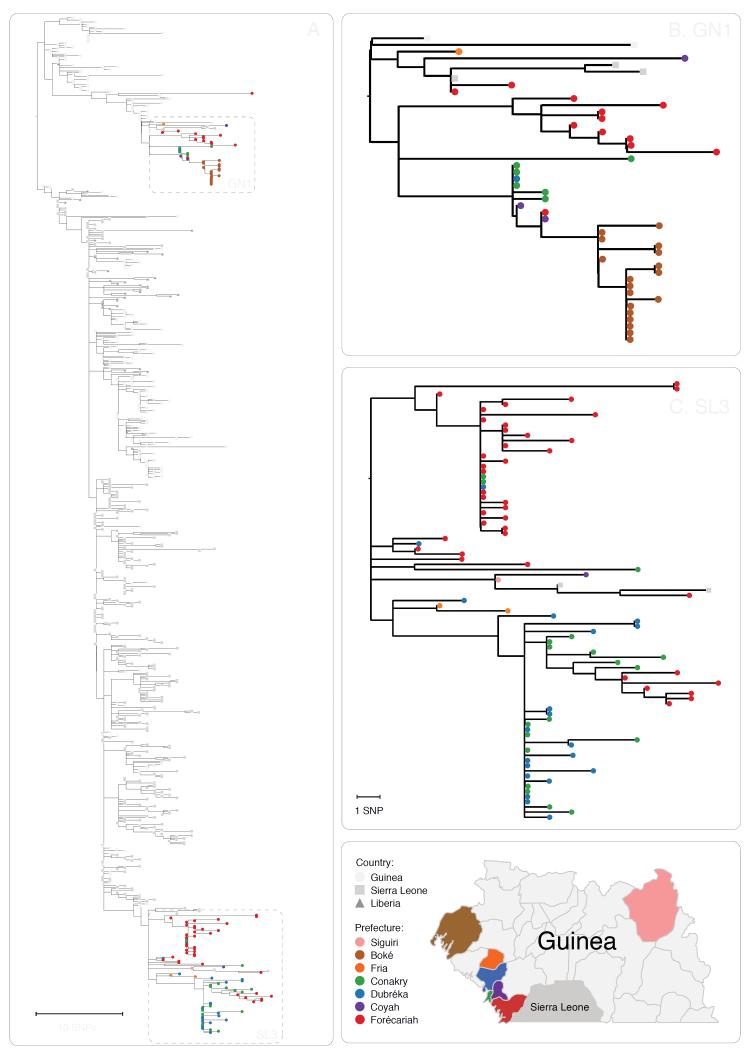
Extended Figure 9. Maximum Likelihood phylogenetic inference of 125 Ebola virus samples from this study with 603 previously published sequences.
Coloured nodes are from this study. Node shape reflects country of origin. Panel A depicts the entire dataset, with zoomed regions focusing on lineages GN1 (Panel B) and SL3 (Panel C) identified during real-time sequencing. Map figure adapted from SimpleMaps website (http://simplemaps.com/resources/svg-gn).
Extended Figure 10.
Root-to-tip divergence plot for the 728 Ebola samples generated through Maximum-Likelihood analysis (Panel A). Samples from real-time genomic surveillance are coloured as per Figure 3 and Extended Figure 2. Panel B. Mean evolutionary rate estimate (in substitutions per site per year) across the EBOV phylogeny recovered using BEAST under a relaxed lognormal molecular clock Blue area corresponds to the 95% highest posterior density (HPD) (mean of the distribution is 1.19E-3, 95% HPDs: 1.09 - 1.29 E-3 substitutions per site per year). Hatched regions in red are outside the 95% HPD intervals.
Supplementary Material
Acknowledgements
The EMLab is a technical partner in the WHO Emerging and Dangerous Pathogens Laboratory Network (EDPLN), and the Global Outbreak Alert and Response Network (GOARN) and the deployments in West Africa have been coordinated and supported by the GOARN Operational Support Team at WHO/HQ and the African Union. This work was carried out in the context of the project EVIDENT (Ebola virus disease: correlates of protection, determinants of outcome, and clinical management) that received funding from the European Union’s Horizon 2020 research and innovation program under grant agreement No 666100 and in the context of service contract IFS/2011/272-372 funded by Directorate-General for International Cooperation and Development. JQ is funded by the NIHR Surgical Reconstruction and Microbiology Research Centre (SRMRC). NJL is funded by a Medical Research Council Special Training Fellowship in Biomedical Informatics (to September 2015) and a Medical Research Council Bioinformatics Fellowship. JTS is supported by the Ontario Institute for Cancer Research through funding provided by the Government of Ontario. Dstl support was funded by the UK Ministry of Defence (MOD). Dstl authors thank Steve Lonsdale, Claire Lonsdale and Carl Mayers for supply of RNA, previous assistance, and review of the manuscript. The views expressed in this paper are not necessarily endorsed by the UK MOD. A.R. was supported by EU Seventh Framework Programme [FP7/2007-2013] under Grant Agreement no. 278433-PREDEMICS and ERC Grant agreement no. 260864. We are grateful for the generous support of University of Birmingham alumni for donations in support of the pilot work. The MRC Cloud Infrastructure for Microbial Bioinformatics (CLIMB) cyberinfrastructure was used to conduct bioinformatics analysis. The authors would like to thank Beryl Oppeheim and Catherine Wardius for help with logistics and the staff of Alta Biosciences, University of Birmingham and Sigma-Aldrich for generating PCR primers especially rapidly for this project. The authors would like to thank scientists deployed from the Special Pathogens Program from the National Microbiology Laboratory, Public Health Agency of Canada, who worked on EBOV diagnostics in Guinea. We are grateful to Ian Goodfellow, Matt Cotten and Paul Kellam for permission to include sequences from Sierra Leone in this analysis. We thank Richard Vipond for assistance with validation experiments. We thank Hannah Eno and Barbara Myers for help with proof reading. We are thankful for the generous support of reagents and technical support from Oxford Nanopore. We thank the staff at Oxford Nanopore for technical and logistical support during this project with special thanks to Stephanie Brooking, Oliver Hartwell, Roger Pettett , Clive Brown, Gordon Sanghera and Richard Ronan. We thank the three anonymous reviewers for highly constructive comments and suggestions during the peer review process.
Footnotes
Author Information
MinION and Illumina raw sequence files have been deposited into the European Nucleotide Archive under project code PRJEB10571. J.Q., N.J.L. and J.T.S. have all received travel expenses and accommodation from Oxford Nanopore to speak at organised symposia. J.Q. and N.J.L. have received an honorarium payment to speak at an Oxford Nanopore meeting. N.J.L. is a member of the Oxford Nanopore MinION Access Programme and has received reagents free of charge as part of the MinION Access Programme and in support of this project but does not receive other financial compensation or hold shares. D.T. is an employee of Oxford Nanopore.
References
- 1.World Health Organisation [11 November 2015];Ebola Situation Report. 2015 at < http://apps.who.int/ebola/current-situation/ebola-situation-report-11-november-2015>.
- 2.Gire SK, et al. Genomic surveillance elucidates Ebola virus origin and transmission during the 2014 outbreak. Science. 2014;345:1369–1372. doi: 10.1126/science.1259657. [DOI] [PMC free article] [PubMed] [Google Scholar]
- 3.Carroll MW, et al. Temporal and spatial analysis of the 2014-2015 Ebola virus outbreak in West Africa. Nature. 2015;524:97–101. doi: 10.1038/nature14594. [DOI] [PMC free article] [PubMed] [Google Scholar]
- 4.Simon-Loriere E, et al. Distinct lineages of Ebola virus in Guinea during the 2014 West African epidemic. Nature. 2015;524:102–104. doi: 10.1038/nature14612. [DOI] [PMC free article] [PubMed] [Google Scholar]
- 5.Park DJ, et al. Ebola Virus Epidemiology, Transmission, and Evolution during Seven Months in Sierra Leone. Cell. 2015;161:1516–1526. doi: 10.1016/j.cell.2015.06.007. [DOI] [PMC free article] [PubMed] [Google Scholar]
- 6.Tong Y-G, et al. Genetic diversity and evolutionary dynamics of Ebola virus in Sierra Leone. Nature. 2015;524:93–96. doi: 10.1038/nature14490. [DOI] [PMC free article] [PubMed] [Google Scholar]
- 7.Kugelman JR, et al. Monitoring of Ebola Virus Makona Evolution through Establishment of Advanced Genomic Capability in Liberia. Emerg. Infect. Dis. 2015;21:1135–1143. doi: 10.3201/eid2107.150522. [DOI] [PMC free article] [PubMed] [Google Scholar]
- 8.Gardy J, Loman NJ, Rambaut A. Real-time digital pathogen surveillance—the time is now. Genome Biol. 2015 doi: 10.1186/s13059-015-0726-x. [DOI] [PMC free article] [PubMed] [Google Scholar]
- 9.Yozwiak NL, Schaffner SF, Sabeti PC. Data sharing: Make outbreak research open access. Nature. 2015;518:477–479. doi: 10.1038/518477a. [DOI] [PubMed] [Google Scholar]
- 10.Liberia's LIBR Genome Center Monitors Ebola Outbreak, Emerging Pathogens 2015 at < https://www.genomeweb.com/sequencing-technology/liberias-libr-genome-center-monitors-ebola-outbreak-emerging-pathogens>.
- 11.Quick J, Quinlan AR, Loman NJ. A reference bacterial genome dataset generated on the MinION™ portable single-molecule nanopore sequencer. GigaScience. 2014;3:22. doi: 10.1186/2047-217X-3-22. [DOI] [PMC free article] [PubMed] [Google Scholar]
- 12.Jain M, Fiddes IT, Miga KH, Olsen HE, Paten B. Improved data analysis for the MinION nanopore sequencer. … methods. 2015 doi: 10.1038/nmeth.3290. [DOI] [PMC free article] [PubMed] [Google Scholar]
- 13.Urban JM, Bliss J, Lawrence CE, Gerbi SA. Sequencing ultra-long DNA molecules with the Oxford Nanopore MinION. Nature Methods. 2015 [Google Scholar]
- 14.Quick J, Ashton P, Calus S, Chatt C, Gossain S. Rapid draft sequencing and real-time nanopore sequencing in a hospital outbreak of Salmonella. Genome …. 2015 doi: 10.1186/s13059-015-0677-2. [DOI] [PMC free article] [PubMed] [Google Scholar]
- 15.Greninger AL, et al. Rapid metagenomic identification of viral pathogens in clinical samples by real-time nanopore sequencing analysis. Genome Medicine. 2015;7:1856. doi: 10.1186/s13073-015-0220-9. [DOI] [PMC free article] [PubMed] [Google Scholar]
- 16.Loman NJ, Quick J, Simpson JT. A complete bacterial genome assembled de novo using only nanopore sequencing data. Nature Methods. 2015;12:733–735. doi: 10.1038/nmeth.3444. [DOI] [PubMed] [Google Scholar]
- 17.Recent evolution patterns of Ebola virus obtained by direct sequencing in Sierra Leone. at < http://virological.org/t/recent-evolution-patterns-of-ebola-virus-obtained-by-direct-sequencing-in-sierra-leone/150>.
- 18.Herold KE, Sergeev N, Matviyenko A, Rasooly A. Biosensors and Biodetection. Vol. 504. Humana Press; 2009. pp. 441–458. [DOI] [PMC free article] [PubMed] [Google Scholar]
- 19.Mate SE, et al. Molecular Evidence of Sexual Transmission of Ebola Virus. N Engl J Med. 2015 doi: 10.1056/NEJMoa1509773. 151014140151006. [DOI] [PMC free article] [PubMed] [Google Scholar]
- 20.Smither SJ, et al. Buffer AVL Alone Does Not Inactivate Ebola Virus in a Representative Clinical Sample Type. J. Clin. Microbiol. 2015;53:3148–3154. doi: 10.1128/JCM.01449-15. [DOI] [PMC free article] [PubMed] [Google Scholar]
- 21.Loman NJ, Quinlan AR. Poretools: a toolkit for analyzing nanopore sequence data. Bioinformatics. 2014;30:3399–3401. doi: 10.1093/bioinformatics/btu555. [DOI] [PMC free article] [PubMed] [Google Scholar]
- 22.Li H. Aligning sequence reads, clone sequences and assembly contigs with BWA-MEM. 2013.
- 23.Garrison E, Marth G. Haplotype-based variant detection from short-read sequencing. 2012.
- 24.Kurtz S, et al. Versatile and open software for comparing large genomes. Genome Biology. 2004;5:R12. doi: 10.1186/gb-2004-5-2-r12. [DOI] [PMC free article] [PubMed] [Google Scholar]
- 25.Stamatakis A. RAxML version 8: a tool for phylogenetic analysis and post-analysis of large phylogenies. Bioinformatics. 2014;30:1312–1313. doi: 10.1093/bioinformatics/btu033. [DOI] [PMC free article] [PubMed] [Google Scholar]
- 26.Edgar RC. MUSCLE: multiple sequence alignment with high accuracy and high throughput. Nucleic Acids Research. 2004;32:1792–1797. doi: 10.1093/nar/gkh340. [DOI] [PMC free article] [PubMed] [Google Scholar]
- 27.Price MN, Dehal PS, Arkin AP. FastTree 2 – Approximately Maximum-Likelihood Trees for Large Alignments. PLoS ONE. 2010;5:e9490. doi: 10.1371/journal.pone.0009490. [DOI] [PMC free article] [PubMed] [Google Scholar]
- 28.Drummond AJ, Rambaut A. BEAST: Bayesian evolutionary analysis by sampling trees. BMC Evolutionary Biology. 2007;7:214. doi: 10.1186/1471-2148-7-214. [DOI] [PMC free article] [PubMed] [Google Scholar]
- 29.Hasegawa M, Kishino H, Yano T-A. Dating of the human-ape splitting by a molecular clock of mitochondrial DNA. J Mol Evol. 1985;22:160–174. doi: 10.1007/BF02101694. [DOI] [PubMed] [Google Scholar]
- 30.Yang Z. Maximum likelihood phylogenetic estimation from DNA sequences with variable rates over sites: Approximate methods. J Mol Evol. 1994;39:306–314. doi: 10.1007/BF00160154. [DOI] [PubMed] [Google Scholar]
- 31.Gill MS, et al. Improving Bayesian Population Dynamics Inference: A Coalescent-Based Model for Multiple Loci. Mol Biol Evol. 2013;30:713–724. doi: 10.1093/molbev/mss265. [DOI] [PMC free article] [PubMed] [Google Scholar]
- 32.Drummond AJ, Ho SYW, Phillips MJ, Rambaut A. Relaxed Phylogenetics and Dating with Confidence. PLOS Biol. 2006;4:e88. doi: 10.1371/journal.pbio.0040088. [DOI] [PMC free article] [PubMed] [Google Scholar]
- 33.Cock PJ, et al. Biopython: freely available Python tools for computational molecular biology and bioinformatics. Bioinformatics. 25:1422–1423. doi: 10.1093/bioinformatics/btp163. [DOI] [PMC free article] [PubMed] [Google Scholar]
Associated Data
This section collects any data citations, data availability statements, or supplementary materials included in this article.


