

Abstract
Previous studies have suggested occurrence of altered serum glycan profiles in patients with lung cancer. Here, we aimed to determine the predictive value of serum glycans to distinguish non-small cell lung cancer (NSCLC) cases from controls in pre-diagnostic samples using a previously validated predictive protein marker pro-SFTPB, as anchor.
Blinded pre-diagnostic serum samples were obtained from the Carotene and Retinol Efficacy Trial (CARET), and included a discovery set of 100 NSCLC cases and 199 healthy controls. A second test set consisted of 108 cases and 216 controls. Cases and controls were matched for age at baseline (5-yr groups), sex, smoking status (current vs. former), study enrollment cohort and date of blood draw. Serum glycan profiles were determined by mass spectrometry.
Twelve glycan variables were identified to have significant discriminatory power between cases and controls in the discovery set (AUC>0.6). Of these, four were confirmed in the independent validation set. A combination marker yielded AUCs of 0.74 and 0.64 in the discovery and test set, respectively. Four glycan variables exhibited significant incremental value when combined with pro-SFTPB compared to pro-SFTPB alone with AUCs of 0.73, 0.72, 0.72 and 0.72 in the test set, indicating that serum glycan signatures have relevance to risk assessment for NSCLC.
Keywords: N-glycosylation, Serum, biomarker, NSCLC, pro-SFTPB
INTRODUCTION
Lung cancer is the leading cause of cancer death and despite the reduction of smoking incidence in the united States, some 29% of cancer deaths in men and 26% in women are attributed to lung cancer (1). When lung cancer is diagnosed at a localized stage, survival rates are much higher than when disease has metastasized (1). The use of imaging techniques, especially computed tomography (CT) scanning has shown good potential for early diagnosis of lung cancer. The National Lung Screening Trial (NLST) in the United States demonstrated an overall decrease in lung cancer mortality of approximately 20% when individuals at risk for lung cancer were screened yearly using low dose spiral CT (2). However efficient implementation of lung cancer screening strategies would benefit from the development of means to assess risk of harboring lung cancer. The development of a blood-based biomarker panel that could be used in a test to complement CT screening either for identifying subjects at increased risk or for improving CT screening performance would provide a more effective path to early diagnosis and reduced mortality of lung cancer.
We previously reported on the identification of circulating pro-surfactant protein B (pro-SFTPB) as a promising blood-based biomarker for lung cancer risk assessment (3, 4). We performed an initial study based on the Carotene and Retinol Efficacy Trial (CARET) cohort, which consisted of pre-diagnostic NSCLC cases and controls, in which pro-SFTPB yielded and AUC of 0.683, indicative of its potential relevance for early detection of lung cancer together with other markers (3). It was furthermore recently shown that pro-SFTPB in combination with the metabolic marker diacetylspermine can provide good diagnostic potential (5).
Glycomics represents a novel paradigm for biomarker discovery (6, 7) and has the potential of providing additional biomarkers for lung cancer early detection. Protein glycosylation is the enzymatic addition of oligosaccharide structures to proteins and generally occurs in two forms: N-glycans and O-glycans. In this study we will focus on N-glycans. N-glycans are attached to an asparagine residue that is present as part of an N-X-S/T motif and are typically highly branched structures (8). They consist of a core that contains five monosaccharides and can be expanded in a non-template driven way, resulting in substantial heterogeneity. Prior studies have suggested a potential of serum N-glycomics signatures to distinguish subjects diagnosed with lung cancer from controls (9–12). However the potential contribution of glycomics to the identification of subjects at risk for lung cancer in the pre-diagnostic setting has not been assessed in a blinded validation study using the PRoBE design that addresses intended applications and is recommended by the Early Detection Research Network (13, 14).
We have utilized an in-depth N-glycan analysis method to generate glycan signatures from pre-diagnostic serum samples from NSCLC cases and matched controls. We aimed to identify candidate glycan markers for NSCLC in a discovery set and determine in a test set whether glycan markers can improve the performance of the previously validated protein marker pro-SFTPB in the pre-diagnostic setting.
EXPERIMENTAL SECTION
Clinical samples
Participants in this nested case-control study were selected from the CARET cohort study. CARET was a multicenter, randomized, double-blinded, placebo-controlled trial aimed to assess the safety and efficacy of daily supplementation with 30 mg of β-carotene plus 25,000 IU of retinyl palmitate in reducing lung cancer incidence in persons at high risk for the disease (15). The study comprised two high-risk populations: heavy smokers (N=14,254) and asbestos-exposed workers (N=4,060). Eligible participants for the heavy smoker population were men and women, 50–69 years of age, who were either current or former smokers (quit within the previous 6 years) with at least 20 pack-years of cigarette smoking. Eligible participants for the asbestos-exposed population were men aged 45–69 who were smoking at baseline or quit within 15 years prior and had a substantial history of asbestos exposure. Participants were enrolled from 1985 to 1994 and participant follow-up for cancer and mortality outcomes continued until 2005. Blood draws were conducted at baseline and every other year thereafter through 1996 for most participants and a common blood collection and processing protocol was used at all of the study centers. Serum samples were created and stored at −20°C for up to two weeks and then transferred to central −70°C freezers for long term storage. All CARET participants provided informed consent at recruitment and throughout follow-up, and the institutional review boards at each of the six study centers approved all study procedures.
For this study, two independent sets of 100 (discovery) and 108 (test) NSCLC cases for which a serum sample was available from a blood draw that occurred within 12 months prior to diagnosis were selected. For each lung cancer case, sera from two control subjects that were free of lung cancer during the period of follow-up were selected. Cases and controls were matched for age at baseline (5-yr groups), sex, baseline smoking status (current vs. former), study enrollment cohort and date of blood draw (same follow-up collection time point). For one of the cases in the discovery set, only one control could be assigned, resulting in 299 samples in this set. For both the discovery and the validation sets, samples were blinded and randomized by matched case-control triplets, and the sample preparation and analysis of the two sample sets were performed independently and with a 1 year interval. The clinical characteristics of the two sample sets are provided in Table 1.
Table 1.
Participant characteristics of CARET NSCLC cases and controls
| Discovery set | Test set | |||
|---|---|---|---|---|
| Cases (N = 100) |
Controls (N = 199) |
Cases (N = 108) |
Controls (N = 216) |
|
| Age*, mean (std) | 61.1 (5.8) | 60.9 (5.9) | 61.9 (5.7) | 61.9 (5.9) |
| Pack-years, mean (std)# | 57 (23) | 47 (22) | 54 (23) | 49 (20) |
| Age at diagnosis, mean (std) | 66.2 (6.2) | 65.1 (6.3) | ||
| Sex* | ||||
| Male | 75 | 149 | 75 | 150 |
| Female | 25 | 50 | 33 | 66 |
| Race | ||||
| White | 94 | 185 | 99 | 200 |
| Black | 3 | 5 | 6 | 8 |
| Other | 3 | 9 | 3 | 8 |
| Exposure population | ||||
| Asbestos-exposed worker | 31 | 56 | 35 | 53 |
| Heavy Smoker | 69 | 143 | 73 | 163 |
| Smoking status at baseline* | ||||
| Current | 61 | 121 | 72 | 144 |
| Former | 39 | 78 | 36 | 72 |
| Histology | ||||
| Adenocarcinoma | 40 | 40 | ||
| Squamous cell | 30 | 38 | ||
| Other/unspecified NSCLC | 30 | 30 | ||
| Stage | ||||
| I – II | 14 | 26 | ||
| III – IV | 69 | 64 | ||
| Unknown | 17 | 18 | ||
| Months from blood collection to diagnosis | ||||
| <6 months | 48 | 40 | ||
| 6–12 months | 52 | 68 | ||
Matching variables
Case v control difference for pack-years is statistically significant among the discovery and validation sets, Wilcoxon test p = 0.0005 and p=0.009, respectively.
N-Glycomics assay
The total serum N-glycomics profiles of the CARET samples were obtained using mass spectrometry, as previously described (12), with slight modifications. The N-glycan release of the discovery set was performed in microcentrifuge tubes, while the glycan release of the testing set was performed in 96-well plates. Both methods were shown to perform similarly (Supplementary Figure 3). Briefly, proteins in 25 µL of serum were denatured using dithiothreitol prior to enzymatic release of the N-glycans using PNGaseF. Upon protein precipitation, the N-glycans were purified by porous graphitized carbon SPE and dried in vacuo prior to mass spectrometric analysis.
N-glycans were analyzed using an Agilent (Santa Clara, CA) 6200 series nanoHPLC-chip-TOF-MS; the stationary phase in the microfluidic chip used in the analysis was porous graphitized carbon (PGC), both in the trapping and analytical column. N-glycan samples were reconstituted in 100 µL of water and 1 µL was injected. Glycans were then separated using a gradient of 3%ACN with 0.1% FA (solvent A) and 90% ACN with 0.1% FA (solvent B). Mass spectrometric detection was performed in the positive ionization mode and the instrument was calibrated prior to the start of the analysis of both sample sets. Glycan features were identified and extracted using Masshunter® qualitative analysis (Agilent) in combination with our previously developed retrosynthetic N-glycan library, consisting of 332 glycans (16). Glycan compositions and peak areas were exported to csv-format for further processing and statistical evaluation. A more detailed description of the N-glycomics analysis procedure is provided in the supplementary information.
We have previously evaluated the performance of this method for biomarker discovery and the instrument variation was shown to be very limited (17). To evaluate instrument performance during the runs, one standard sample was run every 12 (discovery set) or 10 (test set) samples; similarly, standard samples were included to evaluate the stability of the sample preparation.
For the discovery set, samples were prepared in batches of 23. To evaluate the stability of the analytical process, standard serum samples were included every 12 (instrument variation) or 23 (sample preparation variation) samples Batch adjustments were made as needed to compensate for batch effects (Supplementary Figure 1). To this effect, the percent of total glycan values were median-centered by subtracting the median value of the batch in which the sample was run.
Statistical analysis
For statistical analysis percentile rank scores were calculated for each of the glycans and all further statistical evaluation was performed using these scores. Furthermore, 18 additional glycan features (see Supplementary Table 1 for calculation of these features) were calculated based on structural glycan characteristics. The glycans together with the glycan features will be referred to as glycan variables for the remainder of this report. For the discovery set, performance of the 92 glycan variables as markers for lung cancer was assessed with Receiving Operating Characteristic (ROC) curve analysis. For each glycan variable total area under ROC curve (AUC) was calculated to evaluate overall performance. Partial area under ROC curve (pAUC) estimates were calculated separately for specificity >= 90% to assess accuracy at high levels of specificity (18). Permutation tests were conducted to obtain false discovery rates (FDR). Permutation datasets (N=1,000) were generated by randomly permuting case-control status from the original dataset. Total AUC and pAUC for specificity >=90% were then calculated on the permuted datasets to obtain a distribution of AUC/pAUCs under the null hypothesis that the markers have no association with cancer. The study set AUC and p-value were evaluated against the distributions of AUCs from the permuted datasets to calculate FDRs. FDR and AUC criteria were established to reduce the marker set to a small number of the most promising candidates for validation. Specifically, glycan variable validation candidates were identified as those with AUC >0.6 and FDR < 0.05. Performance of the individual candidate makers identified in the discovery set was assessed in the test set with ROC curve analysis and Wilcoxon rank-sum tests. A logistic regression model was using backward elimination (p<0.1) was used to determine a combination marker panel. A likelihood ratio test was used to determine whether the additional of individual glycan variables to pro-SFTPB significantly improved the performance over pro-SFTPB alone, while a nonparametric approach was used for to determine statistical significance in the ROC model comparisons of the combination glycan marker panel in the risk model (19).
RESULTS
Serum N-glycomics biomarker discovery
Glycomics analysis was performed by nano-scale LC-MS using a porous graphitized carbon stationary phase and time-of-flight (TOF) detection. This method has been shown previously to provide good stability over longer run-times (17) and was therefore considered well suited for biomarker discovery. Using this method, N-glycomics analysis was performed on each of the samples in the discovery set and satisfactory N-glycan signals were obtained for 292 samples (98 cases and 194 controls). An overview of a typical N-glycan chromatogram as obtained in this study is depicted in Supplementary Figure 2. 74 glycans that were detected in at least 75% of the samples were included in the analysis and intensities relative to the total glycan content were determined for further statistical analysis. On average, these glycans accounted in total for 99% of the overall intensity observed in the runs.
To assess which individual glycans may provide predictive value for NSCLC, AUCs and pAUCs were calculated for the individual glycans. Four glycans were found to meet the significance criteria of an AUC>0.60 and an FDR <0.05. Their compositions, median values, AUC and p-values of the AUC are listed in Table 2. Interestingly, all individual glycans that exhibited significance were non-sialylated and values of two non-galactosylated glycans (H3N4 and H3N4F1) were increased in NSCLC cases, while levels of two fully galactosylated glycans (H5N4F1 and H6N5F1) were decreased. No influence of fucosylation was observed.
Table 2.
Glycan features from the discovery sample set meeting performance criteriaa for test set evaluation, together with their putative structure, and median, AUC and P-value in both the discovery and test sample sets.
| Glycan | Glycan Feature |
Glycan variablea |
Discovery | Test | |||||||||
|---|---|---|---|---|---|---|---|---|---|---|---|---|---|
| NSCLC (median, N=98) |
Control (median, N=194) |
AUC | P-valueb | FDR | pAUC(0.10)c | NSCLC (median, N=108) |
Control (median, N=216) |
AUC | P-valueb | FDR | |||
| X | Gal_1 | −6.34E-02 | 2.46E-02 | 0.66 | >0.001 | 0.017 | 6.43E-06 | −7.06E-02 | 9.24E-03 | 0.61 | 1.06E-03 | 0.007 | |
| X | Gal_3 | −3.42E-02 | 1.89E-02 | 0.66 | 0.001 | 0.014 | 1.35E-05 | −6.18E-02 | 1.57E-02 | 0.61 | 1.65E-03 | 0.007 | |
| X | Gal_4 | −7.05E-02 | 1.50E-02 | 0.65 | 0.001 | 0.015 | 1.97E-05 | −7.42E-02 | 3.78E-02 | 0.58 | 1.56E-02 | 0.040 | |
| X | Gal_5 | −7.64E-02 | 1.59E-02 | 0.65 | 0.001 | 0.011 | 2.37E-05 | −1.21E-01 | 3.67E-02 | 0.54 | 1.94E-01 | 0.195 | |
| X | Sia_2 | 2.85E+00 | −9.04E-01 | 0.65 | 0.001 | 0.009 | 2.59E-05 | 1.51E+00 | −2.77E-01 | 0.57 | 4.34E-02 | 0.056 | |
| X | H6N5F1 | −4.40E-05 | 2.20E-05 | 0.64 | 0.001 | 0.007 | 6.71E-05 | −1.30E-05 | 1.60E-07 | 0.57 | 3.17E-02 | 0.056 | |
| X | Sia_1 | 5.05E+01 | −1.02E+01 | 0.64 | 0.002 | 0.006 | 1.54E-04 | 2.10E+01 | −4.51E+00 | 0.58 | 1.85E-02 | 0.040 | |
| X | Tr | 5.80E-03 | −2.23E-03 | 0.63 | 0.004 | 0.013 | 2.73E-04 | 6.27E-03 | −1.18E-05 | 0.57 | 4.21E-02 | 0.056 | |
| X | Gal_2 | −1.56E-01 | 5.63E-02 | 0.63 | 0.005 | 0.012 | 3.84E-04 | −1.17E-01 | 2.15E-02 | 0.60 | 2.45E-03 | 0.008 | |
| X | H5N4F1 | −1.30E-03 | 4.90E-04 | 0.62 | 0.005 | 0.006 | 5.40E-04 | −2.00E-03 | 1.20E-03 | 0.64 | 3.61E-05 | >0.001 | |
| X | H3N4F1 | 3.20E-03 | −1.50E-03 | 0.61 | 0.010 | 0.014 | 1.38E-03 | 3.10E-03 | −8.70E-04 | 0.56 | 6.86E-02 | 0.081 | |
| X | H3N4 | 6.70E-04 | −1.40E-04 | 0.60 | 0.025 | 0.009 | 3.82E-03 | 5.90E-04 | −2.00E-03 | 0.54 | 1.95E-01 | 0.195 | |
Glycan variables identified for testing were those with AUC>0.60 and an FDR <0.05.
p-value calculated using the Wilcoxon test.
Partial AUC (pAUC) associated with a false positive rate (FPR) upper bound of 0.10 (i.e., area under the curve for the FPR range of 0–0.10)
Since glycans are products of the activity of several glycosidases and glycosyltransferases with stringent specificities, the biosynthetic pathway of glycans is well defined. To assess specific biosynthetic features, a subset of glycans was generated, which is enriched for differential potential by using inclusion criteria of AUC>0.55 and FDR<0.5. This resulted in a set of 36 glycans (Supplementary Table 2), and based on their structural features, 18 glycan features were defined: One glycan feature each addressed high mannose type glycans (HM), hybrid type glycans (Hyb), truncated non-galactosylated glycans (Tr) and biantennary galactosylated (BA) glycans, seven glycan features addressed the levels of fucosylation (Fuc_#), five glycan features addressed the level of galactosylation (Gal_#) and two glycan features addressed sialylation (Sia_#). (Supplementary Table 1).
Eight glycan features met the significance criteria of an AUC>0.60 and an FDR <0.05 in the differential analysis (Table 2). These included Gal_1, Gal_2, Gal_3, Gal_4, Gal_5, Sia_1, Sia_2 and, Tr. Of the seven glycan features that addressed the levels of fucosylation, none met the criteria for significance, indicating that the overall fucosylation of serum proteins is not altered in NSCLC. On the other hand, all five of the features addressing galactosylation and all two features addressing sialylation met the criteria for significance, indicating differential galactosylation and sialylation on serum proteins in NSCLC. Differential galactosylation on the high abundance protein IgG has previously been implicated in multiple types of cancer (20–23) and autoimmune diseases (24–26).
Validation of candidate Glycan markers in a test set
To further assess the predictive power of N-glycosylation, N-glycomics analysis was performed on blinded samples from an independent test set which consisted of pre-diagnostic serum samples from 108 NSCLC cases and 216 controls, also from the CARET study. The characteristics of the discovery and test set subjects were similar as shown in Table. 1.
Upon normalization and batch-correction, AUCs were calculated for the 12 glycan variable candidate markers (four glycans and eight glycan features) with significant differences in their levels between cases and controls in the discovery set (Table 2). 9 of the 12 candidate markers had significant p-values (<0.05) for total AUC, indicating that the differential potential of these glycan variables was verified in the independent test set. Of these 9 glycan variables, four had AUC >0.60, indicating high potential for these variables.
Development of a biomarker combination
The 12 glycan variables (four glycans and eight glycan features) that were statistically significant in the discovery set were used to develop a combined marker panel. Using a logistic regression model with backward elimination, an optimal combination marker was developed based on the discovery set. The combination marker contained four glycan variables (N5H4F1, N6H5F1, Sia_2 and Gal_4) and provided a combined AUC of 0.74, with a 95% confidence interval of 0.68 – 0.80 (Figure 1).
Figure 1. Receiver operating characteristic curves for the prediction of NSCLC.
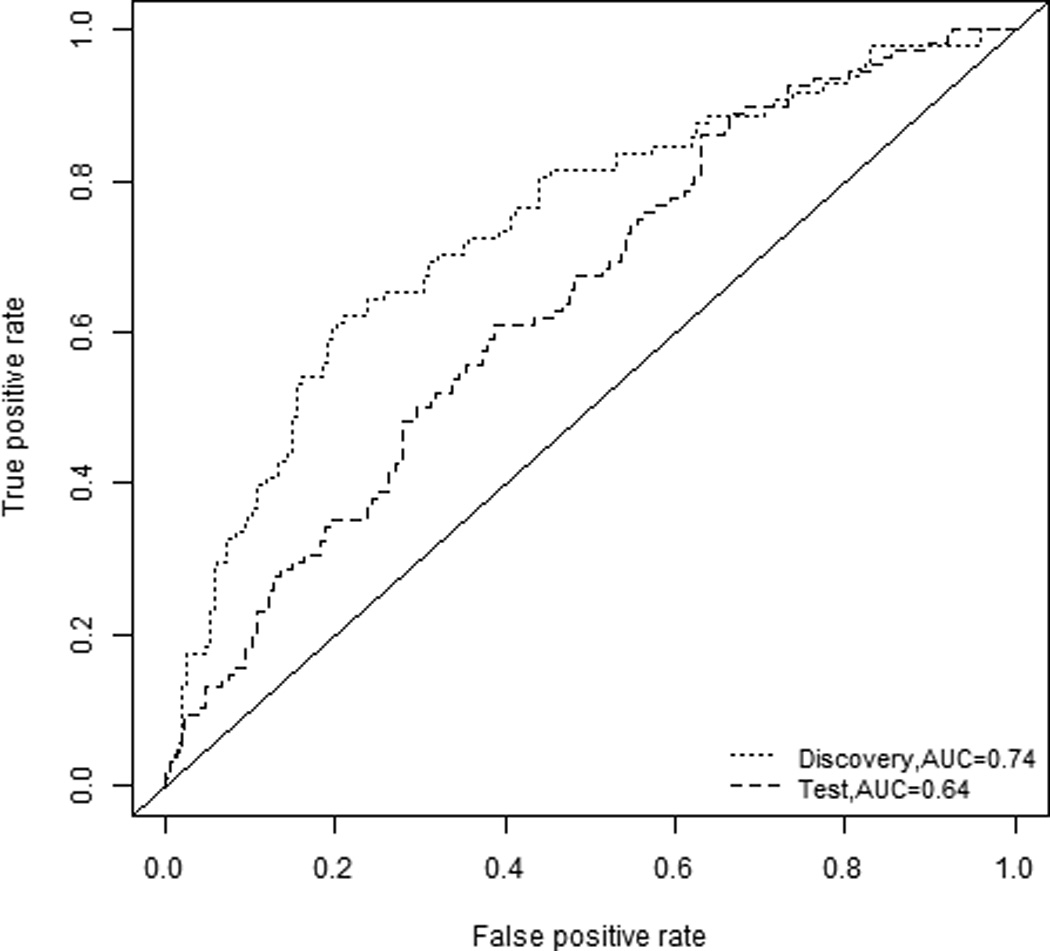
ROC curves are shown for the combination glycan panel for the discovery set (green, AUC 0.74) and the test set (red, AUC 0.64)
The combination marker panel, which was developed based on the discovery set, was then applied to the independent test set. Both the glycan variables and their coefficients were locked down based on the discovery set and applied to the test set. The beta coefficients for the glycan variables in the model are reported in Supplementary Table 3. Using this approach an AUC of 0.64 was obtained in the test set, with a 95% confidence interval of 0.58 – 0.71, indicating that the combination marker could be validated in a second, independent sample set.
Combination of glycan markers with pro-SFTPB
We previously reported an AUC of 0.683 for pro-SFTPB in distinguishing CARET study samples collected from subjects diagnosed with NSCLC within a year following blood draw from matched controls (3). Since protein glycosylation is likely to reflect biological aspects of the disease independent of circulating protein markers, we hypothesized that the combination of glycosylation markers and pro-SFTPB would provide improved performance compared to either alone. Therefore, the AUC was calculated for models containing pro-SFTPB with each of the individual glycan variables that provided AUC>0.6 with FDR<0.05 in the discovery set; a likelihood ratio test was used to estimate the p-value relative to the AUC of pro-SFTPB alone (Table 3). In the discovery set, the inclusion of each of the 12 glycan variables significantly improved the predictive value of pro-SFTPB. Good concordance was observed between the discovery and the test set as significantly improved AUCs were obtained for four of the glycan features: H5N4F1, Gal_1, Gal_2 and Gal_3 in the test set with AUCs reported of 0.732, 0.724, 0.723 and 0.721, respectively (Table 3).
Table 3.
Performance of the glycan markers in combination with the protein marker pro-SFTPB.
| Marker | Discovery | Test | ||||
|---|---|---|---|---|---|---|
| AUC | p-valuea | FDR | AUC | p-valuea | FDR | |
| H3N4 | 0.660 | 0.0066 | 0.0077 | 0.704 | 0.2756 | 0.2756 |
| H3N4F1 | 0.668 | 0.0055 | 0.0072 | 0.710 | 0.1141 | 0.1349 |
| H5N4F1 | 0.664 | 0.0121 | 0.0121 | 0.732 | 0.0004 | 0.0057 |
| H6N5F1 | 0.679 | 0.0003 | 0.0006 | 0.708 | 0.0864 | 0.1337 |
| Tr | 0.680 | 0.0005 | 0.0009 | 0.709 | 0.0948 | 0.1337 |
| Gal_1 | 0.695 | 0.0001 | 0.0003 | 0.724 | 0.0048 | 0.0206 |
| Gal_2 | 0.675 | 0.0006 | 0.0010 | 0.723 | 0.0046 | 0.0206 |
| Gal_3 | 0.688 | 0.0003 | 0.0006 | 0.721 | 0.0071 | 0.0229 |
| Gal_4 | 0.695 | 0.0000 | 0.0002 | 0.717 | 0.0508 | 0.1100 |
| Gal_5 | 0.688 | 0.0003 | 0.0006 | 0.704 | 0.2704 | 0.2756 |
| Sia_1 | 0.680 | 0.0022 | 0.0031 | 0.711 | 0.0206 | 0.0536 |
| Sia_2 | 0.692 | 0.0001 | 0.0005 | 0.707 | 0.1028 | 0.1337 |
| pro-SFTPB | 0.634 | - | - | 0.699 | - | - |
p-value obtained from the likelihood-ratio test indicating the significance of marker +proSFTPB compared to pro-SFTPB alone.
We then also assessed the combination of the developed combination glycan panel (consisting of N5H4F1, N6H5F1, Sia_2 and Gal_4) with pro-SFTPB. Using a combination of these five variables, an AUC of 0.756 with a 95% confidence interval of 0.695 – 0.815 was obtained in the discovery set, indication substantially improved accuracy of prediction. The glycan and pro-SFTPB combination panel was then applied to the independent test set. The coefficients of the glycan variables and pro-SFTPB were locked down based on the discovery set and applied to the test set. Using this approach a combined AUC of 0.697 with a 95% confidence interval of 0.638 – 0.757 was obtained, which is similar to the predictive power of pro-SFTPB alone in the test set.
To assess whether the combined model improve the risk assessment of lung cancer, we assessed the known risk markers for which data is available in the CARET datasets, including pro-SFTPB. These NSCLC risk-associated variables included in the model are age, gender, smoking status, pack years and BMI. To assess the effect of the glycan panel, AUC’s were calculated for the risk-associated variables both with and without the glycan panel in the discovery set. For the risk factors alone, not including pro-SFTPB, an AUC of 0.61 was observed, while AUC’s of 0.73 and 0.77 were obtained for models including the risk factors and pro-SFTPB and the risk factors, pro-SFTPB and the combination glycan panel, respectively (supplementary Table 4). Using the model containing both the risk factors and proSFTPB as a reference model, the glycan marker panel significantly improved the AUC value of the model (p-value = 0.00068, likelihood ratio test). When the final model, including the risk markers, pro-SFTPB and the glycan marker panel was applied to the test set, an AUC of 0.71 with a 95% confidence interval of 0.65 – 0.77 was obtained. These results indicate that glycans have the potential to improve the risk assessment for NSCLC.
We further explored performance in relation to time to diagnosis. Two subsets were generated, one for samples collected 0–6 months prior to diagnosis and another for samples collected 6–12 months prior to diagnosis. Using the fixed coefficients obtained from the whole discovery set (not stratified by time to diagnosis) we observed AUCs for the combination marker panel of 0.775 and 0.721 0–6 months prior to diagnosis for the discovery and test set, respectively and 0.721 and 0.648 6–12 months prior to diagnosis for the discovery and test set, respectively (Supplementary Figure 4), suggesting that glycosylation changes tracked the development and progression of NSCLC.
DISCUSSION
Our study was intended to critically assess the potential of glycomic analysis to contribute to the identification of markers that inform about lung cancer. The experimental design consisted of the use of pre-diagnostic samples that minimize potential biases between cases and controls, given that at the time of sample collection disease status was not different between the two groups in a manner that impacts sample collection. Moreover the analysis was done in a blinded fashion both in the discovery and validation sets. We provide evidence of differential N-glycosylation in pre-diagnostic serum samples from non-small cell lung cancer cases, common to adenocarcinoma and squamous cell carcinoma, compared to healthy controls. 12 glycan variables (four glycans and eight glycan features) were identified as candidate markers in a discovery set, of which nine could be confirmed in a second, independent test set. A model using a combination of four glycan variables was developed that yielded an AUC of 0.74 in the discovery set. Application of this combination marker on the test set using coefficients obtained from the discovery set yielded an AUC of 0.64, indicative of the potential relevance of the glycan signature in identifying subjects at risk for NSCLC. We also obtained evidence indicating that the combination of glycosylation markers and the previously characterized NSCLC protein marker pro-SFTPB provides increased disease prediction compared to pro-SFTPB alone. Addition of each of the 12 markers to pro-SFTPB significantly improved performance in the discovery set. These results were validated for four markers in the test set, thus providing evidence for the contribution of glycan signatures to assessment of lung cancer risk.
Addition of the four-glycan marker panel as a whole to pro-SFTPB significantly improved performance in the discovery set, but improvement were limited in the test set when the same panel with locked down coefficients were used. Our results indicate the potential of the use of protein glycosylation in a biomarker panel, and encourage the development of methodology and assays for glycomics research that would withstand the rigor required for clinical assays.
The samples used in this study are prediagnostic samples, and therefore the results presented here provide evidence for the potential use of glycans as markers for early detection of lung cancer. However, additional studies will be necessary to further evaluate the clinical potential. These studies include, but are not limited to larger case-control studies to evaluate the candidate markers in multiple risk groups and prognostic studies in risk populations. Most of the subjects included in this study were diagnosed at later stage (III and IV), which would likely now also be screened positive in LDCT screening. Therefore, further studies should also focus on the detection of these markers in individuals with early stage lung cancer to better assess the efficacy of the glycan markers for early detection.
Of the four glycans that provided significant predictive value in the discovery set described in this study, levels of the two non-galactosylated glycans (H3N4 and H3N4F1) were increased in NSCLC. Moreover levels of the two galactosylated glycans (H5N4F1 and H6N5F1) were decreased in NSCLC, thus indicating an overall de-galactosylation. This is further confirmed by the significant decrease in the five galactosylation features (Gal_1 to Gal_5) in the discovery set. In a small sample set of plasma samples obtained from NSCLC patients and healthy controls, we previously observed that the level of IgG galactosylation was decreased (12). Another recent study focused on the mass spectrometry based differential analysis of glycosylation profiles of serum samples from patients with lung cancer compared to controls (11). Increased levels of tri- and tetra antennary structures and decreased levels of galactosylated glycans were observed, which is concordant with our findings using pre-diagnostic samples. De-galactosylation of IgG has often been reported in disease states including cancer (22, 27), rheumatoid arthritis (25), HIV infection (28) and is possibly associated with a host immune response and inflammation. The glycosylation profiles studied here are dominated by the glycosylation profiles of the high abundance serum proteins such as immunoglobulins and acute phase proteins. It may therefore not be very specific for lung cancer, but further studies will be necessary to draw final conclusions. Interestingly, the levels of galactosylated as well as non-galactosylated biantennary glycans are not significantly affected by smoking status (11) indicating that de-galactosylation, as a risk marker for NSCLC, may not be related to smoking.
The mechanism behind the decreased levels of galactosylation and the nature of the proteins that display the altered glycan signature we have observed in this study remain to be determined. It is likely given the relatively high concentration of the involved glycans in circulation that either high abundance proteins or a multitude of proteins are affected as may occur as a result of a host response. Initial results from a glycan profiling study in diseased and adjacent healthy tissue samples from NSCLC patients point to decreased levels of galactosylation in tumor tissue, potentially providing further mechanistic insights.
Overall, our findings suggest that glycan signatures in biological fluids may have predictive value for assessing risk of lung cancer. Glycan profiling likely complements profiling using other platforms as we have demonstrated in our study by comparing the performance of a previously validated biomarker, pro-SFTPB. With the performance of pro-SFTPB together with the glycan signature we have further characterized the prospects for the development of predictive signatures that may have utility for lung cancer early detection.
Supplementary Material
Acknowledgments
The authors thank Dr. Kyoungmi Kim for assistance in the assignment of samples to batches.
Funding was provided by the Department of Defense (DOD) grant no. CDMRP LCRP W81XWH1010635 (to all authors), NIH #R21CA135240 (to S. Miyamoto), the Canary Foundation (to S. Hanash), the LUNGevity Foundation (to S. Miyamoto), the Thomas G. Labrecque Foundation 201118739 (to S. Miyamoto) and the Rubenstein Family Foundation (to S. Hanash).
Footnotes
The authors declare no conflict of interest.
REFERENCES
- 1.Siegel R, Ma J, Zou Z, Jemal A. Cancer statistics, 2014. CA Cancer J Clin. 2014;64:9–29. doi: 10.3322/caac.21208. [DOI] [PubMed] [Google Scholar]
- 2.National Lung Screening Trial Research T. Aberle DR, Adams AM, Berg CD, Black WC, Clapp JD, et al. Reduced lung-cancer mortality with low-dose computed tomographic screening. N Engl J Med. 2011;365:395–409. doi: 10.1056/NEJMoa1102873. [DOI] [PMC free article] [PubMed] [Google Scholar]
- 3.Sin DD, Tammemagi CM, Lam S, Barnett MJ, Duan X, Tam A, et al. Pro-surfactant protein B as a biomarker for lung cancer prediction. J Clin Oncol. 2013;31:4536–4543. doi: 10.1200/JCO.2013.50.6105. [DOI] [PMC free article] [PubMed] [Google Scholar]
- 4.Taguchi A, Hanash S, Rundle A, McKeague IW, Tang D, Darakjy S, et al. Circulating pro-surfactant protein B as a risk biomarker for lung cancer. Cancer Epidemiol Biomarkers Prev. 2013;22:1756–1761. doi: 10.1158/1055-9965.EPI-13-0251. [DOI] [PMC free article] [PubMed] [Google Scholar]
- 5.Wikoff WR, Hanash S, DeFelice B, Miyamoto S, Barnett M, Zhao Y, et al. Diacetylspermine Is a Novel Prediagnostic Serum Biomarker for Non-Small-Cell Lung Cancer and Has Additive Performance With Pro-Surfactant Protein B. J Clin Oncol. 2015 doi: 10.1200/JCO.2015.61.7779. [DOI] [PMC free article] [PubMed] [Google Scholar]
- 6.Packer NH, von der Lieth CW, Aoki-Kinoshita KF, Lebrilla CB, Paulson JC, Raman R, et al. Frontiers in glycomics: bioinformatics and biomarkers in disease. An NIH white paper prepared from discussions by the focus groups at a workshop on the NIH campus, Bethesda MD (September 11–13, 2006) Proteomics. 2008;8:8–20. doi: 10.1002/pmic.200700917. [DOI] [PubMed] [Google Scholar]
- 7.Ruhaak LR, Miyamoto S, Lebrilla CB. Developments in the identification of glycan biomarkers for the detection of cancer. Mol Cell Proteomics. 2013;12:846–855. doi: 10.1074/mcp.R112.026799. [DOI] [PMC free article] [PubMed] [Google Scholar]
- 8.Kornfeld R, Kornfeld S. Assembly of asparagine-linked oligosaccharides. AnnuRevBiochem. 1985;54:631–664. doi: 10.1146/annurev.bi.54.070185.003215. [DOI] [PubMed] [Google Scholar]
- 9.Hoagland LF, Campa MJ, Gottlin EB, Herndon JE, Patz EF., Jr Haptoglobin and posttranslational glycan-modified derivatives as serum biomarkers for the diagnosis of nonsmall cell lung cancer. Cancer. 2007;110:2260–2268. doi: 10.1002/cncr.23049. [DOI] [PubMed] [Google Scholar]
- 10.Arnold JN, Saldova R, Galligan MC, Murphy TB, Mimura-Kimura Y, Telford JE, et al. Novel glycan biomarkers for the detection of lung cancer. J Proteome Res. 2011;10:1755–1764. doi: 10.1021/pr101034t. [DOI] [PubMed] [Google Scholar]
- 11.Vasseur JA, Goetz JA, Alley WR, Jr, Novotny MV. Smoking and Lung Cancer-induced Changes in N-Glycosylation of Blood Serum Proteins. Glycobiology. 2012 doi: 10.1093/glycob/cws108. [DOI] [PMC free article] [PubMed] [Google Scholar]
- 12.Ruhaak LR, Nguyen UT, Stroble C, Taylor SL, Taguchi A, Hanash SM, et al. Enrichment strategies in glycomics based lung cancer biomarker development. Proteomics Clin Appl. 2013 doi: 10.1002/prca.201200131. [DOI] [PMC free article] [PubMed] [Google Scholar]
- 13.Pepe MS, Feng Z, Janes H, Bossuyt PM, Potter JD. Pivotal evaluation of the accuracy of a biomarker used for classification or prediction: standards for study design. J Natl Cancer Inst. 2008;100:1432–1438. doi: 10.1093/jnci/djn326. [DOI] [PMC free article] [PubMed] [Google Scholar]
- 14.Pepe MS, Etzioni R, Feng Z, Potter JD, Thompson ML, Thornquist M, et al. Phases of biomarker development for early detection of cancer. J Natl Cancer Inst. 2001;93:1054–1061. doi: 10.1093/jnci/93.14.1054. [DOI] [PubMed] [Google Scholar]
- 15.Goodman GE, Thornquist MD, Balmes J, Cullen MR, Meyskens FL, Jr, Omenn GS, et al. The Beta-Carotene and Retinol Efficacy Trial: incidence of lung cancer and cardiovascular disease mortality during 6-year follow-up after stopping beta-carotene and retinol supplements. J Natl Cancer Inst. 2004;96:1743–1750. doi: 10.1093/jnci/djh320. [DOI] [PubMed] [Google Scholar]
- 16.Kronewitter SR, An HJ, de Leoz ML, Lebrilla CB, Miyamoto S, Leiserowitz GS. The development of retrosynthetic glycan libraries to profile and classify the human serum N-linked glycome. Proteomics. 2009;9:2986–2994. doi: 10.1002/pmic.200800760. [DOI] [PMC free article] [PubMed] [Google Scholar]
- 17.Ruhaak LR, Taylor SL, Miyamoto S, Kelly K, Leiserowitz GS, Gandara D, et al. Chip-based nLC-TOF-MS is a highly stable technology for large-scale high-throughput analyses. Anal Bioanal Chem. 2013;405:4953–4958. doi: 10.1007/s00216-013-6908-z. [DOI] [PMC free article] [PubMed] [Google Scholar]
- 18.Dodd LE, Pepe MS. Partial AUC estimation and regression. Biometrics. 2003;59:614–623. doi: 10.1111/1541-0420.00071. [DOI] [PubMed] [Google Scholar]
- 19.DeLong ER, DeLong DM, Clarke-Pearson DL. Comparing the areas under two or more correlated receiver operating characteristic curves: a nonparametric approach. Biometrics. 1988;44:837–845. [PubMed] [Google Scholar]
- 20.Ruhaak LR, Barkauskas DA, Torres J, Cooke CL, Wu LD, Stroble C, et al. The Serum Immunoglobulin G Glycosylation Signature of Gastric Cancer. EuPA Open Proteom. 2015;6:1–9. doi: 10.1016/j.euprot.2014.11.002. [DOI] [PMC free article] [PubMed] [Google Scholar]
- 21.Schwedler C, Kaup M, Petzold D, Hoppe B, Braicu EI, Sehouli J, et al. Sialic acid methylation refines capillary electrophoresis laser-induced fluorescence analyses of immunoglobulin G N-glycans of ovarian cancer patients. Electrophoresis. 2014;35:1025–1031. doi: 10.1002/elps.201300414. [DOI] [PubMed] [Google Scholar]
- 22.Kodar K, Stadlmann J, Klaamas K, Sergeyev B, Kurtenkov O. Immunoglobulin G Fc N-glycan profiling in patients with gastric cancer by LC-ESI-MS: relation to tumor progression and survival. Glycoconj J. 2012;29:57–66. doi: 10.1007/s10719-011-9364-z. [DOI] [PubMed] [Google Scholar]
- 23.Qian Y, Wang Y, Zhang X, Zhou L, Zhang Z, Xu J, et al. Quantitative Analysis of Serum IgG Galactosylation Assists Differential Diagnosis of Ovarian Cancer. J Proteome Res. 2013 doi: 10.1021/pr4003992. [DOI] [PubMed] [Google Scholar]
- 24.Selman MHJ, Niks EH, Titulaer MJ, Verschuuren JJGM, Wuhrer M, Deelder AM. IgG Fc N-Glycosylation Changes in Lambed-Eaton Myasthenic Syndrome and Myasthenia Gravis. J Proteome Res. 2011;10:143–152. doi: 10.1021/pr1004373. [DOI] [PubMed] [Google Scholar]
- 25.Parekh RB, Dwek RA, Sutton BJ, Fernandes DL, Leung A, Stanworth D, et al. Association of rheumatoid arthritis and primary osteoarthritis with changes in the glycosylation pattern of total serum IgG. Nature. 1985;316:452–457. doi: 10.1038/316452a0. [DOI] [PubMed] [Google Scholar]
- 26.Wuhrer M, Stavenhagen K, Koeleman CA, Selman MH, Harper L, Jacobs BC, et al. Skewed Fc glycosylation profiles of anti-proteinase 3 immunoglobulin G1 autoantibodies from granulomatosis with polyangiitis patients show low levels of bisection, galactosylation, and sialylation. J Proteome Res. 2015;14:1657–1665. doi: 10.1021/pr500780a. [DOI] [PubMed] [Google Scholar]
- 27.Saldova R, Royle L, Radcliffe CM, Abd Hamid UM, Evans R, Arnold JN, et al. Ovarian cancer is associated with changes in glycosylation in both acute-phase proteins and IgG. Glycobiology. 2007;17:1344–1356. doi: 10.1093/glycob/cwm100. [DOI] [PubMed] [Google Scholar]
- 28.Moore JS, Wu X, Kulhavy R, Tomana M, Novak J, Moldoveanu Z, et al. Increased levels of galactose-deficient IgG in sera of HIV-1-infected individuals. AIDS. 2005;19:381–389. doi: 10.1097/01.aids.0000161767.21405.68. [DOI] [PubMed] [Google Scholar]
Associated Data
This section collects any data citations, data availability statements, or supplementary materials included in this article.