

Abstract
Objective
Limb‐girdle muscular dystophy 2A (LGMD2A, OMIM) is a slowly progressive myopathy caused by the deficiency in calpain 3, a calcium‐dependent cysteine protease of the skeletal muscle.
Methods
In this study, we carried out an observational study of clinical manifestations and disease progression in genetically confirmed LGMD2A patients for up to 4 years. A total of 85 patients, aged 14–65 years, were recruited in three centers located in metropolitan France, the Basque country, and the Reunion Island. They were followed up every 6 months for 2 years and a subgroup was assessed annually thereafter for two more years. Data collected for all patients included clinical history, blood parameters, muscle strength assessed by manual muscle testing (MMT) and quantitative muscle testing, functional scores, and pulmonary and cardiac functions. In addition, CT scans of the lower limbs were performed in a subgroup of patients.
Results
Our study confirms the clinical description of a slowly progressive disorder with onset in the first or second decade of life with some degree of variability related to gender and mutation type. The null mutations lead to a more severe phenotype while compound heterozygote patients are the least affected. Muscle weakness is remarkably symmetrical and predominant in the axial muscles of the trunk and proximal muscles of the lower limb. There was a high correlation between the weakness at individual muscle level as assessed by MMT and the loss of density in CT scan analysis.
Interpretation
All the generated data will help to determine the endpoints for further clinical studies.
Introduction
Limb‐girdle muscular dystrophy type 2A (LGMD2A, OMIM 253600; also referred to as primary calpainopathy) is one of the most frequent subtypes of autosomal recessive muscular dystrophy, accounting for up to 30% of all recessive LGMD cases taken together. Interestingly, its prevalence is markedly higher in a couple of genetic isolates such as in the Reunion Island, an overseas French territory, in the Basque province of Gipuzkoa, Spain, and in several Amish communities settled in the United States.1, 2, 3
This condition is due to inactivating mutations occurring in the CAPN3 gene which encodes a skeletal muscle enzyme named calpain 3.4, 5 This enzyme is a skeletal muscle‐specific form of calpains, a family of intracellular calcium‐dependent cysteine proteases mediating their activity through limited proteolysis of various target substrates.6 Within the muscle fiber, calpain 3 is located in at least two regions of the sarcomere (the I‐band and the M‐line), thanks to binding to titin, a giant elastic filamentous protein of the sarcomere.7 Over 450 distinct pathological mutations have been identified so far (www.dmd.nl). They affect all domains of the protein and result, in the majority of cases, in impaired autolysis and proteolytic activity of the enzyme. Interestingly, 20–30% of LGMD2A patients exhibit normal calpain 3 protein levels as measured by western blotting.8 This makes the positive diagnosis of primary calpainopathy even more challenging. Although the precise function of calpain 3 is yet to be clarified, this enzyme is believed to participate in sarcomere remodeling.9 Calpain 3 deficiency has been associated with a number of other cellular perturbations such as delayed myofibrillogenesis in vitro,10 a defective antiapoptotic pathway of NF‐kB/IkBa,11 abnormality of the ubiquitin proteasome pathway and heat‐shock proteins,12 impairment of the SR Ca2+ and calmodulin protein kinase II, and myofibril‐based signalings.13, 14 Altogether, it appears that pathogenic CAPN3 mutations disrupt multiple homeostatic mechanisms in skeletal muscles, resulting in LGMD2A.
Defining the natural history of a given myopathy is a key pre‐requisite to any therapeutic intervention. It is also an appropriate way to establish standards of care for each group of neuromuscular disorders. This is particularly true in calpainopathy where muscle decline appears not only slow but also variable on an individual basis. To this end, we decided to carry out a binational multicentric study in a population of molecularly proven LGMD2A patients. This study was designed to reach the following objectives: (1) better define the clinical characteristics of a large group of patients with confirmed calpainopathy, (2) describe the profile and degree of muscle weakness as well as the various modalities of disease progression, and (3) select outcome measures for future clinical trials.
Materials and Methods
Population
Patients were enrolled at three clinical sites: Institute of Myology (Paris, France; Center 1), Hospital Donostia (San Sebastian, Spain; Center 2), and Groupe Hospitalier Sud Réunion (St Pierre, Réunion Island; Center 3) during the period 2004–2005. The inclusion criteria for enrollment are diagnosis of LGMD2A confirmed by two mutations in the CAPN3 gene or one mutation and decrease in calpain 3 on western blot (only one patient was in that case and is not reported here); patients could be ambulant or nonambulant. The exclusion criteria are any other progressive chronic disease such as cancer, severe immune deficiency, marked mental deficiency, conditions that prevent muscle force testing. All patients (and their parents if aged below 18) provided informed consent before enrollment. Data management was approved by the French national data protection authority (Commission Nationale Informatique et Libertés). The study as a whole was approved by the local ethics committee (CPP Ile‐de‐France VI, Hôpital Pitié‐Salpêtrière, Paris), the Ethical Board of Hospital Donostia, and the “ordre des médecins” (La Réunion). Genethon sponsored the study.
Analysis of consequences of the mutations at the RNA level
Lymphoblastoid cells were cultured in RPMI 1640 medium supplemented with fetal bovine serum (FBS, 10%) and gentamicin (10 μg/mL). One μg of total RNA isolated from 40 million cells using Trizol (Life Technologies, ThermoFisherScientifc, Waltham, MA, USA) was subjected to cDNA synthesis using the RevertAid kit (Fermentas, ThermoFisherScientifc, Waltham, MA, USA) and random hexamers plus oligo dT. Because calpain 3 is not expressed at high levels on lymphocytes, nested PCRs were performed in two rounds using Taq Phusion (ThermoFisherScientific, Waltham, MA, USA). Primers are described in Table 1. A first round of 20 cycles of PCR was performed on 1 μL of the cDNA sample using one of the primers (A1, B1, C1, or D1) and a second round of 30 cycles of amplification followed on 1 μL of PCR product with one of the primers (A2, B2, C2, or D2). The final PCR product was visualized by gel electrophoresis and sequenced using the Sanger method (Beckman Coulter, Brea, CA, USA).
Table 1.
Primer pair used for nested RT‐PCR analysis of mutations
| Position within the gene | Position within the cDNA | Name | Sequence | Size of the PCR product |
|---|---|---|---|---|
| First PCR | ||||
| 5′ to exon 4 | −188 to −169 | CAPN3‐A1a | cagctcggtttttaagatgg | 674 bp |
| 507–527 | CAPN3‐A1m | cgtccacccactctccatag | ||
| Exon 1 to exon10 | 274–293 | CAPN3‐B1a | aagttccccatccagttcgt | 1006 |
| 1260–1279 | CAPN3‐B1m | gaagcttgtcagactgcaga | ||
| Exon 14 to 3′ | 1751–1770 | CAPN3‐D1a | ttgaaaataccatctccgtg | 869 |
| 2590–2619 | CAPN3D1m | ggggtaaaatggaggaggaa | ||
| Second PCR | ||||
| 5′ to exon 3 | −63 to −42 | CAPN3‐A2a | ctttccttgaaggtagctgtat | 548 |
| 468–488 | CAPN3‐A2m | aagatccctgcgtagttttcg | ||
| Exon 2 to exon 10 | 341–360 | CAPN3‐B2a | atggagccaacagaactgac | 914 |
| 1235–1254 | CAPN3‐B2m | ggccgtgaggttgcagatct | ||
| Exon 15 to 3′ | 1792–1811 | CAPN3‐D2a | ccatcatcttcgtttcggac | 721 |
| 2503–2522 | CAPN3‐D2m | gggtgaaactgaaatcctga | ||
Analysis of the splicing site was performed using web tools (http://ibis.tau.ac.il/ssat/SpliceSiteFrame.htm, http://www.umd.be/HSF/4DACTION/input_SS, and http://rulai.cshl.edu/new_alt_exon_db2/HTML/score.html).
Patients assessment
The study was initially due to last 2 years and was later amended to extend the duration of follow‐up to 4 years. Where possible, all measurements were performed for each patient by the same evaluator throughout the study. Visits were planned every 6 months for the first 2 years and annually thereafter (Table 2).
Table 2.
Scheme of the study with the timing of the visits and the evaluation performed
| Items | Visits | Visit 6 Mo 36 | Visit 7 Mo 48 | |||||
|---|---|---|---|---|---|---|---|---|
| Preselection D −15 to D 0 | Initial Mo 0 | Visit 2 Mo 6 | Visit 3 Mo 12 | Visit 4 Mo 18 | Visit 5 Mo 24 | |||
| Height | x | x | x | x | x | |||
| Weight | x | x | x | x | x | x | x | |
| Clinical examination | x | x | x | x | x | x | x | |
| Background, disease history | x | |||||||
| Signature of consent | x | |||||||
| Karnofsky | x | x | ||||||
| Pulmonary function | x | x | x | x | ||||
| Echocardiogram | x | x | ||||||
| ECG | x | x | ||||||
| CK level | x | x | ||||||
| MMT | x | x | x | x | x | x | x | |
| QMTa | x | x | x | x | x | x | x | |
| MFM | x | x | x | x | x | x | x | |
| Functional independence measure | x | x | x | |||||
| CT scanb | x | x | ||||||
MMT, manual muscle testing; QMT, quantified muscle testing; MFM, muscle function measure; Mo, month.
Centers 1 and 2.
Centers 1 and 3.
Clinical measures
At the screening visit, all patients underwent a detailed clinical examination (Table 2) and clinical data were collected: first symptoms and age at first symptoms, age at initiation of muscle weakness, age at diagnosis, walking ability, walking aids if any, age at first wheelchair use when applicable, and genetic analyses. Cardiac investigations included electrocardiogram (ECG) and echocardiography with measurement of left ventricular ejection fraction (EF). EF was expressed in percentage of predicted values for age, gender, height, and weight. Respiratory evaluation was performed using standardized spirometry. Forced vital capacity (FVC) and forced expiratory volume in 1 sec (FEV1) were assessed and expressed in percentage of predicted values for age, gender, height, and weight. Several scales and scores were used to characterize the health status and functional grades of the patients: Karnofsky, Brooke, Vignos, and functional independence measure (FIM). Creatine kinase (CK) levels were measured at inclusion and at month 24.
Strength assessment
Strength was assessed using MMT in all the centers and QMT in Centers 1 and 2. MMT was assessed according to the modified Medical Research Council (MRC) scale.15 QMT was performed using fixed dynamometry. Strength values were expressed in percentage of predicted values computed for age, sex, and weight using predictive equations already published.16 This normalization allows computing composite scores in a suitable way.
Functional measurements
The patients were assessed using the MFM‐32 scale.17 The 32 items composing the MFM are classified into three dimensions: D1 for standing and transfers (13 items), D2 for axial and proximal motor function (12 items), and D3 for distal motor function (7 items, 6 of which involve the upper limb). The scoring is standardized and precisely described in the user's manual (www.mfm-nmd.org).
Muscle imaging
Computerized tomography (CT) scan of the patients’ lower limbs was performed on the following machine: GE‐Lightspeed CT01 QX/i for Center 1 and GE‐Lightspeed LS16 for Center 3 (GE Medical Systems, Buc, France). For each scan, two slices of the thigh and two slices of the calf part of the right leg were analyzed. Muscles were delimited individually with a polygonal selection tool in ImageJ software (National Institute of Health) to define a region of interest (ROI) for each muscle on a given slice. The operator used standard anatomical figures18, 19 and fascia membranes, when visible, as guides to mark out the muscles. To normalize area data, the surface section of the femur for thigh sections or the tibial bone for calf sections was measured. The numerical measurements taken from the ROIs of each structure were calculated with ImageJ software. Intensity values were expressed in Hounsfield Units, which reflects tissue density. Mean pixel intensities (MPIs) for thigh and legs were computed as the average MPIs of each slice normalized by their corresponding area.
Statistical analyses
The data are presented as means and SDs in the tables and as whisker boxes in the figures. Differences in categorical data were assessed using chi‐square tests. The effects of center or mutation type on the clinical and functional variables were first assessed using a one‐way ANOVA and then using a one‐way ANCOVA with the disease duration as a covariable. When appropriate, Fisher's PLSD post hoc tests were performed to identify the origin of differences. The effect of gender in functional tests was evaluated using Mann–Whitney tests. Correlations between variables were assessed using a Spearman rank correlation analysis. The changes in outcomes over time were estimated with individual linear regression slopes over the first 2 years and then over the longest follow‐up duration. Standardized response means (SRM) were computed in order to compare responsiveness of the different outcomes. SRM can be interpreted using Cohen's rule of thumb, which ranks the sensitivity to change into small (0.2–0.49), medium (0.50–0.79), and large (≥0.80).20 A P < 0.05 was considered statistically significant.
Results
General characteristics of the cohort
Among the patients examined in the three centers, 85 patients qualified for the study and were included: 20 patients at the Institute of Myology (Paris; Center 1), 35 at Hospital Donostia (San Sebastian; Center 2), and 30 at the University Hospital of St Pierre (La Réunion; Center 3). Characteristics of patients are presented in Table 3. These patients had a wide range of presentations, both with regard to age at inclusion (14–65 years) and age at disease onset (3–45 years) and walking ability. At inclusion, 56% patients were still able to walk (28% without any assistance) and 44% were using a wheelchair (mean age of 28.5 years old for wheelchair use onset). Only one patient was under noninvasive ventilation (age 51). During the course of the study, five patients lost ambulation, one before month 12 and four before month 24. The cohorts across centers are quite homogenous with the exception of slightly older mean age for patients in Center 1 compared to the other centers (P = 0.07). During the initial 2‐year period, only six patients (7%) were lost to follow‐up. In addition, three patients missed the month 24 visit because of inability to attend. A number of patients were followed during an additional 2‐year period with 64 patients seen at least once and 46 patients seen at month 48.
Table 3.
Characteristics of the patients
| With respect to centers (ANOVA or chi‐square) | |||||
|---|---|---|---|---|---|
| Patients at inclusion | Total | Center 1 | Center 2 | Center 3 | P |
| N = 85 | N = 20 | N = 35 | N = 30 | ||
| Age (years) | 37.0 (11.5) | 42.3 (12.2) | 36.2 (10.9) | 34.6 (11.2) | 0.060 |
| (14–65) | (19–65) | (16–60) | (14–63) | ||
| Sex (% F) | 41.9 | 47.6 | 42.9 | 36.7 | 0.11 |
| Mean age onset (years) | 13.5 (7.0) | 14.6 (8.7) | 12.3 (6.2) | 14.4 (6.7) | 0.39 |
| Range of age onset | (3–33) | (4–45) | (3–33) | (6–30) | |
| Walking (%) | 28 | 33.3 | 22.9 | 30.0 | 0.15 |
| With walking aid (cane, walker) | 28 | 14.3 | 42.9 | 20.0 | |
| Wheelchair | 44 | 52.4 | 34.3 | 50.0 | |
| With respect to mutations (ANOVA or chi‐square) | |||||
|---|---|---|---|---|---|
| All | M1 | M2 | M3 | P | |
| n | 85 | 10 | 20 | 55 | |
| Age (years) | 37.1 (11.6) | 45.3 (11.6) | 40.1 (11.7) | 34.5 (10.9) | 0.009 |
| Sex (% women) | 41 | 50 | 35 | 42 | 0.724 |
| Age at first symptoms (years) | 13.6 (7.0) | 16.6 (8.2) | 17.5 (10.2) | 11.6 (4.2) | 0.002 |
| Age at diagnosis (years) | 22.2 (10.5) | 23.1 (6.4) | 26.6 (15.5) | 20.3 (8.3) | 0.066 |
| Disease duration (years) | 23.5 (10.9) | 28.7 (11.2) | 22.6 (9.7) | 22.8 (11.2) | 0.277 |
| Walking without help (%) | 28 | 40 | 30 | 25 | 0.036 |
| Walking with walking aid (%) | 28 | 10 | 55 | 22 | |
| Wheelchair dependent | 44 | 50 | 15 | 53 | |
| Age at loss of independent ambulation (years) | 28.5 (9.5) | 37.7 (7.5) | 29.9 (11.1) | 26.8 (8.7) | 0.026 |
| CK (UI) | 724 (599) | 483 (536) | 861 (450) | 712 (652) | 0.285 |
| Forced vital capacity (%) | 78.4 (21.4) | 93.8 (27.2) | 81.3 (15.5) | 74.5 (21.1) | 0.024 |
| FEV1 (%) | 86.1 (22.9) | 99.2 (29.6) | 90.2 (17.7) | 82.2 (22.4) | 0.062 |
| Ejection fraction (%) | 67.4 (8.3) | 61.1 (6.7) | 68.6 (7.6) | 68.1 (8.4) | 0.035 |
| Brooke score | 3.4 (1.0) | 3.5 (1.0) | 2.9 (0.8) | 3.5 (1.1) | 0.142 |
| Vignos score | 6.4 (2.6) | 6.5 (2.0) | 5.1 (2.7) | 6.9 (2.5) | 0.029 |
| FIM (%) | 80.5 (15.1) | 78.9 (14.7) | 88.3 (6.5) | 77.9 (16.6) | 0.028 |
| Index of Karnofsky | 58 (15) | 54 (18) | 65 (11) | 56 (15) | 0.065 |
FEV1, forced expiratory volume in 1 sec; M1, patients with two missense mutations; M2, patients with one missense and one null mutation; M3, patients with two null mutations; FIM, functional independence measure.
Genetic data of the cohort
In total, 85 patients accounted for 70 families. Consanguinity was reported in 14% of the whole cohort. However, more than half of the patients (57%) were homozygous for a given mutation (29% in Center 1, 66% in Center 2, and 58% in Center 3). This situation is in accordance with the high frequency of specific mutations previously reported in the geographic areas of Centers 2 and 3. All mutations are annotated according to the NM_000070.2 and NP_000061 reference sequences. A total of 38 different mutations were present in the whole population (27, 11, and 6 different ones in Centers 1, 2, and 3, respectively; Fig. 1A) with two in common between Centers 1 and 2, (c.802‐9G>A and c.1309C>T), two between Centers 1 and 3 (c.946‐1G>A and c.1872C>T), and two between Centers 2 and 3 (c.1465C>T and c.2362_2363delinsTCATCT). The most frequent mutation is the so‐called Basque mutation (c.2362_2363delinsTCATCT), observed in 31 patients in Center 2 (22 at the homozygous state) and four in Center 3 (all heterozygotes), followed by the Reunion mutation (c.946‐1G>A) in 24 patients in Center 3 (19 homozygotes) and one homozygote in Center 1.
Figure 1.

Nature of the mutations of the cohort. (A) Schematic representation of the calpain 3 gene with the different exons and the locations of the mutations of the cohort. The light gray squares represent calpain 3 exons and the dark gray squares the corresponding protein domains. In blue: missense mutations; in orange: null mutations; in red: the only in‐frame one amino acid deletion. The number in the circle represents the number of alleles seen in the population. The external circles indicate the mutations observed in common in the different centers. (B) Distribution of the type of mutations according to center.
Among the eight mutations previously classified as intronic, five of them (present nomenclature in the Leiden database: c.632+4A>G [intron 4], c.802‐9G>A [intron 5], c.945+1delG [intron 6], c.2115+1_21115+2dup [intron 19], and c.2185‐2A>G [intron 20]) have not been evaluated at the RNA level, thus preventing their categorization as in‐ or out‐of‐frame mutations. To evaluate their potential effect on splicing of the CAPN3 messenger, RNA from lymphoblastoid cells from the corresponding patients was extracted and subjected to RT‐PCR analysis and sequencing, with the exception of c.2185‐2A>G mutation because of the lack of availability of cells of the patient or any carrier in the family. The c.632+4 A>G mutation modifies the strength of the donor splice site in intron 4 and leads to the complete exclusion of exon 4 (r.499_632del), codon frameshift, and premature stop codon (p.F167Afs*29; Fig. 2A). The c.802‐9G>A transition mutation creates a new splice site with a much higher score than the acceptor 3′ splice site (from 2.9 to 7.2) and leads to the insertion of seven nucleotides of intron 5 (r.801_802ins802‐7_802‐1), frameshift and premature stop codon (p.D268Afs*31; Fig. 2B). For the so‐called c.945+1delG mutation, the PCR analysis did not reveal any consequences on the splicing. Reexamination of the sequence and calculation of the splicing score indicates that the splicing site is conserved and that this mutation should be considered as an exonic mutation with deletion of a G in the last codon of exon 6 (c.944delG), leading to frameshift and premature stop codon (p.T316Qfs*36; Fig. 2C). The sequencing of the RNA with the mutation indicated as c.2115+1_2115+2dup revealed the insertion of two base pairs (GT) between exon 19 and 20, corresponding to r2115‐2116insGT. It leads to an insertion within an exon, leading to frameshift and premature stop codon (pT706Vfs*70; Fig. 2D). For the c.2185‐2A>G mutation because of the lack of availability of cells of the patient or any carrier in the family, we relied on the use of bioinformatics tools to estimate the consequences of the mutation. All programs predicted the disappearance of the acceptor splicing site of intron 20. Because of the exon 21 nucleotide sequence count is not a multiple of three, it is highly probable that the mutation would lead to a frameshift and therefore could be classified as a null mutation.
Figure 2.

Schematic representation of the consequences of five mutations at RNA level. The normal allele is on the left and the mutated allele on the right. The bases corresponding to introns and exons are in lower and upper cases, respectively. The corresponding translation is indicated below the figure in a one letter code. It should be noted that donor (5′) and acceptor (3′) sites are defined by the classical consensus sequences AG/gtRagt and (Y)ncag/GT (where R, purine A/G and Y, pyrimidine T/C, respectively). (A) The transition mutation c.632+4A>G reduces the homology of the donor splicing site in intron 4 to 5′ consensus splice site from 78% to 68%. A calculation of the force of the site was performed according to the GENIE software and is shown in the figure. (B) The transition c.802‐9G>A creates a new splice site with a GENIE score of 7.2 compared to 2.9 for the original splicing site. This leads to the inclusion of seven bases in exon 6, frame shift, and premature stop codon. (C) The mutation c.944delG within exon 6 leads to a frameshift and a premature stop codon. It should be noted that the mutation was wrongly labeled as intronic (c.945+1delG) in previous reports. (D) The mutation c.2115insGT adds two nucleotides within exon 19, leading to frameshift and premature stop codon. It should be noted that the mutation was wrongly labeled as intronic (c.2115+1_2115+2dup) in previous reports.
Following these analyses, we classified the patients into three groups as follows (Fig. 1B): 2 nonsense mutations (5.3%), 12 microdeletions/insertions including one in‐frame one amino acid deletion (31.5%), 6 mutations affecting the splicing process (15.8%), and 19 missense mutations (50.0%).
Baseline data
The characteristics of patients at baseline are presented in Table 3, as a whole and according to the mutation type (M1 for 2 missense mutations [N = 10], M2 for one missense [N = 20], and one null and M3 for 2 null mutations [N = 55]). The mean age of onset is 13.6 (±7.0) years and the mean age for wheelchair usage onset is 28.5 (±9.5) years. Most of the patients presented mild contractures with the most frequent impaired articulations being ankles (86%), hips (69%), knees (63%), and elbows (56%). Scapular winging was reported in patients from Center 1 (19%), Center 2 (18%), and none from Center 3. Walking perimeter for ambulant patients was 453.8 m on average. A clear‐cut difference between the different mutation groups was noted in terms of age of onset, either when considering the age at first symptoms age at muscle weakness onset or age at loss of independent ambulation. For all these parameters, the patients with null mutations presented an earlier onset.
The mean FVC was 78% of normal expected values. Only 10 patients had a restrictive syndrome with FVC figures below 50% with one of them requiring noninvasive ventilation. Few patients presented with nonlife‐threatening cardiac abnormalities: 6% were mildly symptomatic with palpitations (three cases), dyspnea (one case), and hypertrophic cardiomyopathy (one case). The mean left ventricular EF measured in 80 patients was 67.5% with only six cases (16%) presenting with an EF lower than 60%.
The distribution of the MMT scores of the 23 muscles tested is shown in Figure 3A and a representation of the score is depicted at the anatomic level in Figure 3B. The weakness was symmetrical for all MMT scores (P > 0.05). The weakest muscles were rather axial and proximal such as the muscles of the trunk (i.e., latissimus dorsi and pectoralis major), for the upper body and the adductors, hamstrings, glutei, and iliopsoas for the lower limbs, while the more spared muscles were distal muscles such as the flexor carpi, the tibialis posterior and anterior, and the triceps surae.
Figure 3.

MMT score at baseline in all the 23 tested muscles. (A) Boxplots illustrating MMT scores for individual muscles in the patients. Box extends from 25th to 75th percentile. The line is the median. Whiskers extend to largest and smallest observed values within 1.5 box lengths. (R, right; L, left). The muscles were sorted out according to the median. The MMT scale is indicated on the right of the graphs. Upper panel: upper limb and trunk muscles. Lower panel: lower limb muscles. (B) Anatomic representation of the MMT scores where the score is indicated by a rainbow color table from red (grade 1) to green (grade 5).
Strength values obtained with the quantitative muscle testing (QMT) concern five different functions (grip, elbow extension and flexion, and knee flexion and extensions) and are expressed as % of predicted values (Fig. 4A). They were perfectly in accordance with the results obtained with MMT in terms of impairment since the correlations between the different QMT scores and the MMT for the corresponding muscles were all statistically significant (Table 4).
Figure 4.

QMT and MFM scores. (A) QMT scores at baseline (in % of predicted values). Boxplots illustrating QMT scores for individual functions in the patients. Box extends from 25th to 75th percentile. The line is the median. Whiskers extend from the lowest data still within 1.5 interquartile range (IQR) of the lower quartile, and the highest data still within 1.5 IQR of the upper quartile. R, right; L, left. The functions were organized according to the median. (B) MFM score at baseline (in % of maximum values). Boxplots illustrating total, D1, D2, and D3 MFM scores. Box extends from 25th to 75th percentile. The line is the median. Whiskers extend from the lowest data still within 1.5 IQR of the lower quartile, to the highest data still within 1.5 IQR of the upper quartile. R, right; L, left. (C) Relationship between function as measured by the MFM and strength as measured either by MMT (left panel) or QMT (right panel). Note that this relationship is linear between MFM and MMT scores and curvilinear between MFM and QMT scores. The subject highlighted in the red circle had fixation of the hips due to contractures and was not able to perform any MFM items in the standing position.
Table 4.
Correlations between MMT and QMT (all P < 0.0001)
| Function QMT (MMT muscle) | Side | Spearman rho |
|---|---|---|
| Elbow flexion (MMT biceps brachii) | Left | 0.564 |
| Right | 0.543 | |
| Elbow extension (MMT triceps brachii) | Left | 0.848 |
| Right | 0.858 | |
| Hand grip (MMT flexor carpi) | Left | 0.510 |
| Right | 0.538 | |
| Knee flexion (MMT hamstrings) | Left | 0.729 |
| Right | 0.759 | |
| Knee extension (MMT quadriceps femoris) | Left | 0.774 |
| Right | 0.769 |
The functional performance as measured by the MFM‐32 yielded a score of 54.9 ± 15.9% (percentage compared to the maximum possible score) on the whole population of patients (Fig. 4B). Dimension D1 was the most impaired and reached only 18.6 ± 19.7%, D2 reached 73.0 ± 18.6%, and D3 was the most preserved (91.4 ± 12.5%). The MFM score was highly correlated with the MMT total score (rho = 0.784; P < 0.001) and the QMT composite score (rho = 0.719; P < 0.001). The relationship between MFM and MMT was linear while the relationship between MFM and QMT was rather curvilinear (Fig. 4C), indicating that strength is lost before function, probably because of compensatory mechanisms exerted by other muscle groups.
MMT, QMT, and MFM evaluations of the patients were then assessed according to the following variables: gender, disease duration, and nature of the mutations (Table 5). In this analysis, the MMT scorings of the different muscles were pooled into different categories (upper, lower, trunk, proximal, and distal scores). A gender effect was observed on MMT scores when regrouped as a proximal score which corresponds to the most affected muscles (Table 5). A gender effect was noticed in the QMT total score (P = 0.004; Table 5) with significant differences in most preserved functions as well as in the MFM total score (P = 0.039) with a high significance in the D1 and D3 dimensions (P = 0.006 and 0.018, respectively; Table 5). Overall, since there was no difference in terms of disease duration (P = 0.083) or nature of mutations (P = 0.999) between gender, the tests indicated that women were significantly stronger that men. The muscle strength was correlated with the disease duration in all tests except for knee flexion and extension as assessed by QMT (Table 6). Consistently, examination of the individual values indicated that these two functions were lost early in a number of patients, preventing any further evolution. The influence of the nature of mutations was significant (P < 0.05) on MMT and QMT total scores and on most of the subset scores of these two evaluations (Table 7). As an overall picture, the severity of the clinical presentation appears to be the most severe for patients with M3 mutations and the less severe for the patients with M2 mutations.
Table 5.
Functional measurements at baseline according to gender (Mann–Whitney)
| Women | Men | P | |
|---|---|---|---|
| MMT (0–5) | |||
| Total score | 2.9 (0.6) | 2.7 (0.6) | 0.103 |
| Lower score | 2.9 (0.6) | 2.7 (0.6) | 0.119 |
| Upper score | 2.9 (0.7) | 2.7 (0.6) | 0.092 |
| Trunk | 2.7 (0.7) | 2.6 (0.7) | 0.376 |
| Distal score | 4.2 (0.6) | 4.2 (0.8) | 0.986 |
| Proximal score | 2.4 (0.6) | 2.1 (0.6) | 0.024 |
| QMT (%) | |||
| Total score | 24.3 (15.6) | 16.7 (12.1) | 0.004 |
| Hand grip | 51.0 (25.1) | 38.8 (21.0) | 0.043 |
| Elbow flexion | 8.5 (6.7) | 6.0 (3.8) | 0.074 |
| Elbow extension | 36.2 (25.2) | 23.4 (25.3) | 0.015 |
| Knee flexion | 7.1 (6.9) | 6.9 (9.5) | 0.413 |
| Knee extension | 10.5 (5.2) | 7.6 (11.8) | 0.003 |
| MFM (%) | |||
| Total score | 59.4 (16.7) | 51.6 (15.5) | 0.039 |
| D1 | 25.5 (23.1) | 13.6 (17.0) | 0.006 |
| D2 | 75.8 (18.9) | 70.9 (18.2) | 0.216 |
| D3 | 94.2 (7.3) | 89.4 (15.0) | 0.018 |
Note that QMT was evaluated only in Centers 1 and 2. Note that disease duration is not different between genders (P = 0.089) or between mutations (P = 0.999).
Table 6.
Functional measurements according to disease duration (Spearman)
| Rho | P | |
|---|---|---|
| MMT | ||
| Total score | −0.515 | <0.001 |
| Lower score | −0.396 | <0.001 |
| Upper score | −0.536 | <0.001 |
| Trunk | −0.453 | <0.001 |
| Distal score | −0.411 | <0.001 |
| Proximal score | −0.487 | <0.001 |
| QMT (%) | ||
| Total score | −0.407 | 0.002 |
| Hand grip | −0.424 | 0.002 |
| Elbow flexion | −0.585 | <0.001 |
| Elbow extension | −0.509 | <0.001 |
| Knee flexion | −0.134 | 0.357 |
| Knee extension | −0.120 | 0.393 |
| MFM (%) | ||
| Total score | −0.649 | <0.001 |
| D1 | −0.552 | <0.001 |
| D2 | −0.612 | <0.001 |
| D3 | −0.464 | <0.001 |
Table 7.
Functional measurements according to type of mutation (ANOVA)
| All | M1 | M2 | M3 | P | |
|---|---|---|---|---|---|
| MMT | |||||
| Total score | 2.8 (0.6) | 2.7 (0.6) | 3.1 (0.5) | 2.7 (0.6) | 0.013 |
| Upper score | 2.8 (0.7) | 2.5 (0.7) | 3.1 (0.6) | 2.7 (0.6) | 0.020 |
| Lower score | 2.8 (0.6) | 2.8 (0.6) | 3.1 (0.5) | 2.7 (0.6) | 0.011 |
| Trunk | 2.6 (0.7) | 2.7 (0.5) | 2.8 (0.7) | 2.5 (0.7) | 0.260 |
| Distal score | 4.2 (0.7) | 3.9 (0.8) | 4.4 (0.5) | 4.1 (0.7) | 0.114 |
| Proximal score | 2.2 (0.6) | 2.1 (0.6) | 2.6 (0.6) | 2.1 (0.6) | 0.012 |
| Proximal upper score | 2.5 (0.7) | 2.2 (0.7) | 2.8 (0.7) | 2.4 (0.7) | 0.020 |
| Proximal lower | 1.9 (0.6) | 2.0 (0.5) | 2.3 (0.6) | 1.8 (0.5) | 0.006 |
| QMT (%) | |||||
| Total score | 20.2 (14.2) | 21.1 (7.2) | 30.0 (21.7) | 15.4 (8.9) | 0.006 |
| Upper score | 18.3 (14.5) | 17.7 (11.4) | 26.9 (21.8) | 14.6 (9.4) | 0.058 |
| Lower score | 8.0 (7.6) | 10.0 (4.3) | 13.2 (11.1) | 5.3 (5.5) | 0.005 |
| Hand grip | 44.3 (23.5) | 21.7 (22.9) | 58.1 (29.1) | 35.7 (16.8) | 0.004 |
| Elbow flexion | 7.1 (5.3) | 7.2 (8.1) | 9.1 (6.6) | 6.1 (3.3) | 0.419 |
| Elbow extension | 29.1 (25.8) | 27.0 (18.6) | 44.9 (38.6) | 22.4 (16.6) | 0.029 |
| Knee flexion | 7.0 (8.4) | 9.8 (7.0) | 14.0 (10.9) | 3.2 (4.9) | <0.001 |
| Knee extension | 8.8 (9.6) | 10.8 (4.8) | 13.0 (16.6) | 6.4 (5.7) | 0.076 |
| MFM (%) | |||||
| Total score | 54.9 (15.9) | 54.4 (14.9) | 62.1 (14.1) | 52.6 (16.3) | 0.072 |
| D1 | 18.6 (20.6) | 19.7 (18.8) | 27.4 (23.0) | 15.2 (19.4) | 0.077 |
| D2 | 73.0 (18.6) | 71.1 (16.4) | 80.0 (14.4) | 71.0 (20.0) | 0.168 |
| D3 | 91.4 (12.5) | 90.0 (10.1) | 95.7 (5.3) | 90.2 (14.5) | 0.232 |
Note that disease duration is not different between mutations (P = 0.458).
Disease progression
We also analyzed the temporal changes of the parameters. Optimally, measurements were taken on seven occasions over the 4 years of the study (months 0, 6, 12, 18, 24, 36, and 48). To assess and compare responsiveness, slopes of change of the functional outcomes and their SRM were computed at months 24 and 48 after the 2‐year and 4‐year follow‐up, respectively (Fig. 5 and Table 8). Specifically, the MMT seems to be the most sensitive test (SRM > 0.5), suggesting that the loss of strength is more significant than the loss of function. The average of individual muscle strength deterioration as assessed by MMT leads to a 2–3% decrease per year as compared to initial values at inclusion, corresponding to a loss of half a testing point in 4 years (Fig. 5A). When considering both the median of the MMT evolution for each muscle and its significance which is dependent on the variability among individuals, the muscles showing the highest decline were in the upper body with the triceps brachii, the deltoid, the trapezius, and the pectoralis major being the muscles evolving the most (Fig. 5B). In the lower limbs, the tibialis anterior, triceps surae, tibialis posterior, and to a lesser extent, the fibularis and hamstrings were the muscles showing the highest decline (Fig. 5B). For QMT, only elbow flexion showed a significant decrease after 2 years that further diminished at the 4 year follow‐up (P = 0.002; Table 6, Fig. 5C). For MFM, only the D1 after 4 years indicated significant decline over time (Table 8, Fig. 5D). The observation of the respective decline between the different mutation types of the MMT, QMT, and MFM evaluations (Fig. 6) also confirmed a steeper decline for the M3 group.
Figure 5.

Evolution of MT, QMT, and MFM‐32 scores throughout the study. (A) Change in MMT mean scores over 4 years. The number of subjects available for each visit is indicated above each graph. (B) Changes in MMT scores of the individual muscles (left panel: upper and trunk muscles; Right panel: lower leg muscle). Boxplots extends from 25th to 75th percentile. The line is the median. Whiskers extend from the lowest data still within 1.5 IQR of the lower quartile, and the highest data still within 1.5 IQR of the upper quartile. R, right; L, left. The significance is indicated by a rainbow color table from red (significant) to green (nonsignificant). (C) Change in QMT mean scores over 4 years. The number of subjects available for each visit is indicated over each graph. (D) Change in MFM scores over 4 years. The number of subjects available for each visit is indicated over each graph.
Table 8.
Standardized response mean (SRM) at 2 and 4 years for MMT, QMT, and MFM
| SRM at 2 years | SRM at 4 years | |
|---|---|---|
| MMT | ||
| Total score | −0.95 | −1.22 |
| Lower score | −0.63 | −0.97 |
| Upper score | −0.76 | −0.84 |
| Trunk | −0.30 | −0.34 |
| Distal score | −0.24 | −0.38 |
| Proximal score | −0.94 | −0.87 |
| QMT (%) | ||
| Total score | −0.08 | −0.17 |
| Hand grip | 0.21 | −0.00 |
| Elbow flexion | −0.63 | −0.79 |
| Elbow extension | −0.22 | −0.27 |
| Knee flexion | −0.30 | −0.21 |
| Knee extension | 0.21 | 0.29 |
| MFM (%) | ||
| Total score | −0.31 | −0.56 |
| D1 | −0.39 | −0.62 |
| D2 | −0.14 | −0.26 |
| D3 | −0.04 | −0.21 |
[SRM] > 0.5 are indicated in bold.
Figure 6.

CT scan analysis. (A) Representative images of four CT scan sections. Cross‐sections are chosen according to anatomical reference points such as vessel location or muscle position. Regions of interest (ROIs) were determined manually with ImageJ software following the muscles shape and the fascia membrane when perceptible. (B) Density per muscle at baseline. Boxplots illustrating the MPI for individual muscles (HU: Hounsfield Unit). Box extends from 25th to 75th percentile. The line is the median. Whiskers extend from the lowest data still within 1.5 IQR of the lower quartile, and the highest data still within 1.5 IQR of the upper quartile. The muscles were ranked according to the median. (C) Anatomic representation of density at baseline. The density is indicated by a rainbow color table from red (−85 HU) to green (43 HU).
Among the other parameters, walking perimeters went from 453.8 ± 813.8 at inclusion (85 patients) to 317.1 ± 632.4 at month 12 (81 patients) and 260.4 ± 533.7 at month 24 (78 patients). In total, at least eight persons (9%) lost the walking ability over the 4 years of the protocol. There was no significant change in the FIM, Brooke, or Vignos scores. Contractures worsen moderately and the number of patients with ankle contractures rose from 86% to 95%.
CT scan analysis
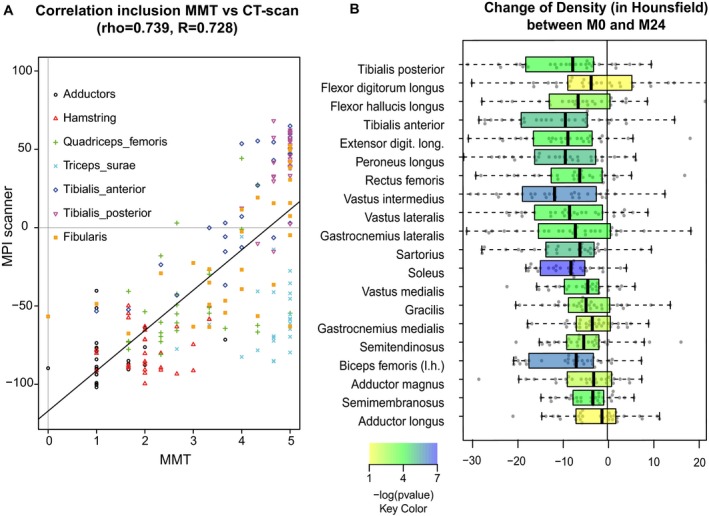
CT scans of lower limbs were performed at the beginning of the study and 2 years later on 30 patients (15 from Center 1 and 15 from Center 3). CT scan cross‐sectional images of four cross sections (first third and second third of thigh and first quarter and middle of leg) were processed with a manual muscle segmentation method (Fig. 7A). Only the right legs were analyzed since symmetry of impairment was showed in the strength analysis. Result density of muscles at inclusion is presented in Figure 7B. The less dense muscles were the adductors (longus and magnus) followed by the hamstrings (semimembranous, semitendinous, and biceps femoris), in total accordance with the MMT analysis. A representation of the score is depicted at the anatomic level in Figure 7C, clearly showing a proximal to distal and a posteroanterior gradient of impairment from the most affected to the most preserved. Overall, data from the CT scan images analysis globally correlated with strength data obtained from MMT. Indeed, the correlation of the observations made by the CT scan analysis and the MMT scores was strong (rho = 0.739). If the triceps surae muscle group was discarded from this analysis because of its between‐muscle heterogeneity, the correlation was even stronger (rho = 0.846). Finally, we showed evidence of a significant decrease in muscle density in most of the lower limb muscles in all patients after 2 years (Fig. 8). The deterioration was most obvious and more homogeneous between patients for the soleus muscle, vastus intermedius, and biceps femoris.
Figure 7.

Comparison of CT scan data and MMT and evolution of density over the period. (A) Comparison of CT scan with the MMT data showed a strong correlation (rho = 0.735, R = 0.724). (B) Boxplots illustrating evolution of density (in Hounsfield) for individual muscles. Box extends from 25th to 75th percentile. The line is the median. Whiskers extend from the lowest data still within 1.5 IQR of the lower quartile, and the highest data still within 1.5 IQR of the upper quartile. R, right; L, left. The order of muscles is the same as in Figure 5B. A color scale filling the box was used to indicate the P‐value from blue (the most significant) to red (the least significant).
Figure 8.
Evolution of the scores at individual level during the 4 years of the study according to the mutation types and the duration of the disease. (A) Change of the MMT global score. Each line represents one patient. Blue line: M1 (2 missense mutations); Violet: M2 (one missense and one null mutation); Orange: M3 (2 null mutations). (B) Change of the QMT global score. Each line represents one patient. Blue line: M1 (2 missense mutations); Violet: M2 (one missense and one null mutation); Orange: M3 (2 null mutations). (C) Change of the MFM global score. Each line represents one patient. Blue line: M1 (2 missense mutations); Violet: M2 (one missense and one null mutation); Orange: M3 (2 null mutations).
Discussion
A total of 85 genetically confirmed patients were enrolled in three participating centers, the whole representing one of the largest cohorts of LGMD2A patients studied so far. On one hand, integrating three different centers broadened the origin profile of the patients but on the other hand, the founder effects present in the patients of Centers 2 (Basque Country) and 3 (Reunion Island) led to a high representation of specific mutations, implying that the whole cohort may not be completely representative of the overall affected LGMD2A population. Moreover, the fact that predominant mutations are null mutations prevents our cohort to truly represent the real genetic spectrum of calpainopathy. Indeed, the percentage of null alleles in Centers 2 (78%) and 3 (90%) exceeds what was previously reported (about a third of calpain 3 null alleles in the Leiden database (www.dmd.nl) and 45% in a previous report.21 Since null mutations seem to have a higher deleterious effect than missense mutations, it is possible that clinical presentation reported here is more severe than the mainstream presentation of LGMD2A patients. Interestingly, we have clarified the consequences of five mutations present in the vicinity of splicing sites at a molecular level. We showed that two mutations were mislabeled initially since they were named according to the rule “the most 3′ position possible is arbitrarily assigned to have been changed” instead of being considered as exceptions because of the identical nucleotides flanking the exon/intron border.
An average profile at inclusion could be established by pooling all data pertaining to the 85 enrolled patients. Patients start experiencing first muscle symptoms around age 13.5 years with a wide range from 3 to 45 years of age, indicating that the onset can occur very early. The most frequent first complaints were related to mobility issues and limb‐girdle weakness. An obvious muscle weakness is noted at age 17 on average and the diagnosis of primary calpainopathy is established only at age 22, thus demonstrating a great delay in the diagnostic process. Nearly half of the study population (44%) was wheelchair dependent, loss of ambulation occurring at a mean age of 28.5 (±9.5) years.
In terms of clinical presentation, our study confirms and further delineates the picture previously reported in several earlier studies.2, 3, 21, 22, 23, 24, 25, 26 Muscle weakness, which is remarkably symmetrical, is predominant in the axial muscles of the trunk and proximal muscles of the lower limb. The resulting functional impairment highly impacts the ability to perform standing and transfer functions. The more spared muscles were distal muscles of the limbs and the sternocleidomastoid. Very few cardiac are reported in our cohort and are likely to be coincidental, in accordance to a recent comprehensive study showing a lack of cardiac involvement in calpainopathy patients.27 Compromise of respiratory functions was observed in a number of cases with 11% of patients showing a FVC <50%, indicating that respiratory complication is a possible but not salient feature in primary calpainopathy. Contractures are usually mild and, if any, predominate in the Achilles tendons.
Our imaging results at inclusion corroborated the muscle degeneration described in the rare studies performed in this disease28, 29, 30 with prominent involvement of thigh adductors, hamstrings, and medial head of the gastrocnemius. Concerning the progression which has never been evaluated by standardized imaging method prior to our study, we demonstrated a decrease of density in most of lower limb muscles in all patients after 2 years with a stronger deterioration in the soleus muscle, vastus intermedius, and biceps femoris. The present work indicates that imaging could be a valuable tool for a precise follow‐up of muscle disease and be useful in the context of a clinical trial. MRI should be considered as an alternative to CT scan as the lack of radiation exposure means it is more compatible with a regular follow‐up approach.
We also observed that women were less severely impaired than men as seen by a significant difference in the MMT proximal score, the total QMT score, the total score, and the D1 MFM scores, and as a higher proportion of women were still walking (72% vs. 48% men), despite age of onset, disease duration, and nature of the mutation being statistically comparable. Interestingly, previous reports had indicated an early onset in men rather than in women, difference relative to wheelchair dependent patients between genders or a more rapid progression in men.23, 31, 32 Interestingly, a difference in fiber atrophy between genders has recently been reported in LGMD,33 a fact which may support of this dissimilarity.
In all of the studies presenting an analysis of phenotype–genotype correlation in LGMD2A, a relationship between severity and nature of the mutations was clearly demonstrated. Indeed, patients carrying two null mutations that result in the premature truncation of protein synthesis are invariably characterized by a higher disease severity than patients with at least one missense mutation.2, 22, 34 Our study is no exception since, for a large number of parameters, the null mutations tend to lead not only to a more severe presentation, but we also observed that the M2 group corresponds to the less severe group (Table 2C). It was previously shown, in homozygous patients, that missense mutations have a large variety of outcomes, possibly due to their localization in domains of different functional importance, some being very severe.35 It was also suggested that the outcome for compound heterozygotes will depend on the interaction between the resulting mutated proteins, one being able to compensate for the other.36 Here, half of the M1 patients carry mutations in homozygous states, preventing any possibility of compensation with the protein coming from the second allele whereas the compensation is possible for M2 patients.
Among the previous studies aimed at describing the clinical features of the disease, only the initial publications reported a follow‐up of the progression2, 3, 21, 22 that was roughly evaluated using the Gardner–Medwin and Walton scale.37 The interindividual variability as measured by MMT, QMT, and MFM was significant, both at baseline and over the follow‐up, yielding small to modest SRM in most of the variables used. MMT was used in this study as it can quickly and inexpensively assess a large number of muscles, and thus produces a good clinical picture of muscle weakness. However, this is an ordinal nonlinear scale which is unsuitable in detecting small changes over a short period of time when the deficit is already pronounced. The change in MMT was relatively slow over time and yielded 0.1 point of total MMT score per year only and the total MMT score presented a large SRM (−0.95 over 2 years and −1.22 over 4 years). Elbow flexion was the only function as measured by QMT to significantly change although SRMs were moderate (−0.63 over 2 years and −0.79 over 4 years). This function could be a good candidate to assess the impact of a therapeutic intervention. It also presents a good intra‐ and interrater reproducibility.16 As for the MFM, the total score and the D1 showed a moderate change over 4 years. This study did not include tests that were subsequently generalized for the evaluation of muscular dystrophies such as the 6‐min walk test or the myoset.38, 39 They would probably be very useful tools in the case of LGMD2A, especially considering the modification of walking perimeter seen in the patients and the very slow progression of the disease.
Our study confirms the picture of a slowly progressive proximal disorder with onset in the first or second decade and progressive muscle weakness of the pelvic and, to a lesser extent, scapular girdles which is gender and mutation dependent. This study generated a large amount of data on the presentation and evolution of the disease that is expected to have a tremendous value for defining appropriate and pertinent protocols in such slowly evolving disease. It will be necessary to carefully select the most relevant type of mutations and tools that can evaluate precisely and with sensitivity the force of specific muscles combined with up‐to‐date imaging. Our results suggest also that different muscular targets for each phase of the disease must be considered in order to delineate the best outcome in future clinical trials.
Authors Contributions
I. R. planned and supervised the genetics part of the study and wrote the manuscript. J. Y. H. designed and wrote the protocol, analyzed the clinical data, and wrote the manuscript. D. S. planned and supervised the analysis of the imaging study and wrote the manuscript. C. A. M. P. designed and wrote the protocol, performed the data management and statistical analysis, and revised the manuscript. F. F. supervised the clinical evaluation of patients. B. E., C. M., A. D. L. M., and M. F. supervised the clinical evaluation of patients and contributed to the writing of the manuscript. J. A. U. designed and wrote the protocol, supervised the clinical evaluation of patients, and contributed to the writing of the manuscript. The members of The Calpainopathy Study Group and their affiliations are listed in a Appendix S1.
Conflict of Interest
There is no disclosure apart that “JAU received honorarium from the promoter (Genethon) to draft the preliminary report.”
Supporting information
Appendix S1. The Calpainopathy Study Group
Acknowledgments
We thank Dr Robert Carlier (Hôpital Raymond Poincaré), Dr Fabrice Thevenin (Hôpital Cochin), and Dr Antoine Feydey (Hôpital Cochin) for advice concerning anatomical criteria and use of PACS. We also acknowledge the excellent technical help of Emilie Laurent, Louise Danel, and Aurore Palicot. We thank Simone Birnbaum for thorough proof reading of the manuscript and text improvement, and Natacha Maizonnier for preparing the figures.
References
- 1. Allamand V, Broux O, Bourg N, et al. Genetic heterogeneity of autosomal recessive limb‐girdle muscular dystrophy in a genetic isolate (Amish) and evidence for a new locus. Hum Mol Genet 1995;4(3):459–463. [DOI] [PubMed] [Google Scholar]
- 2. Fardeau M, Hillaire D, Mignard C, et al. Juvenile limb‐girdle muscular dystrophy. Clinical, histopathological and genetic data from a small community living in the Reunion Island. Brain 1996;119(Pt 1):295–308. [DOI] [PubMed] [Google Scholar]
- 3. Urtasun M, Saenz A, Roudaut C, et al. Limb‐girdle muscular dystrophy in Guipuzcoa (Basque Country, Spain). Brain 1998;121(Pt 9):1735–1747. [DOI] [PubMed] [Google Scholar]
- 4. Beckmann JS, Richard I, Hillaire D, et al. A gene for limb‐girdle muscular dystrophy maps to chromosome 15 by linkage. C R Acad Sci III 1991;312(4):141–148. [PubMed] [Google Scholar]
- 5. Richard I, Broux O, Allamand V, et al. Mutations in the proteolytic enzyme calpain 3 cause limb‐girdle muscular dystrophy type 2A. Cell 1995;81(1):27–40. [DOI] [PubMed] [Google Scholar]
- 6. Goll DE, Thompson VF, Li H, et al. The calpain system. Physiol Rev 2003;83(3):731–801. [DOI] [PubMed] [Google Scholar]
- 7. Sorimachi H, Kinbara K, Kimura S, et al. Muscle‐specific calpain, p94, responsible for limb girdle muscular dystrophy type 2A, associates with connectin through IS2, a p94‐specific sequence. J Biol Chem 1995;270(52):31158–31162. [DOI] [PubMed] [Google Scholar]
- 8. Milic A, Daniele N, Lochmuller H, et al. A third of LGMD2A biopsies have normal calpain 3 proteolytic activity as determined by an in vitro assay. Neuromuscul Disord 2007;17(2):148–156. [DOI] [PubMed] [Google Scholar]
- 9. Duguez S, Bartoli M, Richard I. Calpain 3: a key regulator of the sarcomere? FEBS J 2006;273(15):3427–3436. [DOI] [PubMed] [Google Scholar]
- 10. Kramerova I, Kudryashova E, Tidball JG, Spencer MJ. Null mutation of calpain 3 (p94) in mice causes abnormal sarcomere formation in vivo and in vitro. Hum Mol Genet 2004;13(13):1373–1388. [DOI] [PubMed] [Google Scholar]
- 11. Baghdiguian S, Martin M, Richard I, et al. Calpain 3 deficiency is associated with myonuclear apoptosis and profound perturbation of the IkappaB alpha/NF‐kappaB pathway in limb‐girdle muscular dystrophy type 2A. Nat Med 1999;5(5):503–511. [DOI] [PubMed] [Google Scholar]
- 12. Kramerova I, Kudryashova E, Venkatraman G, Spencer MJ. Calpain 3 participates in sarcomere remodeling by acting upstream of the ubiquitin‐proteasome pathway. Hum Mol Genet 2005;14(15):2125–2134. [DOI] [PubMed] [Google Scholar]
- 13. Kramerova I, Kudryashova E, Ermolova N, et al. Impaired calcium calmodulin kinase signaling and muscle adaptation response in the absence of calpain 3. Hum Mol Genet 2012;21(14):3193–3204. [DOI] [PMC free article] [PubMed] [Google Scholar]
- 14. Ojima K, Ono Y, Hata S, et al. Muscle‐specific calpain‐3 is phosphorylated in its unique insertion region for enrichment in a myofibril fraction. Genes Cells 2014;19(11):830–841. [DOI] [PubMed] [Google Scholar]
- 15. Paternostro‐Sluga T, Grim‐Stieger M, Posch M, et al. Reliability and validity of the Medical Research Council (MRC) scale and a modified scale for testing muscle strength in patients with radial palsy. J Rehabil Med 2008;40(8):665–671. [DOI] [PubMed] [Google Scholar]
- 16. Hogrel JY, Payan CA, Ollivier G, et al. Development of a French isometric strength normative database for adults using quantitative muscle testing. Arch Phys Med Rehabil 2007;88(10):1289–1297. [DOI] [PubMed] [Google Scholar]
- 17. Berard C, Payan C, Hodgkinson I, Fermanian J. A motor function measure for neuromuscular diseases. Construction and validation study. Neuromuscul Disord 2005;15(7):463–470. [DOI] [PubMed] [Google Scholar]
- 18. Brizon J, Castaing J. Les feuillets d'anatomie. Les muscles du membre inférieur: Librairie Maloine, 1953. [Google Scholar]
- 19. Gray H. Anatomy of the human body. Philadelphia: Lea & Febiger: Bartleby, 1918. [Google Scholar]
- 20. Bjorgvinsson T, Kerr P. Use of a common language effect size statistic. Am J Psychiatry 1995;152(1):151. [DOI] [PubMed] [Google Scholar]
- 21. Richard I, Roudaut C, Saenz A, et al. Calpainopathy‐a survey of mutations and polymorphisms. Am J Hum Genet 1999;64(6):1524–1540. [DOI] [PMC free article] [PubMed] [Google Scholar]
- 22. Fardeau M, Eymard B, Mignard C, et al. Chromosome 15‐linked limb‐girdle muscular dystrophy: clinical phenotypes in Reunion Island and French metropolitan communities. Neuromuscul Disord 1996;6(6):447–453. [DOI] [PubMed] [Google Scholar]
- 23. Groen EJ, Charlton R, Barresi R, et al. Analysis of the UK diagnostic strategy for limb girdle muscular dystrophy 2A. Brain 2007;130(Pt 12):3237–3249. [DOI] [PubMed] [Google Scholar]
- 24. Pollitt C, Anderson LV, Pogue R, et al. The phenotype of calpainopathy: diagnosis based on a multidisciplinary approach. Neuromuscul Disord 2001;11(3):287–296. [DOI] [PubMed] [Google Scholar]
- 25. Saenz A, Leturcq F, Cobo AM, et al. LGMD2A: genotype‐phenotype correlations based on a large mutational survey on the calpain 3 gene. Brain 2005;128(Pt 4):732–742. [DOI] [PubMed] [Google Scholar]
- 26. Luo SS, Xi JY, Zhu WH, et al. Genetic variability and clinical spectrum of Chinese patients with limb‐girdle muscular dystrophy type 2A. Muscle Nerve 2012;46(5):723–729. [DOI] [PubMed] [Google Scholar]
- 27. Quick S, Schaefer J, Waessnig N, et al. Evaluation of heart involvement in calpainopathy (LGMD2A) using cardiovascular magnetic resonance. Muscle Nerve 2015;52:661–663. [DOI] [PubMed] [Google Scholar]
- 28. ten Dam L, van der Kooi AJ, van Wattingen M, et al. Reliability and accuracy of skeletal muscle imaging in limb‐girdle muscular dystrophies. Neurology 2012;79(16):1716–1723. [DOI] [PubMed] [Google Scholar]
- 29. Mercuri E, Bushby K, Ricci E, et al. Muscle MRI findings in patients with limb girdle muscular dystrophy with calpain 3 deficiency (LGMD2A) and early contractures. Neuromuscul Disord 2005;15(2):164–171. [DOI] [PubMed] [Google Scholar]
- 30. Luo SS, Xi JY, Lu JH, et al. Clinical and pathological features in 15 Chinese patients with calpainopathy. Muscle Nerve 2011;43(3):402–409. [DOI] [PubMed] [Google Scholar]
- 31. de Paula F, Vainzof M, Passos‐Bueno MR, et al. Clinical variability in calpainopathy: what makes the difference? Eur J Hum Genet 2002;10(12):825–832. [DOI] [PubMed] [Google Scholar]
- 32. Piluso G, Politano L, Aurino S, et al. Extensive scanning of the calpain‐3 gene broadens the spectrum of LGMD2A phenotypes. J Med Genet 2005;42(9):686–693. [DOI] [PMC free article] [PubMed] [Google Scholar]
- 33. Fanin M, Nascimbeni AC, Angelini C. Gender difference in limb‐girdle muscular dystrophy: a muscle fiber morphometric study in 101 patients. Clin Neuropathol 2014;33(3):179–185. [DOI] [PubMed] [Google Scholar]
- 34. Fanin M, Nascimbeni AC, Angelini C. Screening of calpain‐3 autolytic activity in LGMD muscle: a functional map of CAPN3 gene mutations. J Med Genet 2007;44(1):38–43. [DOI] [PMC free article] [PubMed] [Google Scholar]
- 35. Richard I, Brenguier L, Dincer P, et al. Multiple independent molecular etiology for limb‐girdle muscular dystrophy type 2A patients from various geographical origins. Am J Hum Genet 1997;60(5):1128–1138. [PMC free article] [PubMed] [Google Scholar]
- 36. Saenz A, Ono Y, Sorimachi H, et al. Does the severity of the LGMD2A phenotype in compound heterozygotes depend on the combination of mutations? Muscle Nerve 2011;44(5):710–714. [DOI] [PubMed] [Google Scholar]
- 37. Gardner‐Medwin D, Walton JN. The clinical examination of the voluntary muscles In: JN W, editor. Disorders of voluntary muscles. 3rd ed Edinburgh: Churchill Livingstone; 1974. p. 517–560. [Google Scholar]
- 38. Servais L, Deconinck N, Moraux A, et al. Innovative methods to assess upper limb strength and function in non‐ambulant Duchenne patients. Neuromuscul Disord 2013;23(2):139–148. [DOI] [PubMed] [Google Scholar]
- 39. Seferian AM, Moraux A, Annoussamy M, et al. Upper limb strength and function changes during a one‐year follow‐up in non‐ambulant patients with Duchenne Muscular Dystrophy: an observational multicenter trial. PLoS ONE 2015;10(2):e0113999. [DOI] [PMC free article] [PubMed] [Google Scholar]
Associated Data
This section collects any data citations, data availability statements, or supplementary materials included in this article.
Supplementary Materials
Appendix S1. The Calpainopathy Study Group