Abstract
The isomeric structure of high-mannose N-glycans can significantly impact biological recognition events. Here, the utility of travelling-wave ion mobility-mass spectrometry (TW IM-MS)for isomer separation of high-mannose N-glycans is investigated. Negative ion fragmentation using collision-induced dissociation (CID) gave more informative spectra than positive ion spectra with mass-different fragment ions characterizing many of the isomers. Isomer separation by ion mobility in both ionization modes was generally limited, with the arrival time distributions (ATD) often showing little sign of isomers. However, isomers could be partially resolved by plotting extracted fragment ATDs of the diagnostic fragment ions from the negative ion spectra and the fragmentation spectra of the isomers could be extracted by using ions from limited areas of the ATD peak. In some cases, asymmetric ATDs were observed but no isomers could be detected by fragmentation. In these cases, it was assumed that conformers were being separated. Collision cross sections (CCSs) of the isomers in positive and negative fragmentation mode were estimated from TW IM-MS data using dextran glycans as calibrant. More complete CCS data were achieved in negative ion mode by utilizing the diagnostic fragment ions. Examples of isomer separations are shown for N-glycans released from the well-characterized glycoproteins chicken ovalbumin, porcine thyroglobulin and gp120 from the human immunodeficiency virus. In addition to the cross sectional data, details of the negative ion collision-induced dissociation (CID) spectra of all resolved isomers are discussed.
Keywords: T-wave ion mobility, N-linked glycosylation, isomers, high-mannose, fragmentation
Introduction
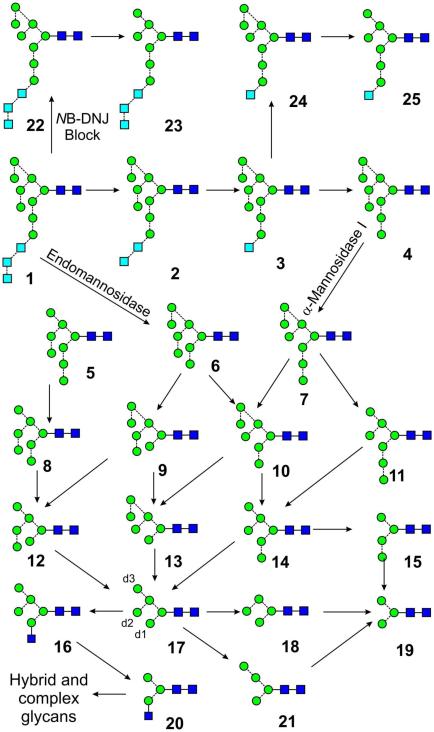
Glycans play a key role in the folding of cell-surface and secreted glycoproteins and their chemical composition and precise isomeric structure can determine glycoprotein activity and biological recognition events1,2. These functions are wide ranging and include recognition by endogenous lectins recognition in intracellular glycoprotein trafficking, cellular targeting, and glycoprotein turnover and even activity. Similarly, glycans also play an important role in self/non-self discrimination in the immune system3. Approximately half of all proteins are estimated to be glycosylated either at serine or threonine (termed O-linked) or at asparagine in an Asn-Xxx-Ser(Thr) motif where Xxx is any amino acid except proline (termed N-linked)4. The N-linked glycans are biosynthesised by the pathway outlined in Scheme 15. In most species, including mammals, the glycan Glc3MangGlcNAc2 (1) is first attached to the protein and then reduced to Man5GlcNAc2 (17) by the action of a series of glycosidases. α-Glucosidases first remove the three glucose residues to give Man9GlcNAc2 (4) after which α1→2-mannosides remove the outer mannose residues from all three antennae to give Man5GlcNAc2 (17). These glycans are termed “high-mannose” glycans. GlcNAc-transferase I then adds a GlcNAc residue to the 3-(d1) antenna of Man5GlcNAc2 (17, the three antennae are numbered as shown in structure 17) to produce glycan 20 which is a substrate for further mannosidase action to remove the two mannose residues from the 6-(d3) antenna to give 19. This glycan is then a substrate for further glycosyltransferases that add residues to form a series of complex glycans (discussed in a future paper). A second pathway involving the action of an endomannosidase on glycan 1 cleaves the terminal mannose with its attached glucose residues to give a second isomer of Man8GlcNAc2 (6) which is eventually degraded to 17 by α-mannosidases.
Scheme 1.
Biosynthesis of the high-mannose glycans. The arrows show the relationship between the various glycans but do not necessarily imply the existence of specific enzymatic pathways. Symbols used for the glycans are  = mannose,
  = GlcNAc and
  = glucose. Solid lines connecting the symbols are β-linkages, broken line are α-linkages. The angle of the lines shows the linkage position. For more information seey116.
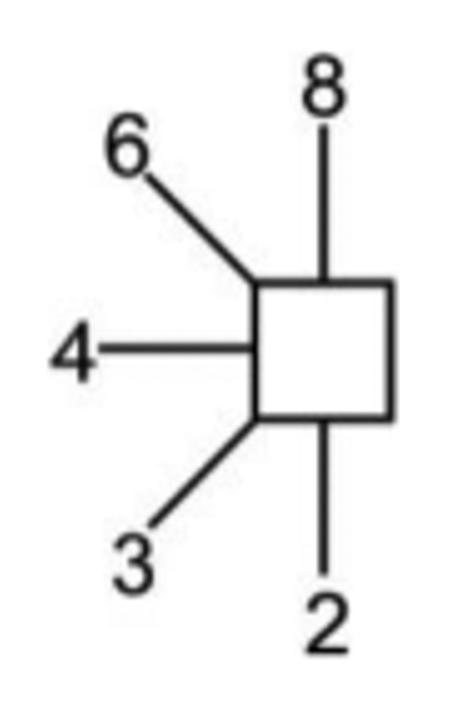
High-mannose glycans have emerged as key targets in vaccine design against the human immunodeficiency virus (HIV)6,7. HIV is an enveloped virus with the sole target for antibody neutralisation being the glycoprotein, Env, containing a trimer of gp120/gp41 heterodimers. Approximately 50% of the mass of gp120 is formed by N-linked glycosylation and this high density of glycans leads to steric obstruction of the typical biosynthetic pathway of mannosidase cleavages and development of complex glycans8,9 resulting in about two thirds of the glycans being stalled at the high mannose stage9. Importantly, broadly neutralising antibodies have been identified that bind epitopes dominated by these conserved high-mannose glycans10,11. Their analysis is, thus, important in the structural elucidation of these epitopes and in the design and quality control of vaccine candidates12.
For structural analysis, N-glycans are typically released from the glycoproteins by chemical or enzymatic processes and analysed by techniques such as high-performance liquid chromatography (HPLC), often with exoglycosidase digestion or mass spectrometry (MS)13-17. One of the problems encountered with these analyses is that many of the glycans are typically released as mixtures of isomers. Mass spectrometry, normally performed in positive ion mode, is useful in assigning compositions and providing branching and linkage information from these compounds but it is not a very powerful technique for discriminating between isomers. Prior separation by chromatographic inlet systems is, thus, frequently used with consequent increases in analysis time.
Positive ion mass spectrometry methods using native, permethylated18-21 or reducing terminal-derivatized glycans22,23 are the techniques used by most investigators although the newer methods such as electron-transfer dissociation (ETD)24,25, electron-detachment dissociation (EDD)26,27 and electronic excitation dissociation (EED)28 are being increasingly employed. Spectra produced by these techniques are often rich in structural details but often difficult to interpret because the branched nature of N-glycans and the presence of many fragments formed by concomitant losses of sugar residues in glycosidic cleavages (between the sugar rings) from several sites. We have been investigating the use of negative ion fragmentation for such studies and have found that the relatively simple spectra, that contain mainly cross-ring fragments, are much easier to interpret and provide more specific structural information than positive ion spectra. Such information includes the ability to detect isomers because of mass shifts in diagnostic ions rather than the abundance differences typical of positive ion spectra29-32.
Ion mobility mass spectrometry (IM-MS) is also of potential use for isomer separation because it relies not only on the mass and charge but also on the size and shape of the glycans for separation and has recently become commercially available on research-grade instruments. The object of the present work is to evaluate its use, combined with negative ion fragmentation, for structural studies on the high-mannose glycans. Ion mobility has already proved to be an excellent method for examining N-glycans33-51, particularly where sample amounts are limited52, and has been used to extract glycan ions from complex mixtures, particularly in cases where samples contain only small amounts of glycan and large amounts of other compounds such as buffer salts39,41,53-56. Separation of peptides from glycopeptides has also been reported57. If isomer separation were also to be realised by ion mobility, its combination with negative ion fragmentation would provide one of the most powerful methods for glycan identification available.
Isomer separation by ion mobility has been shown for small carbohydrates (mono- to octasaccharides)58-79 and several N-glycans47,49 but resolution on current commercial instruments80 is usually only sufficient to resolve small carbohydrates. Nevertheless, Jackson et al.81 have been able to differentiate the larger compounds, GD1a and GD1b glycosphingolipids as caesium adducts; these compounds are isomeric in that they have sialic acid attached to different portions of the hexasaccharide moiety. Isailovic et al.45 have noted differences in the arrival time distribution (ATD) profiles of sialylated biantennary N-glycans from human serum but specific structures were not identified. Plasencia et al.47 observed three peaks in the drift time profile from the doubly charged ion from the glycan of composition Hex5GlcNAc4 (per-methyl derivative) obtained from chicken ovalbumin and proposed three isomeric structures although, again, these structures were not confirmed by fragmentation. High-mannose N-glycans do not appear to have been extensively studied by ion mobility to date82. This paper evaluates the use of travelling-wave ion mobility mass spectrometry (TW IM-MS), combined with negative ion fragmentation, for determining the structures of high-mannose glycans released from several glycoproteins with particular reference to HIV gp120 glycans33,38.
Materials and Methods
Materials
N-linked glycans were released with hydrazine83,84 from the well-characterised glycoproteins ribonuclease B85,86 (compounds 4, 7, 11, 14, 17), porcine thyroglobulin87,88 (compounds 4, 7, 10, 11, 14, 17), chicken ovalbumin89-91 (compounds 11, 14, 17, 19) and bovine fetuin92 obtained from Sigma Chemical Co. Ltd., Poole, Dorset, UK. N-glycans from gp120 expressed in human embryonic kidney (HEK) 293T cells (compounds 4, 7, 10, 11, 14, 17) were released with protein N-glycosidase F (PNGase F) from within NuPAGE gels essentially as described by Küster et al.41,93. Briefly, the glycoprotein (20 μg) was separated from other glycoproteins on sodium dodecyl sulfate (SDS) polyacrylamide electrophoresis (PAGE) gels (NuPage 4-12% Bis-Tris SDS-PAGE gel (Invitrogen, Paisley, UK)) using 3-(N-morpholino)propanesulfonic acid (MOPS) running buffer (Invitrogen). After staining with Coomassie blue dye, the band containing the glycoprotein was excised, destained, and PNGase F (6 mM sodium bicarbonate buffer pH 7.5) was infused into the gel. The gel pieces were incubated overnight (about 16 hours) at 37°C and the released glycans were extracted with several additions of water. For glycan purification, the solution was filtered with an 0.45 μm hydrophobic protein binding Immobilon membrane held in a 96-well MultiScreen sterile plate (Millipore, Billerica, MA, USA). The glucose-containing high-mannose glycans (compounds 1, 22, 23) and the glycan (6) produced by the endomannosidase pathway, were obtained from cells treated with the α-glucosidase-inhibiting compound N-butyl-deoxynojirimycin (NB-DNJ). The d1d2d3-isomer of Man8GlcNAc2 (6), and the d3-isomer of Man6GlcNAc2 (13) were obtained from gp120 from the JRCSF clade of HIV grown in the presence of the α-mannosidase inhibitor, kifunensine. The Man8GlcNAc2 d1d1d2 isomer (5) and two glycans (26, 27, Scheme 2) containing the mannose branch on the 3-antenna were from a Saccharomyces cerevisiae mutant and were gifts from Dr S. E. H. Moore and I. Chantret (Paris). Compounds 15 and 21 were from gp120 that had been treated with α-mannosidase. Reference samples of Man5GlcNAc2 (17), Man6GlcNAc2 (d1 isomer, 14), Man7GlcNAc2 (d1,d1 isomer, 11), Man8GlcNAc2 (d1d1d3 isomer, 7) and Man9GlcNAc2 (4) were obtained from Dextra Laboratories, (Reading, UK). Methanol was obtained from BDH Ltd. (Poole, UK) and ammonium phosphate was from Aldrich Chemical Co. Ltd. (Poole) and BDH. Dextran from Leuconostoc mesenteroides was obtained from Fluka (Poole).
Scheme 2.
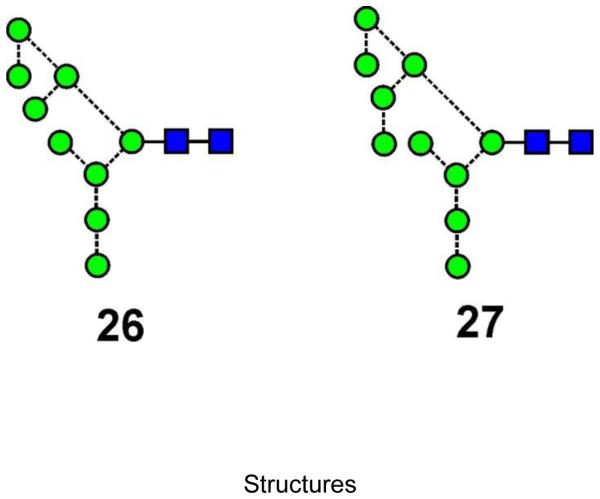
Structure of the two glycans (26, 27) from yeast. Structures are drawn with the conventions outlined in Scheme 1.
All glycan samples were cleaned with a Nafion 117 membrane as described earlier by Börnsen et al.94. Samples were then dissolved in a solution of methanol:water (1:1, v:v) containing ammonium phosphate (0.05 M, to maximize formation of [M+H2PO4]− ions, the ions usually encountered from biological samples) and centrifuged at 10,000 rpm (9503 × g) for 1 min to sediment any particulates before examination by mass spectrometry.
Ion mobility mass spectrometers
TW IM-MS experiments were carried out mainly with a Waters Synapt G2 instrument (Waters Corp., Manchester UK)95 fitted with a nano-electrospray (n-ESI) ion source. Samples were infused through Waters thin-wall nanospray capillaries. The instrument was set up as follows: ESI capillary voltage, 1.2 kV; cone voltage, 120 V, ion source temperature, 80°C; T-wave velocity, 450 m/sec; T-wave peak height 40 V. The T-wave mobility cell contained nitrogen and was operated at a pressure of 0.55 mbar. Collision-induced dissociation (CID) was performed after mobility separation in the transfer cell with argon as the collision gas. The instrument was externally mass-calibrated with sialylated N-glycans released from bovine fetuin. The mobility cell was calibrated with (Glc)2-13 glycans present in dextran (from Leuconostoc mesenteroides) as described below. Data acquisition and processing were carried out using the Waters Driftscope (version 2.8) software and MassLynx™ (version 4.1). A few spectra (see text) were also obtained with the earlier version of the Synapt instrument (termed the G1 version) and with a Waters Synapt G2Si instrument using conditions similar to those above. The scheme devised by Domon and Costello96 was used to name the fragment ions with the following exception: the subscript R (for Reducing terminal) is used when general reference is made to loss of a GlcNAc residue from the reducing terminus of the glycan in order to avoid confusion caused by the subscript number changing as the result of altered chain lengths.
CCS Estimation
Absolute helium and nitrogen CCSs of singly charged dextran oligomers (Glc3-Glc13), measured previously using a modified Synapt high-definition (HDMS)97 (Waters) quadrupole/IMS/oa-TOF MS instrument containing a linear (not travelling wave) drift tube (DT) IM cell were used to estimate glycan CCSs from TW IM-MS data.98-100. Sample introduction and instrument set-up was as above. Estimation was performed with the method described by Thalassinos et al.101 and compared with measurements made using the drift tube instrument102. Extrapolated helium cross sections were obtained from the linear correlation plot (r2 = 0.99899) of the nitrogen and helium cross-section data from dextran obtained with the DT instrument (for positive ion data see100).
Other spectra
The spectrum of glucose-containing compound 25 (Scheme 1) was obtained with a Waters quadrupole-time-of-flight (Q-Tof) Ultima Global instrument mass spectrometer. Samples in 1/1 (v/v) methanol:water containing 0.5 mM ammonium phosphate were infused through Proxeon (Proxeon Biosystems, Odense, Denmark) nanospray capillaries. The ion source conditions were: temperature, 120°C; nitrogen flow 50 L/hr; infusion needle potential, 1.2 kV; cone voltage 100 V; RF-1 voltage 150 V. CID spectra (argon, 2 sec scans) were acquired with a digitization rate of 4 GHz and processed as above.
Results
Calibration standard for collision cross section measurements
Little has so far been published on calibration of TW IM-MS instruments in negative ion mode. Forsythe et al.103 have used polyalanine and polymalic acid but the mass range covered by these calibrants is insufficient for constructing a calibration for N-glycans. A general purpose calibration standard for calculating CCSs of N-glycans in the TW IM-MS instrument should ideally be a readily available glycan mixture104. Dextran oligomers from Leuconostoc mesenteroides would appear to fit these requirements. This mixture of glucose oligomers is readily obtainable and produces singly charged ions across the mass range covered by the N-glycans. Positive ion CCSs of the singly charged oligosaccharides were measured in nitrogen and helium with the DT IM-MS instrument and the nitrogen CCSs were calculated by the method described by Thalassinos et al.101. Peak centroids of the ATD peaks from the Glc2 to Glc13 oligomers from this dextran mixture were then measured with the TW IM-MS instrument, in nitrogen, and used to obtain a calibration in the form of y = Axn where y and x are the corrected dextran cross sections and drift times respectively. Full details have been published102. All cross sections will be added to the GlycoMob database (http://www.glycomob.org)105.
High-mannose glycans, Positive ions
Positive ion TWIMS nitrogen cross sections of the N-glycans released from the various glycoprotein samples recorded over a three year period were then measured and the results averaged and compared with the corresponding cross-sections measured with the linear instrument. Correlation was good across the range for the Man5-9GlcNAc2 glycans (4, 7, 11, 14, 17) (Table 1). Extrapolated helium cross-sections were estimated with the aid of the nitrogen:helium correlation plot and are also listed in Table 1. Again, these agreed reasonably well with those obtained directly with the linear instrument but were, in agreement with previous observations102, not as good as the nitrogen data.
Table 1.
, Positive ion cross section measurements for high-mannose N-glycans
| Hexose | Structure |
m/z
[M+Na]+ |
Cross section data (Å2) | |||||
|---|---|---|---|---|---|---|---|---|
| TW IM-MS | Published lineara | |||||||
| Nitrogen | Helium | Nitrogen | Helium | |||||
| Cross section |
SD | n | Calculated cross section |
Cross section (Å2) |
Cross section (Å2) |
|||
| 3 | 19 | 933.3 | 303.5 | 1.19 | 3 | 219.3 | 294.2 | 209.7 |
| 5 | 17 | 1257.4 | 353.9 | 2.30 | 11 | 265.8 | 354.2 | 261.8 |
| 6 | 14 | 1419.5 | 376.3 | 2.05 | 11 | 286.2 | 376.1 | 278.2 |
| 7 | Mainly 11 | 1581.5 | 396.4 | 1.89 | 10 | 304.6 | 396.8 | 300.4 |
| 8 | 7 | 1743.6 | 426.4 | 2.41 | 9 | 332.6 | 426.6 | 327.2 |
| 9 | 4 | 1905.6 | 449.2 | 2.33 | 9 | 353.7 | 456.2 | 346.9 |
) Mean value from the glycans in ovalbumin, ribonuclease B and desialylated thyroglobulin.
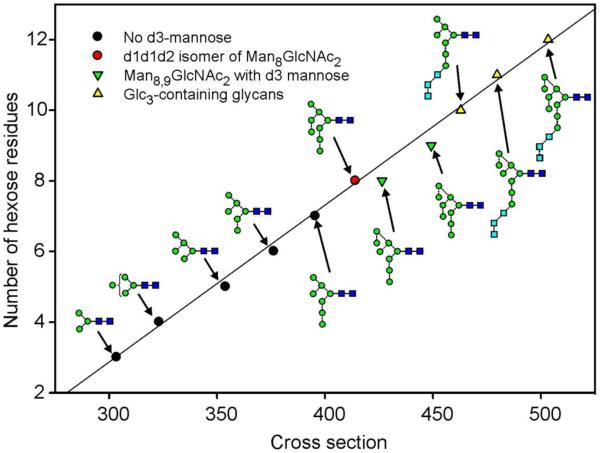
In order to see if any structural correlations could be made from the cross-section measurements, cross sectional data were plotted against hexose number for the high-mannose glycans (Figure 1). This plot shows a generally linear relationship for the Man5-7GlcNAc2 glycans and the d1d1d2-isomer (5) of Man8GlcNAc2 (see structure 17, Scheme 1 for the labelling of the antennae), but showed a shift towards longer drift times for the Man8GlcNAc2 d1d1d3-isaomer (7) and Man9GlcNAc2 (4) glycans.
Figure 1.
Plot of cross sections against number of hexose residues for the [M+Na]+ ions from the high-mannose glycans. Numbers in bold are structure numbers from Scheme 1.
These glycans contained an additional mannose residue in the d3 branch of the 6-antenna. Although this relationship was consistently observed for the Man5-9GlcNAc2 glycans, it was not observed for the three glycans (1, 22, 23) containing the Glc3 substitution in the 3-antenna.
Resolution of all isomers was not achieved in positive ion mode, but in negative mode many isomers could be partially resolved by examination of fragment ions.
High-mannose glycans, Negative ions
As emphasised in earlier publications29,32, negative ion fragmentation spectra of underivatized N-glycans, although usually simpler than their positive ion counterparts, contain very diagnostic ions, mainly produced by cross-ring cleavages, and providing more specific structural information than positive ion spectra. Most significantly, isomers usually produced large mass differences in diagnostic fragment ions unlike many positive ion spectra where isomeric differences are reflected in the relative abundances of glycosidic fragment ions. This mass-different property allows ATDs of isomers to be extracted from fragmentation data by using profiles of isomer-specific fragments106,107. Many of the ions in the glycan mixtures obtained from the glycoproteins used in this work were produced by isomeric compounds, some of which gave clear mobility differences as reflected in bimodal or asymmetric ATD peaks. In some other cases, only slight broadening of the ATD peaks was observed. Nevertheless, the presence of isomers could still be detected by the mobility profiles of diagnostic negative ion fragments, as described in the examples below. Thus, cross sections of single compounds were calculated directly from the ATDs, whereas, when isomers were present, the relevant fragment ion peaks were sampled from their CID spectra obtained from the transfer cell. ATDs from these latter spectra exhibited an approximately 220 μsec shift to shorter drift times than the corresponding unfragmented ATDs, requiring the relevant correction to be made. Using these methods, negative ion cross-sections were obtained for most of the isomeric high-mannose glycans in Scheme 1 and related compounds and are listed in Table 2. Validation of the method for measuring isomer cross sections from fragment ions was made by comparing the nitrogen values obtained using a linear drift cell with those of the isolated isomers (Dextra Laboratories) where close agreement was found (Table 2, Column 8). The values are also compared with those measured from the biological samples with the linear drift cell instrument; these latter values are the averages for glycans released from ovalbumin, ribonuclease B and porcine thyroglobulin100 because the lower resolution of this instrument did not permit isomer separation. They are listed against the most abundant isomer as determined with the Synapt G2 instrument in Table 2 (Column 10). Agreement between the linear and TW IM-MS instruments was reasonable but not as good as with the reference isomers.
Table 2.
, Negative ion cross section measurements for high-mannose N-glycan
| Man | Structure |
m/z
[M+H2PO4)− |
Isomer | Cross section data (Å2) | ||||||
|---|---|---|---|---|---|---|---|---|---|---|
| TW IM-MS | Linear | |||||||||
| Nitrogen | Helium | Nitrogen | Helium | |||||||
| Cross section (Å2) |
SD | n | Reference sample |
Projected cross section (Å2) |
Cross section (Å2) |
Cross section (Å2) |
||||
| 3 | 19 | 1007.3 | - | 282.8 | - | 2 | - | 204.9 | 282.4 | 201.4 |
| 4 | 15 | 1169.3 | d1 | 305.6 | - | 1 | - | 225.6 | 317.4 | 233.1 |
| 18,21 | d2(d3) | 309.4 | - | 1 | - | 229.1 | ||||
| 5 | 17 | 1331.4 | d1 | 340.0 | 2.20 | 13 | 344.8 | 265.1 | 347.7 | 264.8 |
| 6 | 14 | 1493.5 | d1 | 366.5 | 2.40 | 13 | 367.7 | 280.1 | 372.4 | 291.9 |
| 12 | d2 | 363.0 | - | 1 | - | 276.7 | - | - | ||
| 13 | d3 | 371.6 | - | - | 284.7 | - | - | |||
| 7 | 11 | 1655.5 | d1d1 | 386.5 | 1.11 | 7 | 389.1 | 297.9 | 396.2 | 312.8 |
| 8 | d1d2 | 387.7 | - | 1 | - | 299.2 | - | - | ||
| 10 | d1d3 | 394.8 | 2.50 | 13 | - | 307.2 | - | - | ||
| 8 | 7 | 1817.6 | d1d1d3 | 418.9 | 3.69 | 9 | 416.7 | 327.4 | 422.3 | 335.7 |
| 5 | d1d1d2 | 400.2 | - | 2 | - | 310.5 | - | - | ||
| 6 | d1d2d3 | 414.2 | - | 2 | - | 322.9 | - | - | ||
| 9 | 4 | 1979.6 | d1d1d2d3 | 439.0 | 2.63 | 9 | 431.7 | 345.1 | 442.4 | 354.3 |
| 26 | d1d1d3,3- Me |
438.0 | - | 1 | - | 344.3 | - | - | ||
| 10 | 27 | 2141.7 | d1d1d2d3- 3-Me |
459.6 | - | 1 | - | 363.8 | - | - |
| G3M7 | 23 | 2141.7 | d1d1 | 451.9 | - | 3 | - | 357.5 | - | - |
| G3M8 | 22 | 2303.7 | d1d1d3 | 482.0 | - | 1 | - | 384.4 | - | - |
| G3M9 | 1 | 2465.8 | d1d1d2d3 | 490.9 | - | 2 | - | 392.6 | - | - |
General features of the negative ion fragmentation spectra
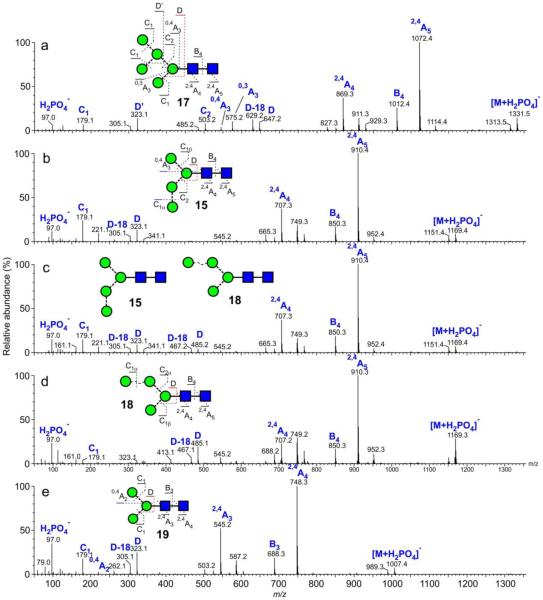
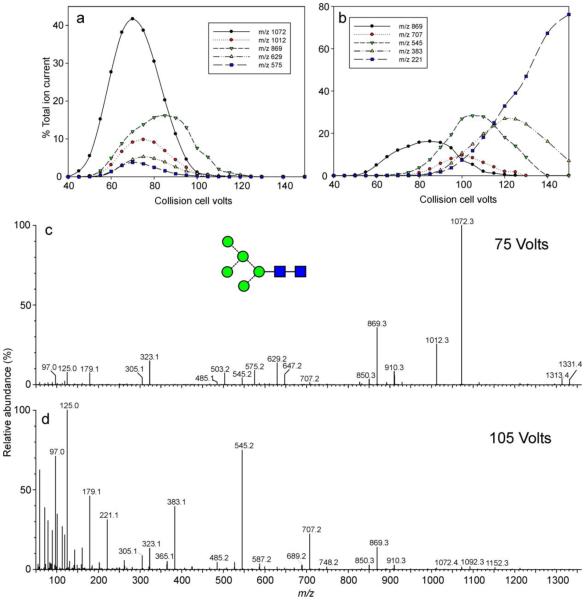
Details of the negative ion fragmentation spectra for several of the compounds have been reported in earlier publications29,32,108, others are reported here. Briefly: 2,4AR, BR-1 and 2,4AR-1 ions (2,4A5, B5 and 2,4 A5 at m/z 1072, 1012 and 869 respectively in, for example, the spectrum of Man5GlcNAc2 (17) shown in Figure 2a) define the 1→4-linked chitobiose core, the D, D-18, 0,3AR-2, 0,4aR-2 and B2α ions (m/z 647, 629, 575, 545 and 503 respectively in Figure 2a) and the D’ ion at m/z 323 define the branching pattern and the C1 ion at m/z 179 characterizes the hexose (mannose or glucose) residues on the non-reducing termini of the antennae. The D, D-18, 0,3AR-2, 0,4AR-2 and Bα ions will be referred to later in this paper as the “6-antenna-specific ions” and uniquely define all of the isomers expected in biological samples as shown in Table 3. It is important when recording the spectra of these compounds that the collision energy is not too high. As the collision energy rises, the fragmentation changes from that shown in Figure 2a to one in which the spectrum lacks the diagnostic fragments and is dominated by a series of (mannose)n-CH=CH-O− cross-ring fragments (Figure 3d) in a similar way to ions from endoH-released glycans reported earlier109. For Man5GlcNAc2 (17), for example, shown in Figure 3, the diagnostic fragments are present in spectra recorded at about 75 V (Figure 3c) on the collision cell but are replaced by the other ions above 105 V. The plots in Figure 3a and b show the energy-resolved profiles for some of the main diagnostic ions (Figure 3a) and for the (mannose)n-CH=CH-O− cross-ring fragments (Figure 3b).
Figure 2.
Negative ion CID spectra ([M+H2PO4]− ions) of: (a) Man5GlcNAc2 (17, from gp120), (b) Man4GlcNAc2 (15, mobility-extracted, from gp120 as shown in Figure 4b), (c) Mixture of Man4GlcNAc2 (15 and 21 from gp120), (d) Man4GlcNAc2 (21, mobility-extracted, from gp120 as shown in Figure 4b), (e) Man3GlcNAc2 (19, from chicken ovalbumin). Symbols used for the structural diagrams in these and other spectra are as described in the legends to Schemes 1 and 2. Fragment ions are labelled according to the scheme proposed by Domon and Costello96.
Table 3.
, Fragment ions in the negative ion CID spectra that uniquely define the isomers of the high-mannose N-glycans reported in this paper
| Glycan | Isomer | No. |
m/z
([M+H2PO4]−) |
Structural evidence | |||||
|---|---|---|---|---|---|---|---|---|---|
| D | D-18 | 0,4 A | 0,3 A | D’ | D’-18 | ||||
| Man4 | - | 18 | 1169.3 | 485.2 | 467.2 | 413.1 | 395.1 | - | - |
| Man5 | - | 17 | 1331.4 | 647.2 | 629.2 | 575.2 | 545.2 | 323.1 | 305.1 |
| Man6 | d1 | 14 | 1493.5 | 647.2 | 629.2 | 575.2 | 545.2 | 323.1 | 305.1 |
| d2 | 12 | 809.3 | 791.3 | 737.2 | 707.2 | 323.1 | 305.1 | ||
| d3 | 13 | 809.3 | 791.3 | 737.2 | 707.2 | 485.2 | 467.2 | ||
| Man7 | d1d1 | 11 | 1655.5 | 647.2 | 629.2 | 575.2 | 545.2 | 323.1 | 305.1 |
| d1d2 | 8 | 809.3 | 791.3 | 737.2 | 707.2 | 323.1 | 305.1 | ||
| d1d3 | 10 | 809.3 | 791.3 | 737.2 | 707.2 | 485.2 | 467.2 | ||
| d2d3 | 9 | 971.3 | 953.3 | 899.3 | 869.3 | 485.2 | 467.2 | ||
| Man8 | d1d1d2 | 5 | 1817.6 | 809.3 | 791.3 | 737.2 | 707.2 | - | - |
| d1d1d3 | 7 | 809.3 | 791.3 | 737.2 | 707.2 | 485.2 | 467.2 | ||
| d1d2d3 | 6 | 971.3 | 953.3 | 899.2 | 869.3 | 485.2 | 467.2 | ||
| Man9 | d1d1d2d3 | 4 | 1979.6 | 971.3 | 953.3 | 899.3 | 869.3 | 485.2 | 467.2 |
| 26 | 1979.6 | 809.3 | 791.3 | 737.2 | 707.2 | 485.2 | 467.2 | ||
| Man10 | - | 27 | 2141.7 | 971.3 | 9533 | 899.3 | 869.3 | 485.2 | 467.2 |
Figure 3.
(a and b) relationship between collision cell voltage and fragment ion abundance for structurally-diagnostic fragment ions (a) and hexose + O-CH=CH-O− ion (b). (c) Negative ion CID spectrum ([M+H2PO4]− ion) of Man5GlcNAc2 recorded at 75 V on the collision cell, (d) Negative ion CID spectrum ([M+H2PO4]− ion) of Man5GlcNAc2 recorded at 105 V on the collision cell.
Man3-5GlcNAc2 (15, 17, 18, 19, 21)
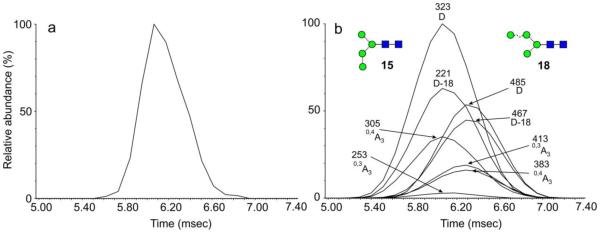
The spectrum of Man5GlcNAc2 (17) is reported above. The D and D-18 ions at m/z 323 and 305 in the spectrum of Man3GlcNAc2 (19, Figure 2e) were 324 mass units below the masses of the corresponding ions in the spectrum of Man5GlcNAc2 (17) reflected the absence of mannose residues attached to the 6-antenna. The spectrum shown in Figure 2c is of a mixture of the Man4GlcNAc2 isomers 15 and (18, 21) as shown by the two sets of D, D-18, 0,3A3, 0,4A3 ions at m/z 323, 305, 251, 221 and at m/z 485, 467, 413 and 383 respectively. The mixture gave a slightly asymmetric ATD peak (Figure 4a) consistent with the presence of isomers. ATDs of the D, D-18, 0,3A3, 0,4A3 ions (Figure 4b) showed that the ions in each set maximized at the same drift time but that there was a distinct difference between the drift times of each set showing partial separation of the isomers. The isomer with the longest drift time contained the fourth mannose in the 6-antenna (compounds 18 and 21) and represented a similar situation to the separation of isomers of Man3GlcNAc3, reported earlier49. These latter two compounds had the trimannosyl-chitobiose core with an additional GlcNAc residue substituted on either antenna with the compound containing the GlcNAc residue in the 6-antenna showing the longest drift time.
Figure 4.
(a) Negative ion ATD profile (unsmoothed) of Man4GlcNAc2 (15, 18, 21, [M+H PO ]− ions) from gp120. (b) ATDs of the diagnostic 6-antenna-specific fragment ions from Man4GlcNAc2 from gp120 (“Mean” smoothing algorithm from MassLynx, window size = 2, number of smooths = 2). Ions are identified as in Figure 2.
By using only ions from the first part of the ATD peak of the Man4GlcNAc2 isomers, shown in Figure 4a, it was possible to extract a relatively clean spectrum of the 3-substituted isomer 15 (Figure 2b). The spectrum shown in Figure 2d is that of the isomer(s) (18 and 21) with the fourth mannose in the 6-antenna. Not only did this method allow properties of the individual isomers to be extracted but it also confirmed that the presence of the two sets of diagnostic fragment ions seen in the total MS/MS spectra, as would be obtained without mobility separation, were indeed from isomeric compounds.
CCSs of Man3GlcNAc2 (19) and Man5GlcNAc2 (17), calculated directly from the ATD peaks are listed in Table 2. CCSs of the Man4GlcNAc2 isomers (15, (18, 21)) were obtained from the ATD profiles of the diagnostic fragment ions with correction for the drift time offset mentioned above.
Man6GlcNAc2 (12-14)
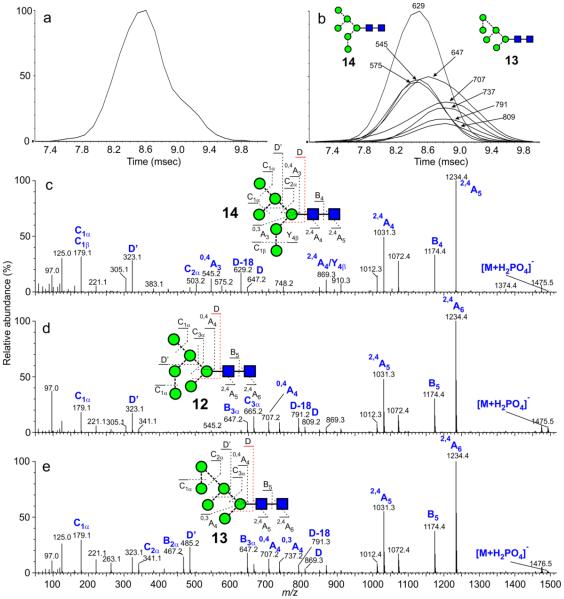
Three biologically-relevant isomers (12-14) of this glycan are possible with the 6th mannose terminating one of the three antennae of 17. The d1 isomer (14, Figure 5c) is the most commonly found isomer in glycoproteins such as ribonuclease B and thyroglobulin and the fragment ions defining the branching pattern arising from the 6-antenna, are observed at the same m/z values as in the spectrum of Man5GlcNAc2 consistent with the presence of the 6th mannose in the 3-antenna. The d2-isomer (12) was obtained from gp120, JRCSF expressed in the presence of kifunensine. Its MS/MS spectrum (Figure 5b) showed a shift in the D, D-18, 0,3A3, 0,4A3 and B2α ions by 162 mass units to m/z 809, 791, 737, 707 and 665 respectively reflecting the additional mannose residue in the 6-antenna. Its ATD profile was very similar to that of the d1 isomer (14).
Figure 5.
(a) Negative ion ATD profile (unsmoothed) of Man6GlcNAc2 ([M+H2PO4]− ion) from gp120. (b) Single ion plots of the diagnostic 6-antenna-specific fragment ions from Man6GlcNAc2 obtained from gp120 (smoothing algorithm, mean 2×2). (c) Negative ion CID spectrum ([M+H2PO4]− ion) of Man6GlcNAc2 (d1 isomer, 14, from bovine thyroglobulin). (d) Negative ion CID spectrum ([M+H2PO4]− ion) of Man6GlcNAc2 (d2 isomer, 12, from gp120 (JRCSF)). (e) Negative ion CID spectrum ([M+H2PO4]− ion) of Man6GlcNAc2 (d3 isomer, 13), extracted from the right-hand portion of the ATD peak shown in 5a and 5b.
The d3 isomer (13) was obtained as a minor constituent of the glycans from gp120 that had also been expressed in the presence of the α-mannosidase inhibitor kifunensine. The ATD peak at m/z 1493 (phosphate adduct) was asymmetric (Figure 5a) and, consequently, the compound was fragmented in the transfer cell in order to extract the ATD of the isomeric constituents. Two sets of 6-antenna-specific fragment ions were present in the CID spectrum; those at m/z 647, 629, 575, 545 and 503 from the major compound showed that it was the d1 isomer (14). The other set of ions at m/z 809, 791, 737, 707 and 665 maximized later (Figure 5b) and confirmed the presence of the second isomer with a mannose residue attached to the 6-antenna. Its spectrum was obtained by selecting only the right-hand portion of the total ATD peak and is shown in Figure 5c. Fragment ions in this spectrum were almost identical to those from the d2 isomer (12) but with the addition of the D’ and D’-18 ions at m/z 485 and 467. These latter ions were found to be diagnostic for mannose substitution in the d3 position and presumably arise in a similar manner to the D and D-18 ions because of the common 3,6-substitution pattern of the 6-antenna. The cross-section of this compound was obtained by correcting the drift time from the fragmentation spectrum by a factor equivalent to the difference between the drift time for the d1 isomer obtained from the mass spectrum and from the CID spectrum as described above. It was larger than that for the other two isomers, consistent with the observations made for d3-substituted high-mannose glycans in positive ion mode.
Man7GlcNAc2 (8-11)
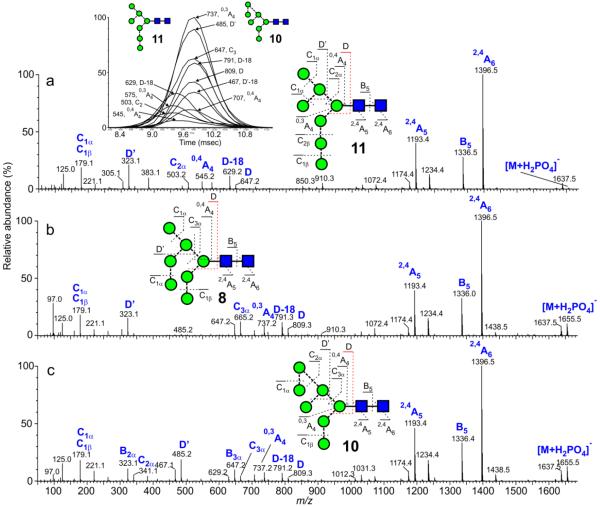
Four isomers of this compound are possible: the d1d1 (11), d1d2 (8), d1d3 (10) and d2d3 (9) glycans. Spectra of the d1d1, d1d2, d1d3 isomers are shown in Figure 6. The d2d3 isomer (9) was not available. The spectrum of the d1d1-isomer (11, Figure 6a) contained 6-antenna-specific ions at the same masses as in the spectrum of Man5GlcNAc2 confirming no extra mannose residues in the 6-antenna. The spectra of the other two compounds (8, 10) showed a shift of these ions by 162 mass units consistent with the addition of one mannose to the 6-antenna. D’ and D’-18’ ions at m/z 485 and 467 respectively in the spectrum of 10 (Figure 6c) and their absence in spectrum 6b confirmed that spectrum 6c was that of the d1d3 isomer (10). Cross-section measurements of these isomers (Table 2) showed that the d1d3 isomer had a considerably larger cross section than the other two, consistent with the similar observation from the Man6GlcNAc2 isomers above. Samples from various preparations of gp120 contained the d1d1 and d1d3 isomers in different proportions. Single ion mobilograms of the diagnostic D, D-18 etc. ions from one of these samples (inset to Figure 6a) showed separation of these isomers from a single spectrum.
Figure 6.
(a) Negative ion CID spectrum ([M+H2PO4]− ion) of Man7GlcNAc2 (d1d1 isomer, 11, from porcine thyroglobulin). (b) Negative ion CID spectrum ([M+H2PO4]− 8, from gp120, (JRCSF)). Negative ion CID spectrum ([M+H PO ]− ion) of Man7GlcNAc2 (d1d2 isomer, ion) of Man7GlcNAc2 (d1d3 isomer, 10, from gp120). The inset to the first panel shows single ion plots of the 6-antenna-specific ions (smoothing algorithm, mean 2×2) showing the presence of the minor isomer 11. The spectrum in panel c was, thus, from the right-hand portion of the ATD peak.
Man8GlcNAc2 (5-7)
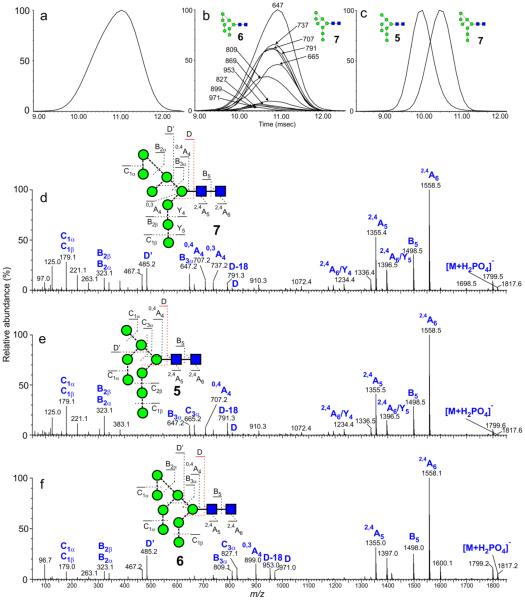
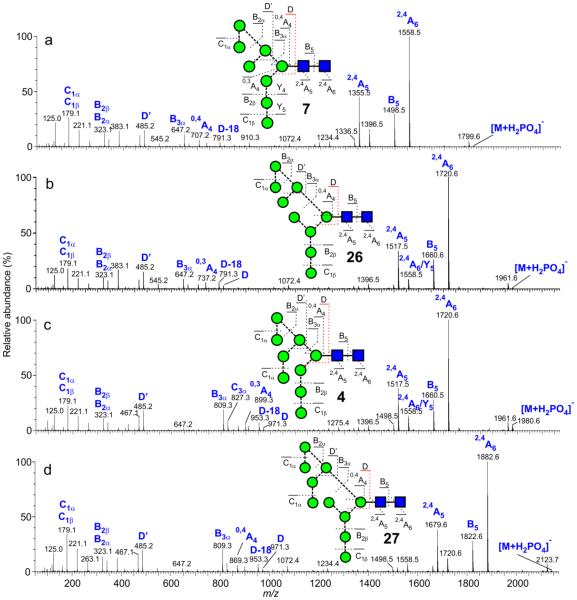
Spectra of the three possible isomers, d1d1d2 (5), d1d1d3 (7) and d1d2d3 (6) are shown in Figure 7. The 6-antenna-specific ions are present at m/z 809, 791, 737, 707 and 665 respectively in the spectra of the d1d1d2- (5) and d1d1d3- (7) isomers reflecting the presence of the single extra mannose residue in the 6-antenna. The two isomers can be differentiated by the presence of the ions at m/z 485 and 467 in the spectrum of the d1d1d3-isomer (7) and by their cross sections; the isomer (5), missing the mannose on the 6-branch showed a significantly shorter drift time and smaller cross-section. The d1d2d3 isomer (6) displayed 6-antenna-specific ions at m/z 971, 953, 877, 869 and 827 confirming two additional mannose residues in the 6-antenna. Its CCS was also considerably higher than that of the d1d1d2-isomer (5), as expected from the presence of the mannose residue at the d3 position.
Figure 7.
(a) Negative ion ATD profile (smoothing algorithm, mean 2×2) of Man GlcNAc ([M+H PO ]− ion) from gp120. (b) Single ion plots of the diagnostic 6-antenna-specific fragment ions from Man8GlcNAc2 (mainly isomer 7) obtained from gp120 (smoothing algorithm, mean 2×2). (c) Negative ion ATD profiles (smoothing algorithm, mean 2×2) of the d1d1d2 (5) and d1d1d3 (7) isomers of Man8GlcNAc2 ([M+H2PO4]− ions). Spectra were from different samples and normalized to 100%. (d) Negative ion CID spectrum ([M+H2PO4]− ion) of Man8GlcNAc2 (d1d1d3 isomer, 7, from gp120). (e) Negative ion CID spectrum ([M+H2PO4] ion) of Man8GlcNAc2 (d1d1d2 isomer, 5, from a Saccharomyces cerevisiae mutanty117. (f) Negative ion CID spectrum ([M+H2PO4]− ion) of Man8GlcNAc2 (d1d2d3 isomer, 6, from gp120 expressed in CHO cells in the presence of the α-mannosidase inhibitor NB-DNJ.
The d1d1d3-isomer of Man8GlcNAc2 (7) is normally the major isomer in biological systems but, in most samples studied, its ATD peak was asymmetric (Inset, Figure 7a) with a slight shoulder on the leading edge suggesting the presence of a second isomer. Spectra extracted from the leading and trailing edges of the ATD peak following transfer cell fragmentation were virtually identical. The presence of the D’ and D-18’ ions at m/z 485 and 467 with the same mobility profile as that of the total ion profile showed that a minor isomer, if present, was also substituted at the d3 position and would, thus correspond to compound 6. Cross-section measurements of this compound, the d1d2d3-isomer, obtained as the product of endomannosidase digestion was less than that of the major d1d1d3-isomer (7) (although larger than that of the d1d1d2-isomer, 5) and was consistent with the shoulder on the major peak. Close inspection of the fragmentation spectrum showed very low abundance ions corresponding to the D, D-18, 0,3A3, 0,4A3 and B2α ions expected from this isomer but which would not normally be of sufficient relative abundance to give confidence that they signified the presence of a second isomer. However, their different drift times from those of the major peaks confirmed their origin from compound 6. The presence of this isomer is consistent with the enzymology of the expression system use to produce the glycoprotein and shows that it is most probably formed as a product of an endomannosidase (Scheme 1).
Man9GlcNAc2 (4)
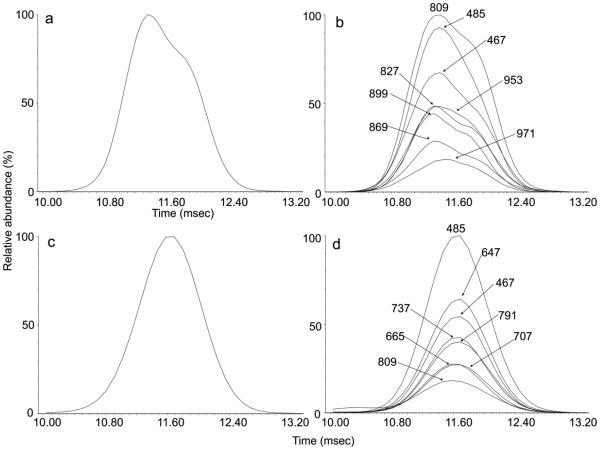
Man9GlcNAc2 from ribonuclease B, thyroglobulin and gp120 is a single isomer (4) as would be expected on biochemical grounds and confirmed by its CID spectrum (Figure 8c). The 6-antenna-specific ions at m/z 871, 953, 877, 869 and 827 are consistent with the composition of the 6-antenna with the ions at m/z 485 and 467 reflected the presence of mannose in the d3 branch. The Synapt G1 instrument gave a roughly Gaussian peak for this glycan but the G2 instruments produced an asymmetric ATD peak from the glycan from all three glycoproteins (Figure 9a). ATD profiles of the diagnostic fragment ions all matched that of the molecular ion suggesting that conformers were being separated (Figure 9b). Reduction of the glycans (to be published) removed the asymmetry indicating that anomer separation was the main reason for the un-symmetrical ATDs. Anomer separation of small carbohydrates (mainly as [M+Na]+ ions from methyl glycosides) by ion mobility has been noted by several investigators34,58,59,68,110 and pronounced effects on the conformation of the GlcNAc-β1→4GlcNAc disaccharide (equivalent to the chitobiose core of the N-linked glycans) have been noted by X-ray crystallography111,112 as reported by Wood et al113. However, the effect was not seen with the smaller high-mannose glycans suggesting that the anomer configuration can affect more than just the chitobiose core. For positive ion spectra ([M+Na]+ ions), Dwivedi et al.60 have proposed that separation reflects the way in which the sodium ion is bound to the glycan and a similar situation may exist for negative ion spectra. The CCS data from the G2 instrument are from smoothed ATD peaks. In some of the gp120 samples, a trace amount of a compound consistent with Glc1Man8GlcNAc2 (24) was detected as producing diagnostic ions at m/z 545 and 383 (see below) with ATDs matching that of the second peak. This compound has also been detected by HPLC in these gp120 samples but its abundance was not sufficient to account for the asymmetric ATD peak and it was not detected in the other samples.
Figure 8.
Negative ion CID spectra ([M+H2PO4]− ion) of: (a) Man8GlcNAc2 (d1d1d3 isomer, 7, from gp120). (b) Man9GlcNAc2 (26, d1d1d3 isomer with an extra mannose residue at position 6 of the internal mannose of the 3-antenna) from a Saccharomyces cerevisiae mutant (c) Man9GlcNAc2 (d1d1d2d3 isomer (4) and (d) Man10GlcNAc2 (27, d1d1d2d3 isomer with an extra mannose residue at position 6 of the internal mannose of the 3-antenna) from a Saccharomyces cerevisiae mutant.
Figure 9.
(a) Negative ion ATD profile (smoothing algorithm, mean 2×2) of Man9GlcNAc2 (4, [M+H2PO4]− ion) from gp120. (b) Single ion plots of the diagnostic 6-antenna-specific fragment ions from Man9GlcNAc2 (4) obtained from gp120 (smoothing algorithm, mean 2×2). (c) Negative ion ATD profile (smoothing algorithm, mean 2×2) of Man9GlcNAc2 (26, [M+H2PO4]− ion) from a Saccharomyces cerevisiae mutant. (b) Single ion plots of the diagnostic 6-antenna-specific fragment ions from Man9GlcNAc2 (26 obtained from a Saccharomyces cerevisiae mutant (smoothing algorithm, mean 2×2).
Glycans from Saccharomyces cerevisiae
Two glycans, Man9GlcNAc2 (26) and Man10GlcNAc2 (27, Scheme 2) were obtained from Saccharomyces cerevisiae mutants with structures that differed from the above in that they contained an extra mannose at the 6-position of the internal mannose of the 3-antenna114. Their spectra are shown in Figure 8b and 8d respectively, together with those of Man8GlcNAc2 (d1d1d3 isomer 7, Figure 8a) and Man9GlcNAc2 (4, Figure 8c) for comparison, and their cross-sections are listed in Table 2. The d1d1d3- and d1d1d2d3-substitution of these glycans was confirmed by the D, D-18 series of ions and the absence of glucose residues on the 3-antenna (Hex10GlcNAc2 could be Glc1Man9GlcNAc2 (3) rather than Man10GlcNAc2, (27)) was reflected by the absence of the prominent cross-ring fragments at m/z 545 and 383 (one glucose residue, see section below). The spectra were virtually identical to those of the corresponding glycans without the 6-substituted mannose in the 3- antenna meaning that no suitable diagnostic ion for this substitution was present. The ATD profiles from these two Saccharomyces cerevisiae glycans were symmetrical (Figure 9c) as were those of the 6-antenna-specific fragment ions (Figure 9d).
Glc3Man7-9GlcNAc2 (1, 22, 23)
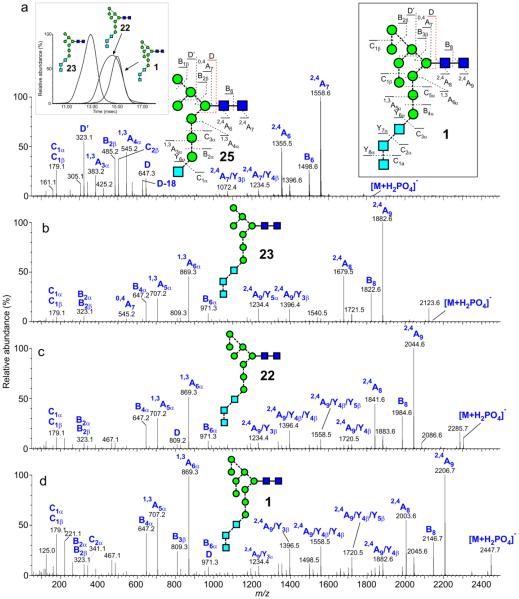
These glycans were produced by expressing gp120 in CHO cells in the presence of the α-glucosidase inhibitor N-butyl-deoxynojirimycin (NB-DNJ) which prevents removal of the glucose residues from Glc3Man9GlcNAc2 (1) at the start of N-glycan processing115 and, thus, prevents degradation of the 3-antenna by exo-mannosidases. Under these conditions, the action of α-mannosidase I only removes one and two mannose residues from the 6-antenna to give 22 and 23. 1,3A cross-ring fragmentation of the intact Glc3Man3 antenna of these compounds gave rise to the prominent ions at m/z 869 and 707 (Figure 10c-d). D and D-18 ions appeared to be suppressed in the spectra of these compounds although the B3β ion at m/z 809 was prominent in the spectrum of Glc3Man9GlcNAc2 (1). The prominent ions at m/z 869 and 707 were diagnostic of these glycans with three glucose residues in the 3-antenna and dropped to 707:545 and to 545:383 for related glycans with two and one glucose residues respectively (Figure 10a). Unfortunately, the CID spectrum of compound 25 was recorded with a Q-TOF mass spectrometer, before the advent of the Synapt series of instruments and, consequently, its drift time was not available.
Figure 10.
Negative ion CID spectra ([M+H PO ]− ion) of: (a) Glc1Man7GlcNAc2 (25). (b) Glc3Man7GlcNAc2 (22). (c) Glc3Man8GlcNAc2 (23) and (d) Glc3Man9GlcNAc2 (1). Spectra b, c and d were from gp120 expressed in CHO cells in the presence of the α-mannosidase inhibitor NB-DNJ. Inset 1 to panel a shows the ATD profiles for Glc3Man7-9GlcNAc2, Inset 2 shows the fragmentation of Glc3Man9GlcNAc2 (1).
The cross sections of the Glc3Man7 and 9GlcNAc2 glycans (23, 1) are listed in Table 2. Although the ATD profiles of Glc3Man7GlcNAc2 (23) and Glc3Man9GlcNAc2 (1) were roughly symmetrical, that from Glc3Man8GlcNAc2 (22) was very broad (first inset, Figure 10a). The fragmentation spectra extracted from all areas of the ATD peak were similar and the intact 3-antenna (confirmed by the presence of the ions at m/z 869 and 707) was consistent with the absence of one of the mannose residues from the 6-antenna. However, some of the ATDs of the fragment ions, particularly m/z 971 (Hex6, B6α) showed separation into two peaks but it was unclear if these represented the d1d1d2- and d1d1d3-isomers; the ion diagnostic for the d3 isomer maximized in the centre of the ATD peak. Possibly conformers were present and this point is being pursued further.
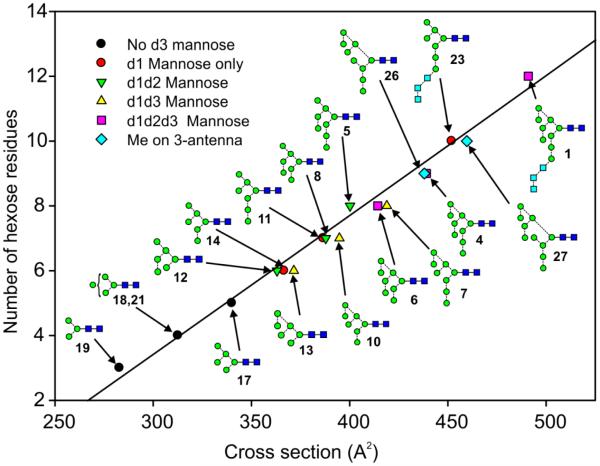
A plot of all the measured CCSs against hexose number for all of the high-mannose glycans recorded in negative ion mode is shown in Figure 11. In general, the same features were apparent as seen in the corresponding positive ion plot (Figure 1). Thus, the Man8GlcNAc2 (7) and Man9GlcNAc2 (4) glycans with mannose at the d3 position again showed increased cross sections compared with those of their respective isomers. This observation was supported by the additional CCSs of the d3 isomer of Man6GlcNAc2 (13), and the d1d3 isomer of Man7GlcNAc2 (10), both of which showed larger cross sections than the isomers without the d3-mannose. No significant differences were seen in the cross sections of the glycans with extra mannose residues in the d1 and d2 positions. Again the results from the Glc3-containing glycans did not fit this pattern but may have been obscured by the presence of conformers causing considerable peak broadening.
Figure 11.
Plot of cross sections against number of hexose residues for the [M+H2PO4]− ions from the high-mannose glycans.
Discussion
The above examples clearly show that ion mobility mass spectrometry adds a further dimension to the analysis of N-linked carbohydrates by mass spectrometry. Some isomeric separation was possible in both ion modes but could be detected more fully in negative ion mode where the presence of isomers was reflected by differences in the masses of certain diagnostic fragments. Characteristic drift-time increases were seen with glycans containing mannose substitution on the d3-branch of the 6-antenna. IM resolution is still rather poor on commercial instruments and for several of the high-mannose glycans, only peak broadening or asymmetric peaks suggested the presence of isomers. Unfortunately, similar results were seen in the presence of conformers, which were also partially separated by ion mobility mass spectrometry. However, because negative ion fragmentation frequently yields ions from isomers that differ in mass, individual ATDs of these ions show different maxima and, when superimposed on the total ATD profile, enabled isomers and conformers to be differentiated. The corresponding experiment performed upon conformers, not isomers, gave ATD traces from the fragment ions that matched the shape of the total ATD peak.
The ability of ion mobility to separate isomers, albeit with rather low resolution at present, is a great asset. One of the main disadvantages of the use of mass spectrometry (without fragmentation) for glycan analysis at present is its inability to separate such compounds and, thus, identifying their presence in mixed spectra. The ion mobility resolution obtained with commercial instruments does not yet match that of an HPLC column but is expected to rise with further instrumental developments. Ultimately, it might be possible to achieve adequate separations in the gas phase in milliseconds rather than the tens or hundreds of minutes required at present with LC-MS systems, thus considerably expediting up analyses.
Conclusions
The work presented here, and by other investigators, shows that ion mobility mass spectrometry has much to offer in glycobiology and is able to solve problems such as isomer resolution that, up to now, have required techniques such as chromatography. With its ability to extract glycan ions from complex mixtures and, thus, eliminate some clean-up stages41, and with its combination with negative ion CID spectra, the technique provides a much more rapid and information-rich method for the structural determination of N-glycans than has been available up to now.
Acknowledgements
We thank Professor Raymond Dwek for his help and encouragement and Drs Stuart Moore and Isabelle Chantret (INSERM, Paris) for the gift of the d1d2 isomer of Man8GlcNAc2 and of the two glycans containing the extra mannose residue in the 3-antenna. This work was supported by the International AIDS Vaccine Initiative Neutralizing Antibody Center CAVD grant (Glycan characterization and Outer Domain glycoform design) and the Scripps CHAVI-ID (1UM1AI100663).
Abbreviations
- ATD
arrival time distribution
- CHO
Chinese hamster ovary
- CID
collision-induced dissociation
- DT
drift tube
- EDD
electron-detatchment dissociation
- EED
electronic excitation dissociation
- endoH
endoglycosidase H
- ETD
electron-transfer dissociation
- ESI
electrospray ionization
- G1
Waters Synapt ion mobility mass spectrometer, first generation
- G2
Waters Synapt ion mobility mass spectrometer, second generation
- Glc
glucose
- GlcNAc
N-acetylglucosamine
- HDMS
high-definition
- HEK
human embryonic kidney
- HIV
human immunodeficiency virus
- HPLC
high-performance liquid chromatography
- Hex
hexose
- LC
liquid chromatography
- JRCSF
clade of gp120
- Man
mannose
- MS
mass spectrometry
- n-ESI
nano-electrospray ionization
- NB-DNJ
N-butyl-deoxynojirimycin
- NMR
nuclear magnetic resonance
- oa
orthogonal acceleration
- PAGE
polyacrylamide gel electrophoresis
- PNGase F
protein N-glycosidase F
- Q
quadrupole
- SDS
sodium dodecylsulfate
- TOF
time-of-flight
- TW IM-MS
travelling-wave ion mobility spectrometry
References
- [1].Petrescu AJ, Wormald MR, Dwek RA. Structural aspects of glycomes with a focus on N-glycosylation and glycoprotein folding. Curr. Opin. Struct. Biol. 2006;16:600–607. doi: 10.1016/j.sbi.2006.08.007. [DOI] [PubMed] [Google Scholar]
- [2].Dalziel M, Crispin M, Scanlan CN, Zitzmann N, Dwek RA. Emerging principles for the therapeutic exploitation of glycosylation. Science. 2014;343:1235681. doi: 10.1126/science.1235681. [DOI] [PubMed] [Google Scholar]
- [3].Gagneux P, Varki A. Evolutionary considerations in relating oligosaccharide diversity to biological function. Glycobiology. 1999;9:747–755. doi: 10.1093/glycob/9.8.747. [DOI] [PubMed] [Google Scholar]
- [4].Varki A, Cummings RD, Esko JD, Freeze HH, Stanley P, Bertozzi CR, Hart GW, Etzler ME. Essentials of Glycobiology. Second. Cold Spring Harbor Laboratory Press; 2008. [PubMed] [Google Scholar]
- [5].Lannoo N, Van Damme EJM. Review/N-glycans: The making of a varied toolbox. Plant Sci. 2015;239:67–83. doi: 10.1016/j.plantsci.2015.06.023. [DOI] [PubMed] [Google Scholar]
- [6].Scanlan CN, Offer J, Zitzmann N, Dwek RA. Exploiting the defensive sugars of HIV-1 for drug and vaccine design. Nature. 2007;446:1038–1045. doi: 10.1038/nature05818. [DOI] [PubMed] [Google Scholar]
- [7].Crispin M, Doores KJ. Targeting host-derived glycans on enveloped viruses for antibody-based vaccine design. Curr Opin. Virol. 2015;11:63–69. doi: 10.1016/j.coviro.2015.02.002. [DOI] [PMC free article] [PubMed] [Google Scholar]
- [8].Pritchard LK, Spencer DIR, Royle L, Bonomelli C, Seabright GE, Behrens A-J, Kulp DW, Menis S, Krumm SA, Dunlop DC, Crispin DJ, Bowden TA, Scanlan CN, Ward AB, Schief WR, Doores KJ, Crispin M. Glycan clustering stabilizes the mannose patch of HIV-1 and preserves vulnerability to broadly neutralizing antibodies. Nat. Commun. 2015;6 doi: 10.1038/ncomms8479. Article 7479. [DOI] [PMC free article] [PubMed] [Google Scholar]
- [9].Pritchard LK, Harvey DJ, Bonomelli C, Crispin M, Doores K. J. Cell- and protein-directed glycosylation of native cleaved HIV-1 envelope. J. Virol. 2015;89:8932–8944. doi: 10.1128/JVI.01190-15. [DOI] [PMC free article] [PubMed] [Google Scholar]
- [10].Pejchal R, Doores KJ, Walker LM, Khayat R, Huang PS, Wang SK, Stanfield RL, Julien JP, Ramos A, Crispin M, Depetris R, Katpally U, Marozsan A, Cupo A, Maloveste S, Liu Y, McBride R, Ito Y, Sanders RW, Ogohara C, Paulson JC, Feizi T, Scanlan CN, Wong CH, Moore JP, Olson WC, Ward AB, Poignard P, Schief WR, Burton DR, Wilson IA. A potent and broad neutralizing antibody recognizes and penetrates the HIV glycan shield. Science. 2011;334:1097–1103. doi: 10.1126/science.1213256. [DOI] [PMC free article] [PubMed] [Google Scholar]
- [11].Burton DR, Ahmed R, Barouch DH, Butera ST, Crotty S, Godzik A, Kaufmann DE, McElrath MJ, Nussenzweig MC, Pulendran B, Scanlan CN, Schief WR, Silvestri G, Streeck H, Walker BD, Walker LM, Ward AB, Wilson IA, Wyatt R. A blueprint for HIV vaccine discovery. Cell Host Microbe. 2012;12:396–407. doi: 10.1016/j.chom.2012.09.008. [DOI] [PMC free article] [PubMed] [Google Scholar]
- [12].Pritchard LK, Vasiljevic S, Ozorowski G, Seabright GE, Cupo A, Ringe R, Kim HJ, Sanders RW, Doores KJ, Burton DR, Wilson IA, Ward AB, Moore JP, Crispin M. Structural constraints determine the glycosylation of HIV-1 envelope trimers. Cell Rep. 2015;11:1604–1613. doi: 10.1016/j.celrep.2015.05.017. [DOI] [PMC free article] [PubMed] [Google Scholar]
- [13].Alley WR, Jr., Mann BF, Novotny MV. High-sensitivity analytical approaches for the structural characterization of glycoproteins. Chem. Rev. 2013;113:2668–2732. doi: 10.1021/cr3003714. [DOI] [PMC free article] [PubMed] [Google Scholar]
- [14].Alley WR, Jr., Novotny MV. Structural glycomic analyses at high sensitivity: A decade of progress. Annu. Rev. Anal. Chem. 2013;6:237–265. doi: 10.1146/annurev-anchem-062012-092609. [DOI] [PMC free article] [PubMed] [Google Scholar]
- [15].Harvey DJ. Proteomic analysis of glycosylation: structural determination of N- and O-linked glycans by mass spectrometry. Expert Rev. Proteomics. 2005;2:87–101. doi: 10.1586/14789450.2.1.87. [DOI] [PubMed] [Google Scholar]
- [16].Harvey DJ. In: Electrospray and MALDI Mass Spectrometry: Fundamentals, Instrumentation, Practicalities, and Biological Applications. 2nd Cole RB, editor. John Wiley and Sons Inc.; Hoboken, NJ, USA: 2010. pp. 723–769. [Google Scholar]
- [17].Zaia J. Mass spectrometry of oligosaccharides. Mass Spectrom. Rev. 2004;23:161–227. doi: 10.1002/mas.10073. [DOI] [PubMed] [Google Scholar]
- [18].Ciucanu I, Kerek F. A simple and rapid method for the permethylation of carbohydrates. Carbohydr. Res. 1984;131:209–217. [Google Scholar]
- [19].Hakomori S. A rapid permethylation of glycolipid, and polysaccharide catalysed by methylsulfinyl carbanion in dimethyl sulfoxide. J. Biochem. (Tokyo) 1964;55:205–208. [PubMed] [Google Scholar]
- [20].Dell A. Preparation and desorption mass spectrometry of permethyl and peracetyl derivatives of oligosaccharides. Methods Enzymol. 1990;193:647–660. doi: 10.1016/0076-6879(90)93443-o. [DOI] [PubMed] [Google Scholar]
- [21].Kang P, Mechref Y, Klouckova I, Novotny MV. Solid-phase permethylation of glycans for mass spectrometric analysis. Rapid Commun. Mass Spectrom. 2005;19:3421–3428. doi: 10.1002/rcm.2210. [DOI] [PMC free article] [PubMed] [Google Scholar]
- [22].Harvey DJ. Derivatization of carbohydrates for analysis by chromatography, electrophoresis and mass spectrometry. J. Chromatogr., B. 2011;879:1196–1225. doi: 10.1016/j.jchromb.2010.11.010. [DOI] [PubMed] [Google Scholar]
- [23].Ruiz-Matute AI, Hernández-Hernández O, Rodríguez-Sánchez S, Sanz ML, Martínez-Castro I. Derivatization of carbohydrates for GC and GC-MS analyses. J. Chromatogr., B. 2011;879:1226–1240. doi: 10.1016/j.jchromb.2010.11.013. [DOI] [PubMed] [Google Scholar]
- [24].Han L, Costello CE. Electron transfer dissociation of milk oligosaccharides. J. Am. Soc. Mass Spectrom. 2011;22:997–1013. doi: 10.1007/s13361-011-0117-9. [DOI] [PMC free article] [PubMed] [Google Scholar]
- [25].Zhu Z, Su X, Clark DF, Go EP, Desaire H. Characterizing O-linked glycopeptides by electron transfer dissociation: Fragmentation rules and applications in data analysis. Anal. Chem. 2013;85:8403–8411. doi: 10.1021/ac401814h. [DOI] [PMC free article] [PubMed] [Google Scholar]
- [26].Zhou W, Håkansson K. Electron detachment dissociation of fluorescently labeled sialylated oligosaccharides. Electrophoresis. 2011;32:3526–3535. doi: 10.1002/elps.201100327. [DOI] [PMC free article] [PubMed] [Google Scholar]
- [27].Kornacki JR, Adamson JT, Håkansson K. Electron detachment dissociation of underivatized chloride-adducted oligosaccharides. J. Am. Soc. Mass Spectrom. 2012;23:2031–2042. doi: 10.1007/s13361-012-0459-y. [DOI] [PubMed] [Google Scholar]
- [28].Yu X, Jiang Y, Chen Y, Huang Y, Costello CE, Lin C. Detailed glycan structural characterization by electronic excitation dissociation. Anal. Chem. 2013;85:10017–10021. doi: 10.1021/ac402886q. [DOI] [PMC free article] [PubMed] [Google Scholar]
- [29].Harvey DJ. Fragmentation of negative ions from carbohydrates: Part 2, Fragmentation of high-mannose N-linked glycans. J. Am. Soc. Mass Spectrom. 2005;16:631–646. doi: 10.1016/j.jasms.2005.01.005. [DOI] [PubMed] [Google Scholar]
- [30].Harvey DJ. Fragmentation of negative ions from carbohydrates: Part 1; Use of nitrate and other anionic adducts for the production of negative ion electrospray spectra from N-linked carbohydrates. J. Am. Soc. Mass Spectrom. 2005;16:622–630. doi: 10.1016/j.jasms.2005.01.004. [DOI] [PubMed] [Google Scholar]
- [31].Harvey DJ. Fragmentation of negative ions from carbohydrates: Part 3, Fragmentation of hybrid and complex N-linked glycans. J. Am. Soc. Mass Spectrom. 2005;16:647–659. doi: 10.1016/j.jasms.2005.01.006. [DOI] [PubMed] [Google Scholar]
- [32].Harvey DJ, Royle L, Radcliffe CM, Rudd PM, Dwek RA. Structural and quantitative analysis of N-linked glycans by MALDI and negative ion nanospray mass spectrometry. Anal. Biochem. 2008;376:44–60. doi: 10.1016/j.ab.2008.01.025. [DOI] [PubMed] [Google Scholar]
- [33].Bonomelli C, Doores KJ, Dunlop DC, Thaney V, Dwek RA, Burton DR, Crispin M, Scanlan CN. The glycan shield of HIV is predominantly oligomannose independently of production system or viral clade. PLoS One. 2011;6:e23521. doi: 10.1371/journal.pone.0023521. [DOI] [PMC free article] [PubMed] [Google Scholar]
- [34].Both P, Green AP, Gray CJ, Šardzík R, Voglmeir J, Fontana C, Austeri M, Rejzek M, Richardson D, Field RA, Widmalm G, Flitsch SL, Eyers CE. Discrimination of epimeric glycans and glycopeptides using IM-MS and its potential for carbohydrate sequencing. Nat. Chem. 2014;6:65–74. doi: 10.1038/nchem.1817. [DOI] [PubMed] [Google Scholar]
- [35].Crispin M, Harvey DJ, Bitto D, Bonomelli C, Edgeworth M, Scrivens JH, Huiskonen JT, Bowden TA. Structural plasticity of the Semliki Forest virus glycome upon interspecies transmission. J. Proteome Res. 2014;13:1702–1712. doi: 10.1021/pr401162k. [DOI] [PMC free article] [PubMed] [Google Scholar]
- [36].Crispin M, Harvey DJ, Bitto D, Halldorsson S, Bonomelli C, Edgeworth M, Scrivens JH, Huiskonen JT, Bowden TA. Uukuniemi phlebovirus assembly and secretion leave a functional imprint on the virion glycome. J. Virol. 2014;88:10244–10251. doi: 10.1128/JVI.01662-14. [DOI] [PMC free article] [PubMed] [Google Scholar]
- [37].Damen CWN, Chen W, Chakraborty AB, van Oosterhout M, Mazzeo JR, Gebler JC, Schellens JHM, Rosing H, Beijnen JH. Electrospray ionization quadrupole ion-mobility time-of-flight mass spectrometry as a tool to distinguish the lot-to-lot heterogeneity in N-glycosylation profile of the therapeutic monoclonal antibody Trastuzumab. J. Am. Soc. Mass Spectrom. 2009;20:2021–2033. doi: 10.1016/j.jasms.2009.07.017. [DOI] [PubMed] [Google Scholar]
- [38].Doores KJ, Bonomelli C, Harvey DJ, Vasiljevic S, Dwek RA, Burton DR, Crispin M, Scanlan CN. Envelope glycans of immunodeficiency virions are almost entirely oligomannose antigens. Proc. Natl. Acad. Sci., USA. 2010;107:13800–13805. doi: 10.1073/pnas.1006498107. [DOI] [PMC free article] [PubMed] [Google Scholar]
- [39].Fenn LS, McLean JA. Simultaneous glycoproteomics on the basis of structure using ion mobility-mass spectrometry. Mol. Biosyst. 2009;5:1298–1302. doi: 10.1039/b909745g. [DOI] [PubMed] [Google Scholar]
- [40].Gaye MM, Valentine SJ, Hu Y, Mirjankar N, Hammoud ZT, Mechref Y, Lavine BK, Clemmer DE. Ion mobility-mass spectrometry analysis of serum N-linked glycans from esophageal adenocarcinoma phenotypes. J. Proteome Res. 2012;11:6102–6110. doi: 10.1021/pr300756e. [DOI] [PMC free article] [PubMed] [Google Scholar]
- [41].Harvey DJ, Sobott F, Crispin M, Wrobel A, Bonomelli C, Vasiljevic S, Scanlan CN, Scarff C, Thalassinos K, Scrivens JH. Ion mobility mass spectrometry for extracting spectra of N-glycans directly from incubation mixtures following glycan release: Application to glycans from engineered glycoforms of intact, folded HIV gp120. J. Am. Soc. Mass Spectrom. 2011;22:568–581. doi: 10.1007/s13361-010-0053-0. [DOI] [PubMed] [Google Scholar]
- [42].Harvey DJ, Scarff CA, Crispin M, Scanlan CN, Bonomelli C, Scrivens JH. MALDI-MS/MS with traveling wave ion mobility for the structural analysis of N-linked glycans. J. Am. Soc. Mass Spectrom. 2012;23:1955–1966. doi: 10.1007/s13361-012-0425-8. [DOI] [PubMed] [Google Scholar]
- [43].Harvey DJ. In: Encyclopedia of Biophysics. Roberts GCK, editor. Berlin, Heidelberg; Springer: 2013. pp. 1405–1416. [Google Scholar]
- [44].Harvey DJ, Scarff CA, Edgeworth M, Crispin M, Scanlan CN, Sobott F, Allman S, Baruah K, Pritchard L, Scrivens JH. Travelling wave ion mobility and negative ion fragmentation for the structural determination of N-linked glycans. Electrophoresis. 2013;34:2368–2378. doi: 10.1002/elps.201200669. [DOI] [PubMed] [Google Scholar]
- [45].Isailovic D, Kurulugama RT, Plasencia MD, Stokes ST, Kyselova Z, Goldman R, Mechref Y, Novotny MV, Clemmer DE. Profiling of human serum glycans associated with liver cancer and cirrhosis by IMS-MS. J. Proteome Res. 2008;7:1109–1117. doi: 10.1021/pr700702r. [DOI] [PMC free article] [PubMed] [Google Scholar]
- [46].Lareau NM, May JC, McLean JA. Non-derivatized glycan analysis by reverse phase liquid chromatography and ion mobility-mass spectrometry. Analyst. 2015;140:3335–3338. doi: 10.1039/c5an00152h. [DOI] [PMC free article] [PubMed] [Google Scholar]
- [47].Plasencia MD, Isailovic D, Merenbloom SI, Mechref Y, Clemmer DE. Resolving and assigning N-linked glycan structural isomers from ovalbumin by IMS-MS. J. Am. Soc. Mass Spectrom. 2008;19:1706–1715. doi: 10.1016/j.jasms.2008.07.020. [DOI] [PMC free article] [PubMed] [Google Scholar]
- [48].Vakhrushev SY, Langridge J, Campuzano I, Hughes C, Peter-Katalinić J. Identification of monosialylated N-glycoforms in the CDG urinome by ion mobility tandem mass spectrometry: The potential for clinical applications. Clin. Proteomics. 2008;4:47–57. [Google Scholar]
- [49].Williams JP, Grabenauer M, Carpenter CJ, Holland RJ, Wormald MR, Giles K, Harvey DJ, Bateman RH, Scrivens JH, Bowers MT. Characterization of simple isomeric oligosaccharides and the rapid separation of glycan mixtures by ion mobility mass spectrometry. Int. J. Mass Spectrom. 2010;298:119–127. [Google Scholar]
- [50].Yamaguchi Y, Nishima W, Re S, Sugita Y. Confident identification of isomeric N-glycan structures by combined ion mobility mass spectrometry and hydrophilic interaction liquid chromatography. Rapid Commun. Mass Spectrom. 2012;26:2877–2884. doi: 10.1002/rcm.6412. [DOI] [PubMed] [Google Scholar]
- [51].Zhu F, Lee S, Valentine SJ, Reilly JP, Clemmer DE. Mannose7 glycan isomer characterization by IMS-MS/MS analysis. J. Am. Soc. Mass Spectrom. 2012;23:2158–2166. doi: 10.1007/s13361-012-0491-y. [DOI] [PMC free article] [PubMed] [Google Scholar]
- [52].Ackerman ME, Crispin M, Yu X, Baruah K, Boesch AW, Harvey DJ, Dugast A-S, Heizen EL, Ercan A, Choi I, Streeck H, Nigrovic PA, Bailey-Kellogg C, Scanlan C, Alter G. Natural variation in Fc glycosylation of HIV-specific antibodies impacts antiviral activity. J. Clin. Invest. 2013;123:2183–2192. doi: 10.1172/JCI65708. [DOI] [PMC free article] [PubMed] [Google Scholar]
- [53].Fenn LS, McLean JA. Biomolecular structural separations by ion mobility–mass spectrometry. Anal. Bioanal. Chem. 2008;391:905–909. doi: 10.1007/s00216-008-1951-x. [DOI] [PubMed] [Google Scholar]
- [54].Fenn LS, McLean JA. Enhanced carbohydrate structural selectivity in ion mobility-mass spectrometry analyses by boronic acid derivatization. Chem. Commun. 2008:5505–5507. doi: 10.1039/b810421b. [DOI] [PubMed] [Google Scholar]
- [55].Fenn LS, Kliman M, Mahsut A, Zhao SR, McLean JA. Characterizing ion mobility-mass spectrometry conformation space for the analysis of complex biological samples. Anal. Bioanal. Chem. 2009;394:235–244. doi: 10.1007/s00216-009-2666-3. [DOI] [PMC free article] [PubMed] [Google Scholar]
- [56].Harvey DJ, Crispin M, Bonomelli C, Scrivens JH. Ion mobility mass spectrometry for ion recovery and clean-up of MS and MS/MS spectra obtained from low abundance viral samples. J. Am. Soc. Mass Spectrom. 2015;26 doi: 10.1007/s13361-015-1163-5. In Press. [DOI] [PMC free article] [PubMed] [Google Scholar]
- [57].Li H, Bendiak B, Siems WF, Gang DR, Hill HH., Jr. Ion mobility-mass correlation trend line separation of glycoprotein digests without deglycosylation. Int. J. Ion Mobil. Spectrom. 2013;16:105–115. doi: 10.1007/s12127-013-0127-3. [DOI] [PMC free article] [PubMed] [Google Scholar]
- [58].Gabryelski W, Froese KL. Rapid and sensitive differentiation of anomers, linkage, and position isomers of disaccharides using High-Field Asymmetric Waveform Ion Mobility Spectrometry (FAIMS) J. Am. Soc. Mass Spectrom. 2003;14:265–277. doi: 10.1016/S1044-0305(03)00002-3. [DOI] [PubMed] [Google Scholar]
- [59].Clowers BH, Dwivedi P, Steiner WE, Hill HHJ, Bendiak B. Separation of sodiated isobaric disaccharides and trisaccharides using electrospray ionization-atmospheric pressure ion mobility-time of flight mass spectrometry. J. Am. Soc. Mass Spectrom. 2005;16:660–669. doi: 10.1016/j.jasms.2005.01.010. [DOI] [PubMed] [Google Scholar]
- [60].Dwivedi P, Bendiak B, Clowers BH, Hill HHJ. Rapid resolution of carbohydrate isomers by electrospray ionization ambient pressure ion mobility spectrometry-time-of-flight mass spectrometry (ESI-APIMS-TOFMS) J. Am. Soc. Mass Spectrom. 2007;18:1163–1175. doi: 10.1016/j.jasms.2007.04.007. [DOI] [PubMed] [Google Scholar]
- [61].Yamagaki T, Sato A. Peak width-mass correlation in CID MS/MS of isomeric oligosaccharides using traveling-wave ion mobility mass spectrometry. J. Mass Spectrom. 2009;44:1509–1517. doi: 10.1002/jms.1641. [DOI] [PubMed] [Google Scholar]
- [62].Yamagaki T, Sato A. Isomeric oligosaccharides analyses using negative-ion electrospray ionization ion mobility spectrometry combined with collision-induced dissociation MS/MS. Anal. Sci. 2009;25:985–988. doi: 10.2116/analsci.25.985. [DOI] [PubMed] [Google Scholar]
- [63].Zhu M, Bendiak B, Clowers B, Hill HH. Ion mobility-mass spectrometry analysis of isomeric carbohydrate precursor ions. Anal. Bioanal. Chem. 2009;394:1853–1867. doi: 10.1007/s00216-009-2865-y. [DOI] [PMC free article] [PubMed] [Google Scholar]
- [64].Schenauer MR, Meissen JK, Seo Y, Ames JB, Leary JA. Heparan sulfate separation, sequencing, and isomeric differentiation: Ion mobility spectrometry reveals specific iduronic and glucuronic acid-containing hexasaccharides. Anal. Chem. 2009;81:10179–10185. doi: 10.1021/ac902186h. [DOI] [PMC free article] [PubMed] [Google Scholar]
- [65].Fasciotti M, Sanvido GB, Santos VG, Lalli PM, McCullagh M, de Sá GF, Daroda RJ, Petera MG, Eberlina MN. Separation of isomeric disaccharides by traveling wave ion mobility mass spectrometry using CO2 as drift gas. J. Mass Spectrom. 2012;27:1643–1647. doi: 10.1002/jms.3089. [DOI] [PubMed] [Google Scholar]
- [66].Seo Y, Andaya A, Leary JA. Preparation, separation, and conformational analysis of differentially sulfated heparin octasaccharide isomers using ion mobility mass spectrometry. Anal. Chem. 2012;84:2416–2423. doi: 10.1021/ac203190k. [DOI] [PMC free article] [PubMed] [Google Scholar]
- [67].Lee S, Valentine SJ, Reilly JP, Clemmer DE. Analyzing a mixture of disaccharides by IMS-VUVPD-MS. Int. J. Mass Spectrom. 2012;309:161–167. doi: 10.1016/j.ijms.2011.09.013. [DOI] [PMC free article] [PubMed] [Google Scholar]
- [68].Li H, Giles K, Bendiak B, Kaplan K, Siems WF, Hill HH., Jr. Resolving structural isomers of monosaccharide methyl glycosides using drift tube and traveling wave ion mobility mass spectrometry. Anal. Chem. 2012;84:3231–3239. doi: 10.1021/ac203116a. [DOI] [PMC free article] [PubMed] [Google Scholar]
- [69].Li H, Bendiak B, Siems WF, Gang DR, Hill J, Herbert H. Ion mobility mass spectrometry analysis of isomeric disaccharide precursor, product and cluster ions. Rapid Commun. Mass Spectrom. 2013;27:2699–2709. doi: 10.1002/rcm.6720. [DOI] [PMC free article] [PubMed] [Google Scholar]
- [70].Huang J-H, Bakx EJ, Gruppen H, Schols HA. Characterisation of 3-aminoquinoline-derivatised isomeric oligogalacturonic acid by travelling-wave ion mobility mass spectrometry. Rapid Commun. Mass Spectrom. 2013;27:2279–2285. doi: 10.1002/rcm.6692. [DOI] [PubMed] [Google Scholar]
- [71].Li H, Bendiak B, Kaplan K, Davis E, Siems WF. Evaluation of ion mobility-mass spectrometry for determining the isomeric heterogeneity of oligosaccharide-alditols derived from bovine submaxillary mucin. Int. J. Mass Spectrom. 2013;352:9–18. doi: 10.1016/j.ijms.2013.07.015. H. HJH. [DOI] [PMC free article] [PubMed] [Google Scholar]
- [72].Huang Y, Dodds ED. Ion mobility studies of carbohydrates as group I adducts: Isomer specific collisional cross section dependence on metal ion radius. Anal. Chem. 2013;85:9728–9735. doi: 10.1021/ac402133f. [DOI] [PubMed] [Google Scholar]
- [73].Li H, Bendiak B, Siems WF, Gang DR, Hill J, Herbert H. Carbohydrate structure characterization by tandem ion mobility mass spectrometry (IMMS)2. Anal. Chem. 2013;85:2760–2769. doi: 10.1021/ac303273z. [DOI] [PMC free article] [PubMed] [Google Scholar]
- [74].Fenn LS, McLean JA. Structural separations by ion mobility-MS for glycomics and glycoproteomics. Methods Molec. Biol. 2013;951:171–194. doi: 10.1007/978-1-62703-146-2_12. [DOI] [PMC free article] [PubMed] [Google Scholar]
- [75].Li H, Bendiak B, Siems WF, Gang DR, Hill J, Herbert H. Determining the isomeric heterogeneity of neutral oligosaccharide-alditols of bovine submaxillary mucin using negative ion traveling wave ion mobility mass spectrometry. Anal. Chem. 2015;87:2228–2235. doi: 10.1021/ac503754k. [DOI] [PubMed] [Google Scholar]
- [76].Gaye MM, Kurulugama R, Clemmer DE. Investigating carbohydrate isomers by IMS-CID-IMS-MS: Precursor and fragment ion cross-sections. Analyst. 2015;140:6922–6932. doi: 10.1039/c5an00840a. [DOI] [PubMed] [Google Scholar]
- [77].Hofmann J, Hahm HS, Seeberger PH, Pagel K. Identification of carbohydrate anomers using ion mobility-mass spectrometry. Nature. 2015;526:241–244. doi: 10.1038/nature15388. [DOI] [PubMed] [Google Scholar]
- [78].Huang Y, Dodds ED. Ion-neutral collisional cross sections of carbohydrate isomers as divalent cation adducts and their electron transfer products. Analyst. 2015;140:6912–6921. doi: 10.1039/c5an01093d. [DOI] [PubMed] [Google Scholar]
- [79].Pettit ME, Harper B, Brantley MR, Solouki T. Collision-energy resolved ion mobility characterization of isomeric mixtures. Analyst. 2015;140:6886–6896. doi: 10.1039/c5an00940e. [DOI] [PubMed] [Google Scholar]
- [80].Kanu AB, Dwivedi P, Tam M, Matz L, Hill HHJ. Ion mobility-mass spectrometry. J. Mass Spectrom. 2008;43:1–22. doi: 10.1002/jms.1383. [DOI] [PubMed] [Google Scholar]
- [81].Jackson SN, Colsch B, Egan T, Lewis EK, Schultz JA, Woods AS. Gangliosides' analysis by MALDI-ion mobility MS. Analyst. 2011;136:463–466. doi: 10.1039/c0an00732c. [DOI] [PMC free article] [PubMed] [Google Scholar]
- [82].Struwe WB, Benesch JL, Harvey DJ, Pagel K. Collision cross sections of high-mannose N-glycans in commonly observed adduct states - Identification of gas-phase conformers unique to [M-H]− ions. Analyst. 2015;140:6799–6803. doi: 10.1039/c5an01092f. [DOI] [PubMed] [Google Scholar]
- [83].Patel T, Bruce J, Merry A, Bigge C, Wormald M, Jaques A, Parekh R. Use of hydrazine to release in intact and unreduced form both N- and O-linked oligosaccharides from glycoproteins. Biochemistry. 1993;32:679–693. doi: 10.1021/bi00053a037. [DOI] [PubMed] [Google Scholar]
- [84].Wing DR, Field MC, Schmitz B, Thor G, Dwek RA, Schachner MS, Rademacher TW. The use of large-scale hydrazinolysis in the preparation of N-linked oligosaccharide libraries: application to brain tissue. Glycoconj. J. 1992;9:293–301. doi: 10.1007/BF00731089. [DOI] [PubMed] [Google Scholar]
- [85].Fu D, Chen L, O'Neill RA. A detailed structural characterization of ribonuclease B oligosaccharides by 1H NMR spectroscopy and mass spectrometry. Carbohydr. Res. 1994;261:173–186. doi: 10.1016/0008-6215(94)84015-6. [DOI] [PubMed] [Google Scholar]
- [86].Prien JM, Ashline DJ, Lapadula AJ, Zhang H, Reinhold VN. The high mannose glycans from bovine ribonuclease B isomer characterization by ion trap MS. J. Am. Soc. Mass Spectrom. 2009;20:539–556. doi: 10.1016/j.jasms.2008.11.012. [DOI] [PMC free article] [PubMed] [Google Scholar]
- [87].de Waard P, Koorevaar A, Kamerling JP, Vliegenthart JFG. Structure determination by 1H NMR spectroscopy of (sulfated) sialylated N-linked carbohydrate chains released from porcine thyroglobulin by peptide-N4-(N-acetyl-β-glucosaminyl)asparagine amidase-F. J. Biol. Chem. 1991;266:4237–4243. [PubMed] [Google Scholar]
- [88].Kamerling JP, Rijkse I, Maas AAM, van Kuik JA, Vliegenthart JFG. Sulfated N-linked carbohydrate chains in porcine thyroglobulin. FEBS Letts. 1988;241:246–250. doi: 10.1016/0014-5793(88)81070-6. [DOI] [PubMed] [Google Scholar]
- [89].Da Silva MLC, Stubbs HJ, Tamura T, Rice KG. 1H-NMR characterization of a hen ovalbumin tyrosinamide N-linked oligosaccharide library. Arch. Biochem. Biophys. 1995;318:465–475. doi: 10.1006/abbi.1995.1255. [DOI] [PubMed] [Google Scholar]
- [90].Harvey DJ, Wing DR, Küster B, Wilson IBH. Composition of N-linked carbohydrates from ovalbumin and co-purified glycoproteins. J. Am. Soc. Mass Spectrom. 2000;11:564–571. doi: 10.1016/S1044-0305(00)00122-7. [DOI] [PubMed] [Google Scholar]
- [91].Yang Y, Barendregt A, Kamerling JP, Heck AJR. Analyzing protein micro-heterogeneity in chicken ovalbumin by high-resolution native mass spectrometry exposes qualitatively and semi-quantitatively 59 proteoforms. Anal. Chem. 2013;85:12037–12045. doi: 10.1021/ac403057y. [DOI] [PMC free article] [PubMed] [Google Scholar]
- [92].Green ED, Adelt G, Baenziger JU, Wilson S, van Halbeek H. The asparagine-linked oligosaccharides on bovine fetuin. Structural analysis of N-glycanase-released oligosaccharides by 500-Megahertz 1H-NMR spectroscopy. J. Biol. Chem. 1988;263:18253–18268. [PubMed] [Google Scholar]
- [93].Küster B, Wheeler SF, Hunter AP, Dwek RA, Harvey DJ. Sequencing of N-linked oligosaccharides directly from protein gels: In-gel deglycosylation followed by matrix-assisted laser desorption/ionization mass spectrometry and normal-phase high performance liquid chromatography. Anal. Biochem. 1997;250:82–101. doi: 10.1006/abio.1997.2199. [DOI] [PubMed] [Google Scholar]
- [94].Börnsen KO, Mohr MD, Widmer HM. Ion exchange and purification of carbohydrates on a Nafion(R) membrane as a new sample pretreatment for matrix-assisted laser desorption-ionization mass spectrometry. Rapid Commun. Mass Spectrom. 1995;9:1031–1034. [Google Scholar]
- [95].Giles K, Pringle SD, Worthington KR, Little D, Wildgoose JL, Bateman RH. Applications of a travelling wave-based radio-frequency-only stacked ring ion guide. Rapid Commun. Mass Spectrom. 2004;18:2401–2414. doi: 10.1002/rcm.1641. [DOI] [PubMed] [Google Scholar]
- [96].Domon B, Costello CE. A systematic nomenclature for carbohydrate fragmentations in FAB-MS/MS spectra of glycoconjugates. Glycoconj. J. 1988;5:397–409. [Google Scholar]
- [97].Pringle SD, Giles K, Wildgoose JL, Williams JP, Slade SE, Thalassinos K, Bateman RH, Bowers MT, Scrivens JH. An investigation of the mobility separation of some peptide and protein ions using a new hybrid quadrupole/travelling wave IMS/oa-ToF instrument. Int. J. Mass Spectrom. 2007;261:1–12. [Google Scholar]
- [98].Bush MF, Hall Z, Giles K, Hoyes J, Robinson CV, Ruotolo BT. Collision cross sections of proteins and their complexes: A calibration framework and database for gas-phase structural biology. Anal. Chem. 2010;82:9557–9565. doi: 10.1021/ac1022953. [DOI] [PubMed] [Google Scholar]
- [99].Pagel K, Natan E, Hall Z, Fersht AR, Robinson CV. Intrinsically disordered p53 and its complexes populate compact conformations in the gas phase. Angew. Chem. Int. Ed. 2013;52:361–365. doi: 10.1002/anie.201203047. [DOI] [PubMed] [Google Scholar]
- [100].Pagel K, Harvey DJ. Ion mobility mass spectrometry of complex carbohydrates - collision cross sections of sodiated N-linked glycans. Anal. Chem. 2013;85:5138–5145. doi: 10.1021/ac400403d. [DOI] [PubMed] [Google Scholar]
- [101].Thalassinos K, Grabenauer M, Slade SE, Hilton GR, Bowers MT, Scrivens JH. Characterization of phosphorylated peptides using traveling wave-based and drift cell ion mobility mass spectrometry. Anal. Chem. 2009;81:248–254. doi: 10.1021/ac801916h. [DOI] [PubMed] [Google Scholar]
- [102].Hofmann J, Struwe WB, Scarff CA, Scrivens JH, Harvey DJ, Pagel K. Estimating collision cross sections of negatively charged N-glycans using travelling wave ion mobility-mass spectrometry. Anal. Chem. 2014;86:10789–10795. doi: 10.1021/ac5028353. [DOI] [PubMed] [Google Scholar]
- [103].Forsythe JG, Petrov AS, Walker CA, Allen SJ, Pellissier JS, Bush MF, Huda NV, Fernández FM. Collision cross section calibrants for negative ion mode traveling wave ion mobility-mass spectrometry. Analyst. 2015 doi: 10.1039/c5an00946d. In press. [DOI] [PubMed] [Google Scholar]
- [104].Gelb AS, Jarratt RE, Huang Y, Dodds ED. A study of calibrant selection in measurement of carbohydrate and peptide ion-neutral collision cross sections by traveling wave ion mobility spectrometry. Anal. Chem. 2014;86:11396–11402. doi: 10.1021/ac503379e. [DOI] [PubMed] [Google Scholar]
- [105].Struwe WB, Pagel K, Benesch JLP, Harvey DJ, Campbell MP. GlycoMob: An ion mobility-mass spectrometry collision cross section database for glycomics. Glycoconj. J. 2015 doi: 10.1007/s10719-015-9613-7. In Press. [DOI] [PubMed] [Google Scholar]
- [106].Harvey DJ, Scrivens JH, Holland R, Williams JP, Wormald MR. Ion-mobility separation coupled with negative ion fragmentation of N-linked carbohydrates. Paper presented at the 56th ASMS Conference on Mass Spectrometry, Denver. 2008 Proceedings CD, MOG 09.10. [Google Scholar]
- [107].Hermannová M, Iordache A-M, Slováková K, Havlíček V, Pelantová H, Lemr K. Arrival time distributions of product ions reveal isomeric ratio of deprotonated molecules in ion mobility– mass spectrometry of hyaluronan-derived oligosaccharides. J. Mass Spectrom. 2015;50:854–863. doi: 10.1002/jms.3596. [DOI] [PubMed] [Google Scholar]
- [108].Nishikaze T, Kaneshiro K, Kawabata S-i, Tanaka K. Structural analysis of N-glycans by the glycan-labeling method using 3-aminoquinoline-based liquid matrix in negative-ion MALDIMS. Anal. Chem. 2012;84:9453–9461. doi: 10.1021/ac302286e. [DOI] [PubMed] [Google Scholar]
- [109].Harvey DJ, Edgeworth M, Krishna BA, Bonomelli C, Allman S, Crispin M, Scrivens JH. Fragmentation of negative ions from N-linked carbohydrates: Part 6: Glycans containing one N-acetylglucosamine in the core. Rapid Commun. Mass Spectrom. 2014;28:2008–2018. doi: 10.1002/rcm.6980. [DOI] [PubMed] [Google Scholar]
- [110].Hernandez O, Isenberg S, Steinmetz V, Glish GL, Maitre P. Probing mobility-selected saccharide isomers: Selective ion-molecule reactions and wavelength-specific IR activation. J. Phys. Chem. A. 2015;119:6057–6064. doi: 10.1021/jp511975f. [DOI] [PubMed] [Google Scholar]
- [111].Mo F, Jensen LH. The crystal structure of a β-(1-4) linked disaccharide, α-N,N'- diacetylchitobiose monohydrate. Acta Crystallographica B. 1978;34:1562–1569. [Google Scholar]
- [112].Mo F. On the conformational variability of the N-acetylglucosamin β-(1-4) linked dimer. Crystal and molecular structure of β-N,N'-diacetylchitobiose trihydrate. Acta Chem. Scand. A. 1979;33:207–218. [Google Scholar]
- [113].Woods RJ, Pathiaseril A, Wormald MR, Edge CJ, Dwek RA. The high degree of internal flexibility observed for an oligomannose oligosaccharide does not alter the overall topology of the molecule. Eur. J. Biochem. 1998;258:372–386. doi: 10.1046/j.1432-1327.1998.2580372.x. [DOI] [PubMed] [Google Scholar]
- [114].Orlean P. Architecture and biosynthesis of the. Saccharomyces cerevisiae cell wall. Genetics. 2012;192:775–818. doi: 10.1534/genetics.112.144485. [DOI] [PMC free article] [PubMed] [Google Scholar]
- [115].Dwek RA, Butters TD, Platt FM, Zitzmann N. Targeting glycosylation as a therapeutic approach. Nat. Rev. Drug Discov. 2002;1:65–75. doi: 10.1038/nrd708. [DOI] [PubMed] [Google Scholar]
- [116].Harvey DJ, Merry AH, Royle L, Campbell MP, Dwek RA, Rudd PM. Proposal for a standard system for drawing structural diagrams of N- and O-linked carbohydrates and related compounds. Proteomics. 2009;9:3796–3801. doi: 10.1002/pmic.200900096. [DOI] [PubMed] [Google Scholar]
- [117].Chantret I, Kodali VP, Lahmouich C, Harvey DJ, Moore SEH. Endoplasmic reticulum-associated degradation (ERAD) and free oligosaccharide generation in. Saccharomyces cerevisiae. J. Biol. Chem. 2011;286:41786–41800. doi: 10.1074/jbc.M111.251371. [DOI] [PMC free article] [PubMed] [Google Scholar]


