Significance
We present a transcription-factor–centric computational method that utilizes data on natural variation in mRNA abundance to identify genetic loci that influence the responsiveness of genes to variation in the activities of their regulators. We call these connectivity quantitative trait loci, or cQTLs. When testing our method in yeast, we identified a polymorphism that modulates the mating response and confirmed our prediction experimentally. Our approach provides a sophisticated and nuanced approach to understanding the influence of genetic variation on interactions within regulatory networks. Applying our approach to human data may improve our understanding of the impact of genetic variation in contributing to phenotypic differences among individuals.
Keywords: transcription factors, cofactor interactions, genetic variation in gene expression, quantitative trait locus mapping
Abstract
Regulation of gene expression by transcription factors (TFs) is highly dependent on genetic background and interactions with cofactors. Identifying specific context factors is a major challenge that requires new approaches. Here we show that exploiting natural variation is a potent strategy for probing functional interactions within gene regulatory networks. We developed an algorithm to identify genetic polymorphisms that modulate the regulatory connectivity between specific transcription factors and their target genes in vivo. As a proof of principle, we mapped connectivity quantitative trait loci (cQTLs) using parallel genotype and gene expression data for segregants from a cross between two strains of the yeast Saccharomyces cerevisiae. We identified a nonsynonymous mutation in the DIG2 gene as a cQTL for the transcription factor Ste12p and confirmed this prediction empirically. We also identified three polymorphisms in TAF13 as putative modulators of regulation by Gcn4p. Our method has potential for revealing how genetic differences among individuals influence gene regulatory networks in any organism for which gene expression and genotype data are available along with information on binding preferences for transcription factors.
The ability to predict the phenotype of an organism from its genotype is a long-term goal of biology. The increasing availability of high-throughput genomic data and systems biology-based approaches is bringing this closer to reality. Linkage or association analyses have been used to map quantitative trait loci (QTLs) that explain phenotypic variation in terms of genetic polymorphism. However, detectable QTLs typically only account for a small fraction of heritable trait variation. Even when most of the additive contribution to the heritability can be explained in terms of QTLs, as is the case for yeast, most of the contribution from gene–gene interactions remains unexplained (1). Consequently, there has been a growing appreciation for the importance of interactions among genetic loci. For instance, a gene deletion study comparing two yeast strains that differ by 3–5%, similar to the difference between unrelated human individuals, identified subsets of genes that were essential in one strain background but not the other (2). This study exemplifies one of the computational challenges that will have to be addressed before phenotype can reliably be predicted from genotype.
The identification of modifier genes contributing to phenotype is difficult, because individual contributions are usually too weak to be detected. Considering genome-wide mRNA abundance along with information on genotypic variation represents the combined effect of the latter on the regulatory state of the cell (3–7) and can yield better prediction of phenotype (8, 9), the combined effect of allelic variation on transcript abundance (8, 10), the effect of genetic variation on transcription factor activity (11, 12), or transcript stability (13). However, there are few methods that systematically identify the effect of genetic modifiers on the strength of the connection (“connectivity”) between a transcription factor and its target genes (14–16).
At the simplest level, regulation of gene expression is characterized by binding of a transcription factor (TF) to a promoter and the concomitant activation or repression of the target gene. Variation in responsiveness of a target gene to a regulator, either due to genetic variation or due to a change in the environment, can affect its expression and the resulting cellular phenotype. One possible strategy for tuning gene-specific responsiveness is modulation of TF–target connectivity by specific cofactors. The interaction between a TF and cofactor can take a number of different forms. It may require a specific cofactor(s) to tether effectively to the promoter of a target gene; for example, Met4p is recruited to the promoters of genes involved in sulfur metabolism via interaction with Cbf1p and several other DNA-binding proteins (17–23). Cofactors may also influence TF-dependent recruitment of the transcription machinery to the transcription start site; for example, multiprotein bridging factor 1 (Mbf1p) enhances Gcn4p-dependent transcriptional activation by simultaneously binding the DNA-binding domain of general control nonderepressible 4 (Gcn4p) and a subunit of RNA polymerase II complex (24), or a cofactor may prevent a TF from binding to the promoters of its targets. In nutrient-rich conditions in the absence of mating pheromone, the activator of the mating response, Ste12p, is bound by a down-regulator of invasive growth protein (Dig2p), which inhibits binding of Ste12p to the promoters of its target genes (25, 26). In the presence of pheromone, Dig2p is phosphorylated and dissociates from Ste12p, allowing Ste12p to activate transcription of the mating genes (26).
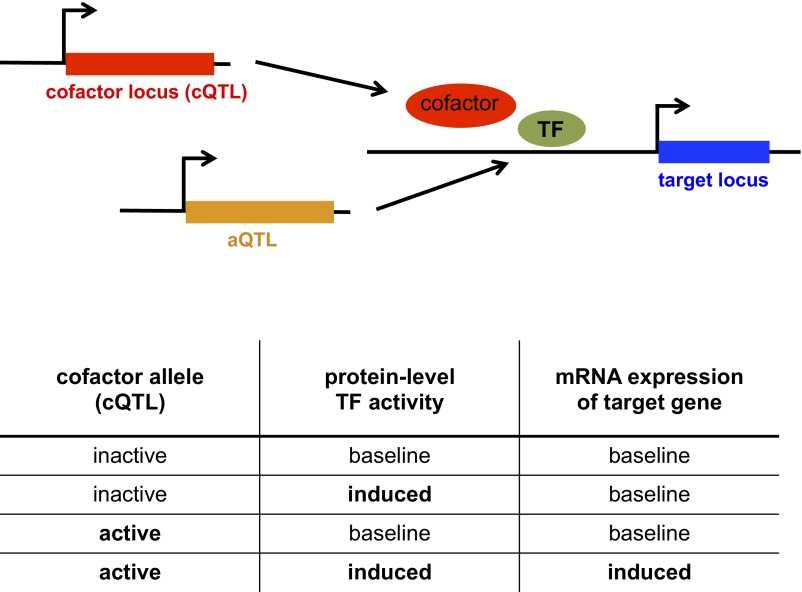
In all of the above cases, the magnitude and/or kinetics of the change in transcription rate promoted by a TF may be affected by natural variation in the amino acid sequence or protein level of a cofactor. In this work, we explore the effect of genetic variation at trans-acting loci on the regulatory interaction between a TF and its targets. This is illustrated in Fig. 1, where allelic variation of a cofactor modulates the efficiency of interaction between a TF and the promoter to which it binds. Many studies rely on knowledge of TF–target interactions to decipher the transcriptional network (27–30). However, few algorithms are able to identify modulators of TF–target connectivity at a network level (14–16). These typically derive information from statistical relationships across conditions between the mRNA abundance of gene triplets: the TF of interest, a candidate modulator, and a target of the TF. However, regulation of TF activity and interaction with cofactors often occurs at the protein level. A complementary approach is therefore needed.
Fig. 1.
Definition of a cQTL. A cofactor is required for efficient transcription of a target gene by a TF. Polymorphism within the coding sequence of the cofactor gene or its promoter can change the expression or activity of the cofactor, which can influence the interaction between the cofactor and the TF and consequently the expression of the target gene. Thus, the “connectivity” between the TF and its target gene is influenced by the allelic identity at the cQTL. Variation in the activity of the TF is due to genetic variation at one or multiple trans-acting loci (aQTLs). The SNP within the cofactor gene is identified as a cQTL for the TF. The table shows how the variables are related.
Our method identifies genetic loci whose allelic variation modulates the regulatory connectivity between a transcription factor and its target genes in vivo. We call such loci connectivity quantitative trait loci, or cQTLs. cQTLs are distinct from expression QTLs, for which expression (at the level of mRNA or protein) is linked to a chromosomal locus or loci and considered a heritable trait (3, 31), and activity QTLs (aQTLs), for which the (inferred) activity of a TF- or RNA-binding protein is mapped as a heritable trait (11, 13).
We applied our approach to data from a genetic cross between two different yeast strains (6). These data comprise genotype and gene expression data for >100 segregants. We systematically screened for connectivity for each of >100 TFs for which the DNA binding specificity has been characterized (32). Building on earlier work (11), our method exploits prior knowledge about the binding preferences of the TFs to estimate variation in the differential activity levels of the TFs. This variation is due to the combined natural allelic differences. The profile of differential TF activity across genetic backgrounds contains valuable regulatory information (33), which we exploit to estimate the susceptibility (i.e., responsiveness) of each gene to variation in the differential regulatory activity of a particular TF. We subsequently treat the average difference in susceptibility between genetic backgrounds containing each allele for a given locus as a quantitative trait and aggregate these differences over the targets of the TF to construct a (χ2) statistic that can be used to map cQTLs. Application of our algorithm to yeast data uncovered a cQTL modulating the pheromone-induced mating response, which we confirmed experimentally, as well as a cQTL modulating amino acid biosynthesis.
Results
The goal of our analysis is to detect genetic loci that modulate the strength of the functional connection between a TF and the expression of its target genes. We used genome-wide mRNA expression data for 108 segregants resulting from a genetic cross between two yeast strains: a laboratory strain (BY4716) and a wild strain from a vineyard in California (RM11-1a) (10). We also used a genotype map that specifies the parental allele (BY or RM) inherited at each of 2,956 chromosomal loci for each segregant (3).
Inferring Segregant-Specific TF Activity.
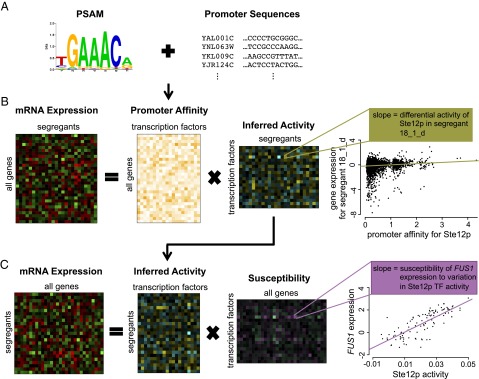
The first step in our algorithm—estimating the susceptibility of each transcript to changes in the protein-level activity of a given TF—is illustrated in Fig. 2. We quantify how the protein-level regulatory activity of each TF varies across the strains, which requires prior knowledge about cis-regulatory elements in the promoter regions of genes (Fig. 2A). To this end, we used a compendium of weight matrices representing binding preferences for 123 TFs (32) and calculated the aggregated affinity score for the 600-bp window upstream of each gene. Fig. 2B depicts how we inferred segregant-specific TF activities by performing (multiple) linear regression of the differential mRNA expression level for each segregant (the dependent variable) on the predicted in vitro segregant-specific binding affinities for a particular TF (the independent variable). Each data point corresponds to a different gene. The regression coefficient (slope) for each TF represents its segregant-specific differential activity. The genetic variation in regulatory activity is driven by trans-acting polymorphisms at one or more loci. In a previous study (11), we introduced the concept of identifying such loci as aQTLs. In the present study, we investigate a more subtle form of genetic modulation of the regulatory network. This time, our aim is to identify cQTLs that alter the responsiveness (or susceptibility) of target genes to variation in the activity of a particular TF.
Fig. 2.
Method for inferring TF activities and regulatory susceptibilities. (A) We use binding preferences in the form of a PSAM for 123 yeast TFs as prior information to calculate aggregated affinity scores on the promoter region for every gene. (B) TF activities are inferred by performing regression of the genome-wide expression data for each segregant on the aggregated affinity scores (11). The affinity matrix is unique for each segregant and depends on the genotype. The expression data contains differential mRNA expression (log2) ratios relative to a pool of parental strains. The slope in the scatter plot reflects the inferred (differential) protein activity level. Here each point represents a different gene. The x axis represents promoter affinity for the transcription factor Ste12p, and the y axis represents differential expression in segregant 18_1_d. (C) We estimate gene-specific susceptibilities by regressing their mRNA expression level on TF activities across segregants. In this case, the slope in the scatter plot corresponds to the susceptibility of the expression of FUS1 to variation in Ste12p activity. Each point now represents a different segregant. Note that the in vitro promoter affinity score of a gene is calculated based on the underlying genomic sequence. The in vivo susceptibility, by contrast, contains functional regulatory information and is based on the gene’s mRNA expression profile across segregants.
Inferring Gene-Specific Susceptibility to TF Activity Variation.
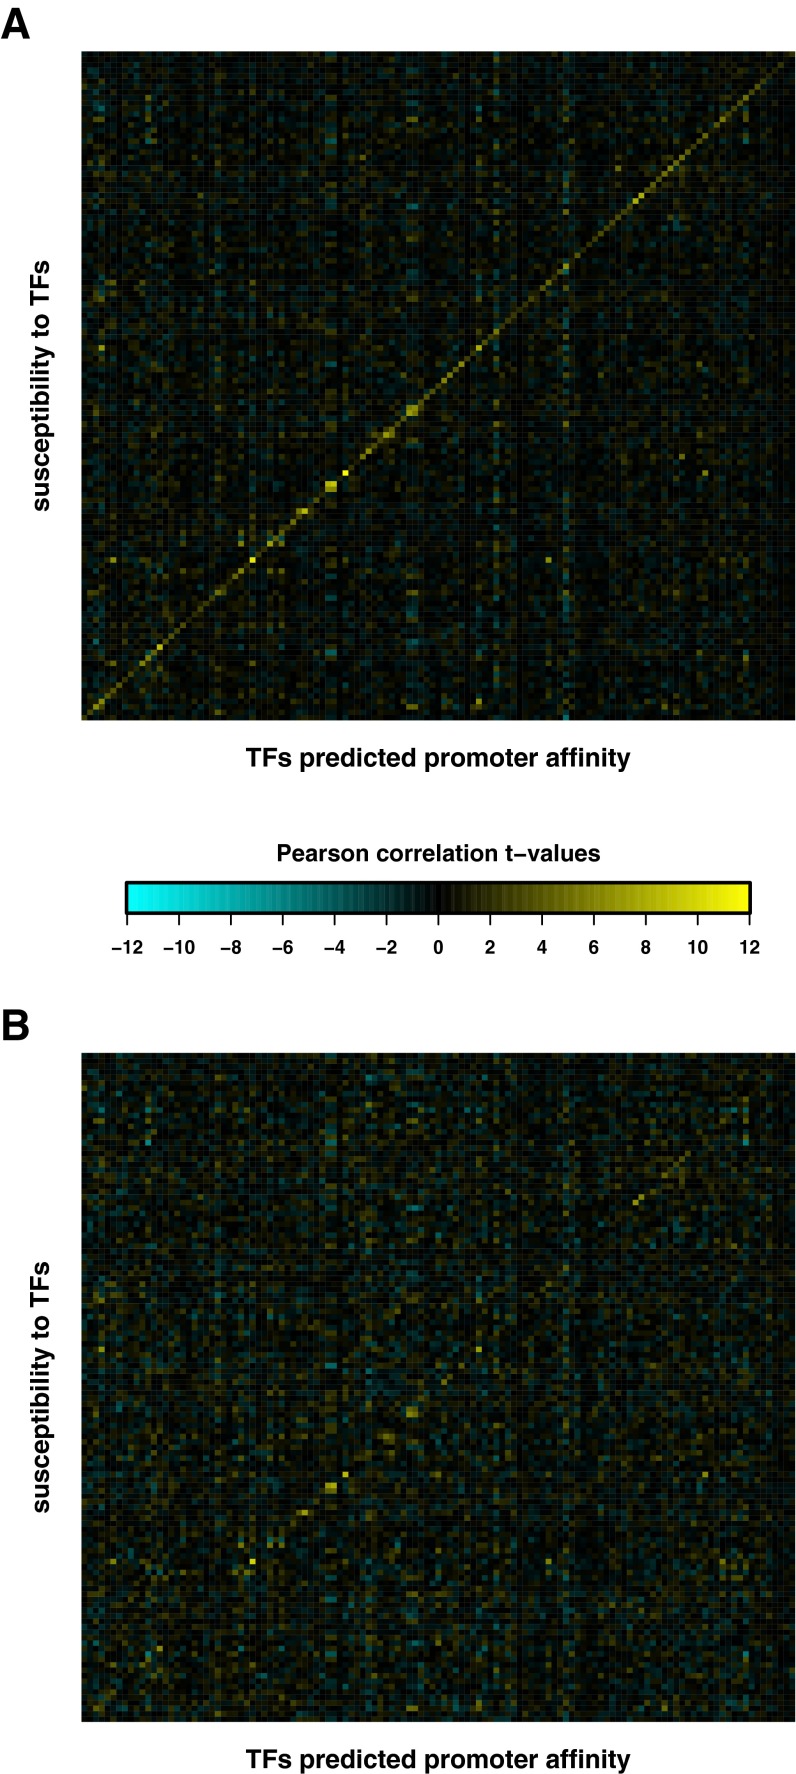
To quantify the relationship between the transcript abundance of a gene and the activity of a particular TF we perform linear regression. However, here each data point corresponds to a segregant rather than a gene. Another difference is that the dependent variable is now differential mRNA expression, and the independent variable is segregant-specific differential TF activity (Fig. 2C). The regression coefficient (slope) for each gene now corresponds to the susceptibility. When estimating TF activity, we avoid circularity by omitting the expression profile of the cognate gene (Materials and Methods and Fig. S1).
Fig. S1.
Resolving the circularity problem for susceptibility calculation. The heat maps summarize t values of the Pearson correlation between the susceptibility signatures and promoter affinity profiles for each of the 123 different TFs. For each segregant, first the differential TF activities were obtained by applying multiple regression of differential mRNA abundance of (A) all genes and (B) all genes but leaving out one gene (g) at a time on the TF affinity score profiles. Next, the susceptibilities of each gene (g) were obtained by applying multiple regression of the differential mRNA abundance of g on the TF activities from A and B, separately. In B the TFs with significant t values on the diagonal correspond to the 12 TFs that pass the TF selection step for multiple regression (Results and Materials and Methods).
Identifying TFs for Which Regulatory Susceptibility Correlates with Promoter Affinity.
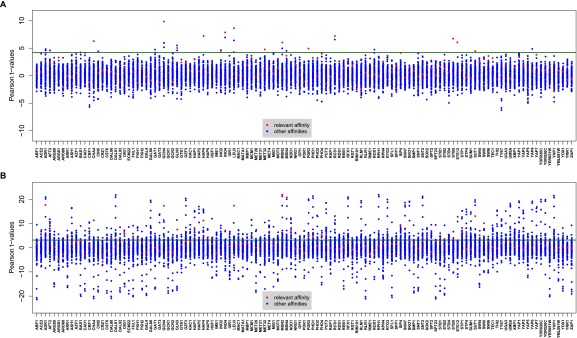
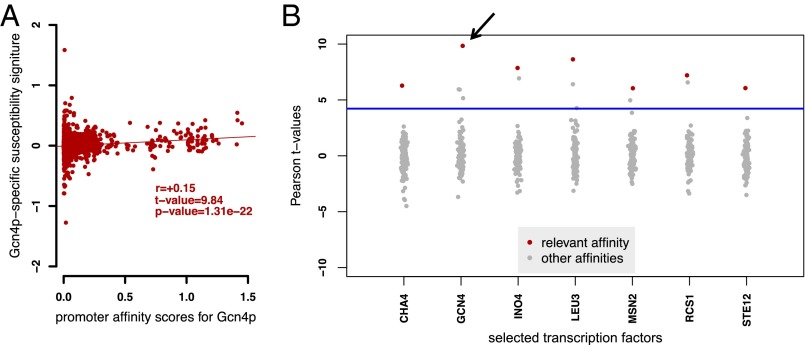
For our analyses, we focused on the TFs whose functional connectivity (i.e., the susceptibility of each gene to variation in TF activity) is significantly correlated with the promoter affinity of their targets as predicted from the DNA sequence. Only if this condition is met are the data likely to contain sufficient information to permit identification of one or more cQTLs. We selected TFs that meet this condition based on the significance and rank of the correlation between their genome-wide susceptibility and promoter affinity signatures (Materials and Methods). We computed the correlation between the promoter affinity profile and the susceptibility signature for each possible pair of TFs. Fig. S2A shows the detailed results for 123 TFs, where the susceptibilities were obtained by performing multiple regression of the expression levels on the activity of all TFs. A TF was selected for further study if its susceptibility signature correlated more strongly with the promoter affinity scores calculated using its own position-specific affinity matrix (PSAM) (Materials and Methods) than with those calculated from the PSAMs of the other 122 TFs. This indicates that the regulation is likely to be specific for the TF. This correlation was significant for 12 TFs (Fig. S2A). Fig. 3A shows a representative scatter plot of susceptibility vs. promoter affinity for one of these factors, Gcn4p. We also estimated susceptibilities using univariate regression, which is less computationally intensive. The correlation of these alternative susceptibilities with the promoter affinities is shown in Fig. S2B. For TFs that also pass this alternative selection criterion, it is reasonable to believe that the correlation between the susceptibility and promoter affinity signatures is not due to overfitting, and that the susceptibility to each particular TF is independent of transcriptional regulation by other TFs. Seven TFs—Cha4p, Gcn4p, Ino4p, Leu3p, Msn2p, Rcs1p, and Ste12p—passed both selection criteria and were therefore deemed robust candidates for further analysis (Fig. 3B).
Fig. S2.
Correlation between TF susceptibility signatures and promoter affinity profiles (TF acceptance criteria). The susceptibilities were derived using (A) multiple regression and (B) univariate regression of gene expression on TF activities. The x axes in both panels represent the TF for which the susceptibility signature was calculated. For each TF, the t value of the correlation of its susceptibility signature to promoter affinity profile obtained from its PSAM (relevant affinity) is pointed out with red dot and to the rest of 122 TFs affinity profile with blue dots. We accepted the TFs whose susceptibility signature (i) correlated significantly to their affinity profile (red dots for each column) and (ii) this correlation corresponded to the highest Pearson t value (i.e., the red dot stands out from the rest of blue dots for each column). The dark green line represents the significant t-value threshold at a 1% FDR level. In the case of Msn2p, the correlation was most strongly to Msn4p affinity. However, Msn2p and Msn4p are known to be involved in stress response activation by binding to promoter genes containing a stress response element and can partially compensate for each other’s function (64, 65). Therefore, we accepted Msn2p in the selection step.
Fig. 3.
Procedure for selecting transcription factors for further analysis. (A) Scatterplot of susceptibility signature vs. promoter affinity scores for Gcn4p. (B) Pearson correlation (t value) between the susceptibility signature of the seven selected TFs and the promoter affinity scores of all 123 TFs. A red dot denotes the same TF and a gray dot other TFs. The arrow points to the t value of the correlation depicted in A. We accepted the TFs whose susceptibility was most strongly correlated to promoter affinity computed using the PSAM for the same TF. The blue line represents a 1% FDR threshold (t = 4.22, P = 3.9 × 10⁻⁶). Susceptibilities were obtained by performing multiple regression of the mRNA expression level of each gene on the activities of all TFs.
Validation of Susceptibility Signatures Using TF Overexpression Data and Gene Ontology Categories.
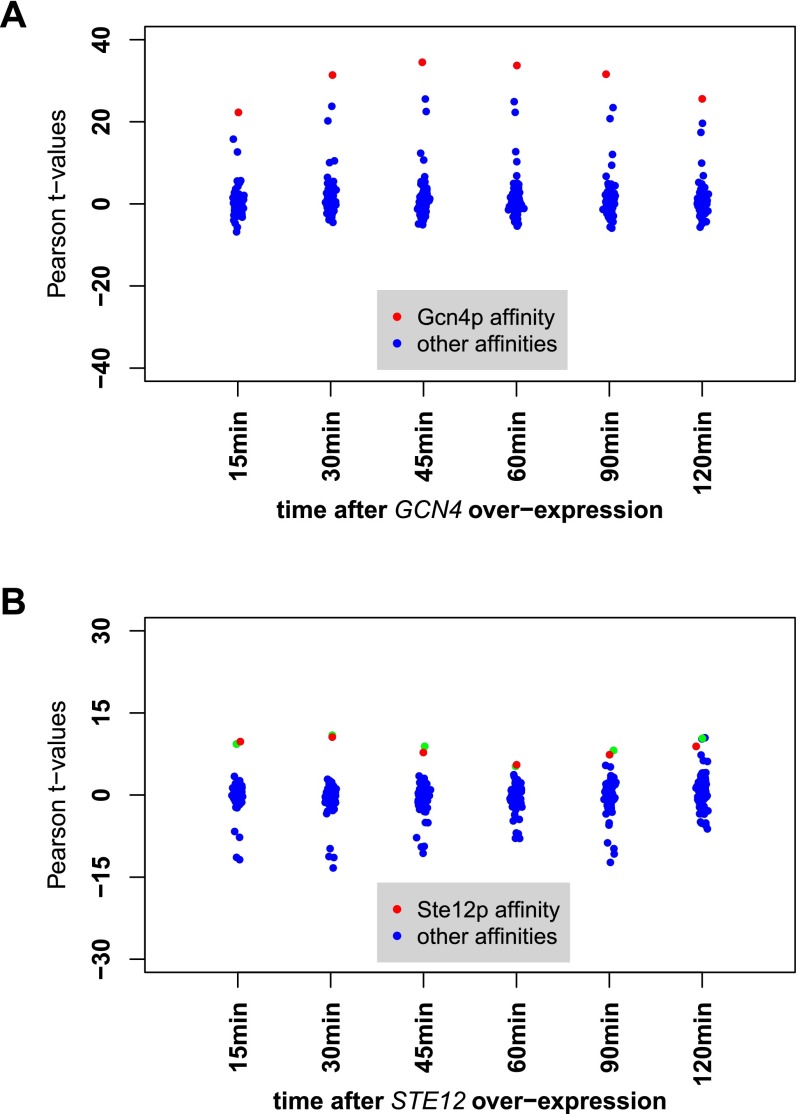
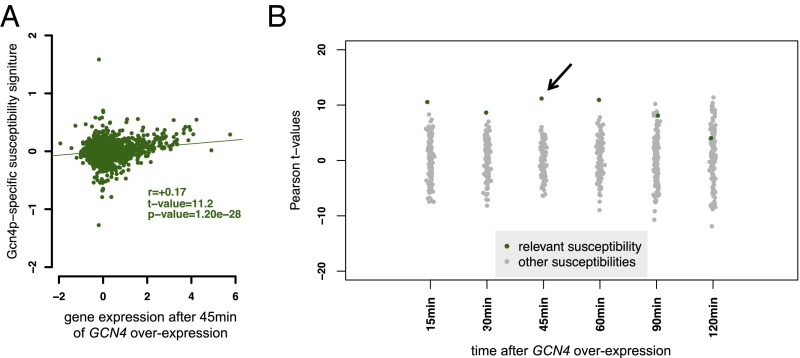
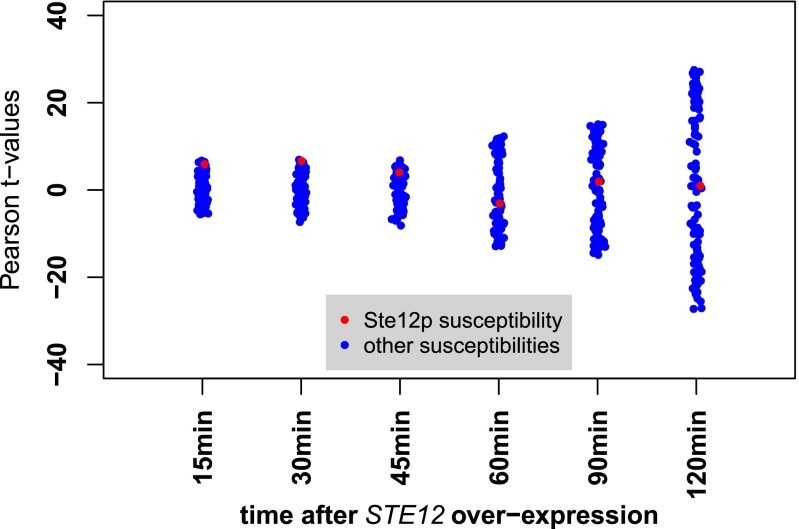
To further assess the quality of the susceptibility signature derived for Gcn4p, we took genome-wide data on mRNA abundance obtained over a time course after synthetic induction of the TF (34). For Ste12p, we used mRNA expression data generated from cells treated with α-pheromone (35). As a positive control, we first confirmed that the expression responses to GCN4 and STE12 induction were highly correlated with the promoter affinity scores for Gcn4p and Ste12p, respectively (Fig. S3). This indicates that the affinity scores contain sufficient information to elucidate the function of the TF. Next, we considered the relationship between the overexpression data and the susceptibility signatures. A high level of correlation between the two suggests that the inferred susceptibilities, derived from the segregant expression data, capture the functional response of genes to variation in the activity of the TF. Fig. 4A shows significant correlation between the genome-wide response to GCN4 overexpression measured 45 min postinduction. The correlation between the susceptibility signature for each of the 123 TFs and GCN4 overexpression data at different time points is summarized in Fig. 4B. The correlation improves with time, consistent with the delay between activation, expression of the Gcn4 protein, and the expression of Gcn4p targets. Susceptibilities, in contrast, were inferred from a steady-state condition and therefore reflect both direct and indirect targets. A plot showing correlation between the response to Ste12p induction over time and inferred susceptibilities associated with each of the 123 TFs is presented in Fig. S4. In the case of Ste12p, the correlation rapidly decreased after 30 min in the presence of pheromone, consistent with known negative feedback due to pheromone-induced degradation of Ste12p (36). For both TFs, significant correlation with the susceptibility signature is seen over a portion of the overexpression time course. We conclude that the susceptibilities we calculated capture the functional connectivity between Gcn4p and Ste12p and their target genes.
Fig. S3.
Correlation between expression response after overexpression of GCN4 and STE12 and promoter affinity. The x axes represent the overexpression data at different time points. Each point corresponds to the Pearson t value of the correlation between the affinity profile of a particular TF and the genome-wide differential mRNA abundance for the overexpression of GCN4 (A) and STE12 (B). The t values of the correlation between the affinity profile to Gcn4p, and Ste12p are indicated in red in each relevant panel. Affinity profiles of these two TFs are exclusively correlated with the overexpression data. The green dots in B correspond to Dig1p, a known cofactor of Ste12p (21). These results demonstrate that the in vitro occupancies correlate significantly to the in vivo function of Gcn4p and Ste12p.
Fig. 4.
Validation of susceptibility signature of Gcn4p. (A) Scatterplot of the susceptibility signature for Gcn4p vs. the genome-wide response to GCN4 overexpression after 45-min induction. (B) Correlation across a time series of GCN4 overexpression data. Each point represents the correlation of transcript abundance with the susceptibility signature of each of the 123 TFs. Here the black arrow indicates the t value of correlation displayed in A. See Fig. S4 for a similar plot for Ste12p.
Fig. S4.
Correlation between expression response to STE12 overexpression and regulatory susceptibility. The x axis represents the overexpression data at different time points. Each point corresponds to the Pearson t value of the correlation between the susceptibility signature for a particular TF and the differential mRNA abundance in the overexpression experiment. The t values of the correlation to susceptibility signature for Ste12p are indicated in red in each time point column. For Ste12p, the correlation is not significant from the 30-min time point onwards (Results).
We also validated our susceptibility signatures using Gene Ontology (GO) categories (37). This was to test whether the susceptibility signatures are associated with the known biological function or molecular structure role for the seven selected TFs. We used the Wilcoxon–Mann–Whitney test to score GO associations with the susceptibility signature for TFs (Materials and Methods). The results of GO enrichment analysis for the seven selected TFs are shown in Dataset S1. For the Gcn4p signature, there is significant association with “amino acid biosynthetic process” (P = 3.6 × 10⁻¹¹) and for Ste12p with “site of polarized growth” (P = 1.7 × 10⁻¹⁰) and “reproductive process” (P = 1.5 × 10⁻⁵). These results fit with the known activities of the TFs because Gcn4p activates genes involved in amino acid biosynthesis in response to amino acid starvation (38) and Ste12p is the activator of mating response pathway (39). Our findings are thus consistent with the functional and biological annotations expected for these TFs.
Mapping cQTLs.
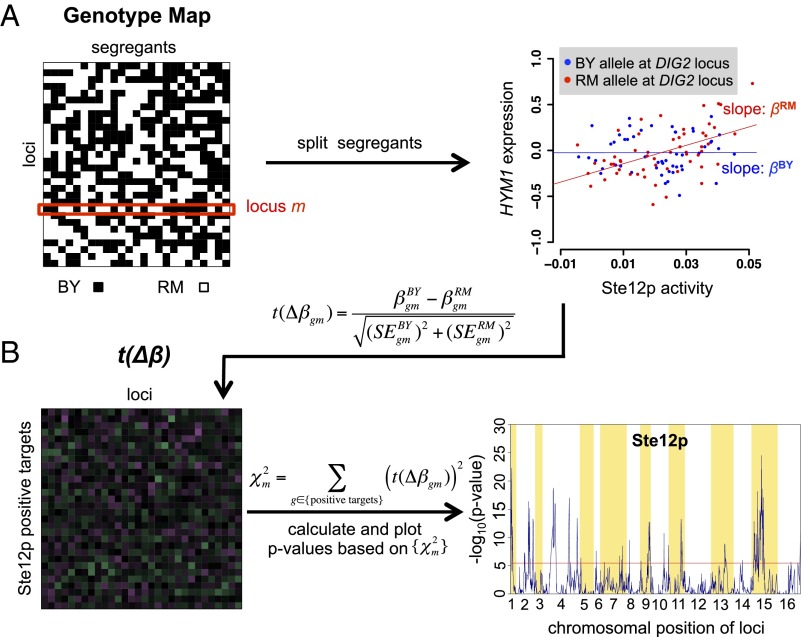
The second step in our method is illustrated in Fig. 5. To test whether a polymorphic locus is a cQTL for a particular TF, the segregants are first split into two subsets based on the allele (BY or RM) inherited at each locus. For every gene we perform univariate regression of mRNA abundance on the activity of the TF within each subset (Fig. 5A). The regression coefficients (slopes) are susceptibilities that quantify the extent to which each gene responds to variation in TF activity with each allele. For each gene, we assess the statistical significance of the difference in susceptibility between the two subsets, by computing a t value t(Δβ) = Δβ/SE(Δβ), where SE(Δβ) denotes the SE of the difference of the slopes Δβ = βBY − βRM (Fig. 5B). Finally, we aggregate evidence over genes by constructing a χ2 statistic equal to the sum of the squares of these t values. The known null distribution of χ2 is used to compute a P value that quantifies statistical significance. Where this P value is small enough, we conclude that the locus globally acts as a cQTL for the TF (Fig. 5B). Using all genes in the genome to obtain the χ2 statistic may reduce the statistical power to detect cQTLs when a large number of nonsusceptible genes are included. We therefore considered an alternative χ2 statistic based on only the positive targets of the TF of interest (i.e., genes that are induced when TF activity is high; see Materials and Methods for details) and found that it performed better.
Fig. 5.
Overview of our method for identifying cQTLs. (A) For each TF, we calculate allele-specific susceptibility by first splitting the segregants based on the parental allele (BY or RM) inherited at locus m. Next, susceptibilities, βBY and βRM, are obtained for each segregant subset independently by performing univariate regression of the differential mRNA abundance of each gene, g, on the activity of each TF. mRNA abundance is measured relative to a mixed pool derived from the parental strains (6). The scatterplot shows how HYM1 mRNA abundance (y axis) responds to Ste12p activity (x axis) and how this responsiveness differs between segregants that have inherited the BY and RM allele, respectively, at the DIG2 locus. To avoid circularity, Ste12 activity was inferred using all genes except HYM1. (B) Using allele-specific susceptibility data, we construct a matrix in which each element contains a t statistic corresponding to the susceptibility difference between βBY and βRM for each gene/locus combination. The last step involves calculating a χ2 statistic for each locus by summing the squared t values for all positive targets of Ste12p and converting it to a P value based on the standard null distribution of the χ2 distribution (the larger χ2, the smaller the P value). Loci that reach statistical significance after correcting for multiple testing (red line) are classified as cQTLs.
Linkage disequilibrium reduces the precision with which the location of the cQTL can be determined. To select a nonredundant set of representative markers, we performed forward selection of distinct multilocus cQTL “regions” that independently influence the susceptibility signature. Briefly, we removed the effect of the previously selected markers from the t(Δβ) signature using linear regression and used the residuals in the next iteration (see Materials and Methods for details). To reveal potential underlying molecular mechanisms, we looked for genes in each cQTL region whose protein product physically interacts with the TFs based on protein–protein interaction data (Materials and Methods). As described below, this process predicted modulatory polymorphisms in TAF13 and DIG2, which encode cofactors of the transcription factors Gcn4p and Ste12p, respectively.
Searching for Genetic Modulators of Gcn4p-Mediated Amino Acid Biosynthesis.
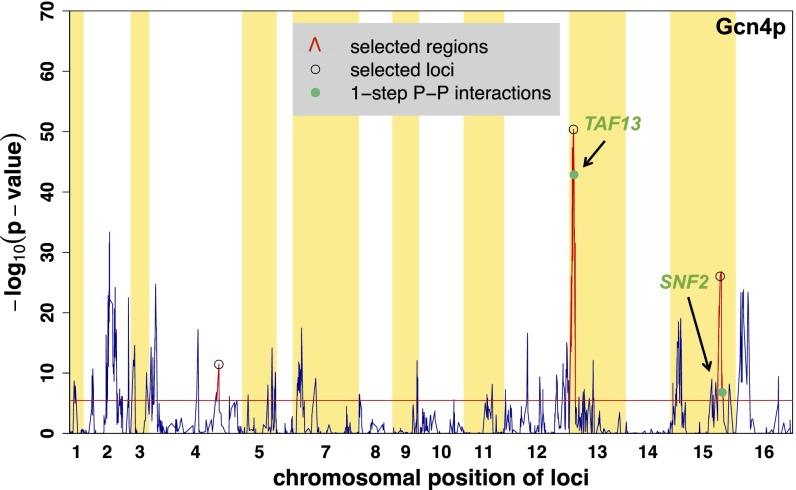
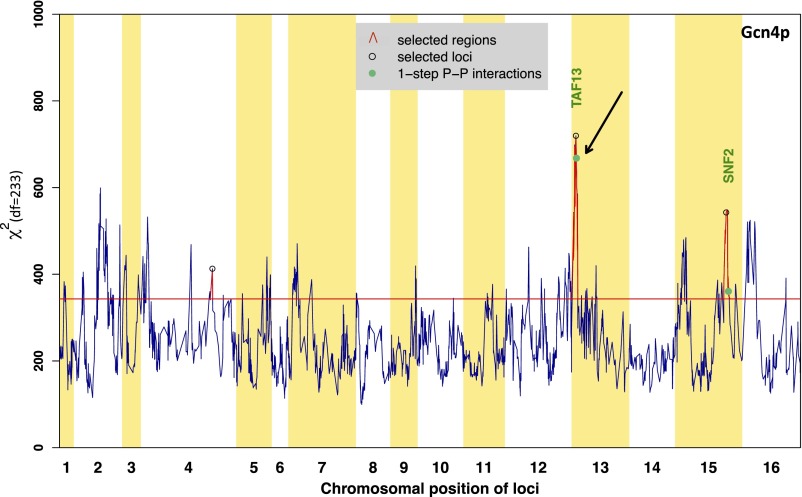
The cQTL profile for Gcn4p, based on its positive regulatory targets, is shown in Fig. 6 and Fig. S5. We accounted for parallel testing of all markers by requiring the Bonferroni-corrected P value to be <0.01 (equivalent to a raw P = 3.4 × 10⁻⁶ and χ2 statistic = 332.4). The most statistically significant cQTL region is located on chromosome XIII and encompasses 59 genes, including TAF13 (Fig. 6). Taf13p, a TATA binding protein-associated factor, is a subunit of TFIID that interacts with Gcn4p in vivo (40). We identified three nonsynonymous SNPs within the coding region of TAF13 between RM and S288c, a strain similar to BY: A137G, A138V, and G158A. According to the BioGRID database (thebiogrid.org/), a total of 55 proteins have direct physical interaction with Gcn4p. Therefore, the probability of finding one protein–protein interaction for this cQTL region by chance is <0.1 (hypergeometric distribution). Together, these observations suggest that polymorphism in Taf13p may affect the efficiency of transcription initiation by Gcn4p. We also identified a region on chromosome XV that contains 67 genes including SNF2. This gene encodes the catalytic subunit of the SWI/SNF chromatin remodeling complex (41, 42) and interacts physically with Gcn4p (40, 43, 44). There are nine amino acid polymorphisms in Snf2p between the RM and S288c strains. Neither the TAF13 nor the SNF2 locus was detected as an aQTL (11) for Gcn4p, so the polymorphisms in these cQTL regions modulate the responsiveness to variation in the activity of the Gcn4p transcription factor protein, as opposed to affecting Gcn4p activity directly (Table S1).
Fig. 6.
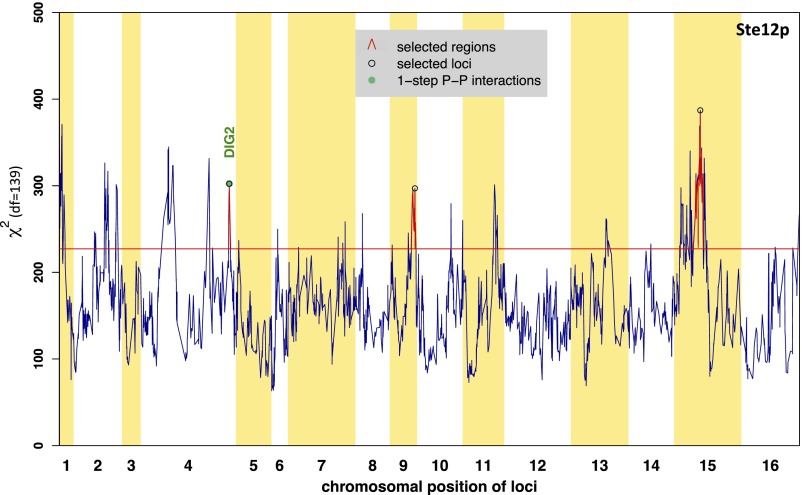
cQTL detection for Gcn4p. cQTL analysis was performed using positive targets of Gcn4p (233 genes). We performed forward selection to detect peaks with a Bonferroni-corrected P value <0.01. These loci are marked with black circles, and statistically significant regions around each selected locus are shown in red. Green dots indicate the location of genes within the significant cQTL regions encoding a protein that has a direct physical interaction with Gcn4p (indicated in the legends as 1-step P–P interaction). The horizontal red line represents the P value threshold at 1% level with Bonferroni correction (raw P = 3.4 × 10⁻⁶). We were able to detect loci containing TAF13 and SNF2 (marked with black arrows).
Fig. S5.
χ2 statistic profile obtained for Gcn4p. The analysis was performed using positive targets of Gcn4p (233 genes). We performed forward selection to detect peaks at a Bonferroni-corrected P value <0.01. The selected loci are marked with black circles. Green dots indicate the location of genes within the significant cQTL regions whose encoded protein has a direct physical interaction with Gcn4p. The horizontal red line represents the χ2 statistic significant threshold at 1% level with Bonferroni correction. The black arrow indicates the TAF13 locus.
Table S1.
Comparison of identified significant cQTL and aQTL for Gcn4p and Ste12p
| TF | cQTL (this study) | aQTL (11) |
| Gcn4p | Chr4: 1,109,730–1,149,760 | Chr2: 603,791–636,331 |
| Chr13: 27,644–99,584 | ||
| Chr16: 779,975–880,782 | ||
| Ste12p | Chr4: 1,407,834–1,441,485 | Chr8: 95,470–128,731 |
| Chr9: 341,217–419,417 | ||
| Chr15: 301,078–469,462 |
DIG2 Is a Genetic Modulator of the Ste12p-Mediated Mating Response.
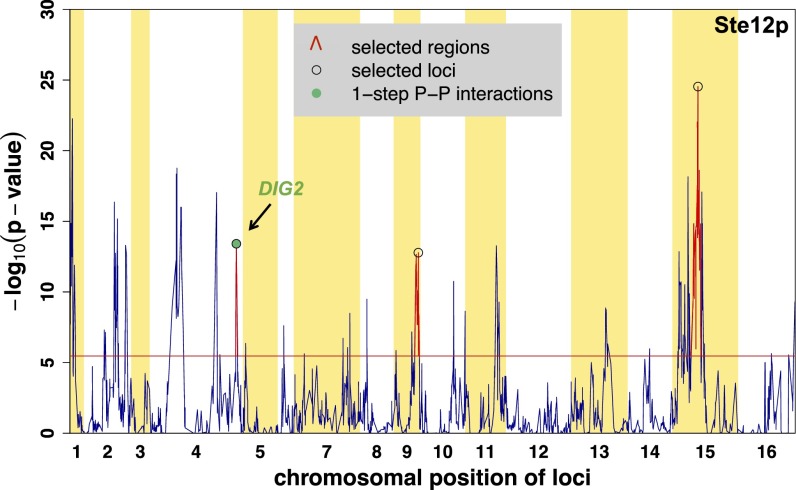
The cQTL profiles for Ste12p are presented in Fig. 7 and Fig. S6. Using again only the positive targets of Ste12p to construct the χ2 statistic, and requiring a Bonferroni-corrected P value <0.01 (raw P = 3.4 × 10⁻⁶ and χ2 statistic = 227.2), we identified three distinct cQTL regions on chromosomes IV, IX, and XV. The cQTL region on chromosome IV includes DIG2 (Fig. 7). This locus was not previously detected as an aQTL for Ste12p (11) (Table S1). Dig2p is a known inhibitor of Ste12p activity (25, 26, 45). We identified a single nonsynonymous polymorphism at amino acid position 83 that corresponds to isoleucine (I) in RM and threonine (T) in S288c. Upon induction by pheromone, two MAPKs, Kss1p and Fus3p, phosphorylate Dig2p and other target proteins on serine or threonine residues (46). The I83T polymorphism is located between a threonine and a serine and might therefore influence the interaction with either MAPKs at a posttranslational level.
Fig. 7.
Detection of Dig2p as a putative connectivity modulator for Ste12p. Significant cQTL regions were detected by using positive targets of Ste12p (139 genes). The locus closest to DIG2 was identified by performing forward selection (black arrow). There is a single polymorphism between the RM and S288c strains that corresponds to an isoleucine in RM and a threonine in S288c at position 83 within the Dig2p coding sequence. See Fig. 6 for annotation.
Fig. S6.
χ2 statistic profile obtained for Ste12p. Significant cQTL regions were detected using positive targets of Ste12p (139 genes). See Fig. S5 for annotation.
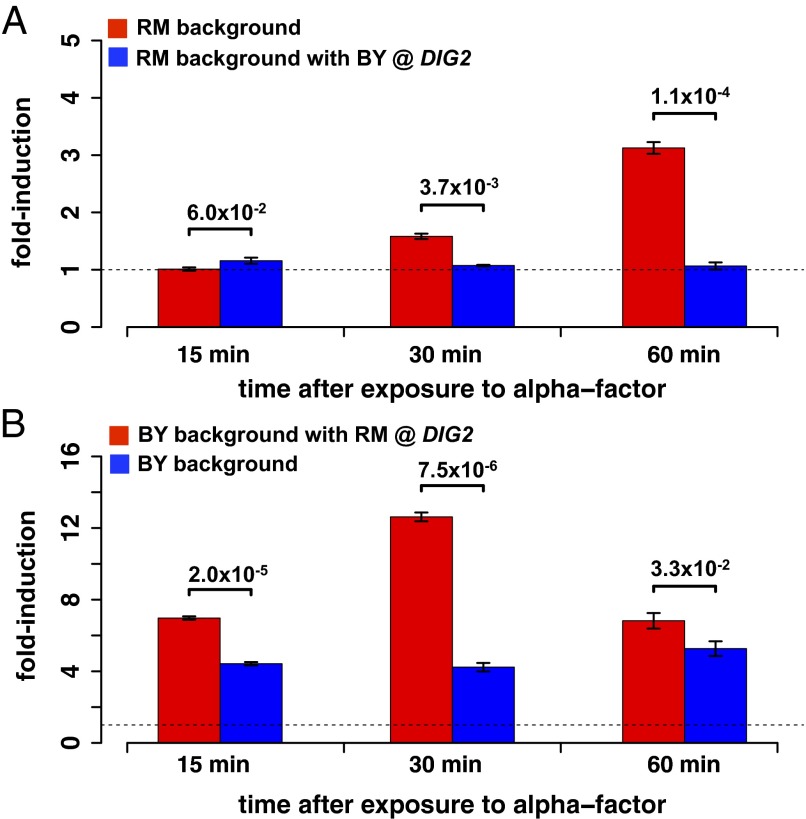
To experimentally test our prediction that variation in the amino acid sequence of Dig2p influences the strength of the Ste12p-mediated gene expression response to mating pheromone, we created allele replacement strains in which the DIG2 allele from RM was placed in a BY strain background, and vice versa. To capture the response from multiple targets of Ste12 we monitored the expression of a lacZ reporter gene, driven from an upstream promoter region containing three pheromone response elements (PREs). This sequence is found upstream of Ste12-activated genes. Ste12p activates lacZ expression through the PREs in response to the addition of the mating pheromone, alpha-factor. In the RM background (Fig. 8A), robust induction of the reporter in response to alpha-factor is seen, but this induction is absent when DIG2 is replaced by the BY allele (Table S2). In the BY background (Fig. 8B), a stronger and faster response to alpha-factor is seen. Again, the degree of induction is greater in the presence of the RM allele of DIG2. In summary, our validation experiments show that (i) variation in a single amino acid in Dig2p has a dramatic effect on the amplitude of the Ste12p-mediated mating response for both the BY and RM strain backgrounds and (ii) the response at 30 and 60 min postinduction is consistently stronger if the strain bears the RM allele of the cofactor Dig2p, as predicted by our algorithm (compare the red and blue regression lines in the right panel of Fig. 5A).
Fig. 8.
Validation of the prediction that DIG2 is a cQTL that modulates the activity of Ste12p. The transcriptional response to mating pheromone, in different genetic backgrounds, for a reporter driven by a promoter containing three PREs bound by Ste12p is shown. (A) In the RM background, activation of Ste12p by alpha-factor is robust, but when its DIG2 allele is replaced by that of BY the response is noticeably absent. (B) The BY strain shows a greater response, a fourfold induction that is steady across time. When the DIG2 allele from RM is substituted in BY, the degree of induction is even stronger. All P values were calculated using a two-sample t test on three replicates per strain.
Table S2.
Results from the β-galactosidase validation experiment
| Time | RM 1 | RM 2 | RM 3 | BY 1 | BY 2 | BY 3 | BY DIG2(RM)1 | BY DIG2(RM)2 | BY DIG2(RM)3 | RM DIG2(BY)1 | RM DIG2(RM)2 | RM DIG2(BY)3 |
| No alpha-factor | 642 | 719 | 861 | 3,707 | 3,673 | 3,546 | 1,855 | 1,757 | 1,834 | 716 | 771 | 789 |
| 0 min | 775 | 736 | 785 | 4,520 | 4,558 | 4,318 | 2,592 | 2,539 | 2,519 | 637 | 705 | 667 |
| 15 min | 756 | 777 | 786 | 20,132 | 19,500 | 19,571 | 17,690 | 17,767 | 17,864 | 792 | 776 | 751 |
| 30 min | 1,194 | 1,221 | 1,215 | 17,693 | 19,107 | 19,795 | 32,337 | 33,057 | 31,159 | 672 | 759 | 726 |
| 60 min | 2,293 | 2,373 | 2,506 | 21,096 | 24,116 | 25,185 | 15,863 | 18,007 | 18,264 | 739 | 693 | 701 |
Discussion
Many studies use gene expression data collected under steady-state conditions, or in response to external perturbations, to study regulatory networks. However, parallel gene expression and genotype data across many samples allows one to take advantage of the natural genetic variation of the regulatory network within a population. Most of the QTL mapping approaches focus on variation in expression of individual genes (3, 5, 47, 48), or cis-regulatory variation in the binding of transcription factors (12, 30, 49, 50). Although these studies have greatly improved our knowledge of gene regulation, the data can further be used to infer more complex regulatory structures, including detection of genetic loci that modulate transcriptional or posttranscriptional regulation. Among QTL studies, there are only a few that identify modulators of transcription factor activity and the effect on expression of their target genes (11, 13–16).
We have described an approach for identifying loci that modulate the connectivity of transcription factors and their target genes, which requires only information on gene expression, genotype, and TF binding preferences. Our method infers gene-specific susceptibilities, which capture the responsiveness of genes to variation in the activity of their cognate transcription factors. Treating these susceptibilities as quantitative traits, a χ2 statistic is calculated for every genetic marker to test the significance of the linkage. Using a single statistic for testing linkage associations has advantages because it reduces the multiple-testing problem, which is significant for conventional QTL mapping methods, due to the large number of trait/locus combinations. Our method does not require variation in the mRNA abundance of the cofactor gene among samples/segregants. It can, therefore, also detect polymorphisms that affect the interaction of the cofactor and TF posttranslationally.
As a proof of principle, we applied our method to data from a population of yeast segregants and detected putative modulators of TF–target connectivity for Gcn4p and Ste12p. In particular, we identified a locus on chromosome XIII containing TAF13 as cQTL for Gcn4p. Taf13p is a subunit of the TFIID complex that is involved in RNA polymerase II transcription (51). TFIID induces DNA bending that may facilitate interactions between regulatory factors and promoters of their targets (52). Considering that Taf13p and Gcn4p physically interact (40), polymorphism within TAF13 plausibly affects the efficiency of transcription of Gcn4p target genes. Mbf1p is a coactivator of Gcn4p-dependent transcription (24). However, we did not detect this locus on chromosome XV among the positive targets of Gcn4p, because there are no polymorphisms within the coding region or promoter of MBF1 or the UTRs of its mRNA between S288c and RM.
We also detected a cQTL on chromosome IV near DIG2 as putative modulator of the connectivity of Ste12p to its targets. Dig2p is a known inhibitor of Ste12p activity that acts in the absence of pheromone. However, the mechanism underlying this regulation is not clear. The nonsynonymous polymorphism residing in the coding sequence of DIG2 may have a role in inhibiting transcriptional activation by Ste12p and influence how target genes respond to Ste12p activity. We directly tested the effect of polymorphism at the DIG2 locus and found that it indeed modulates the Ste12-mediated transcriptional response to mating pheromone.
The DIG2 locus was not identified in a previous study that specifically examined the genetic basis of variation in Ste12p binding within a population of yeast segregants treated with pheromone (53). Instead two distinct trans-acting loci containing AMN1, a gene encoding an antagonist of mitotic exit network, and FLO8, encoding a transcription factor required for flocculation, were identified as likely modulators of Ste12p binding. Our method identifies a significant peak at the AMN1 locus on chromosome II; however, this region did not pass our forward selection criteria when searching for independent significant χ2 regions. We did not detect a significant peak near the FLO8 locus. The polymorphism composition between the wild parental strain in this study and YJM789, the wild strain used in ref. 53, is not identical, which may explain why FLO8 was not detected. S288c, a strain similar to BY, has a truncated version of FLO8 (54), which may affect the interaction between Flo8p and Ste12p. The same single amino acid polymorphism in Dig2p between S288c and RM is present in the parental strains used in the study that monitored variation in Ste12p binding (53). However, there are two synonymous SNPs within the coding regions of DIG2 between RM and YJM789: A474G and G693A. These could affect DIG2 expression and function between RM and YJM789.
In summary, our method detects novel loci that modulate the connectivity of Ste12p with its targets and adds a new layer of complexity toward understanding the regulatory network of the cell. Validation of linkage to TAF13 and SNF2 loci could also be pursued empirically using the allele replacement method.
Our algorithm is not designed for a specific organism and is applicable to any organisms for which gene expression and genotype data are available along with information on binding preferences for transcription factors. Many complex human diseases are influenced by genetic variation at trans-acting loci that affect the regulatory network within the cell. Because these approaches are based on the genotype of individuals, they could be used in developing models for precision medicine and in identifying more effective approaches to therapy.
Materials and Methods
Strain Construction.
Allele replacement was carried out using the diletto perfetto method (55) using the pGSKU-CORE plasmid. The RM1-11a (Mata, ura3Δ0, ho::KanMX) strain containing the BY version of the DIG2 allele (IMY295) was made using the same method, except that the KanMX cassette at the ho locus was first replaced with NatMX (13). Allelic replacement at DIG2 was confirmed by sequencing. Primers used for delitto perfetto were 5′-GCGTGCGTTTGTGTTGGAGTTGAAGAATATGGGTAGCATGGTACTGGTGGTTCGTACGCTGCAGGTCGAC-3′ (RevDIG2+PI KURA Side) and 5′-AGACCCACACAAGAGCAAATATCAACTGTTCAGGAAAATGATCCCAGGATAGGGATAACAGGGTAATCCCGCGTTGGC-3′ (DIG2+SceI+PII Gal1-1-SceI Side).
β-Galactosidase Assay.
Parental and allele-replacement strains were transformed with the plasmid pGA1706 (56) containing three copies of the PRE, which drives expression of the lacZ reporter. Measurement of fluorescein was carried out as previously described (57).
mRNA Expression and Genotype Datasets.
Genome-wide mRNA expression data included transcript abundance for two strains of yeast, a laboratory strain (BY4716) and a wild isolate from a vineyard in California (RM11-1a), and 108 segregants grown in glucose (6). For all analyses we used log2(sample/reference), where the reference data were generated using a mixture of equal amounts of the parental strains and genotype information at 2,956 markers (3).
Calculation of Promoter Affinity.
We used DNA binding specificity information for 124 transcription factors (32) in the form of position weight matrices (PWM). We excluded Hap3p whose PWM is identical to that of Hap5p. We used the convert2psam utility from the REDUCE Suite v2.0 software package (bussemakerlab.org/software/REDUCE) to convert each PWM to a position-specific affinity matrix (PSAM) (28, 58, 59). The genome of S288c differs from BY at only 39 bases (60), based on data from the Saccharomyces Genome Database (www.yeastgenome.org/). The genome of the RM strain was obtained from the Broad Institute website (www.broadinstitute.org/). We used the Bioperl interface for the BLAST software (61) to identify pairs of orthologous genes between BY and RM by aligning the coding sequences of the two strains. We used 600 bp upstream sequences of each orthologous pair to define BY- and RM-specific upstream promoter sequences (600 bp). Following ref. 11, we calculated aggregated promoter affinity scores (Κ) as follows:
Here, the index ϕ labels the TF, S represents the full promoter sequence of length Ls, w stands for the PSAM of length , and denotes the base identity at position within S. The aggregated affinity is defined as the sum of the relative affinities of a sliding window of length along the sequence S. We used the genotype map and the parental genome sequences to calculate the allele-specific promoter affinities for every gene within each segregant based on their inherited allele (11).
Inferring Protein-Level TF Activity.
Following the analysis in ref. 11, we estimated segregant-specific TF activities from mRNA expression levels and affinity scores based on the following linear model:
Here [ϕ]s and [ϕ]ref represent the nuclear concentration of free (unbound) protein ϕ in sample s and the reference pool, respectively. This equation assumes that the binding between protein ϕ and the promoter of gene g is proportional to the affinity score, which is true as long as the free protein concentration is below saturation (28). The first term on the right-hand side captures all trans-acting effects that cause differences in the activity level of the protein; cis-effects are captured by the second term on the right-hand side, which accounts for the differences in the nucleotide sequence of the preferred binding site on the promoter region of target gene g of protein ϕ. We can rewrite the equation below to solve for the activities and (11):
Here ygs is the log2-ratio of the mRNA levels of gene g between the sample and the reference pool. Because the reference pool is a mixture of equal amounts of parental strains, the term 〈〉ref is equal to the average of BY and RM promoter affinities.
Several of the TFs in the collection are involved in the same complex and have similar promoter affinity signatures. To address the potential problem of multicollinearity, we used ridge regression (62) to calculate and . Ridge regression minimizes the residual sum of squares and includes an L2 penalty term with parameter (λ) to estimate the parameters of the model. This yielded predictors that are slightly biased, but more precise (variances are smaller), than those obtained with the standard method. We chose the λ value that resulted in the smallest cross-validation error. We only used representing inferred activity levels for all subsequent analyses.
Calculation of Susceptibilities.
We used the mRNA expression data yg and the differential activity levels to infer the susceptibility () for each gene. This is a measure of connection or responsiveness of gene g to variation in the activity of protein ϕ, that is, it is the partial derivative of the abundance of the gene g transcript with respect to the activity level of protein ϕ, both of which depend implicitly on segregant genotype:
Because the explicit form of yg as a function of the activity is not known, we assume a linear relationship as a first-order approximation. Note that represents a protein-level activity. To calculate the susceptibilities, we used ridge regression of mRNA levels of gene g on the activity of protein ϕ across the segregants:
We used the same procedure for determining λ. The regression coefficients represent the inferred susceptibilities. To obtain the susceptibility of a particular gene to the variation in activity of a TF, the RNA abundance of g was regressed on TF activity. The latter was calculated using the mRNA abundances of all genes including the gene of interest. To avoid circularity the susceptibility of gene g to protein ϕ was obtained from activity levels that were calculated while excluding only the mRNA levels of that same gene. We refer to these activities as , where indicates the set of all genes except gene g. This step was necessary to avoid circularity in calculation of the susceptibilities (Fig. S1).
Selection Criteria for TFs Based on Inferred Susceptibilities.
Out of 123 TFs, we accepted only those for which their genome-wide susceptibility signature was highly correlated to their promoter affinity signature across all genes. For promoter affinities, we used the average affinity of BY and RM strains for each gene. We then calculated t values for the Pearson correlation between the susceptibilities and the promoter affinities. We accepted a TF only if this correlation had a higher t value with its own affinity than with that of all other TF and was significant at a false discovery rate (FDR) below 1%. This step was repeated by using univariate regression instead of ridge regression.
Validation of Susceptibilities.
To test susceptibilities for selected TFs, we used a time course of genome-wide mRNA levels after synthetic induction of GCN4 using a hormone-controlled artificial transcription factor (34). For Ste12p, we used the pheromone response pathway induction expression data (35). We also tested for association between the susceptibilities for each TF and GO categories with at least 10 genes belonging to each category using the Wilcoxon–Mann–Whitney rank-sum test. We controlled for multiple testing by requiring a 1% FDR. An iterative procedure was used to removing the effect of redundant nested GO categories (63).
Defining Positive Target Sets for the TFs.
We used the susceptibilities of the selected factors to define the set of positive target genes. For each combination of gene and TF, we obtained the P value for the corresponding univariate regression coefficient when calculating the susceptibilities. We considered a gene as a target by requiring significant P value at a 5% FDR level (64). Among the targets for each TF, we defined those with a positive regression coefficient as the positive targets.
cQTL Discovery.
We used a χ2 statistic and associated P value to test whether the susceptibilities to factor ϕ are significantly different when the segregants are split based on the allelic identity at locus m. For every gene g, we first performed ridge regression of ygs on all TF activities to obtain the regression coefficients, β. We calculated the t values of the difference of the susceptibilities, , for every gene at every locus using the equation below. SE stands for the SE of the slope. One possible approach to calculating the SE is to use bootstrapping. However, doing so is computationally intensive. Therefore, we used univariate regression to obtain the slopes and their SEs:
A χ2 statistic was computed for every locus m by squaring the t(Δβ)’s and summing over all genes:
Here Ng denotes the total number of positive targets of transcription factor ϕ. We performed forward selection to extract representative significant loci. At each iteration the effect of the previously selected markers was removed from the t(Δβ) signature and the residuals were used for the next iteration. We iterated until all residual χ2 values corresponded to a P value <0.01. To define the significant cQTL regions, we extended the region around each selected marker in each direction until hitting the significance threshold value.
Protein–Protein Interaction Data.
To identify putative causal genes, or quantitative trait genes, within a cQTL, we used the yeast protein–protein interaction dataset from the Biogrid website (thebiogrid.org/) as of April 2012. We only considered physical interactions between the TF and other proteins (i.e., not genetic interactions). These data were used to identify the genes within each cQTL region whose protein products physically interact with the TF of interest.
Supplementary Material
Acknowledgments
We thank members of the H.J.B. laboratory for useful discussions, Prof. Alexander Tzagoloff for the generous use of his laboratory space and resources, and Prof. Beverly Errede for the pGA1706 plasmid. This work was supported by NIH Grant R01HG003008 (to H.J.B.), a John Simon Guggenheim Foundation Fellowship (to H.J.B.), and NIH Training Grant T32GM082797 (to M.F.).
Footnotes
The authors declare no conflict of interest.
This article is a PNAS Direct Submission.
This article contains supporting information online at www.pnas.org/lookup/suppl/doi:10.1073/pnas.1517140113/-/DCSupplemental.
References
- 1.Bloom JS, Ehrenreich IM, Loo WT, Lite TL, Kruglyak L. Finding the sources of missing heritability in a yeast cross. Nature. 2013;494(7436):234–237. doi: 10.1038/nature11867. [DOI] [PMC free article] [PubMed] [Google Scholar]
- 2.Dowell RD, et al. Genotype to phenotype: A complex problem. Science. 2010;328(5977):469. doi: 10.1126/science.1189015. [DOI] [PMC free article] [PubMed] [Google Scholar]
- 3.Brem RB, Yvert G, Clinton R, Kruglyak L. Genetic dissection of transcriptional regulation in budding yeast. Science. 2002;296(5568):752–755. doi: 10.1126/science.1069516. [DOI] [PubMed] [Google Scholar]
- 4.Cheung VG, et al. Natural variation in human gene expression assessed in lymphoblastoid cells. Nat Genet. 2003;33(3):422–425. doi: 10.1038/ng1094. [DOI] [PubMed] [Google Scholar]
- 5.Schadt EE, et al. Genetics of gene expression surveyed in maize, mouse and man. Nature. 2003;422(6929):297–302. doi: 10.1038/nature01434. [DOI] [PubMed] [Google Scholar]
- 6.Smith EN, Kruglyak L. Gene-environment interaction in yeast gene expression. PLoS Biol. 2008;6(4):e83. doi: 10.1371/journal.pbio.0060083. [DOI] [PMC free article] [PubMed] [Google Scholar]
- 7.Chen BJ, et al. Harnessing gene expression to identify the genetic basis of drug resistance. Mol Syst Biol. 2009;5:310. doi: 10.1038/msb.2009.69. [DOI] [PMC free article] [PubMed] [Google Scholar]
- 8.Litvin O, Causton HC, Chen BJ, Pe’er D. Modularity and interactions in the genetics of gene expression. Proc Natl Acad Sci USA. 2009;106(16):6441–6446. doi: 10.1073/pnas.0810208106. [DOI] [PMC free article] [PubMed] [Google Scholar]
- 9.Visscher PM, Goddard ME. Systems genetics: The added value of gene expression. HFSP J. 2010;4(1):6–10. doi: 10.2976/1.3292182. [DOI] [PMC free article] [PubMed] [Google Scholar]
- 10.Brem RB, Storey JD, Whittle J, Kruglyak L. Genetic interactions between polymorphisms that affect gene expression in yeast. Nature. 2005;436(7051):701–703. doi: 10.1038/nature03865. [DOI] [PMC free article] [PubMed] [Google Scholar]
- 11.Lee E, Bussemaker HJ. Identifying the genetic determinants of transcription factor activity. Mol Syst Biol. 2010;6:412. doi: 10.1038/msb.2010.64. [DOI] [PMC free article] [PubMed] [Google Scholar]
- 12.Chen K, van Nimwegen E, Rajewsky N, Siegal ML. Correlating gene expression variation with cis-regulatory polymorphism in Saccharomyces cerevisiae. Genome Biol Evol. 2010;2:697–707. doi: 10.1093/gbe/evq054. [DOI] [PMC free article] [PubMed] [Google Scholar]
- 13.Fazlollahi M, et al. Harnessing natural sequence variation to dissect posttranscriptional regulatory networks in yeast. G3 (Bethesda) 2014;4(8):1539–1553. doi: 10.1534/g3.114.012039. [DOI] [PMC free article] [PubMed] [Google Scholar]
- 14.Hansen M, Everett L, Singh L, Hannenhalli S. Mimosa: Mixture model of co-expression to detect modulators of regulatory interaction. Algorithms Mol Biol. 2010;5:4. doi: 10.1186/1748-7188-5-4. [DOI] [PMC free article] [PubMed] [Google Scholar]
- 15.Wang K, et al. Genome-wide identification of post-translational modulators of transcription factor activity in human B cells. Nat Biotechnol. 2009;27(9):829–839. doi: 10.1038/nbt.1563. [DOI] [PMC free article] [PubMed] [Google Scholar]
- 16.Wu HY, et al. A modulator based regulatory network for ERα signaling pathway. BMC Genomics. 2012;13(Suppl 6):S6. doi: 10.1186/1471-2164-13-S6-S6. [DOI] [PMC free article] [PubMed] [Google Scholar]
- 17.Thomas D, Jacquemin I, Surdin-Kerjan Y. MET4, a leucine zipper protein, and centromere-binding factor 1 are both required for transcriptional activation of sulfur metabolism in Saccharomyces cerevisiae. Mol Cell Biol. 1992;12(4):1719–1727. doi: 10.1128/mcb.12.4.1719. [DOI] [PMC free article] [PubMed] [Google Scholar]
- 18.Blaiseau PL, Thomas D. Multiple transcriptional activation complexes tether the yeast activator Met4 to DNA. EMBO J. 1998;17(21):6327–6336. doi: 10.1093/emboj/17.21.6327. [DOI] [PMC free article] [PubMed] [Google Scholar]
- 19.Lee TA, et al. Dissection of combinatorial control by the Met4 transcriptional complex. Mol Biol Cell. 2010;21(3):456–469. doi: 10.1091/mbc.E09-05-0420. [DOI] [PMC free article] [PubMed] [Google Scholar]
- 20.Siggers T, Duyzend MH, Reddy J, Khan S, Bulyk ML. Non-DNA-binding cofactors enhance DNA-binding specificity of a transcriptional regulatory complex. Mol Syst Biol. 2011;7:555. doi: 10.1038/msb.2011.89. [DOI] [PMC free article] [PubMed] [Google Scholar]
- 21.Carrillo E, et al. Characterizing the roles of Met31 and Met32 in coordinating Met4-activated transcription in the absence of Met30. Mol Biol Cell. 2012;23(10):1928–1942. doi: 10.1091/mbc.E11-06-0532. [DOI] [PMC free article] [PubMed] [Google Scholar]
- 22.McIsaac RS, Petti AA, Bussemaker HJ, Botstein D. Perturbation-based analysis and modeling of combinatorial regulation in the yeast sulfur assimilation pathway. Mol Biol Cell. 2012;23(15):2993–3007. doi: 10.1091/mbc.E12-03-0232. [DOI] [PMC free article] [PubMed] [Google Scholar]
- 23.Petti AA, McIsaac RS, Ho-Shing O, Bussemaker HJ, Botstein D. Combinatorial control of diverse metabolic and physiological functions by transcriptional regulators of the yeast sulfur assimilation pathway. Mol Biol Cell. 2012;23(15):3008–3024. doi: 10.1091/mbc.E12-03-0233. [DOI] [PMC free article] [PubMed] [Google Scholar]
- 24.Takemaru K, Harashima S, Ueda H, Hirose S. Yeast coactivator MBF1 mediates GCN4-dependent transcriptional activation. Mol Cell Biol. 1998;18(9):4971–4976. doi: 10.1128/mcb.18.9.4971. [DOI] [PMC free article] [PubMed] [Google Scholar]
- 25.Cook JG, Bardwell L, Kron SJ, Thorner J. Two novel targets of the MAP kinase Kss1 are negative regulators of invasive growth in the yeast Saccharomyces cerevisiae. Genes Dev. 1996;10(22):2831–2848. doi: 10.1101/gad.10.22.2831. [DOI] [PubMed] [Google Scholar]
- 26.Tedford K, Kim S, Sa D, Stevens K, Tyers M. Regulation of the mating pheromone and invasive growth responses in yeast by two MAP kinase substrates. Curr Biol. 1997;7(4):228–238. doi: 10.1016/s0960-9822(06)00118-7. [DOI] [PubMed] [Google Scholar]
- 27.Harbison CT, et al. Transcriptional regulatory code of a eukaryotic genome. Nature. 2004;431(7004):99–104. doi: 10.1038/nature02800. [DOI] [PMC free article] [PubMed] [Google Scholar]
- 28.Foat BC, Morozov AV, Bussemaker HJ. Statistical mechanical modeling of genome-wide transcription factor occupancy data by MatrixREDUCE. Bioinformatics. 2006;22(14):e141–e149. doi: 10.1093/bioinformatics/btl223. [DOI] [PubMed] [Google Scholar]
- 29.Lefrançois P, Zheng W, Snyder M. ChIP-Seq using high-throughput DNA sequencing for genome-wide identification of transcription factor binding sites. Methods Enzymol. 2010;470:77–104. doi: 10.1016/S0076-6879(10)70004-5. [DOI] [PubMed] [Google Scholar]
- 30.Zhu C, et al. High-resolution DNA-binding specificity analysis of yeast transcription factors. Genome Res. 2009;19(4):556–566. doi: 10.1101/gr.090233.108. [DOI] [PMC free article] [PubMed] [Google Scholar]
- 31.Foss EJ, et al. Genetic basis of proteome variation in yeast. Nat Genet. 2007;39(11):1369–1375. doi: 10.1038/ng.2007.22. [DOI] [PubMed] [Google Scholar]
- 32.MacIsaac KD, et al. An improved map of conserved regulatory sites for Saccharomyces cerevisiae. BMC Bioinformatics. 2006;7:113. doi: 10.1186/1471-2105-7-113. [DOI] [PMC free article] [PubMed] [Google Scholar]
- 33.Gao F, Foat BC, Bussemaker HJ. Defining transcriptional networks through integrative modeling of mRNA expression and transcription factor binding data. BMC Bioinformatics. 2004;5:31. doi: 10.1186/1471-2105-5-31. [DOI] [PMC free article] [PubMed] [Google Scholar]
- 34.McIsaac RS, et al. Synthetic gene expression perturbation systems with rapid, tunable, single-gene specificity in yeast. Nucleic Acids Res. 2013;41(4):e57. doi: 10.1093/nar/gks1313. [DOI] [PMC free article] [PubMed] [Google Scholar]
- 35.Roberts CJ, et al. Signaling and circuitry of multiple MAPK pathways revealed by a matrix of global gene expression profiles. Science. 2000;287(5454):873–880. doi: 10.1126/science.287.5454.873. [DOI] [PubMed] [Google Scholar]
- 36.Esch RK, Wang Y, Errede B. Pheromone-induced degradation of Ste12 contributes to signal attenuation and the specificity of developmental fate. Eukaryot Cell. 2006;5(12):2147–2160. doi: 10.1128/EC.00270-06. [DOI] [PMC free article] [PubMed] [Google Scholar]
- 37.Ashburner M, et al. The Gene Ontology Consortium Gene ontology: Tool for the unification of biology. Nat Genet. 2000;25(1):25–29. doi: 10.1038/75556. [DOI] [PMC free article] [PubMed] [Google Scholar]
- 38.Hinnebusch AG, Fink GR. Positive regulation in the general amino acid control of Saccharomyces cerevisiae. Proc Natl Acad Sci USA. 1983;80(17):5374–5378. doi: 10.1073/pnas.80.17.5374. [DOI] [PMC free article] [PubMed] [Google Scholar]
- 39.Dolan JW, Kirkman C, Fields S. The yeast STE12 protein binds to the DNA sequence mediating pheromone induction. Proc Natl Acad Sci USA. 1989;86(15):5703–5707. doi: 10.1073/pnas.86.15.5703. [DOI] [PMC free article] [PubMed] [Google Scholar]
- 40.Lim MK, et al. Gal11p dosage-compensates transcriptional activator deletions via Taf14p. J Mol Biol. 2007;374(1):9–23. doi: 10.1016/j.jmb.2007.09.013. [DOI] [PubMed] [Google Scholar]
- 41.Peterson CL, Dingwall A, Scott MP. Five SWI/SNF gene products are components of a large multisubunit complex required for transcriptional enhancement. Proc Natl Acad Sci USA. 1994;91(8):2905–2908. doi: 10.1073/pnas.91.8.2905. [DOI] [PMC free article] [PubMed] [Google Scholar]
- 42.Richmond E, Peterson CL. Functional analysis of the DNA-stimulated ATPase domain of yeast SWI2/SNF2. Nucleic Acids Res. 1996;24(19):3685–3692. doi: 10.1093/nar/24.19.3685. [DOI] [PMC free article] [PubMed] [Google Scholar]
- 43.Neely KE, et al. Activation domain-mediated targeting of the SWI/SNF complex to promoters stimulates transcription from nucleosome arrays. Mol Cell. 1999;4(4):649–655. doi: 10.1016/s1097-2765(00)80216-6. [DOI] [PubMed] [Google Scholar]
- 44.Neely KE, Hassan AH, Brown CE, Howe L, Workman JL. Transcription activator interactions with multiple SWI/SNF subunits. Mol Cell Biol. 2002;22(6):1615–1625. doi: 10.1128/MCB.22.6.1615-1625.2002. [DOI] [PMC free article] [PubMed] [Google Scholar]
- 45.Pi H, Chien CT, Fields S. Transcriptional activation upon pheromone stimulation mediated by a small domain of Saccharomyces cerevisiae Ste12p. Mol Cell Biol. 1997;17(11):6410–6418. doi: 10.1128/mcb.17.11.6410. [DOI] [PMC free article] [PubMed] [Google Scholar]
- 46.Payne DM, et al. Identification of the regulatory phosphorylation sites in pp42/mitogen-activated protein kinase (MAP kinase) EMBO J. 1991;10(4):885–892. doi: 10.1002/j.1460-2075.1991.tb08021.x. [DOI] [PMC free article] [PubMed] [Google Scholar]
- 47.Rockman MV, Skrovanek SS, Kruglyak L. Selection at linked sites shapes heritable phenotypic variation in C. elegans. Science. 2010;330(6002):372–376. doi: 10.1126/science.1194208. [DOI] [PMC free article] [PubMed] [Google Scholar]
- 48.Lappalainen T, et al. Geuvadis Consortium Transcriptome and genome sequencing uncovers functional variation in humans. Nature. 2013;501(7468):506–511. doi: 10.1038/nature12531. [DOI] [PMC free article] [PubMed] [Google Scholar]
- 49.Spivakov M, et al. Analysis of variation at transcription factor binding sites in Drosophila and humans. Genome Biol. 2012;13(9):R49. doi: 10.1186/gb-2012-13-9-r49. [DOI] [PMC free article] [PubMed] [Google Scholar]
- 50.Kasowski M, et al. Variation in transcription factor binding among humans. Science. 2010;328(5975):232–235. doi: 10.1126/science.1183621. [DOI] [PMC free article] [PubMed] [Google Scholar]
- 51.Green MR. TBP-associated factors (TAFIIs): Multiple, selective transcriptional mediators in common complexes. Trends Biochem Sci. 2000;25(2):59–63. doi: 10.1016/s0968-0004(99)01527-3. [DOI] [PubMed] [Google Scholar]
- 52.Horikoshi M, et al. Transcription factor TFIID induces DNA bending upon binding to the TATA element. Proc Natl Acad Sci USA. 1992;89(3):1060–1064. doi: 10.1073/pnas.89.3.1060. [DOI] [PMC free article] [PubMed] [Google Scholar]
- 53.Zheng W, Zhao H, Mancera E, Steinmetz LM, Snyder M. Genetic analysis of variation in transcription factor binding in yeast. Nature. 2010;464(7292):1187–1191. doi: 10.1038/nature08934. [DOI] [PMC free article] [PubMed] [Google Scholar]
- 54.Liu H, Styles CA, Fink GR. Saccharomyces cerevisiae S288C has a mutation in FLO8, a gene required for filamentous growth. Genetics. 1996;144(3):967–978. doi: 10.1093/genetics/144.3.967. [DOI] [PMC free article] [PubMed] [Google Scholar]
- 55.Storici F, Resnick MA. The delitto perfetto approach to in vivo site-directed mutagenesis and chromosome rearrangements with synthetic oligonucleotides in yeast. Methods Enzymol. 2006;409:329–345. doi: 10.1016/S0076-6879(05)09019-1. [DOI] [PubMed] [Google Scholar]
- 56.Baur M, Esch RK, Errede B. Cooperative binding interactions required for function of the Ty1 sterile responsive element. Mol Cell Biol. 1997;17(8):4330–4337. doi: 10.1128/mcb.17.8.4330. [DOI] [PMC free article] [PubMed] [Google Scholar]
- 57.Hoffman GA, Garrison TR, Dohlman HG. Analysis of RGS proteins in Saccharomyces cerevisiae. Methods Enzymol. 2002;344:617–631. doi: 10.1016/s0076-6879(02)44744-1. [DOI] [PubMed] [Google Scholar]
- 58.Foat BC, Houshmandi SS, Olivas WM, Bussemaker HJ. Profiling condition-specific, genome-wide regulation of mRNA stability in yeast. Proc Natl Acad Sci USA. 2005;102(49):17675–17680. doi: 10.1073/pnas.0503803102. [DOI] [PMC free article] [PubMed] [Google Scholar]
- 59.Bussemaker HJ, Foat BC, Ward LD. Predictive modeling of genome-wide mRNA expression: From modules to molecules. Annu Rev Biophys Biomol Struct. 2007;36:329–347. doi: 10.1146/annurev.biophys.36.040306.132725. [DOI] [PubMed] [Google Scholar]
- 60.Schacherer J, et al. Genome-wide analysis of nucleotide-level variation in commonly used Saccharomyces cerevisiae strains. PLoS One. 2007;2(3):e322. doi: 10.1371/journal.pone.0000322. [DOI] [PMC free article] [PubMed] [Google Scholar]
- 61.Altschul SF, et al. Gapped BLAST and PSI-BLAST: A new generation of protein database search programs. Nucleic Acids Res. 1997;25(17):3389–3402. doi: 10.1093/nar/25.17.3389. [DOI] [PMC free article] [PubMed] [Google Scholar]
- 62.Hoerl AE, Kennard RW. Ridge regression: Biased estimation for nonorthogonal problems. Technometrics. 1970;12:55–67. [Google Scholar]
- 63.Boorsma A, Lu XJ, Zakrzewska A, Klis FM, Bussemaker HJ. Inferring condition-specific modulation of transcription factor activity in yeast through regulon-based analysis of genomewide expression. PLoS One. 2008;3(9):e3112. doi: 10.1371/journal.pone.0003112. [DOI] [PMC free article] [PubMed] [Google Scholar]
- 64.Benjamini Y, Hochberg Y. Controlling the false discovery rate: A practical and powerful approach to multiple testing. J R Stat Soc, B. 1995;57(1):289–300. [Google Scholar]
- 65.Schmitt AP, McEntee K. Msn2p, a zinc finger DNA-binding protein, is the transcriptional activator of the multistress response in Saccharomyces cerevisiae. Proc Natl Acad Sci USA. 1996;93(12):5777–5782. doi: 10.1073/pnas.93.12.5777. [DOI] [PMC free article] [PubMed] [Google Scholar]
Associated Data
This section collects any data citations, data availability statements, or supplementary materials included in this article.


