Abstract
Histotripsy fractionates soft tissue by well-controlled acoustic cavitation using microsecond-long, high-intensity ultrasound pulses. The feasibility of using histotripsy as a non-invasive, drug-free, and image-guided thrombolysis method has been shown previously. A new histotripsy approach, termed Microtripsy, has recently been investigated for the thrombolysis application to improve treatment accuracy and avoid potential vessel damage. In this study, we investigated the effects of pulse repetition frequency (PRF) on microtripsy thrombolysis. Microtripsy thrombolysis treatments using different PRFs (5, 50, and 100 Hz) and doses (20, 50, and 100 pulses) were performed on blood clots in an in vitro vessel flow model. To quantitatively evaluate the microtripsy thrombolysis effect, the location of focal cavitation, the incident rate of pre-focal cavitation on the vessel wall, the size and location of the resulting flow channel, and the generated clot debris particles were measured. The results demonstrated that focal cavitation was always well-confined in the vessel lumen without contacting the vessel wall for all PRFs. Pre-focal cavitation on the front vessel wall was never observed at 5Hz PRF, but occasionally observed at PRFs of 50 Hz (1.2%) and 100 Hz (5.4%). However, the observed pre-focal cavitation was weak and didn’t significantly impact the focal cavitation. Results further demonstrated that, although the extent of clot fractionation per pulse was the highest at 5 Hz PRF at the beginning of treatment (<20 pulses), 100 Hz PRF generated the largest flow channels with a much shorter treatment time. Finally, results showed fewer large debris particles were generated at a higher PRF. Overall, the results of this study suggest that a higher PRF (50 or 100 Hz) may be a better choice for microtripsy thrombolysis to use clinically due to the larger resulting flow channel, shorter treatment time, and smaller debris particles.
Introduction
Thrombosis is the formation of a blood clot inside an artery or vein, blocking blood flow in the circulatory system. Arterial obstruction via thrombosis in the cerebral vasculature leads to stroke, which is a leading cause of disability and death in the United States [1]. The most common form of venous thrombosis is deep vein thrombosis (DVT), which occurs usually in the legs and can lead to pulmonary embolism (PE). DVT/PE (also called venous thromboembolism) affects over 300,000 people each year in the United States and causes deaths of 60,000 to 100,000 [2]. Severely symptomatic patients may require thrombolytic treatments instead of simply taking anticoagulant medicines. The current standard thrombolytic treatment involves the infusion of thrombolytic drugs such as tissue plasminogen activator (tPA) [3, 4]. Administration of thrombolytic drugs systemically has limited effectiveness with long treatment time (several hours to days) and is associated with a high risk of major bleeding [5]. Catheter-directed thrombolysis has the advantage over systematic thrombolysis by means of local application at the thrombosis site, but it is invasive and still carries the risks of bleeding, vascular damage, and infections [6, 7].
Ultrasound has been shown to enhance or induce thrombolysis for several decades [8]. Significant efforts have been focused on enhancing the efficacy of thrombolytic drugs with ultrasound [9–14], with several clinical trials showing promising results [15–17]. In addition, ultrasound combined with microbubble contrast agents has been demonstrated to successfully augment clot dissolution in the presence or absence of thrombolytic drugs [18–20]. Ultrasound has also been investigated as an independent thrombolysis method under approaches utilizing acoustic cavitation [21–26].
Histotripsy is non-thermal ablation method that mechanically fractionates soft tissue through well-controlled acoustic cavitation generated by microsecond-long, high-pressure ultrasound pulses [27–29]. The feasibility of using histotripsy as a noninvasive, drug-free, and image-guided thrombolysis technique was first demonstrated in vitro and in vivo by Maxwell et al [24, 25]. In those studies, multi-cycle (usually ≥5 cycle) ultrasound pulses were used to generate the cavitation bubble cloud via a shock scattering mechanism [30]. Using the shock scattering approach, the cavitation cloud is less-confined and tends to be generated in contact with vessel wall where the weak nuclei reside, resulting in potential vessel damage from histotripsy treatment. A new histotripsy approach, termed microtripsy, has been recently investigated for thrombolysis application to improve treatment precision and avoid potential vessel damage [26]. Microtripsy uses an intrinsic threshold mechanism where a cavitation cloud is initiated via a single ultrasound pulse with only one high negative pressure phase. When the peak negative pressure directly exceeds a distinctive “intrinsic threshold” for the medium (27 MPa for blood clots), a cavitation cloud is formed within the focal region exceeding the threshold [31, 32]. The location and size of the cavitation cloud generated using the intrinsic threshold mechanism is more reproducible and predictable than the shock scattering mechanism. Our microtripsy thrombolysis study showed that, cavitation can be precisely generated and confined in the vessel lumen without contacting vessel wall, allowing for a precise flow channel to be created within the clot while minimizing the risk of vessel damage [26].
In our previous microtripsy thrombolysis study, the pulse repetition frequency (PRF) of applied ultrasound pulses was fixed to 50 Hz and the treatment dose (i.e. the number of ultrasound pulses applied at each treatment location) was chosen to be more than sufficient for complete clot fractionation. A higher PRF is expected to result in a shorter treatment time. However, a previous study suggested that higher PRF (>10 Hz) introduced cavitation memory effects where residual bubble nuclei from collapse of transient cavities from the previous pulse might become cavitation sites for subsequent cavitation events. As a result, the cavitation might reoccur at the same locations from pulse to pulse and the per-pulse fractionation efficiency could be lowered [33]. In the case for thrombolysis, the cavitation memory effects may result in an incomplete flow channel and different distributions of clot debris particles. Also, there was a concern that using 1–2 cycles pulses with a high PRF (>10Hz) may still result in pre-focal cavitation on the vessel wall. The pre-focal cavitation on the vessel wall can potentially damage the vessel and weaken the focal cavitation within vessel lumen by shielding the ultrasound energy propagation to the treatment focus. Finally, when high PRF are utilized, residual bubble nuclei from cavitation memory effects may shift the location of cavitation towards the ultrasound transducer[34]. In such a situation, to avoid damage to the interior vessel wall, the treatment focus within vessel lumen would need to be relocated prior to treatment to compensate for the potential shift.
This current study was conducted to explore the influence of treatment PRFs on microtripsy thrombolysis and to address the above concerns with high treatment PRFs. Microtripsy thrombolysis treatments using different PRFs were performed on blood clots in an in vitro flow model. As the number of pulses necessary to completely fractionate the clot may vary with different PRF, we also tested different treatment doses (i.e., number of pulses) for each PRF. During each treatment, cavitation was monitored in real-time to detect any pre-focal cavitation incident. After treatments, the flow channels generated were characterized by 3D-scans using a high-frequency ultrasound imaging probe. Pre-focal cavitation, the size and shape of generated flow channel, and the relative location of flow channel with respected to the treatment focus were quantified. The size distribution of generated clot debris particles was also measured. By comparing these results between different treatment PRFs as a function of dose, an optimized treatment PRF was selected for future microtripsy thrombolysis studies.
Methods and Material
Flow Model
An in vitro flow model, similar to that described by Spengos et al [35], was designed to mimic occlusive deep vein thrombosis where no blood flow is present but pressure is still applied on the clot. As shown in Figure 1, the flow model consisted of a reservoir, a pressure sensor, a vessel phantom, a filter, and a fluid collector. All the components were connected with silicone tubing (Masterflex L/S 17; Cole-Parmer, Vernon Hills, IL, USA). The reservoir was placed above the vessel phantom and filled with saline to perfuse the system using gravity-driven pressure. The vessel phantom was mounted horizontally inside a tank filled with degased water. The height difference between the saline level in the reservoir and the vessel phantom was adjusted to apply a constant pressure of 3.7 mm Hg, which was measured by the pressure sensor (MG-9V; SSI Technologies, Janesville, WI, USA). The 3.7 mm Hg was chosen according to reported femoral vein pressure [36, 37]. The valves were remained on all the time during each treatment. Flow was restored when a channel was created through the clot by microtripsy treatment. The restored flow, together with clot debris particles generated from the treatment, was passed through the filter and the filtered fluid was collected for further small particle analysis.
Figure 1.
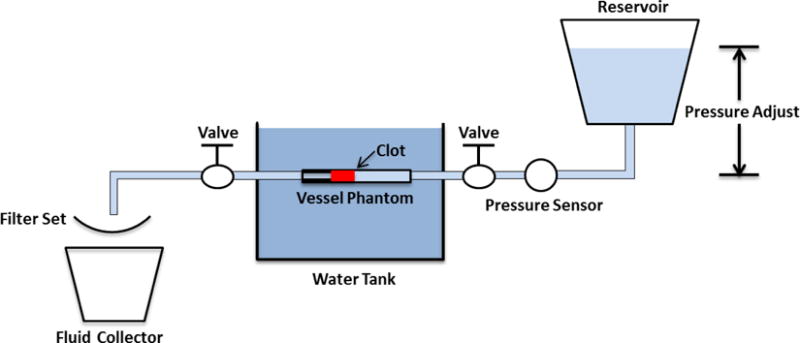
Schematic diagram of the flow model.
Vessel Phantom
The vessel phantom was developed to mimic a human femoral vein (Figure 2). The phantom was made from urethane polymer (Urethane RTV Mold-Making System; Tap Plastics Inc., San Leandro, CA, USA), which has similar acoustic properties to human tissue [38]. Two parts of urethane (liquid) were first mixed at a 1:1 ratio and degased in a vacuum chamber to remove bubbles. The mixture was then poured carefully into a 3D-printed mold. The mold includes two components: a hollow tube with an 8 mm inner diameter and a rod in the center of the hollow tube. To make a stenosis in the vessel phantom, the rod was made with a 6.5 mm diameter on one side and a 4.2 mm diameter on the other side. After solidification of the urethane (~ 24 hours), the vessel phantom was removed from the mold. The vessel phantom had an 8 mm outer diameter, a 6.5 mm inner diameter on one side, a 35% stenosis and a 4.2 mm inner diameter on the other side. The 6.5 mm inner diameter was chosen according to reported DVT vein diameters (5 to 21.7 mm) [39]. The stenosis in this in vitro setup provided additional stabilization of the formed clot by preventing slipping under pressure. The vessel phantom was held by a 3D-printed frame with tube fittings at the two ends to connect the vessel in-line with the rest of the flow model [40].
Figure 2.
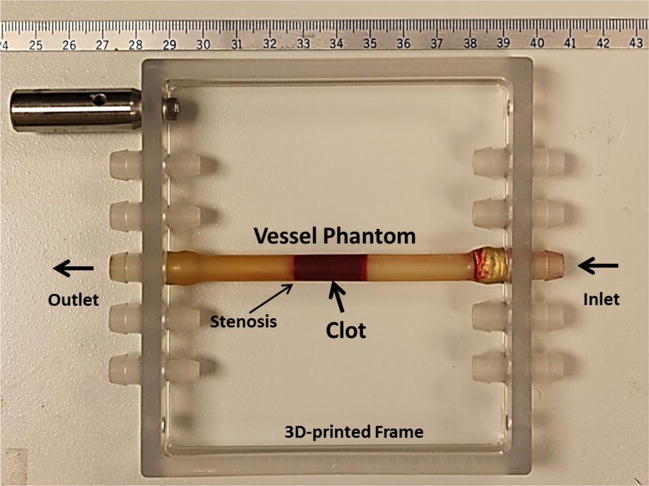
The vessel phantom is held by a 3D-printed frame and can be connected in line with the flow model using tubing fittings. A 35% stenosis is located in the vessel phantom to fix the clot formed to one side so that it does not slip under pressure. The inner diameter is 4.2 mm on the left of the stenosis and 6.5 mm on the right. A clot is formed on the right side of the stenosis as shown in the figure.
Clot Formation
Fresh bovine blood was collected from a local abattoir. A citrate-phosphate-dextrose (CPD) solution (#C7165; Sigma-Aldrich Co., St. Louis, MO, USA) was immediately mixed with fresh bovine blood as an anti-coagulant at a ratio of 1 mL CPD per 9 mL blood. The blood sample was stored at 4°C and used within 72 hours. Before use, bovine blood was warmed up to the normal cow body temperature (38.6 °C). To stimulate the clotting cascade, calcium chloride (#21107; Sigma-Aldrich Co., St. Louis, MO, USA) was injected into bovine blood to a final concentration of 20 mM/L. To form clot inside the vessel phantom, the stimulated blood was poured into the vertically-placed vessel phantom with the stenosis sealed by a balloon catheter. Any visible bubble was removed. After 2 hours in a water bath at 38.6 °C, the clot was matured and cross-linked with the vessel interior and stenosis. The balloon catheter was then removed and the vessel phantom was connected back into the flow model with the stenosis end of the clot distal to the pressure reservoir. The connecting tubes were carefully refilled with saline. All the clots in this study were made with a length of 2 cm.
Microtripsy Thrombolysis System
An integrated pre-clinical system for image-guided microtripsy thrombolysis was developed in our laboratory and used for all the treatments in this study (Figure 3). It includes three subsystems: microtripsy therapy, ultrasound imaging and positioning system. The therapy subsystem used a 1 MHz 18-element microtripsy transducer that was designed based on the anatomy of DVT patients and manufactured by Imasonic (S.A., Besancon, France) (Figure 3). The transducer had an effective 9.8 cm (lateral) × 8 cm (elevational) aperture and a 7 cm focal length. It was driven by a pulse amplifier developed in our lab to generate very short (< 2 cycles), high intense ultrasound pulses. The focal beam volume (−6 dB) of the transducer was measured to be 6.5 mm (axial) × 1.3 mm (lateral) × 1.5 mm (elevational) at a peak negative pressure of 15 MPa using a fiber-optic probe hydrophone (FOPH) [41]. The imaging subsystem was developed based on a SonixTouch® imaging machine (Analogic Ultrasound, Vancouver, Canada). An ultrasound probe with custom rectangular housing (L7.5MHz; Vermon, France) was inserted into the rectangular central hole of the therapy transducer to guide and monitor microtripsy thrombolysis treatment. Software development kits were provided by the SonixTouch® manufacturer to allow custom application developments. The positioning subsystem included a multi-positioning arm and a compact motorized positioner on the arm. The therapy transducer was mounted on the compact positioner. With 6 degrees of freedom and a range around 1 meter, the multi-positioning arm can be manually moved and hold using a press/release lock for coarse target localization. With 3 degrees of freedom and a range of 10 cm × 5 cm × 4 cm, the motorized positioner was controlled by both software and joy sticks for finer localization. Control software was developed to manage and coordinate the therapy, imaging, and positioning systems.
Figure 3.
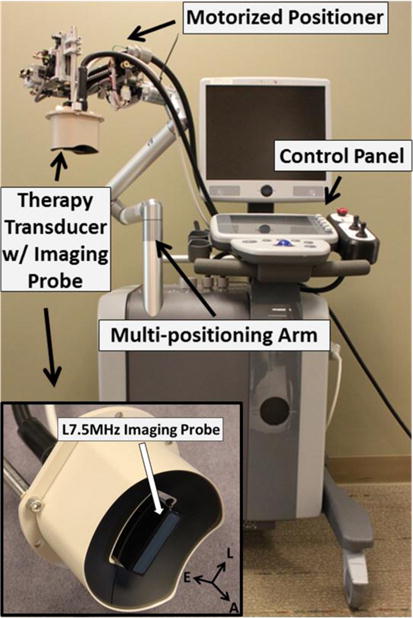
Integrated microtripsy thrombolysis system. It consists of an ultrasound imaging system, a microtripsy therapy system, and a motorized positioning system. The insert shows the therapy transducer with a linear imaging probe embedded at the center.
Treatments
The vessel phantom with an occlusive clot inside was connected to the flow model and placed in a tank filled with degassed water. Using the multi-positioning arm, the therapy transducer was manually placed above the vessel phantom and its lateral axis was oriented perpendicular to the vessel phantom so that the cross section of vessel was imaged during treatment. Pre-treatment planning was performed to determine the treatment path prior to each microtripsy clot treatment following three steps. First, cavitation was generated in empty water field and the center of the hyperechoic cavitation region was marked as the treatment focus on the ultrasound imaging window. Second, guided by the real-time ultrasound images, the transducer was moved using the motorized positioner to align the treatment focus at the center of vessel lumen. The transducer was then adjusted to move the treatment focus from one end of the clot to the other end. Several locations (spaced around 3 mm) from one end of the clot (close to the pressure reservoir) to the other end were recorded by the control software. Third, after these locations were registered, the control software linearly interpolated these key locations into a scan path of denser treatment locations with an interval of 0.3 mm.
For one treatment, the microtripsy thrombolysis system applied a fixed number of microtripsy pulses (dose) at each location with a fixed pulse repetition frequency (PRF) and then moved automatically to next location on the treatment path. A peak negative pressure of 30 MPa was used for microtripsy pulses throughout this study, as this pressure level was right above the intrinsic threshold and was shown to create precise flow channels in our previous microtripsy thrombolysis study. An example of microtripsy waveform is shown in Figure 4. Peak negative pressure larger than 20 MPa can’t be directly measured and therefore was estimated by linear summation (P(-)LS) of direct P- outputs from 3 separate groups of transducer elements (6 elements per group). In this parameter study, three different PRFs (5, 50, and 100 Hz) combined with three treatment doses (20, 50, and 100 pulses) were examined. A maximal dose of 100 pulses was chosen to ensure the generated flow channel was confined within the clot. Six clots were treated with each of the parameter combinations. Real-time ultrasound images for treatment monitoring were recorded as a video throughout each treatment. Imaging with a central frequency of 7.5 MHz was synchronized with the microtripsy pulses. The depth of the image was 6 cm and the cavitation focus was located in the center at a depth of 5 cm. There were 128 scan lines for each image. When a microtripsy pulse was fired, it scanned from left to right line by line (100 μs per line). There was a delay of ~6.4 ms to image the cavitation after a pulse fire.
Figure 4.
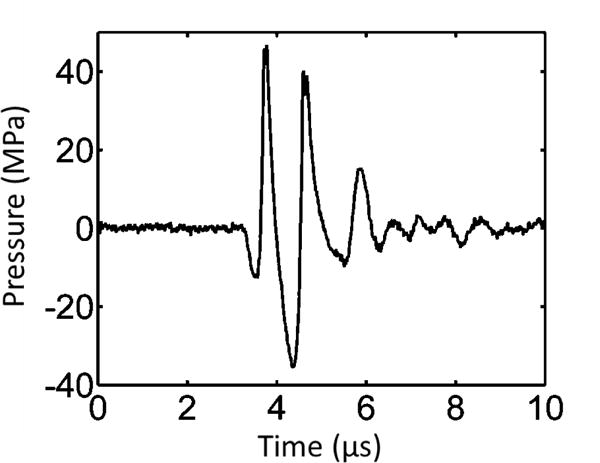
Pressure waveform of a microtripsy pulse. Because peak negative pressure larger than 20 MPa cannot be directly measured, this estimated waveform was linearly summed from the directly measured waveforms of 6 separate element groups (3 adjacent elements per group).
Cavitation Monitor
Ultrasound image video taken during each treatment provided qualitative visualization of cavitation. Adopted from the previous studies [30, 42, 43], an acoustic cavitation detection method was also used to monitor cavitation in this study. One element in the therapy transducer was employed for both transmitting microtripsy pulse and receiving the backscattered signals of the microtripsy pulse from cavitation bubbles as well as emissions from bubble collapse. The element was connected to an oscilloscope (Lecroy372c, Teledyne LeCroy Inc., Chestnut Ridge, New York, USA) through a high-voltage probe (PPE2kV, Teledyne LeCroy Inc., Chestnut Ridge, New York, USA). The oscilloscope was set in a sequential mode and synchronized with microtripsy pulses to digitize the received cavitation signals. Starting at 87 us after a microtripsy pulse was generated by the transducer, a 20 us long waveform of the backscatter signals of the therapy pulse from the cavitation bubble cloud was acquired with a sampling rate of 250 MHz. The 87 us delay time was chosen based on the round-trip travel time of ultrasound propagation to and from the cavitation focus. The 20 us time window was selected to cover the whole vessel region on the ultrasound propagation path. Before each treatment, a control waveform containing acoustic reflections only from vessel walls was acquired using a microtripsy pulse with a P- of 20 MPa (below the intrinsic threshold for cavitation). During each treatment, 300 treatment waveforms containing both vessel reflections and backscatter signals from cavitation were collected.
The primary purpose of monitoring cavitation in this study was to detect whether there was pre-focal cavitation on vessel walls when using different treatment PRFs. The control waveform was scaled by the ratio of the P- of the therapy pulses over 20MPa (control) to better estimate the reflected acoustic signal from vessel walls during treatment. Using the control waveform, the time windows corresponding to front vessel wall region (proximal to therapy transducer) and vessel lumen region were determined in each treatment waveform (Figure 5). When cavitation occurred, the signal amplitude at the corresponding temporal location on the treatment waveform was greatly increased as the incident therapy pulse was backscattered from cavitation bubbles. Cavitation was detected when the peak amplitude of the backscatter signal exceeds a threshold for each region, which was set as twice the peak amplitude of the scaled control waveform in that region. The percentages of pre-focal cavitation occurrence on front vessel wall and focal cavitation occurrence in vessel lumen were calculated for each treatment (the number of pulses when cavitation was detected/total number of measured pulses).
Figure 5.
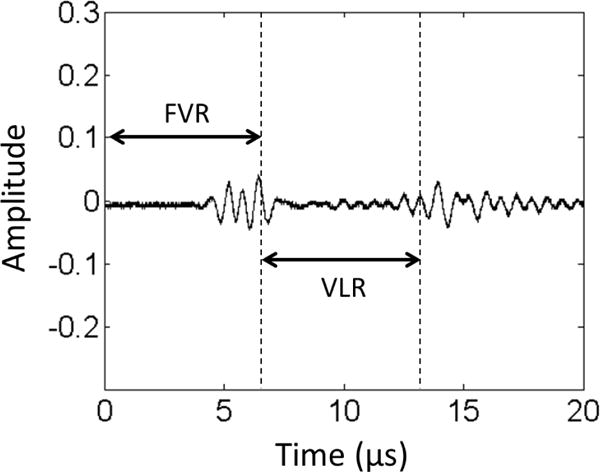
Control waveform of cavitation monitor. The two bursts in the figure are the reflected signals from the front vessel wall (left) and rear vessel wall (right), respectively. The corresponding temporal zones of the Front Vessel Region (FVR) and Vessel Lumen Region (VLR) can be determined by these two reflections.
Flow Channel Quantification
To quantitatively evaluate flow channels generated by microtripsy with different PRFs and doses, each treated clot was scanned using a 20 MHz high-resolution ultrasound probe. The probe was separately mounted onto the motorized positioner after each treatment. With the imaging plane perpendicular to the vessel central axis, the probe was moved by the positioner from one end to the other end of the clot taking one cross-sectional image every 0.3 mm along the vessel. 67 scan images were collected from each treated clot. Since the fractionated clot region appeared hypoechoic (very low brightness on image) when flow was restored, whereas intact clot region was hyperechoic (high brightness on image), we applied a brightness threshold to detect the cross section of flow channel on each scan image. Inside the vessel lumen on each scan image, the area with pixel intensity less than 20 (0–255 overall range) was thresholded out as the cross section of the flow channel. The value of 20 was selected according to the intensity histogram of the scan images. To quantify the size and shape of the flow channel, the cross area (Across) of the flow channel region was calculated and an ellipse was fitted into the flow channel region to estimate its major and minor diameters (Dmajor and Dminor) using a function provided by Matlab (MathWorks, Natick, MA, USA). To evaluate the influence of different PRFs and doses on flow channel location inside of clot, the axial location of flow channel (Laxial) was calculated as the distance from the center of the flow channel (actual treatment location) to the center of vessel lumen (intended target) along the axial direction (i.e. ultrasound propagation direction). The sharpness of channel boundary transitioning from unfractionated area to fractionated area was also quantified by measuring the width of boundary transition zone (Wbound), which was detected as the area with the pixel intensity higher than 20 but less than 30 outside the completely fractionated lesion. The mean Across, Dmajor, Dminor, Laxial and Wbound over all valid scan images of treated clots using the same PRF and dose were used to characterize the flow channel under this parameter combination.
Restored Flow Measurements
Restored flow rate was measured to evaluate microtripsy thrombolysis effectiveness under this in vitro environment. After the flow channel was created, the volume of downstream saline in the fluid collector within 30 seconds was measured. The restored volume flow rate was then calculated as the volume of the saline collected divided by the time. Owing to the brevity of the time period and the small change in reservoir volume, pressure was assumed to be constant over this time period. A control measurement with no blockage in the flow system was also conducted to compare with restored flow rate.
Debris Particle Size Measurement
There is a concern that clot debris particles generated by microtripsy thrombolysis may embolise to occlude downstream vessels or seed clotting elsewhere to create a new thrombus. To address this issue, a method combining macroscopic inspection and Coulter Counter analysis were utilized to measure clot debris particles generated during microtripsy treatment. When flow was restored in each treatment, clot debris was flushed by the restored flow and filtered by a filter sheet with a pore size of 300 μm. Macroscopic inspection was conducted to check if there was any debris particle trapped on the 300 μm filter. High-resolution optical images were taken of the filter sheet before and after each treatment and the number of distinguishable particles larger than 300 μm was counted and the size of individual large debris particles were measured. The filtered fluid with suspended debris particles smaller than 300 μm was analyzed using a Coulter Counter (Multisizer 3; Beckman Coulter, Brea, CA, USA). With this Coulter Counter, the measurable range of particles was from 2 to 60 μm using a 100-μm aperture tube and from 60 to 300 μm using a 560-μm aperture tube [44]. The measurements using these two aperture tubes were combined to generate a distribution of particles from 2 to 300 μm.
Statistical Analysis
All statistical comparisons in this study were performed using Student’s t-test. P-values < 0.05 were considered significant. Numerical data are expressed as mean ± standard deviation. Error bars on graphs represent standard deviation.
Results
Cavitation
Cavitation bubble clouds appeared as a dynamic hyperechoic region on real-time ultrasound images providing both location information and approximate size of cavitation bubble. According to the ultrasound videos taken during the treatments, no pre-focal cavitation on front vessel wall was observed when using either 5 Hz or 50 Hz treatment PRF. Although pre-focal cavitation was observed with higher treatment PRF (100 Hz), it happened infrequently and appeared small, weak, and sparse (Figure 6). Focal cavitation was still present even when the pre-focal cavitation occurred (Figure 6). In all the treatments, focal cavitation was well confined in the vessel lumen with no contact to the interior vessel wall (Figure 6).
Figure 6.
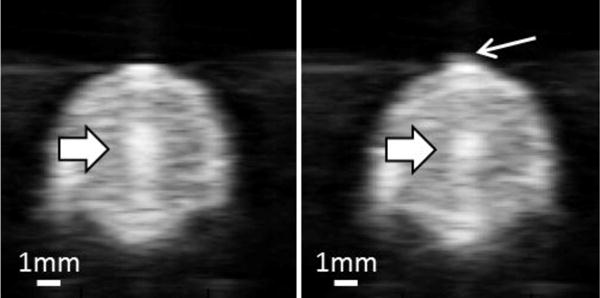
Ultrasound images of vessel lumen during treatment. Left: Focal cavitation at the center of the vessel lumen only (block arrow). Right: Focal cavitation (block arrow) with weak pre-focal cavitation (line arrow).
Quantitative results were obtained using the acoustic cavitation detection method. The percentages of detected pre-focal and focal cavitation incidents during the treatments are shown in Table 1. Representative waveforms captured during treatment are also plotted in Figure 7. No pre-focal cavitation was detected when using 5 Hz treatment PRF. Pre-focal cavitation was rarely detected when using 50 Hz PRF (1.20%) and occasionally detected when using 100 Hz PRF (5.43%). Focal cavitation occurred persistently regardless of treatment PRF and whether pre-focal cavitation happened or not. These results matched well with our qualitative observations from ultrasound imaging.
Table 1.
The percentages of detected pre-focal and focal cavitation.
| N = 18 | Pre-focal Cavitation | Focal Cavitation |
|---|---|---|
| 5 Hz | 0.00 ± 0.00% | 100% |
| 50 Hz | 1.20 ± 0.51% | 100% |
| 100 Hz | 5.43 ± 1.82% | 100% |
Figure 7.
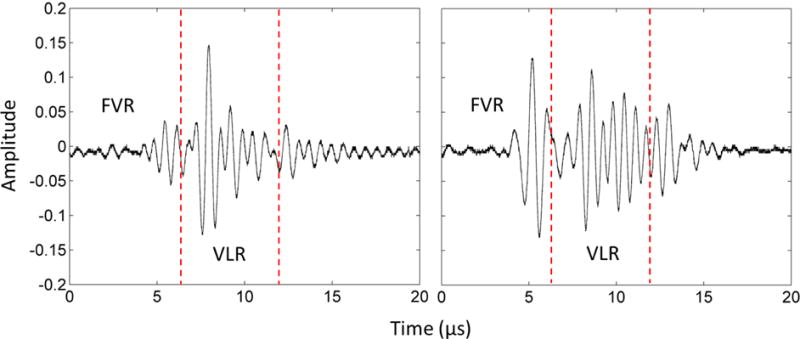
The waveforms of cavitation monitor during treatment. Left: Focal cavitation only. Right: Pre-focal cavitation and focal cavitation together. The vertical dashed lines divide the Front Vessel Region (FVR) and the Vessel Lumen Region (VLR).
Flow Channel
Flow channels generated using different treatment PRFs and doses were thoroughly scanned using the high-resolution ultrasound imaging probe. Representative cross-sectional images of the flow channels after the microtripsy treatments are shown in Figure 8. The differences of the flow channels generated using different treatment PRFs were analyzed from the following four aspects: size, location, shape, and boundary sharpness.
Figure 8.
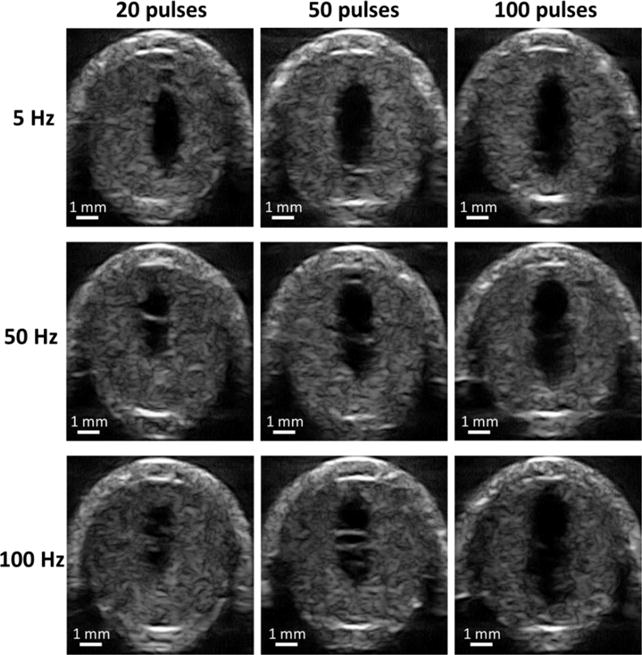
Representative high-resolution ultrasound images of flow channel generated from each treatment parameter combination. The generated flow channels show as the hypoechoic zones inside clots. Ultrasound propagated from the top to the bottom of the images.
Size
The flow channel size was quantified as the cross area (Across) of the flow channels on ultrasound scan images. The mean Across and its standard deviation using each treatment PRF was shown as a function of dose in Figure 9. With a final dose of 100 pulses, the mean Across of flow channel generated using 5, 50 and 100 Hz PRF were 3.60, 3.96 and 4.65 mm2 respectively. One-sided t-tests showed that the final flow channel generated using 100 Hz PRF was significantly larger than those using 50 Hz (P<0.001) and 5Hz (P<0.001). Flow channel developments as a function of dose showed different trends when using different PRFs. The rate of increase in Figure 9 illustrated the per-pulse efficiency of clot fractionation. The highest rate of increase at the beginning of treatment was observed for 5 Hz PRF, which indicated better per-pulse fractionation efficiency than those using 50 and 100 Hz PRF. After 20 pulses, the rate of increase almost plateaued. For 50 Hz PRF, a slower rate of increase was observed compared to 5 Hz PRF but faster than 100 Hz before 20 pulses. As more pulses were applied, the rate of increase gradually decreased but it didn’t reach complete saturation within 100 pulses. The lowest rate of increase at the start of the treatment was observed for 100 Hz PRF. However, as the treatment continued, the rate of increase remained almost linear all the way up to 100 pulses. By fitting 5-degree polynomials into the developing curves of flow channel in Figure 9, it was estimated to take 28, 73 and 89 pulses to reach 90% of flow channel size generated by 100 pulses for 5, 50 and 100 Hz PRF respectively. These trends suggested that higher treatment PRF had lower per-pulse fractionation efficiency (rate of increase) but longer growth “period” before saturation. 100 Hz PRF were 20 times faster than 5Hz PRF to reach the same dose, which indicates the higher PRF had a much higher temporal fractionation rate.
Figure 9.
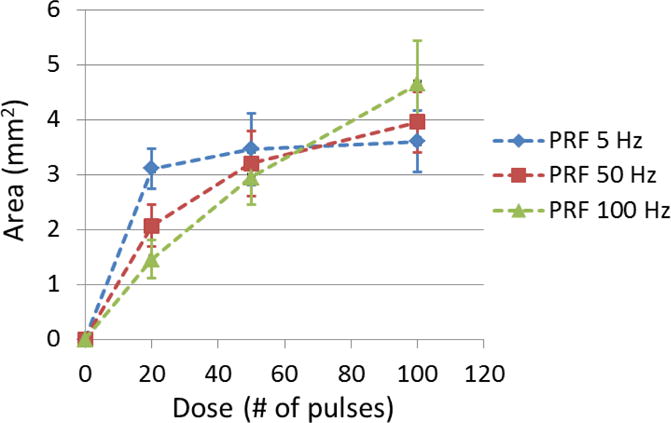
The cross-sectional area (Across) of generated flow channel using each treatment PRF was shown as a function of dose. (N = 6 × 67).
Location
The relative location of the flow channels generated by different PRFs were evaluated using channel axial location (Laxial), which was defined as the axial distance from the cross-sectional center of flow channel (actual treatment location) to the cross-sectional center of the vessel lumen (intended target). For all the treatments, the center of the treatment focus was rigidly placed at the center of the vessel lumen. The mean Laxial of flow channel generated by each treatment PRF is shown in Figure 10 as a function of treatment dose. For 5 Hz PRF, the center of the generated flow channel remained around 0.35 mm above the vessel center. For 50 and 100 Hz PRF, the flow channels were first generated approximately 0.9 mm above the vessel center (closer to the therapy transducer). As more pulses were applied, the centers of flow channels were shifted back towards the vessel center and finally stayed at around 0.6 mm above the vessel center. As shown in Figure 8, the flow channels generated by 5 Hz PRF were enlarged symmetrically with increasing the number of pulses while retaining the center location, whereas the flow channels generated by 50 and 100 Hz PRF showed an asymmetric growth and their center locations shifted along the direction of ultrasound propagation.
Figure 10.
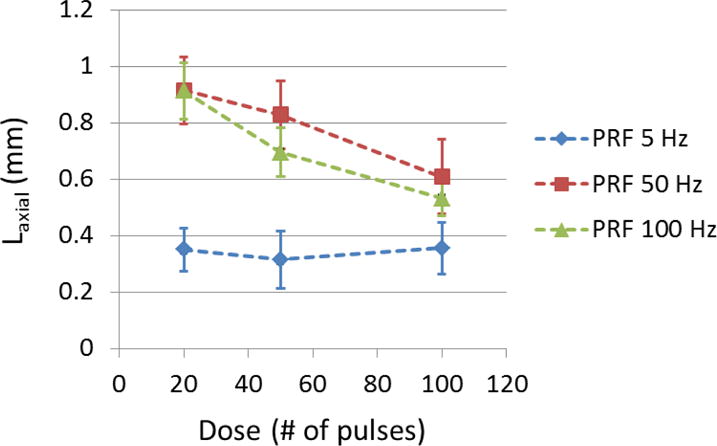
The axial location (Laxial) of generated flow channel using each treatment PRF was shown as a function of dose. (N = 6 × 67).
Shape
The shape of flow channels created using different treatment PRFs were quantified as the ratio (RD) of major diameter (Dmajor) over minor diameter (Dminor) of the cross sections of flow channels. The mean RD of each treatment PRF is shown in Figure 11 as a function of treatment dose. A RD value of 1 indicates a circular shape and higher RD indicates a narrower cross section of flow channel. Overall, higher treatment PRF created narrower flow channels (higher RD). At the beginning of treatment, 50 Hz and 100 Hz PRF had a RD of 3.33 and 2.99, respectively, whereas 5 Hz PRF had a RD smaller than 2.5. RD at 50 and 100 Hz PRF decreased by 5.7% and 7.2 % respectively as the dose increased from 20 to 50 pulses and remained almost the same afterwards. However RD at 5 Hz PRF increased by 3.6% from 20 to 50 pulses and continued increasing by 7.0% from 50 to 100 pulses. After 100 pulses, RD was 2.66, 2.77, and 3.13 for PRF of 5, 50, and 100 Hz, respectively, which indicated a more elongated elliptical flow channel at a higher PRF.
Figure 11.
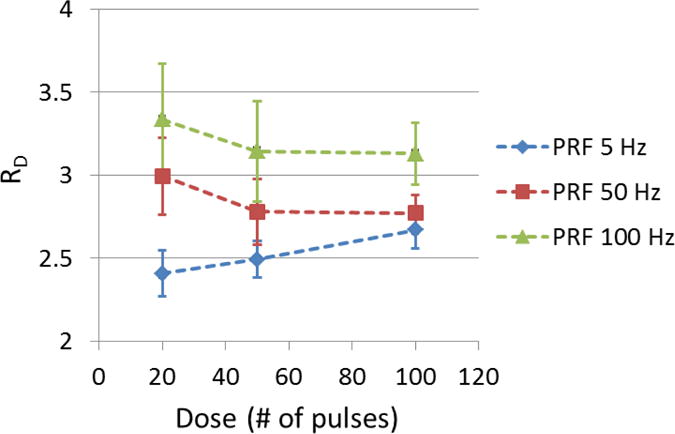
The ratio (RD) of the major diameter over the minor diameter of generated flow channel using each treatment PRF was shown as a function of dose. (N = 6 × 67).
Boundary Sharpness
The boundary sharpness of flow channels generated using different treatment PRFs were quantified as the width of boundary transition zone containing partially fractionated region outside the completely fractionated flow channel (Wbound). The mean Wbound of each treatment PRF is shown in Figure 12 as a function of treatment dose. As shown, when using 5 Hz PRF, Wbound remained at approximately 0.11 mm as more pulses applied. In the cases of 50 and 100 Hz PRF with small dose (20 pulses), Wbound was larger (0.135 ± 0.020 mm for 50 Hz PRF and 0.154 ± 0.025 mm for 100 Hz PRF). As the dose increased all the way to 100 pulses, Wbound using 50 and 100 Hz PRF was decreased to a level close to that at 5 Hz PRF.
Figure 12.
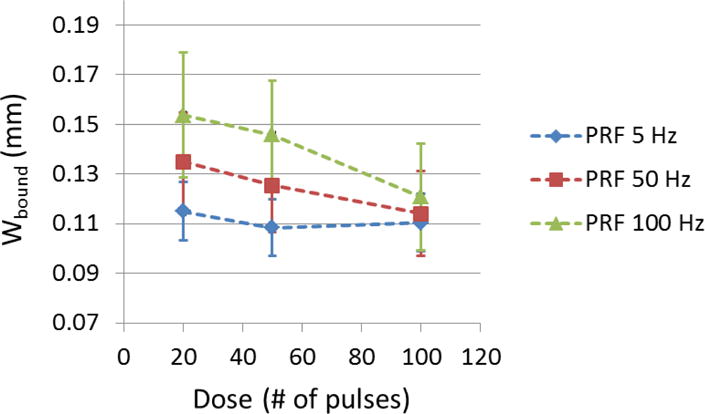
The width of boundary transition zone (Wbound) of generated flow channel using each treatment PRF was shown as a function of dose. (N = 6 × 67).
Restored Flow Rate
Prior to any treatment, no flow was observed on color Doppler imaging. After each microtripsy thrombolysis treatment, flow was successfully restored even with the minimal dose (20 pulses). The restored flow rate was measured after each treatment. With the constant pressure (3.7 mm Hg) applied, larger channel would be expected to permit higher flow rate, which is confirmed by the flow rate results shown in Figure 13. With 20 pulses, 5 Hz PRF had the highest flow rate (185mL/min) whereas for 100 Hz PRF it was only 60 mL/min. However, with a final dose of 100 pulses, both 50 and 100 Hz PRF achieved a mean flow rate over 300 mL/min, higher than that of 5 Hz PRF (276 mL/min). As a reference, the flow model with no blockage had a flow rate of 640 mL/min under the same pressure.
Figure 13.
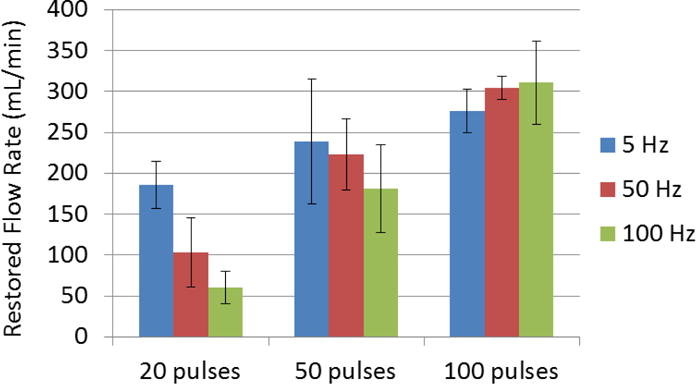
Restored flow rates of each treatment parameter combination. Treatments associated with creation of larger cross-sectional area opening were associated with larger flow rates. (N = 6).
Debris Size Distribution
According to the Coulter Counter measurements, all the treatments shared a very similar debris particle distribution from 2 to 300 μm, regardless of the treatment PRF and dose used. A representative distribution of debris particles is shown in Figure 14. It was normally distributed with an expectation of 4.2 μm and over 99.9 % of the debris particles were smaller than 10 μm. The debris particles became orders of magnitude less as their size increased from 10 μm to 100 μm. Detailed results of debris particles larger than 100 μm are presented as follows. The average number of debris particles from 100 to 300 μm from treatments using different PRFs and doses were shown in Table 2. Very few particles larger than 100 μm were observed after each treatment and there was no significant difference between different treatment PRFs and doses. The largest sizes of debris particles smaller than 300 μm from different treatments were shown in Table 3. The largest particle to pass through the 300 μm filter was 236 μm, which was generated from a treatment with 100 Hz PRF and 50 pulses dose. The total number of debris particles trapped on the 300 μm filter sheets, together with their sizes, is shown in Table 4. No particle > 300 μm was trapped in 20 out of the 28 clot treatments. In 7 out of the 28 treatments, there was only one particle > 300 μm trapped per treatment. And in only one treatment, there were two particles trapped together. The large particles (400, 570 and 630 μm) all appeared in treatments using 5 Hz PRF.
Figure 14.
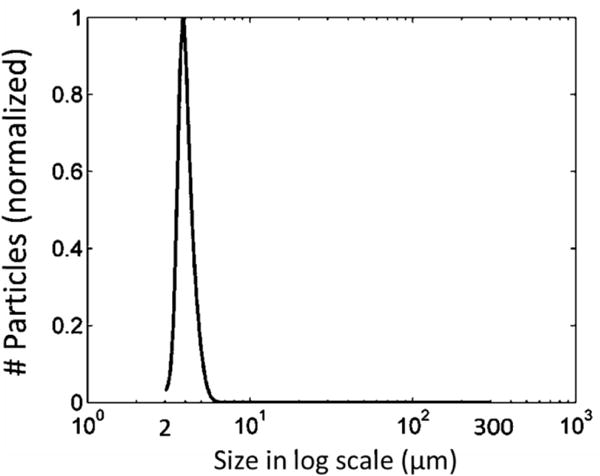
A representative distribution of debris particles from 2 to 300 μm. It is normalized to 1.
Table 2.
Average number of particles >100 μm over 6 treatments for each parameter set.
| 20 Pulses | 50 Pulses | 100 Pulses | |
|---|---|---|---|
| PRF 5 Hz | 0 ± 0 | 7.0 ± 4.2 | 2.3 ± 2.6 |
| PRF 50 Hz | 7.0 ± 3.3 | 3.3 ± 2.9 | 3.3 ± 3.9 |
| PRF 100 Hz | 5.3 ± 4.3 | 14.0 ± 5.8 | 4.7 ± 4.4 |
Table 3.
Largest particle size <300 μm.
| 20 Pulses | 50 Pulses | 100 Pulses | |
|---|---|---|---|
| PRF 5 Hz | 93 μm | 128 μm | 110 μm |
| PRF 50 Hz | 148 μm | 102 μm | 104 μm |
| PRF 100 Hz | 126 μm | 236 μm | 114 μm |
Table 4.
Particles larger than 300 μm. The underline indicates they are from the same treatment.
| 20 Pulses | 50 Pulses | 100 Pulses | |
|---|---|---|---|
| PRF 5 Hz | 1 (307 μm) | 1 (630 μm) | 2 (570, 400 μm) |
| PRF 50 Hz | 0 | 0 | 1 (300 μm) |
| PRF 100 Hz | 0 | 1 (312 μm) | 3 (300, 310, 305 μm) |
Discussion
Cavitation
For all PRFs, focal cavitation was generated within the vessel lumen without contacting the vessel wall. No pre-focal cavitation was observed at 5 Hz PRF. As treatment PRF was increased to 50 and 100 Hz, instances of pre-focal cavitation were observed to occur on the front vessel wall during the treatments. However, because of the low frequency of occurrence (< 6%) and sparse bubble appearance, the pre-focal cavitation is expected to have limited impact on treatment efficacy and is unlikely to cause clinically relevant damage to exterior vessel wall, which has previously been showed to be resistant to cavitation damage [45]. However, further in vivo evaluation is necessary to validate this hypothesis. The cause of the pre-focal cavitation with higher PRF is potentially associated with both the water-vessel interface and cavitation memory. In our experimental setup, the water-vessel interface was about 4 mm from the treatment focus in the vessel lumen closer to the ultrasound transducer. Bubble nuclei tend to reside on this interface and a previous study suggested the cavitation threshold was lowered at the tissue-fluid interface [46]. With higher PRF, residual bubble nuclei from cavitation persisted on the interface between microtripsy pulses due to cavitation memory and made the cavitation generation on the interface easier by acting as seeds for subsequent pulses. So with the enhancement by cavitation memory effects using higher PRF [47–49], pre-focal cavitation was manifested at the vessel interface.
In this study, we used the acoustic signals received from one transmit element to detect cavitation incidents. This method served well to detect whether a cavitation incident occur on the front vessel wall and/or in the vessel lumen, but the location of cavitation could not be accurately extracted. Potentially the accuracy and sensitivity of cavitation detection can be further improved by using one or more separate ultrasound transducers with higher frequency.
Flow Channels
With different treatment PRFs, the location, size, and shape of created flow channels varied, and the progression of the flow channel generation also changed. At 5 Hz PRF, the flow channel was generated consistently at the target focal location in the vessel lumen. Using high PRFs (50 and 100 Hz), the lesion was first generated at the front of the focal region in the vessel (close to the front vessel wall and the transducer) and then developed back towards the vessel center away from the transducer where the treatment focus was originally placed. The reason why at higher PRF the lesion started closer to the transducer and grew asymmetrically away from the transducer is potentially related to the cavitation memory effects. At the beginning of treatment, residual bubble nuclei were formed from the first few pulses and trapped all over the focal region in the clot. With a high PRF, a subsequent ultrasound pulse arrived before the complete dissolution of residual bubble nuclei produced from the previous pulse. The nuclei proximal to the transducer acted as seeds to cause onsite cavitation, which absorbed and shielded the incident acoustic energy from propagating further towards the treatment focus, resulting in a cavitation cloud at the front of the treatment focal region. As more pulses were applied, the clot at the front of the focal region was fractionated, creating a small liquefied clot zone and a fluid-tissue interface. Then the clot was gradually eroded from the liquefied region and grew away from the transducer towards the vessel center. Using low PRF (5 Hz), the lesion was first generated at the vessel center and then enlarged radially. In this case, residual bubble nuclei were probably dissolved before the subsequent ultrasound pulse, minimizing the cavitation memory effects.
Per-pulse fractionation efficiencies were also different between these treatment PRFs, which can be potentially explained by the same rationale above based on the cavitation memory effects. At the beginning of fractionation, 5 Hz PRF showed better per-pulse fractionation efficiency probably because the cavitation was intrinsically generated covering the entire focal region in the vessel center without memory effects. As clot in the focal region was quickly fractionated using 5 Hz PRF, the per-pulse fractionation efficiency decreased significantly after 20 pulses because less and less clot volume could be broken down in the focal region. But for 50 and 100 Hz PRF, since a small lesion was generated on the proximal side and the clot was then gradually eroded from the lesion and expanded away from the transducer, the lesion size still grew significantly after 20 pulses.
Debris
Only a few (less than 20 average) debris particles > 100 μm were observed per treatment in this study. Only a total of nine debris particles > 300 μm were observed in 8 out of the 28 treatments. From Table 4, we can see the largest particles (570 μm, 630 μm) were observed when using 5 Hz PRF. This may be associated with the low temporal fractionation rate of 5 Hz PRF. At the end of recanalization, when fractionating the last clot segment, flow started to restore. Due to the slow fractionation of 5 Hz PRF, large clot pieces might be swept away before fractionated into smaller pieces. In contrast, since high treatment PRF has a much higher temporal fractionation rate, large clot pieces at the end of treatment might be fractionated down quickly before major flow was restored.
Our previous study using a PRF of 50 Hz and an increased dose of 300 pulses showed no debris particles > 300 μm and less 100-μm-level particles, which indicates increasing treatment dose can probably eliminate large debris particles [26]. The debris observed in this study can be considered as the worst possible case. Even with this worst case, the generated debris shouldn’t cause any severe embolism in lung in the DVT application. First, the largest particle observed overall was only 630 μm. According to the morphometry of pulmonary arterial system reported by Singhal et al [50], 500-μm-level particles may only obstruct one arteriole of order 9 which supplies only 0.016% of total capillary beds. Second, the number of debris particles larger than 100 μm from one treatment was very small (less than 20), which wouldn’t be expected to cause massive pulmonary embolism. Third, mechanical thrombectomy treatments generate clot particles up to 1000 μm with no severe embolism reported from human patient treatments [51–53].
Choice of Treatment PRF
Even though 5 Hz PRF avoids the pre-focal cavitation formation, it generates cavitation consistently at the geometric focal region, and has better per-pulse fractionation efficiency at the treatment beginning, overall, 50 or 100 Hz PRF may be a better choice for microtripsy thrombolysis to use clinically due to the larger flow channels, smaller debris particles, and much higher temporal fractionation rate. Compared to 5Hz PRF, the higher PRFs in this study created larger flow channels after 100 pulse dose, and the maximal size of debris particles was smaller. The higher PRFs have a higher temporal fractionation rate and can shorten treatment time significantly. Assuming a dose of 300 pulses is used in clinical situation to minimize the debris particle size, it takes only about 15 minutes for microtripsy to recanalize a 10-cm long clot using 100 Hz PRF compared to hours for 5Hz PRF. Reduced treatment time can be a very competitive advantage over the current thrombolysis treatments. We also see less large debris particles >300 μm generated using higher PRF. With this observed trend, it is reasonable to consider even higher PRF which may achieve the same or better results with shorter treatment time. The reason why we didn’t get a chance to try PRF > 100 Hz was the limitation of the therapy transducer. Since it was outputting a very high acoustic pressure, we were worried about damaging the transducer’s piezoelectric elements by heating with higher PRF.
Despite these favorable results of using 50 and 100 Hz PRF, further investigation is still needed to evaluate the risk of potential vessel damages. It should be noted that sparse and infrequent pre-focal cavitation was observed on the vessel wall using 50 or 100Hz PRF. We were not able to evaluate this risk using this vessel phantom but future in vivo experiments may provide us a more detailed answer regarding this concern. In addition, using a higher PRF, the cavitation started closer to the transducer and grew away from the transducer, and the lesion center did not align exactly with the center of the geometric focal zone. Though with imaging feedback we can take that into account in the pre-treatment planning to ensure the focal cavitation zone is completely confined within the vessel lumen, further in vivo evaluation of this offset is needed.
Future Work
Freshly formed clots were used in this study to mimic acute thrombosis. Literature shows that chronic retracted clots are more resistant to sonothrombolysis treatments [54, 55]. We plan to evaluate the efficacy and safety of the microtripsy thrombolysis on retracted clots. In addition, we are currently investigating a new real-time imaging feedback (Bubble-induced Color Doppler [56, 57]) for histotripsy thrombolysis treatment, and we plan to incorporate this feedback with microtripsy thrombolysis to adaptively deliver the optimal dose at each treatment location during treatment. Finally, in vivo studies will be conducted to validate the feasibility, safety and efficacy of microtripsy thrombolysis in a porcine deep vein thrombosis model [25, 58]. Since there may be a difference in cavitation behavior between in vitro and in vivo settings, we want to confirm what we observed in this in vitro study still applies in vivo.
Conclusion
This study investigated the effects of PRF (5, 50, and 100 Hz) on microtripsy thrombolysis. Results demonstrated that focal cavitation was always well-confined in the vessel lumen without contacting the vessel wall regardless of the PRF used. Pre-focal cavitation on the vessel wall was occasionally observed when using 50 and 100 Hz PRF, but it appeared weak and infrequently. The 5 Hz PRF showed the best per-pulse fractionation efficiency at the beginning of treatment, but the 50 and 100 Hz PRFs generated larger flow channels with much shorter treatment times over the course of the treatment. In addition, results showed fewer large debris particles were observed with higher PRFs. Overall, the results of this study suggest that 50 or 100 Hz PRF may be a better choice for microtripsy thrombolysis to use clinically due to the larger resulting flow channel, shorter treatment time, and smaller debris particles. Further in vivo evaluation of potential vessel damage and treatment efficacy using high PRF for microtripsy thrombolysis is necessary and underway.
Acknowledgments
This work is supported by grants from the National Institute of Biomedical Imaging and Bioengineering, under Award R01 EB008998 and the Focused Ultrasound Foundation.
References
- 1.Mozaffarian D, et al. Heart Disease and Stroke Statistics—2015 Update A Report From the American Heart Association. Circulation. 2015;131:e29–e322. doi: 10.1161/CIR.0000000000000152. [DOI] [PubMed] [Google Scholar]
- 2.Beckman MG, et al. Venous thromboembolism: a public health concern. American journal of preventive medicine. 2010;38:S495–S501. doi: 10.1016/j.amepre.2009.12.017. [DOI] [PubMed] [Google Scholar]
- 3.Adams HP, et al. Guidelines for thrombolytic therapy for acute stroke: a supplement to the guidelines for the management of patients with acute ischemic stroke a statement for healthcare professionals from a special writing group of the stroke council, American heart association. Circulation. 1996;94:1167–1174. doi: 10.1161/01.cir.94.5.1167. [DOI] [PubMed] [Google Scholar]
- 4.Bates SM, Ginsberg JS. Treatment of deep-vein thrombosis. New England Journal of Medicine. 2004;351:268–277. doi: 10.1056/NEJMcp031676. [DOI] [PubMed] [Google Scholar]
- 5.Friedman HS, et al. Tissue plasminogen activator for acute ischemic stroke. N Engl J Med. 1996;334:1405. doi: 10.1056/NEJM199605233342114. [DOI] [PubMed] [Google Scholar]
- 6.Sharafuddin MJ, et al. Endovascular management of venous thrombotic and occlusive diseases of the lower extremities. Journal of vascular and interventional radiology. 2003;14:405–423. doi: 10.1097/01.rvi.0000064849.87207.4f. [DOI] [PubMed] [Google Scholar]
- 7.Lauw MN, Büller HR. Treatment of deep vein thrombosis. Future Medicine Ltd. Current Approaches to Deep Vein Thrombosis. 2014:136–160. [Google Scholar]
- 8.Siegel RJ, Luo H. Ultrasound thrombolysis. Ultrasonics. 2008;48:312–320. doi: 10.1016/j.ultras.2008.03.010. [DOI] [PubMed] [Google Scholar]
- 9.Pfaffenberger S, et al. 2MHz ultrasound enhances t-PA-mediated thrombolysis: comparison of continuous versus pulsed ultrasound and standing versus travelling acoustic waves. Thromb Haemost. 2003;89:583–589. [PubMed] [Google Scholar]
- 10.Holland CK, et al. Ultrasound-enhanced tissue plasminogen activator thrombolysis in an in vitro porcine clot model. Thrombosis research. 2008;121:663–673. doi: 10.1016/j.thromres.2007.07.006. [DOI] [PMC free article] [PubMed] [Google Scholar]
- 11.Hitchcock KE, et al. Ultrasound-enhanced rt-PA thrombolysis in an ex vivo porcine carotid artery model. Ultrasound in medicine & biology. 2011;37:1240–1251. doi: 10.1016/j.ultrasmedbio.2011.05.011. [DOI] [PMC free article] [PubMed] [Google Scholar]
- 12.Larsson J, et al. Ultrasound enhanced thrombolysis in experimental retinal vein occlusion in the rabbit. British journal of ophthalmology. 1998;82:1438–1440. doi: 10.1136/bjo.82.12.1438. [DOI] [PMC free article] [PubMed] [Google Scholar]
- 13.Frenkel V, et al. Pulsed High-Intensity Focused Ultrasound Enhances Thrombolysis in an in Vitro Model 1. Radiology. 2006;239:86–93. doi: 10.1148/radiol.2391042181. [DOI] [PMC free article] [PubMed] [Google Scholar]
- 14.Stone MJ, et al. Pulsed-high intensity focused ultrasound enhanced tPA mediated thrombolysis in a novel in vivo clot model, a pilot study. Thrombosis research. 2007;121:193–202. doi: 10.1016/j.thromres.2007.03.023. [DOI] [PMC free article] [PubMed] [Google Scholar]
- 15.Alexandrov AV, et al. Ultrasound-enhanced systemic thrombolysis for acute ischemic stroke. New England Journal of Medicine. 2004;351:2170–2178. doi: 10.1056/NEJMoa041175. [DOI] [PubMed] [Google Scholar]
- 16.Molina CA, et al. Transcranial ultrasound in clinical sonothrombolysis (TUCSON) trial. Annals of neurology. 2009;66:28–38. doi: 10.1002/ana.21723. [DOI] [PubMed] [Google Scholar]
- 17.Tsivgoulis G, et al. Safety and efficacy of ultrasound-enhanced thrombolysis a comprehensive review and meta-analysis of randomized and nonrandomized studies. Stroke. 2010;41:280–287. doi: 10.1161/STROKEAHA.109.563304. [DOI] [PubMed] [Google Scholar]
- 18.Datta S, et al. Ultrasound-enhanced thrombolysis using Definity® as a cavitation nucleation agent. Ultrasound in medicine & biology. 2008;34:1421–1433. doi: 10.1016/j.ultrasmedbio.2008.01.016. [DOI] [PMC free article] [PubMed] [Google Scholar]
- 19.Brown AT, et al. Microbubbles improve sonothrombolysis in vitro and decrease hemorrhage in vivo in a rabbit stroke model. Investigative radiology. 2011;46 doi: 10.1097/RLI.0b013e318200757a. [DOI] [PMC free article] [PubMed] [Google Scholar]
- 20.Culp WC, et al. Successful microbubble sonothrombolysis without tissue-type plasminogen activator in a rabbit model of acute ischemic stroke. Stroke. 2011;42:2280–2285. doi: 10.1161/STROKEAHA.110.607150. [DOI] [PMC free article] [PubMed] [Google Scholar]
- 21.Rosenschein U, et al. Ultrasound Imaging–Guided Noninvasive Ultrasound Thrombolysis Preclinical Results. Circulation. 2000;102:238–245. doi: 10.1161/01.cir.102.2.238. [DOI] [PubMed] [Google Scholar]
- 22.Burgess A, et al. High-intensity focused ultrasound (HIFU) for dissolution of clots in a rabbit model of embolic stroke. PloS one. 2012;7:e42311. doi: 10.1371/journal.pone.0042311. [DOI] [PMC free article] [PubMed] [Google Scholar]
- 23.Wright C, et al. In vitro and in vivo high intensity focused ultrasound thrombolysis. Investigative radiology. 2012;47:217. doi: 10.1097/RLI.0b013e31823cc75c. [DOI] [PMC free article] [PubMed] [Google Scholar]
- 24.Maxwell AD, et al. Noninvasive thrombolysis using pulsed ultrasound cavitation therapy–histotripsy. Ultrasound in medicine & biology. 2009;35:1982–1994. doi: 10.1016/j.ultrasmedbio.2009.07.001. [DOI] [PMC free article] [PubMed] [Google Scholar]
- 25.Maxwell AD, et al. Noninvasive treatment of deep venous thrombosis using pulsed ultrasound cavitation therapy (histotripsy) in a porcine model. Journal of vascular and interventional radiology. 2011;22:369–377. doi: 10.1016/j.jvir.2010.10.007. [DOI] [PMC free article] [PubMed] [Google Scholar]
- 26.Zhang X, et al. Noninvasive thrombolysis using histotripsy beyond the intrinsic threshold (microtripsy) Ultrasonics, Ferroelectrics, and Frequency Control, IEEE Transactions on. 2015;62:1342–1355. doi: 10.1109/TUFFC.2015.007016. [DOI] [PMC free article] [PubMed] [Google Scholar]
- 27.Xu Z, et al. Effects of acoustic parameters on bubble cloud dynamics in ultrasound tissue erosion (histotripsy) The Journal of the Acoustical Society of America. 2007;122:229–236. doi: 10.1121/1.2735110. [DOI] [PMC free article] [PubMed] [Google Scholar]
- 28.Xu Z, et al. Evolution of bubble clouds induced by pulsed cavitational ultrasound therapy-histotripsy. Ultrasonics, Ferroelectrics, and Frequency Control, IEEE Transactions on. 2008;55:1122–1132. doi: 10.1109/TUFFC.2008.764. [DOI] [PubMed] [Google Scholar]
- 29.Xu Z, et al. Noninvasive creation of an atrial septal defect by histotripsy in a canine model. Circulation. 2010;121:742–749. doi: 10.1161/CIRCULATIONAHA.109.889071. [DOI] [PMC free article] [PubMed] [Google Scholar]
- 30.Maxwell AD, et al. Cavitation clouds created by shock scattering from bubbles during histotripsy. The Journal of the Acoustical Society of America. 2011;130:1888–1898. doi: 10.1121/1.3625239. [DOI] [PMC free article] [PubMed] [Google Scholar]
- 31.Maxwell AD, et al. Probability of cavitation for single ultrasound pulses applied to tissues and tissue-mimicking materials. Ultrasound in medicine & biology. 2013;39:449–465. doi: 10.1016/j.ultrasmedbio.2012.09.004. [DOI] [PMC free article] [PubMed] [Google Scholar]
- 32.Lin K-W, et al. Histotripsy beyond the intrinsic cavitation threshold using very short ultrasound pulses: microtripsy. Ultrasonics, Ferroelectrics, and Frequency Control, IEEE Transactions on. 2014;61:251–265. doi: 10.1109/TUFFC.2014.6722611. [DOI] [PMC free article] [PubMed] [Google Scholar]
- 33.Wang T-Y, et al. An efficient treatment strategy for histotripsy by removing cavitation memory. Ultrasound in medicine & biology. 2012;38:753–766. doi: 10.1016/j.ultrasmedbio.2012.01.013. [DOI] [PMC free article] [PubMed] [Google Scholar]
- 34.Duryea AP, et al. Removal of residual bubble nuclei to enhance histotripsy kidney stone erosion at high rate. The Journal of the Acoustical Society of America. 2014;136:2193–2193. [Google Scholar]
- 35.Spengos K, et al. Acceleration of thrombolysis with ultrasound through the cranium in a flow model. Ultrasound in medicine & biology. 2000;26:889–895. doi: 10.1016/s0301-5629(00)00211-8. [DOI] [PubMed] [Google Scholar]
- 36.Albrechtsson U, et al. Femoral vein pressure measurements for evaluation of venous function in patients with postthrombotic iliac veins. Cardiovascular and interventional radiology. 1981;4:43–50. doi: 10.1007/BF02552407. [DOI] [PubMed] [Google Scholar]
- 37.Negus D, Cockett F. Femoral vein pressures in post-phlebitic iliac vein obstruction. British Journal of Surgery. 1967;54:522–525. doi: 10.1002/bjs.1800540605. [DOI] [PubMed] [Google Scholar]
- 38.Browne J, et al. Assessment of the acoustic properties of common tissue-mimicking test phantoms. Ultrasound in medicine & biology. 2003;29:1053–1060. doi: 10.1016/s0301-5629(03)00053-x. [DOI] [PubMed] [Google Scholar]
- 39.Hertzberg B, et al. Sonographic assessment of lower limb vein diameters: implications for the diagnosis and characterization of deep venous thrombosis. AJR American journal of roentgenology. 1997;168:1253–1257. doi: 10.2214/ajr.168.5.9129422. [DOI] [PubMed] [Google Scholar]
- 40.Park S, et al. Non-invasive embolus trap using histotripsy—an acoustic parameter study. Ultrasound in medicine & biology. 2013;39:611–619. doi: 10.1016/j.ultrasmedbio.2012.11.026. [DOI] [PMC free article] [PubMed] [Google Scholar]
- 41.Parsons JE, et al. Cost-effective assembly of a basic fiber-optic hydrophone for measurement of high-amplitude therapeutic ultrasound fields. The Journal of the Acoustical Society of America. 2006;119:1432–1440. doi: 10.1121/1.2166708. [DOI] [PubMed] [Google Scholar]
- 42.Xu Z, et al. Controlled ultrasound tissue erosion: The role of dynamic interaction between insonation and microbubble activity. The Journal of the Acoustical Society of America. 2005;117:424–435. doi: 10.1121/1.1828551. [DOI] [PMC free article] [PubMed] [Google Scholar]
- 43.Vlaisavljevich E, et al. Effects of ultrasound frequency and tissue stiffness on the histotripsy intrinsic threshold for cavitation. Ultrasound in medicine & biology. 2015;41:1651–1667. doi: 10.1016/j.ultrasmedbio.2015.01.028. [DOI] [PMC free article] [PubMed] [Google Scholar]
- 44.Coulter B. Coulter Counter Multisizer 3 User’s Manual. Hialeah, FL: 2000. [Google Scholar]
- 45.Vlaisavljevich E, et al. Effects of tissue mechanical properties on susceptibility to histotripsy-induced tissue damage. Physics in medicine and biology. 2014;59:253. doi: 10.1088/0031-9155/59/2/253. [DOI] [PMC free article] [PubMed] [Google Scholar]
- 46.Xu Z, et al. High speed imaging of bubble clouds generated in pulsed ultrasound cavitational therapy-histotripsy. Ultrasonics, Ferroelectrics, and Frequency Control, IEEE Transactions on. 2007;54:2091–2101. doi: 10.1109/TUFFC.2007.504. [DOI] [PMC free article] [PubMed] [Google Scholar]
- 47.Delius M, Brendel W. A model of extracorporeal shock wave action: Tandem action of shock waves. Ultrasound in medicine & biology. 1988;14:515–518. doi: 10.1016/0301-5629(88)90115-9. [DOI] [PubMed] [Google Scholar]
- 48.Huber P, et al. Control of cavitation activity by different shockwave pulsing regimes. Physics in medicine and biology. 1999;44:1427. doi: 10.1088/0031-9155/44/6/301. [DOI] [PubMed] [Google Scholar]
- 49.Arora M, et al. Cavitation cluster dynamics in shock-wave lithotripsy: Part 1. Free field. Ultrasound in medicine & biology. 2005;31:827–839. doi: 10.1016/j.ultrasmedbio.2005.02.007. [DOI] [PubMed] [Google Scholar]
- 50.Singhal S, et al. Morphometry of the human pulmonary arterial tree. Circulation Research. 1973;33:190–197. doi: 10.1161/01.res.33.2.190. [DOI] [PubMed] [Google Scholar]
- 51.Yasui K, et al. Recirculation-type Amplatz clot macerator: determination of particle size and distribution. Journal of vascular and interventional radiology. 1993;4:275–278. doi: 10.1016/s1051-0443(93)71853-9. [DOI] [PubMed] [Google Scholar]
- 52.Uflacker R, et al. Treatment of thrombosed dialysis access grafts: randomized trial of surgical thrombectomy versus mechanical thrombectomy with the Amplatz device. Journal of vascular and interventional radiology. 1996;7:185–192. doi: 10.1016/s1051-0443(96)70760-1. [DOI] [PubMed] [Google Scholar]
- 53.MÜLLER-HÜLSBECK S, et al. Mechanical thrombectomy of major and massive pulmonary embolism with use of the Amplatz thrombectomy device. Investigative radiology. 2001;36:317–322. doi: 10.1097/00004424-200106000-00003. [DOI] [PubMed] [Google Scholar]
- 54.Blinc A, et al. Magnetic resonance imaging of retracted and nonretracted blood clots during fibrinolysis in vitro. Pathophysiology of Haemostasis and Thrombosis. 1992;22:195–201. doi: 10.1159/000216319. [DOI] [PubMed] [Google Scholar]
- 55.Sutton JT, et al. Clot retraction affects the extent of ultrasound-enhanced thrombolysis in an ex vivo porcine thrombosis model. Ultrasound in medicine & biology. 2013;39:813–824. doi: 10.1016/j.ultrasmedbio.2012.12.008. [DOI] [PMC free article] [PubMed] [Google Scholar]
- 56.Zhang X, et al. Real-Time Feedback of Histotripsy Thrombolysis Using Bubble-Induced Color Doppler. Ultrasound in medicine & biology. 2015;41:1386–1401. doi: 10.1016/j.ultrasmedbio.2014.12.006. [DOI] [PMC free article] [PubMed] [Google Scholar]
- 57.Miller RM, et al. Investigation of the mechanism of ARFI-based Color Doppler feedback of histotripsy tissue fractionation. Ultrasonics Symposium (IUS), 2013 IEEE International. 2013:934–937. [Google Scholar]
- 58.Devanagondi R, et al. Hemodynamic and Hematologic Effects of Histotripsy of Free-Flowing Blood: Implications for US-Mediated Thrombolysis. Journal of vascular and interventional radiology. 2015 doi: 10.1016/j.jvir.2015.03.022. [DOI] [PMC free article] [PubMed] [Google Scholar]


