

A simple computational model shows that movement of most mRNA transcripts into sieve elements likely is based on non-sequence-specific parameters, including mRNA abundance, half-life, and transcript length.
Abstract
Recently, a large population of mRNA was shown to be able to travel between plant organs via sieve elements as a putative long-distance signaling molecule. However, a mechanistic basis by which transcripts are selected for transport has not yet been identified. Here, we show that experimental mRNA mobility data in Arabidopsis can be explained by transcript abundance and half-life. This suggests that the majority of identified mobile transcripts can be accounted for by non-sequence-specific movement of mRNA from companion cells into sieve elements.
Acclimation to environmental conditions is vital for plants. At the whole-plant level, this is aided by long-distance signaling between organs, which is important both for plant development and defense responses (Shah and Zeier, 2013; Sparks et al., 2013). Mechanisms for long-distance communication include calcium and reactive oxygen species waves, action potentials, and hydraulic waves, as well as phytohormones and some small RNAs (Shah and Zeier, 2013; Sparks et al., 2013; Gilroy et al., 2014). Long-distance signaling molecules can be transported through the phloem, in enucleated cells called sieve elements. mRNA is also able to move in sieve elements, and some mobile transcripts have been shown to give rise to developmental differences at distal locations (Spiegelman et al., 2013), leading to the suggestion that mRNA could be another class of long distance signaling molecules (Westwood, 2015).
mRNA moves between host and parasitic plants (Kim et al., 2014) as well as between heterografts (Notaguchi et al., 2015). Recently, a pioneering grafting approach identified a large population of 2006 mobile mRNA species that were able to move between roots and shoots in grafted Arabidopsis thaliana ecotypes (Thieme et al., 2015). Interestingly, these data suggest that a large percentage of mRNA can move against the direction of phloem flow. Phenotypic changes related to specific mobile mRNAs have been reported (Kim et al., 2001; Haywood et al., 2005; Banerjee et al., 2006; Mahajan et al., 2012; Notaguchi et al., 2012), but it remains unclear to what extent mRNA mobility is biologically meaningful (Lough and Lucas, 2006; Notaguchi, 2015). Correlation between abundance and long-distance mobility has been noted, leading to speculation that mRNA transport could occur in both a selective and nonselective manner (Kim et al., 2014; Notaguchi et al., 2015).
Here, we investigate the potential link between mRNA abundance and mobility by evaluating a simple diffusion-based model (termed the abundance model) in which non-sequence-specific movement of mRNA species from companion cells into sieve elements leads to long-distance mobility. We find that this model is sufficient to explain the large population of experimentally observed mobile transcripts and makes predictions regarding mobile transcript size and half-life that are consistent with experimental data. This analysis suggests that most of the identified mobile mRNA species are mobile as a consequence of local abundance.
RESULTS
The Probability of mRNA Mobility Saturates with mRNA Abundance
We developed a simple model to estimate the probability that a transcript is mobile. In the companion cell, after mRNA crosses the nuclear envelope, most transcripts move through the cytosol by diffusion (Fusco et al., 2003) and are translated or degraded. Alternatively, upon reaching the cell surface, the transcripts may pass or be chaperoned through plasmodesmata into sieve elements (Kehr and Buhtz, 2008; Notaguchi, 2015), in which molecules can move bidirectionally (Liang et al., 2012). The fate of each mRNA molecule of a given transcript species was modeled by a random walk through a 3D cell. Initially positioned at the center of the cell, at each time point, the molecule could move up, down, left-right, forward, or back a small distance relative to the size of the cell, or it could decay with a predefined, constant probability. At the cell boundary, a spatially uniform, transcript-independent probability that the mRNA could pass into sieve elements was assigned. If any simulated mRNA molecule passed through cell membrane, then that transcript was considered to be mobile (Figure 1A). These assumptions could be readily extended to include further information, such as varying plasmodesmal densities, but while simple they proved to be sufficient to explain the observed data, thus not warranting further parameters in the model.
Figure 1.

Workflow for the Simulation of mRNA Mobility.
(A) mRNA abundance model. Green boxes represent cells, with the side facing inwards being adjacent to sieve elements. The rows of cells represent different simulation runs and different transcription rates. Blue diffusion paths indicate simulations in which the transcript was considered to be mobile, and red indicates those in which the transcript was nonmobile.
(B) Output of the abundance model (left, mobility versus abundance plot) was combined with experimental mRNA abundance data to predict the distributions for mobile and nonmobile mRNA (see Methods).
mRNA species abundance is a consequence of transcription rate and half-life. Different transcription rates were modeled by changing the initial number of mRNA molecules in the simulation, and half-life by the decay probability. Transport across the graft boundary in sieve elements was assumed to be fast, so if any molecule of a transcript passed into sieve elements, then that transcript was considered to be mobile; otherwise, the transcript was considered nonmobile. Modeled mRNA species fate was seen to be stochastic, so for each transcript species, the simulation was run 10,000 times to estimate a probability of movement out of the cell, which was then used to calculate the probability of an mRNA species moving into sieve elements from multiple companion cells.
This simple model predicts a saturation relationship between mRNA abundance and probability of mobility. The shape of this curve depends on a number of variables such as cell size, the number of companion cells, plasmodesmatal conductivity, and nucleus size and position, as well as mRNA half-life, but can be approximated by a saturation curve with only two unknown parameters (Supplemental Figures 1 to 3; see Methods).
The Predicted Abundance Distribution of Mobile Transcripts Fits Experimental Data
We compared the predicted relationship between mRNA abundance and mobility from the model to the data set generated by Thieme et al. (2015) (Figure 1B; see Methods). With fitted parameters (Figure 2A; see Methods), the computed relationship between transcript abundance and probability of mobility was able to reproduce the distribution of the mobile and nonmobile mRNA species (Figure 2B), although as expected, the fate of individual transcripts was highly stochastic. This was also observed within the experimental data, where transcripts frequently could be mobile or not in different repeats. As can be seen in Figures 2A and 2C, the predictions remained within experimental error; however, the experimental data seemed to deviate from the model at both extremes of the transcript abundance distribution. This is likely predominantly a consequence of the low copy statistics for mRNA species of extreme abundances (Figure 2B), although it could indicate the existence of an alternative mechanism affecting a small proportion of the population, which is otherwise hidden by the abundance-driven mobility mechanism.
Figure 2.

An Abundance Model of mRNA Mobility Captures the Experimental mRNA Distributions.
(A) Fitted and experimentally derived P(mobile) curve; 95% experimental confidence intervals are shown. The experimental P(mobile) was estimated as the ratio of the number of mobile over nonmobile transcripts, binned by abundance. The confidence interval was calculated using the Clopper-Pearson Exact Binomial method.
(B) Experimental (left) and modeled (right) abundance distributions of mobile and nonmobile mRNA using the fitted P(mobile) curve.
(C) Experimental and predicted abundance distribution for mobile mRNA only; 95% confidence intervals are shown, calculated using the Clopper-Pearson Binomial method.
Analysis of Low-Abundance Mobile Transcripts
To investigate whether there are differences in the nature of the transcripts that deviate most from our simple abundance model, we analyzed the sequences of the low-abundance mobile transcripts [ln(abundance) < 1, left-hand side of Figure 2A]. These transcripts are listed in the Supplemental Table 1. Whereas for the full data set we failed to find any statistically significant motifs, for this subset we identified three statistically enriched motifs (Supplemental Table 2) using DREME (Bailey, 2011). Analysis of Gene Ontology terms revealed an enrichment of processes associated with defense response and the chloroplast for this subset of transcripts (Supplemental Data Set 1).
Regulation of Mobility through Control of Abundance Proximal to the Vasculature
It is possible that local transcript abundance near sieve elements is altered relative to the rest of the tissue to control movement from the site of transcription into sieve elements and thus to regulate mRNA mobility. To investigate this possibility, we analyzed two available data sets, one with bundle sheath data (Aubry et al., 2014) and the other with companion cell data (Mustroph et al., 2009). In the bundle sheath, the mobile population was not enriched relative to overall leaf expression levels (Figure 3A; Supplemental Figure 4). However, using the more localized companion cell data, we found that mobile mRNA transcripts were slightly but significantly overexpressed relative to the rest of leaf (Figure 3B; Supplemental Figure 4). This suggests that local regulation of abundance may be a plausible mechanism for determining mRNA mobility.
Figure 3.

Mobile Transcripts May Be Preferentially Expressed Proximal to Sieve Elements.
The transcript expression ratio in cells proximal to the sieve element relative to the rest of the leaf: in the bundle sheath (B.S.; [A]) and in companion cells (C.C.; [B]). The statistical significance of the difference of the means, P value, was calculated using Welch’s t test. Abundance data were taken from Mustroph et al. (2009), Aubry et al. (2014), and Thieme et al. (2015); mobility classification was from Thieme et al. (2015).
mRNA Half-Life Contributes to Transcript Mobility
The abundance model predicts that mRNA half-life should affect the probability of mobility, as more stable transcripts are likely to have more chances to move out of the cell into sieve elements before decaying (Supplemental Figure 5). Consistent with this expectation, the mobile population had a greater half-life than the nonmobile population (Figure 4).
Figure 4.

The Distribution of Half-Life for Experimentally Determined Mobile and Nonmobile mRNA Populations.
Data are taken from Narsai et al. (2007) and Thieme et al. (2015); 95% Clopper-Pearson binomial confidence intervals are shown.
However, abundance is a function of transcription rate and half-life, so this difference could be due to the effect of half-life on abundance, rather than the separable effect predicted by the model. To address this question, we performed linear discriminant analysis to find the most informative projection of the data to separate mobile from nonmobile transcripts and found that the dominant eigenvector was:
 |
indicating that there was a half-life effect on mobility separable from its effect on abundance but that this contribution was small relative to the size of the abundance effect. Visually, the best boundary to discriminate mobile from nonmobile transcripts found by logistic regression could be seen to have both an abundance and a separate half-life component (Supplemental Figure 6).
Smaller Transcripts Appear to Be More Mobile
Transcripts with a larger Stokes radius would be less likely to be mobile, as they are slower to diffuse within a cell and within a given time less likely to reach plasmodesmata. Although complicated by the formation of RNA secondary structures, we considered transcript length as a proxy for the Stokes radius of an RNA species. The dependence of transcript abundance in the nonproducing distal tissue as a function of transcript length is shown in Figure 5. The small but statistically significant negative correlation qualitatively supported that larger transcripts are less mobile. To check that this was not due to experimental detection bias, we analyzed the dependence of local transcript abundance in the mRNA producing tissue as a function of transcript length. We would expect that experimental bias to be similar in local and distal tissue; however, we did not observe this (Supplemental Figure 7). By contrast with Figure 5, we found no negative correlation between mRNA transcript length and local abundance (a minor positive correlation was observed), suggesting that experimental bias does not cause the size effect tendency.
Figure 5.

Transcript Mobility as a Function of Transcript Length.
This plot shows the mRNA abundance in the distal tissue as a function of transcript length. Data are taken from Thieme et al. (2015). P values were computed from Spearman’s rank correlation; the moving average (red) was calculated with a window size of 300.
DISCUSSION
Using a simple computational model, we have shown that the large mobile mRNA population recently identified by Thieme et al. (2015) can be explained by non-sequence-specific movement of mRNA into sieve elements. Within this model, mRNA abundance is a key determinant of mobility. Furthermore, we have shown that mRNA half-life and transcript length affect the mobile mRNA population in a manner consistent with the abundance model. The consistency of the abundance model with existing experimental data does not imply that identified mobile mRNA species are not biologically relevant signaling molecules. The probability of reaching the cell surface itself could be a biologically relevant and regulated mechanism, in which the balance between half-life and transcription rate determines the mobility of mRNA species; indeed, mRNA 5′ and 3′ untranslated regions associated with increased mobility have been shown to increase transcript half-life (Banerjee et al., 2009). Although we have predominantly used tissue-level expression data, mobile transcripts are also highly abundant in companion cells relative to nonmobile (Supplemental Figure 4). Furthermore, mobile transcripts are slightly overexpressed in companion cells relative to constitutive expression, although it remains unclear whether this is evidence for a regulatory process governing mobility or whether mobility is a side effect of a transcriptome that has been changed for other purposes.
Our model defines mRNA mobility as the escape probability from companion cells and does not explicitly consider the transport process through sieve elements. This does not rule out a possible sequence-specific unloading process. Experimental data suggest that once a molecule is in the sieve elements, it can move bidirectionally across a graft junction (Liang et al., 2012). Therefore, we did not impose any directionality of mRNA movement within sieve elements flow. Should quantitative measures for transcript movement with sieve elements become available, the model could be readily extended to include this information.
Key to reproducing experimentally determined mRNA mobility from the model is the saturation curve shown in Figures 1B and 2A. Our proposed abundance model, explained by transcription rate, diffusion, and half-life, naturally captures this behavior. However, we point out that, in principle, any process that gives rise to such an abundance mobility saturation curve could explain the data.
In developing the presented abundance model, we made a number of approximations that likely warrant future extensions, such as not including advection in cytoplasmic transport and using simple box-shaped cells. Notably, we have not needed to account for different transport probabilities through the plasmodesmata, say, as a function of mRNA size or shape to explain the data. Analysis of the experimental data shows a correlation of abundance in the distal tissue with transcript length, but does not reveal a size threshold, which would be indicative of a size exclusion limit. Given the size of mRNA transcripts, they could be actively chaperoned through the plasmodesmata, perhaps similarly to viral RNA.
If mRNA transport through plasmodesmata requires chaperones that recognize a sequence motif that binds with an equilibrium dissociation constant, Kd, then mRNA with a concentration close to or above that Kd would bind and be transported. A transcript that has a different but similar motif may result in weaker binding that would require a higher abundance to bind. Thus, selective and nonselective mRNA mobility may be conceivably part of a common transport process, with abundance as the determining factor. The presented model does not exclude the possibility of mRNA motifs playing a role in mobility. However, the tight relationship between mRNA mobility and abundance for the bulk of the available data clearly demonstrates the importance of abundance, whereas a similar relationship between mobility and sequence motifs across a large range of transcripts has yet to be shown. The few putative motifs we identified in a reduced data set require further experimental investigation.
An alternative mechanism for mRNA movement could be one in which mRNA enters sieve elements from sieve tube precursor cells, which undergo partial apoptosis during differentiation. If this were the case, all mRNA could move across the graft junction, and it is possible that experimental detection bias of mRNA might potentially give rise to the abovementioned abundance mobility saturation curve. However, this possibility is not supported by the trends in the transcript length and count data, which were not consistent across tissues. Furthermore, the implications of this mechanism are the same as for the presented abundance model in that the detected mobile mRNA transcripts are mobile predominantly because of abundance rather than sequence-specific transport processes.
Based on our results, we suggest that the large majority of identified transcripts are unlikely to be selectively transported. However, it is possible that mRNA species made mobile through the processes described in the abundance model obscure a relatively small population that is made mobile through a different mechanism, as evidenced by mRNA fusion studies performed by Thieme et al. (2015) and the statistically enriched motifs identified in the low-abundance mobile population. We propose that the presented abundance model should be considered the null hypothesis when assessing mRNA mobility data and other mechanisms of mRNA transcript mobility.
METHODS
Data Sources
Abundance and mobility data was taken from supplementary information 1 of Thieme et al. (2015). Transcripts with less than three counts were excluded from the data. For each transcript, in each grafted tissue, “abundance” was calculated as the average read count per informative single nucleotide polymorphism site for the local form and was considered mobile if the read count for the nonlocal form of the transcript was greater than zero in the reciprocal grafted tissue. Half-life data were taken from supplementary Table 2 of Narsai et al. (2007). Localization information was taken from supplementary data of Mustroph et al. (2009) and Aubry et al. (2014).
Calculation of Escape Probability from Many Cells
Probability of escape from a single cell, P(E), was computed using the abundance model as described in the text. The expected probability of a mRNA molecule moving into sieve elements from multiple companion cells, P(F), could be calculated as P(F) = 1 × (1 – P(E))m, where m is the number of companion cells.
Mobility Prediction and Fitting to Abundance Data Using Saturation Curve
The saturation curve equation used to describe the predicted relationship between mRNA mobility and abundance was
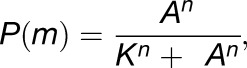 |
where P(m) is the probability of the transcript being mobile, A is the experimentally measured transcript abundance, K is the abundance for which the probability of being mobile is 50%, and n gives the steepness of the curve.
For each modeled transcript t, of abundance A, in the set of all experimentally measured transcripts (T), P(m) was calculated, and At was assigned to either the mobile set M or the stationary set S by
 |
 |
 |
This reflects the experimental approach taken by Thieme et al. (2015) in which transcripts where classified as either “mobile” or “nonmobile.”
For determining the K and n parameters, the distribution of abundances for predicted and experimental mobile and nonmobile transcripts was approximated by histograms and the difference between the predicted and experimental distributions minimized.
Supplemental Data
Supplemental Figure 1. The effect of cell size, cell number, and half-life on mRNA mobility.
Supplemental Figure 2. The effect of nucleus position and size on mRNA mobility.
Supplemental Figure 3. The effect of varied probability of passing through the cell surface on mRNA mobility.
Supplemental Figure 4. The abundance distribution of mobile and nonmobile transcripts in cells proximal to the vasculature.
Supplemental Figure 5. The predicted effect of half-life and abundance on transcript mobility.
Supplemental Figure 6. The contributions of half-life and abundance to mRNA mobility.
Supplemental Figure 7. Detected transcript abundance as a function of length in the producing tissues.
Supplemental Table 1. List of low abundance mobile transcripts present in the data set of Thieme et al. (2015).
Supplemental Table 2. List of putative motifs identified in the low abundance mobile transcripts.
Supplemental Data Set 1. Gene Ontology enrichment of mobile mRNAs.
Supplementary Material
Acknowledgments
We thank Christine Faulkner, Janneke Balk, Robert Sablowski, and Steph Bornemann for critical reading of the manuscript. We thank Thieme and coauthors for their original analysis upon which this study builds and Friedrich Kragler for openly sharing the mobility data and for constructive critique of an earlier draft of this manuscript. We are particularly grateful to three anonymous reviewers for their insightful comments and constructive suggestions. We acknowledge support from the Biotechnology and Biological Sciences Research Council (A.C. and R.J.M.) and Deutsche Forschungsgemeinschaft (S.K.).
AUTHOR CONTRIBUTIONS
A.C., S.K., and R.J.M. designed the research. A.C. built the models and performed the simulations and analysis. A.C., S.K., and R.J.M. wrote the article.
Footnotes
Articles can be viewed online without a subscription.
References
- Aubry S., Smith-Unna R.D., Boursnell C.M., Kopriva S., Hibberd J.M. (2014). Transcript residency on ribosomes reveals a key role for the Arabidopsis thaliana bundle sheath in sulfur and glucosinolate metabolism. Plant J. 78: 659–673. [DOI] [PubMed] [Google Scholar]
- Bailey T.L. (2011). DREME: motif discovery in transcription factor ChIP-seq data. Bioinformatics 27: 1653–1659. [DOI] [PMC free article] [PubMed] [Google Scholar]
- Banerjee A.K., Chatterjee M., Yu Y., Suh S.-G., Miller W.A., Hannapel D.J. (2006). Dynamics of a mobile RNA of potato involved in a long-distance signaling pathway. Plant Cell 18: 3443–3457. [DOI] [PMC free article] [PubMed] [Google Scholar]
- Banerjee A.K., Lin T., Hannapel D.J. (2009). Untranslated regions of a mobile transcript mediate RNA metabolism. Plant Physiol. 151: 1831–1843. [DOI] [PMC free article] [PubMed] [Google Scholar]
- Fusco D., Accornero N., Lavoie B., Shenoy S.M., Blanchard J.M., Singer R.H., Bertrand E. (2003). Single mRNA molecules demonstrate probabilistic movement in living mammalian cells. Curr. Biol. 13: 161–167. [DOI] [PMC free article] [PubMed] [Google Scholar]
- Gilroy S., Suzuki N., Miller G., Choi W.-G., Toyota M., Devireddy A.R., Mittler R. (2014). A tidal wave of signals: calcium and ROS at the forefront of rapid systemic signaling. Trends Plant Sci. 19: 623–630. [DOI] [PubMed] [Google Scholar]
- Haywood V., Yu T.S., Huang N.C., Lucas W.J. (2005). Phloem long-distance trafficking of GIBBERELLIC ACID-INSENSITIVE RNA regulates leaf development. Plant J. 42: 49–68. [DOI] [PubMed] [Google Scholar]
- Kehr J., Buhtz A. (2008). Long distance transport and movement of RNA through the phloem. J. Exp. Bot. 59: 85–92. [DOI] [PubMed] [Google Scholar]
- Kim G., LeBlanc M.L., Wafula E.K., dePamphilis C.W., Westwood J.H. (2014). Plant science. Genomic-scale exchange of mRNA between a parasitic plant and its hosts. Science 345: 808–811. [DOI] [PubMed] [Google Scholar]
- Kim M., Canio W., Kessler S., Sinha N. (2001). Developmental changes due to long-distance movement of a homeobox fusion transcript in tomato. Science 293: 287–289. [DOI] [PubMed] [Google Scholar]
- Liang D., White R.G., Waterhouse P.M. (2012). Gene silencing in Arabidopsis spreads from the root to the shoot, through a gating barrier, by template-dependent, nonvascular, cell-to-cell movement. Plant Physiol. 159: 984–1000. [DOI] [PMC free article] [PubMed] [Google Scholar]
- Lough T.J., Lucas W.J. (2006). Integrative plant biology: role of phloem long-distance macromolecular trafficking. Annu. Rev. Plant Biol. 57: 203–232. [DOI] [PubMed] [Google Scholar]
- Mahajan A., Bhogale S., Kang I.H., Hannapel D.J., Banerjee A.K. (2012). The mRNA of a Knotted1-like transcription factor of potato is phloem mobile. Plant Mol. Biol. 79: 595–608. [DOI] [PubMed] [Google Scholar]
- Mustroph A., Zanetti M.E., Jang C.J.H., Holtan H.E., Repetti P.P., Galbraith D.W., Girke T., Bailey-Serres J. (2009). Profiling translatomes of discrete cell populations resolves altered cellular priorities during hypoxia in Arabidopsis. Proc. Natl. Acad. Sci. USA 106: 18843–18848. [DOI] [PMC free article] [PubMed] [Google Scholar]
- Narsai R., Howell K.A., Millar A.H., O’Toole N., Small I., Whelan J. (2007). Genome-wide analysis of mRNA decay rates and their determinants in Arabidopsis thaliana. Plant Cell 19: 3418–3436. [DOI] [PMC free article] [PubMed] [Google Scholar]
- Notaguchi M. (2015). Identification of phloem-mobile mRNA. J. Plant Res. 128: 27–35. [DOI] [PubMed] [Google Scholar]
- Notaguchi M., Higashiyama T., Suzuki T. (2015). Identification of mRNAs that move over long distances using an RNA-Seq analysis of Arabidopsis/Nicotiana benthamiana heterografts. Plant Cell Physiol. 56: 311–321. [DOI] [PubMed] [Google Scholar]
- Notaguchi M., Wolf S., Lucas W.J. (2012). Phloem-mobile Aux/IAA transcripts target to the root tip and modify root architecture. J. Integr. Plant Biol. 54: 760–772. [DOI] [PubMed] [Google Scholar]
- Shah J., Zeier J. (2013). Long-distance communication and signal amplification in systemic acquired resistance. Front. Plant Sci. 4: 30. [DOI] [PMC free article] [PubMed] [Google Scholar]
- Sparks E., Wachsman G., Benfey P.N. (2013). Spatiotemporal signalling in plant development. Nat. Rev. Genet. 14: 631–644. [DOI] [PMC free article] [PubMed] [Google Scholar]
- Spiegelman Z., Golan G., Wolf S. (2013). Don’t kill the messenger: Long-distance trafficking of mRNA molecules. Plant Sci. 213: 1–8. [DOI] [PubMed] [Google Scholar]
- Thieme C.J., Rojas-Triana M., Stecyk E., Schudoma C., Zhang W., Yang L., Miñambres M., Walther D., Schulze W.X., Paz-Ares J., Scheible W.-R., Kragler F. (2015). Endogenous Arabidopsis messenger RNAs transported to distant tissues. Nat. Plants 1: 15025. [DOI] [PubMed] [Google Scholar]
- Westwood J.H. (2015). RNA transport: Delivering the message. Nat. Plants 1: 15038. [DOI] [PubMed] [Google Scholar]
Associated Data
This section collects any data citations, data availability statements, or supplementary materials included in this article.