

Abstract
Background & Aims
Non-alcoholic fatty liver disease affects ~30% of US adults, yet the role of sugar-sweetened beverages and diet soda on these diseases remains unknown. We examined the cross-sectional association between intake of sugar-sweetened beverages or diet soda and fatty liver disease in participants of the Framingham Offspring and Third Generation cohorts.
Methods
Fatty liver disease was defined using liver attenuation measurements generated from computed tomography in 2634 participants. Alanine transaminase concentration, a crude marker of fatty liver disease, was measured in 5908 participants. Sugar-sweetened beverage and diet soda intake were estimated using a food frequency questionnaire. Participants were categorized as either non-consumers or consumers (3 categories: 1 serving/month to <1 serving/week, 1 serving/week to <1 serving/-day, and ⩾1 serving/day) of sugar-sweetened beverages or diet soda.
Results
After adjustment for age, sex, smoking status, Framingham cohort, energy intake, alcohol, dietary fiber, fat (% energy), protein (% energy), diet soda intake, and body mass index, the odds ratios of fatty liver disease were 1, 1.16 (0.88, 1.54), 1.32 (0.93, 1.86), and 1.61 (1.04, 2.49) across sugar-sweetened beverage consumption categories (p trend = 0.04). Sugar-sweetened beverage consumption was also positively associated with alanine transaminase levels (p trend = 0.007). We observed no significant association between diet soda intake and measures of fatty liver disease.
Conclusion
In conclusion, we observed that regular sugar-sweetened beverage consumption was associated with greater risk of fatty liver disease, particularly in overweight and obese individuals, whereas diet soda intake was not associated with measures of fatty liver disease.
Keywords: Sugar-sweetened beverages, Diet soda, Alanine transaminase, Fatty liver disease
Introduction
Currently, an estimated 30% of the US adult population has non-alcoholic fatty liver disease (NAFLD) [1], a spectrum of pathological disorders that includes simple hepatic steatosis, steatohepatitis, and cirrhosis that arises despite a lack of alcohol consumption [2]. Individuals with NAFLD are at greater risk of developing type 2 diabetes [3] and cardiovascular disease [4]. Hepatic steatosis, or fatty liver, is the defining characteristic of NAFLD [5,6]. Several imaging techniques are able to accurately capture hepatic steatosis [1]. One aspect of diet that has been postulated to increase risk of developing NAFLD is sugars, particularly fructose [7]. While some randomized controlled trials have found high intakes of fructose are linked to greater liver fat [8,9], others have not [10,11]. However, fructose in these studies was excessive (providing 25–60% of energy) and these intakes are rarely consumed at such high amounts in the general population. To date, there is relatively little evidence indicating whether habitual intake of added sugars as typically consumed, i.e. in the form of sucrose or high fructose corn syrup, is associated with fatty liver disease in healthy adults.
Sugar-sweetened beverages (SSB) are the leading source of added sugars in the American diet [12]. The caloric sweeteners in SSB, sucrose and high fructose corn syrup, are also the most commonly used fructose-containing sugars. Diet soda is similar to regular soda; however, it contains no added fructose or other sugars. Our hypothesis was that, independent of generalized adiposity, higher habitual SSB intake would be associated with higher risk of fatty liver disease, whereas no such association would be observed with diet soda. Thus, the objectives of the present study were to examine the cross-sectional association between habitual SSB and diet soda intake, and liver fat measured by multidetector computed tomography (MDCT), and alanine transaminase (ALT) levels (a crude marker of fatty liver disease in a population based cohort).
Participants and methods
Participants
Study participants were from the Framingham Heart Study’s Offspring cohort and Third Generation (Gen3) cohort and have been previously described [13,14]. In brief, the Offspring cohort began in 1971 by enrolling 5124 adults, and the Gen3 cohort was initiated in 2002 with enrollment of 4095 adults. Participants were evaluated approximately every 3–4 years. From 2002 to 2005, 3529 participants were assessed by MDCT scans [3]. The following inclusion criteria were applied for the MDCT study: body weight <160 kg, men ⩾35 years of age, and non-pregnant women >40 years of age. We excluded 323 individuals with non-interpretable MDCT scans. We also excluded 333 individuals with unreliable dietary data and 5 participants who were missing important covariates. Dietary information, as assessed by food frequency questionnaire (FFQ), was considered unreliable if reported energy intake was: <2.5 MJ/d for both men and women; ⩾16.7 MJ/d for women; ⩾17.5 MJ/d for men; or if ⩾P13 food items were left blank on the questionnaire. In order to avoid potential confounding from high alcohol consumption, we further excluded 234 individuals who were classified as high alcohol consumers, i.e. men consuming >21 and women consuming >14 alcoholic beverages/week [1]. The final sample size for the analyses using imaging data was 2634 participants, 1075 from the Offspring cohort and 1559 from the Gen3 cohort. After applying the same exclusion criteria among the full cohorts, we identified 5908 individuals who had valid measurements for ALT concentrations and dietary and covariate data: 2593 from Offspring and 3315 from the Gen3 cohort. All participants provided written informed consent before study participation. The Framingham Heart Study protocols and procedures were approved by the Institutional Review Board for Human Research at Boston University Medical Center, and the current analyses were approved by the Tufts Medical Center and Tufts University Health Sciences Institutional Review Board.
Fatty liver disease
The protocols for measuring liver fat and ALT have been described in detail previously [15,16]. In brief, participants underwent an abdominal scan with an 8-slice MDCT scanner (LightSpeed Ultra; General Electric Health Care, Milwaukee, WI) from 2002 to 2005. The Hounsfield Units were estimated for three regions in the liver and one in the calibration control (phantom). The liver fat content was estimated using liver attenuation, which was reflected by multiplying the ratio of the average Hounsfield Units for liver to that for the phantom by 100 [3]. A lower value of the liver to phantom ratio (LPR) represented a higher volume of liver fat. A value of LPR <33.0 indicated the presence of fatty liver [3]. Visceral adipose tissue (VAT, cm3) and abdominal subcutaneous adipose tissue (SAT, cm3) were measured using the same MDCT scans [17]. Fasting serum ALT concentrations were measured using the kinetic method [16]. Elevated ALT level was defined using a sex-specific cut-off point, (above 19 U/L for women and 30 U/L for men) [18].
Beverage consumption
SSB and diet soda intakes were assessed using the Harvard semi-quantitative FFQ which was designed to assess the habitual dietary intake for the year preceding the physical and medical examinations [19]. The FFQ consisted of 126 food items with standard serving sizes and a selection of 9 frequency categories ranging from none or <1 serving/month to ⩾6 servings/day. The present study used dietary data collected in the 7th exam cycle (1998–2001) of the Offspring cohort and in the 1st examination (2002–2005) of the Gen3 cohort.
The SSB assessment on the FFQ included the following: (1) caffeinated colas with sugar; (2) caffeine-free colas with sugar; (3) other carbonated beverages with sugar; and (4) fruit punches, lemonade, or other non-carbonated fruit drinks. Diet soda was captured using 3 FFQ items including the following: (1) low calorie cola; (2) low calorie, caffeine-free cola; and (3) other low calorie carbonated beverage. The relative validity of the FFQ has been examined for both nutrients and foods in other cohorts [19–21]. The correlation coefficients between FFQ and 7-day dietary records for SSB and diet soda were 0.51 and 0.66, respectively. Participants were categorized according to the frequency of SSB and diet soda consumption: none to <1 serving/month (non-consumers), 1 serving/month to <1 serving/week, 1 serving/week to 1 serving/day, and ⩾1 serving/day (daily consumers).
To better estimate long-term consumption [22], we calculated the cumulative average intakes of SSB and diet soda using data from three Offspring cohort exam cycles (5th, 6th, and 7th) in 888 participants with imaging data and in 2029 participants with enzyme data, reflecting approximately 7 years of follow-up. Participants were categorized in the same way as described above. The cumulative average intake was not calculated for participants in the Gen3 cohort because dietary data were only available at one examination prior to MDCT scans.
Anthropometry and covariates assessment
Standard protocols were used in physical and medical examinations at each visit. Body mass index (BMI) was calculated as weight (kg) divided by height (m2). Physical activity level was calculated based on questionnaire-derived time and intensity of activities in a typical day [23]. Nutrient and food intakes were estimated using the FFQ as described above. The 2005 Dietary Guidelines Adherence Index (DGAI) was used to capture overall diet quality [24]. Fasting plasma glucose and serum lipids were measured after an overnight fast. Blood pressure was calculated as the mean of two blood pressures measured by a physician. Diabetes was defined as a fasting plasma glucose concentration ⩾7 mmol/L or self-reported use of diabetes medicines. Metabolic syndrome was defined according to the ATP III criteria [25].
Statistical analysis
Characteristics of participants who had liver imaging data were evaluated using least-squares means after adjustment for age and sex. Dietary characteristics were additionally adjusted for energy intake. A test for linear trend across categories of SSB intake was performed by assigning the median value of SSB intake to every individual in the category and treating this as a continuous independent variable in linear regression models for continuous response variables, or in logistic regression models for dichotomous response variables.
In the primary analysis using MDCT imaging data, the odd ratios (ORs) of fatty liver disease and least-squares means of LPR across SSB consumption categories were estimated using logistic regression and linear regression models, respectively. Model 1 was adjusted for the following covariates: age (y), sex, smoking status (non-smokers or current smokers), Framingham cohort (Offspring and Gen3), energy intake (kcal/d), alcohol intake (g/d), dietary fiber (g/d), dietary fat (% energy), dietary protein (% energy), and diet soda (serving/wk). Linear trends for both outcomes were tested across categories of SSB intake using the median value approach with adjustment for the same covariates. We further adjusted for BMI to test if associations may be independent of generalized adiposity. Finally, we examined whether VAT and SAT may confound the association between SSB and liver fat.
In secondary analyses, we repeated the above analyses using the cumulative average intake of SSB in the Offspring cohort. We also additionally examined whether diabetes might confound or modify the main association between SSB intake and liver fat. In addition, we tested whether sex, age, or BMI might modify the association between SSB intake and liver fat by including a product term of SSB intake and dichotomous variables of sex, age (< and ⩾ median age of 50 years), or BMI (<25 and ⩾25 kg/m2) in multiple regression models for linear trend. We examined whether the observed associations might be confounded by DGAI and physical activity level. We also examined the association between SSB intake and liver fat with adjustment for individual food intake (fruits, vegetables, whole grains, red meat, coffee, and nuts) and multivitamin use.
We conducted the same analyses as described above to examine the association between SSB intake and continuous and elevated ALT concentrations. We also conducted primary and secondary analyses for diet soda using the same imaging and enzyme data and same statistical approaches. In the analyses for diet soda, we adjusted for SSB intake. All statistical analyses were conducted using SAS statistical software (version 9.3; SAS Institute, Cary, North Carolina). A two-tailed p <0.05 was considered statistically significant, unless otherwise specified.
Results
Study sample characteristics
The prevalence of fatty liver in the study population was 17%. Overall, 34% of participants were non-consumers, and 12% were daily consumers of SSB. Among SSB consumers, caffeinated cola consumption was the largest contributor to SSB intake (40%), followed by non-carbonated fruit drinks (29%), carbonated non-cola beverages (21%), and caffeine-free cola (10%). Daily SSB consumers were more likely to be male, younger, current smokers, consume less alcohol, engage in slightly more physical activity, and have an overall less healthy diet as reflected by a lower DGAI compared to non-consumers (Table 1). Diet soda consumers were more likely to consume an overall less healthy diet and have hypertension and diabetes than non-consumers (Supplementary Table 1).
Table 1.
Characteristics of participants according to cross-sectional consumption of sugar-sweetened beverages.1
| Median consumption (servings/wk) | Non-consumers 0–1 serving/mo | Consumers | p value for trend | ||
|---|---|---|---|---|---|
| 1 serving/mo-<1 serving/wk | 1 serving/wk-<1 serving/d | ≥1 servings/d | |||
| 0 | 1 | 4 | 10 | ||
| n = 2634 | 899 | 941 | 466 | 328 | |
| Age (yr) | 52.9 (52.2, 53.5) | 51.0 (50.3, 51.6) | 50.4 (49.4, 51.3) | 48.0 (46.9, 49.2) | <0.001 |
| Women (%) | 67.6 (64.4, 70.7) | 53.4 (50.3, 56.5) | 35.4 (31.0, 39.7) | 32.9 (27.7, 38.1) | <0.001 |
| Current smoker (%) | 10.6 (8.4, 12.7) | 11.3 (9.2, 13.3) | 10.1 (7.2, 13.1) | 17.7 (14.2, 21.2) | 0.002 |
| Alcohol intake (g/d) | 7.5 (7.0, 8.1) | 8.1 (7.5, 8.6) | 7.1 (6.3, 7.8) | 5.8 (4.9, 6.8) | <0.001 |
| Multivitamin user (%) | 56.5 (53.1, 59.8) | 49.0 (45.8, 52.1) | 49.2 (44.7, 53.8) | 41.1 (35.5, 46.8) | <0.001 |
| Physical activity score | 37.0 (36.5, 37.5) | 37.6 (37.1, 38.0) | 37.2 (36.5, 37.8) | 38.9 (38.1, 39.7) | <0.001 |
| Education (%)2 | 48.2 (44.8, 51.5) | 49.9 (46.8, 53.1) | 48.9 (44.4, 53.5) | 37.2 (31.8, 42.6) | <0.001 |
| BMI (kg/m2) | 27.9 (27.6, 28.3) | 27.1 (26.7, 27.4) | 27.6 (27.1, 28.1) | 27.6 (27.0, 28.2) | 0.89 |
| Waist circumference (cm) | 97.1 (96.2, 98.0) | 94.9 (94.0, 95.7) | 96.8 (95.6, 98.1) | 96.6 (95.2, 98.1) | 0.50 |
| SAT (cm3)3 | 2985 (2893, 3076) | 2701 (2614, 2789) | 2845 (2721, 2970) | 2801 (2650, 2951) | 0.41 |
| VAT (cm3)3 | 1710 (1651, 1768) | 1655 (1599, 1710) | 1844 (1764, 1923) | 1825 (1729, 1920) | 0.002 |
| Hypertension (%) | 27.8 (25.0, 30.6) | 26.5 (23.8, 29.1) | 28.7 (24.9, 32.5) | 28.4 (23.8, 32.9) | 0.62 |
| Dyslipidemia (%) | 42.6 (39.4, 45.8) | 44.9 (41.8, 48.0) | 53.6 (49.2, 58.1) | 53.8 (48.5, 59.2) | <0.001 |
| Diabetes (%) | 8.1 (6.6, 9.6) | 4.3 (2.9, 5.8) | 3.4 (1.4, 5.5) | 4.9 (2.4, 7.3) | 0.07 |
| Impaired fasting glucose (%) | 25.7 (22.9, 28.6) | 23.0 (20.3, 25.7) | 23.1 (19.3, 27.0) | 27.6 (23.0, 32.2) | 0.32 |
| Energy intake (kcal/d) | 1779 (1741, 1818) | 1897 (1860, 1934) | 2068 (2015, 2121) | 2405 (2341, 2468) | <0.001 |
| Fat (%EI) | 32.6 (32.1, 33.0) | 31.8 (31.4, 32.2) | 31.6 (31.0, 32.2) | 30.6 (29.9, 31.3) | <0.001 |
| Carbohydrate (%EI) | 46.6 (46.1, 47.2) | 48.6 (48.1, 49.1) | 50.2 (49.4, 51.0) | 53.5 (52.6, 54.4) | <0.001 |
| Protein (%EI) | 19.6 (19.4, 19.8) | 18.2 (18.0, 18.4) | 17.3 (17.0, 17.6) | 15.6 (15.3, 15.9) | <0.001 |
| Dietary fiber (g/d)4 | 19.3 (18.9, 19.7) | 18.2 (17.8, 18.5) | 16.6 (16.2, 17.1) | 13.6 (13.1, 14.1) | <0.001 |
| Total sugar (g/d)4 | 87.0 (85.2, 88.9) | 97.2 (95.3, 99.2) | 111.8 (108.7, 115.1) | 135.0 (130.3, 139.9) | <0.001 |
| Whole grains (g/d)4 | 20.7 (19.6, 21.9) | 19.7 (18.7, 20.8) | 16.8 (15.6, 18.1) | 12.0 (10.9, 13.2) | <0.001 |
| Red meat (servings/d)4 | 0.7 (0.6, 0.7) | 0.7 (0.6, 0.7) | 0.7 (0.7, 0.8) | 0.8 (0.7, 0.8) | <0.001 |
| Fruit intake (servings/d)4 | 2.0 (1.9, 2.1) | 2.0 (1.9, 2.1) | 1.8 (1.7, 2.0) | 1.4 (1.2, 1.5) | <0.001 |
| Vegetables (servings/d)4 | 3.3 (3.2, 3.4) | 3.1 (3.0, 3.2) | 2.7 (2.6, 2.8) | 2.2 (2.1, 2.4) | <0.001 |
| Nuts (servings/d) | 1.7 (1.5, 1.9) | 1.1 (1.0, 1.3) | 0.8 (0.6, 1.1) | 0.5 (0.2, 0.7) | <0.001 |
| Diet soda (servings/wk) | 5.8 (5.2, 6.3) | 3.4 (2.9, 3.9) | 1.8 (1.1, 2.5) | 1.7 (0.8, 2.6) | <0.001 |
| DGAI5 | 9.7 (9.5, 9.9) | 9.4 (9.2, 9.5) | 8.6 (8.4, 8.9) | 8.0 (7.7, 8.3) | <0.001 |
Values are means and 95% CI.
Education level: college or above.
n = 2556 for VAT and SAT.
Geometric means and 95% CI.
DGAI: dietary guideline adherence index.
Association between SSB intake and fatty liver disease (imaging data)
As shown in Table 2, after multivariable adjustment, a dose-response relationship was observed between SSB consumption and fatty liver disease (p trend = 0.02) with an OR and 95% CI of fatty liver disease of 1.56 (1.03, 2.36) for daily consumers. Further adjustment for BMI and SAT did not modify the significant association. In contrast, additional adjustment for VAT substantially attenuated the observed association (p trend = 0.38). There was no significant interaction between SSB intake and sex, age, BMI, or diabetes status on fatty liver disease.
Table 2.
OR (95% CI) of fatty liver disease and least-square mean (95% CI) of measures of liver fat according to cross-sectional beverage consumption in 2634 adults.1
| Non-consumers 0–1 serving/mo | Consumers | p value for trend | |||
|---|---|---|---|---|---|
| 1 serving/mo-<1 serving/wk | 1 serving/wk-<1 serving/d | 1 servings/d | |||
| Sugar-sweetened beverages | |||||
| Median consumption (servings/wk) | 0 | 1 | 4 | 10 | |
| n | 899 | 941 | 466 | 328 | |
| Fatty liver disease (OR) | |||||
| Model 1 | 1 (Ref) | 1.05 (0.81, 1.37) | 1.28 (0.92, 1.78) | 1.56 (1.03, 2.36) | 0.02 |
| Model 1 + BMI | 1 (Ref) | 1.16 (0.88, 1.54) | 1.32 (0.93, 1.86) | 1.61 (1.04, 2.50) | 0.04 |
| Model 1 + SAT | 1 (Ref) | 1.20 (0.90, 1.59) | 1.41 (1.00, 1.99) | 1.66 (1.07, 2.58) | 0.03 |
| Model 1 + VAT | 1 (Ref) | 1.10 (0.82, 1.48) | 1.08 (0.75, 1.57) | 1.29 (0.80, 2.06) | 0.37 |
| Liver to phantom ratio (Mean) | |||||
| Model 1 | 36.3 (36.0, 36.5) | 36.1 (35.9, 36.4) | 35.7 (35.3, 36.0) | 35.7 (35.2, 36.2) | 0.05 |
| Model 1 + BMI | 36.3 (36.0, 36.6) | 36.0 (35.8, 36.3) | 35.8 (35.4, 36.1) | 35.8 (35.3, 36.3) | 0.11 |
| Model 1 + SAT | 36.3 (36.1, 36.6) | 36.1 (35.8, 36.3) | 35.7 (35.4, 36.1) | 35.8 (35.4, 36.3) | 0.11 |
| Model 1 + VAT | 36.2 (35.9, 36.4) | 36.0 (35.8, 36.3) | 36.0 (35.6, 36.3) | 36.1 (35.6, 36.5) | 0.77 |
| Diet soda | |||||
| Median consumption (servings/wk) | 0 | 1 | 4 | 13 | |
| n | 1233 | 543 | 402 | 456 | |
| Fatty liver disease (OR) | |||||
| Model 1 | 1 (Ref) | 1.16 (0.88, 1.53) | 1.39 (1.04, 1.87) | 1.44 (1.08, 1.91) | 0.01 |
| Model 1 + BMI | 1 (Ref) | 1.02 (0.76, 1.36) | 1.12 (0.82, 1.54) | 0.91 (0.66, 1.24) | 0.52 |
| Model 1 + SAT | 1 (Ref) | 1.09 (0.81, 1.46) | 1.18 (0.86, 1.62) | 0.99 (0.73, 1.35) | 0.86 |
| Model 1 + VAT | 1 (Ref) | 1.03 (0.76, 1.41) | 1.13 (0.81, 1.57) | 0.85 (0.61, 1.19) | 0.31 |
| Liver to phantom ratio (Mean) | |||||
| Model 1 | 36.3 (36.1, 36.5) | 36.1 (35.8, 36.5) | 35.8 (35.4, 36.1) | 35.6 (35.2, 35.9) | 0.006 |
| Model 1 + BMI | 36.1 (35.9, 36.3) | 36.1 (35.8, 36.4) | 35.9 (35.5, 36.3) | 36.0 (35.7, 36.4) | 0.68 |
| Model 1 + SAT | 36.2 (35.9, 36.4) | 36.1 (35.8, 36.5) | 35.9 (35.5, 36.3) | 35.9 (35.6, 36.3) | 0.25 |
| Model 1 + VAT | 36.1 (35.9, 36.3) | 36.1 (35.8, 36.4) | 36.0 (35.6, 36.3) | 36.1 (35.8, 36.4) | 0.99 |
Model 1 was adjusted for age, sex, energy intake, alcohol intake, dietary fiber, dietary fat (% energy), dietary protein (% energy), sugar-sweetened beverages or diet soda, smoking, and Framingham cohort. The sample size was 2566 adults in model with adjustment for VAT or SAT.
SSB consumption was marginally associated with LPR in the overall study sample (p trend = 0.05). However, a significant interaction was observed between SSB consumption and BMI status on LPR (p interaction = 0.004, Fig. 1). In overweight and obese participants (BMI ⩾25 kg/m2), we observed that SSB intake was inversely associated with LPR, p-trend = 0.03. In contrast, no significant association was observed between SSB intake and LPR in normal weight participants (BMI <25 kg/m2), p trend = 0.56. Similarly, the significant association in overweight and obese participants was attenuated to non-significant after additional adjustment for VAT (p trend = 0.37) but not for SAT.
Fig. 1.
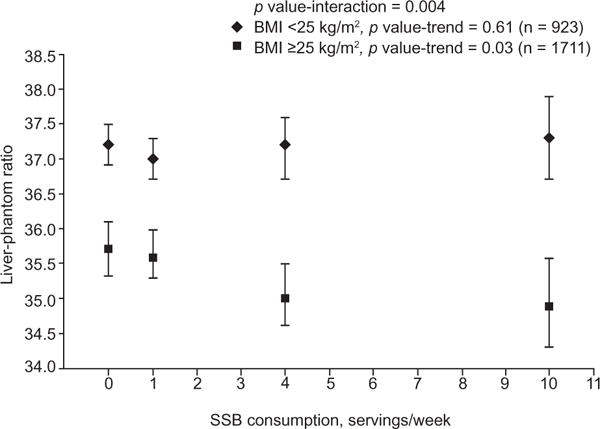
BMI-stratified associations between sugar-sweetened beverage intake and liver-phantom ratio. Symbols are means and 95% CI. Diamonds represent BMI <25 kg/m2 and squares represent BMI ⩾25 kg/m2. Models were adjusted for age, gender, Framingham cohort, energy intake, alcohol intake, dietary fiber, dietary fat (% of energy), dietary protein (% energy), diet soda intake, smoking status, and BMI. SSB: Sugar-sweetened beverages.
In the secondary analyses, the associations between SSB intake and fatty liver disease and LPR remained similar after additional adjustment for physical activity and DGAI or individual foods and multivitamin use. There was no significant interaction between SSB intake and sex, age, or diabetes status. We observed similar statistical associations using cumulative average SSB intake (Supplementary Fig. 1).
Association between SSB intake and ALT concentrations
After adjustment for multiple covariates, we observed a significant positive dose-response relationship between SSB intake and continuous ALT levels (p trend = 0.001, Table 3). SSB consumption was also positively associated with the prevalence of elevated ALT levels (p trend <0.001). Further adjustment for BMI or diabetes did not substantially alter the observed statistical associations. The observed association was also similar in analyses using cumulative average SSB intake (Supplementary Fig. 1).
Table 3.
Geometric mean (95% CI) of ALT concentrations (U/L) and odds ratio (95% CI) of elevated ALT according to cross-sectional beverage consumption in 5908 adults.1,2
| Non-consumers 0-1 serving/mo | Consumers | p value for trend | |||
|---|---|---|---|---|---|
| 1 serving/mo-<1 serving/wk | 1 serving/wk-<1 serving/d | ≥1 servings/d | |||
| Sugar-sweetened beverages | |||||
| Median consumption (servings/wk) | 0 | 1 | 4 | 10 | |
| n | 1991 | 2044 | 1036 | 837 | |
| Elevated ALT (OR) | |||||
| Model 1 | 1 (Ref) | 0.92 (0.80, 1.06) | 1.16 (0.97, 1.38) | 1.36 (1.09, 1.70) | <0.001 |
| Model 1 + BMI | 1 (Ref) | 0.93 (0.81, 1.08) | 1.14 (0.95, 1.37) | 1.30 (1.04, 1.63) | 0.002 |
| Continuous ALT (Mean) | |||||
| Model 1 | 20.9 (20.4, 21.3) | 20.4 (20.0, 20.8) | 21.3 (20.7, 21.8) | 22.1 (21.3, 22.9) | 0.001 |
| Model 1 + BMI | 20.9 (20.5, 21.4) | 20.5 (20.1, 20.9) | 21.2 (20.7, 21.8) | 21.8 (21.1, 22.6) | 0.007 |
| Diet soda | |||||
| Median consumption (servings/wk) | 0 | 1 | 4 | 14 | |
| n | 2718 | 1162 | 922 | 1106 | |
| Elevated ALT (OR) | |||||
| Model 1 | 1 (Ref) | 1.22 (1.05, 1.41) | 1.17 (1.00, 1.38) | 1.39 (1.20, 1.61) | <0.001 |
| Model 1 + BMI | 1 (Ref) | 1.12 (0.96, 1.30) | 1.03 (0.88, 1.22) | 1.10 (0.94, 1.29) | 0.39 |
| Continuous ALT (Mean) | |||||
| Model 1 | 20.4 (20.1, 20.8) | 21.2 (20.6, 21.7) | 21.3 (20.7, 21.9) | 21.7 (21.2, 22.3) | <0.001 |
| Model 1 + BMI | 20.8 (20.5, 21.2) | 21.1 (20.6, 21.7) | 21.0 (20.5, 21.6) | 21.0 (20.4, 21.5) | 0.87 |
Model 1 was adjusted for age, sex, energy intake, alcohol intake, dietary fiber, dietary fat (% energy), dietary protein (% energy), sugar-sweetened beverage or diet soda, smoking, and Framingham cohort.
Cut-off points for dichotomous ALT were 19 U/L for women and 30 U/L for men.
Associations between diet soda intake and measures of liver fat
A significant positive association was observed between diet soda and fatty liver disease and LPR in model 1 (Table 2). However, after adjustment for BMI, all associations were attenuated and no longer statistically significant. A similar relationship was also observed between diet soda consumption and ALT concentrations (Table 3). The secondary analyses and analyses using cumulative average to measure intake of diet soda yielded similar results, as well. Sex, age, BMI, and diabetes status did not modify the observed associations for diet soda.
Discussion
In this large, cross-sectional study of middle-aged adults, we observed a significant dose-response relationship between SSB and fatty liver disease, with a 56% increased risk of fatty liver disease in daily consumers of SSB compared to non-SSB consumers. We also observed that SSB consumers had a significantly higher liver fat content among overweight and obese individuals but not among normal weight participants. In addition, SSB consumption was positively associated with ALT levels. In contrast, we observed no significant association between diet soda intake and either liver fat or ALT levels after controlling for potential confounders including BMI.
In the present study, we observed that the overall association between SSB intake and liver fat was independent of BMI and abdominal SAT; however, further adjustment for VAT attenuated the observed associations, suggesting that VAT may, in part, mediate this association. In the same cohort, we have previously reported a positive association between SSB intake and VAT and the deposition of VAT relative to SAT [26]. Our observations in the present study are in line with one small cross-sectional analysis of 349 individuals [27] and two small case-control studies [28,29]. These studies observed that, independent of overall adiposity, individuals with NAFLD consumed more SSB compared to controls without fatty liver. Currently, there is no prospective observational data on the relationship between added sugar intake and liver fat accumulation, and further studies are warranted to establish temporality of the relationship.
As far as we are aware, long-term randomized controlled trials examining the consumption of sucrose or high fructose corn syrup on the development of fatty liver disease are limited. In a randomized controlled intervention study in 47 overweight adults, Maersk et al. observed that daily consumption of sucrose-sweetened beverage (1 L/d) under ad libitum conditions for 6 months led to a greater increase in liver fat accumulation compared to the same levels of diet soda and water consumption [30]. In a ten week intervention, Bravo et al. observed that substituting 8%, 18%, or 30% of the energy required for weight maintenance with sucrose or high fructose corn syrup did not significantly alter liver fat [31]. One study that was conducted in a sample of obese children showed that self-reported reduction of added sugar intake by 26% over 16 weeks had no effect on CT measured liver fat volume [32]. Albeit limited, these findings suggest that liver fat accumulation is likely affected only when excess sugar is consumed under conditions of surplus energy intake.
Several mechanisms by which fructose may promote hepatic fat accumulation have been proposed. Fructose is primarily metabolized in the liver, where it converts to pyruvate/acetyl CoA and then provides substrate for de novo synthesis of fatty acids [33]; this pathway is not regulated by the main rate-limiting enzyme for glycolysis, phosphofructokinase [34]. Fructose may also stimulate sterol receptor element binding protein 1c (SREBP-1c) [35] and carbohydrate response element binding protein (ChREBP) [36], two key transcription factors for lipogenesis. An alternative pathway may involve fructose inhibiting fatty acid catabolism by reducing activity of β-oxidation in liver [33,37]. It also has been hypothesized that the intermediate products, such as diacyglycerols generated when fructose is converted to triglycerides, may trigger insulin resistance [38] and, subsequently, induce fat accumulation in the liver [39]. Several studies have shown that SSB intake may increase the risk of hyperuricemia in humans through drastic depletion of adenosine triphosphate (ATP) [40,41], and this may subsequently elevate ALT levels. It should be noted that the underlying mechanisms for the observed association of SSB consumption and ALT levels may not depend on liver fat accumulation alone, because increased ALT also signifies the presence of hepatic inflammation. Glucose is another major component of added sugars in SSB. Lanasap et al. recently showed that glucose may convert to fructose through the polyol pathway in the liver and promote fatty liver accumulation [42]. Also, McDevitt et al. showed excessive glucose intake promoted de novo lipogenesis to the same extent as fructose overfeeding [43]. However, given the cross-sectional nature of the present study, it is impossible to ascertain the potential role of these proposed mechanisms.
The strengths of our study include the utilization of comprehensive dietary, lifestyle, and clinical data collected in a well-designed subgroup of the Framingham Heart Study. Liver fat was measured using a precise technique, and MDCT-derived quantitative data are both highly reproducible and highly specific. In the present study, a cumulative average intake was estimated to reflect habitual intake, which may account for misclassification to some extent. With respect to limitations, the cross-sectional and observational design of this study limits our ability to infer temporality or causality between beverage consumption and liver fat accumulation. Future prospective studies measuring the long-term change of liver fat may help to establish the temporal relationship and to evaluate the potential long-term association of sugar intake on liver fat. Although we observed a statistically significant association between SSB intake and LPR (liver fat volume) and ALT levels, the differences in LPR and ALT values between the high and low SSB consumers were small and have limited clinical implications. However, the current study observed the prevalence of fatty liver disease and elevated ALT levels were 56% and 36% higher in SSB daily consumers compared with non-consumers. Nevertheless, ALT is only a crude marker of hepatic steatosis or steatohepatitis as many individuals with biopsy-proved steatosis or steatohepatitis had normal ALT levels [1]. We do not have data available for alternative causes of fatty liver disease such as viral hepatitis or medications (e.g., steroids and tamoxifen); however, we believe the prevalence of such conditions to be relatively low in our study sample. The prevalence of fatty liver disease in our study sample is lower than that observed (~30%) in other general populations in the US, perhaps due to the different sensitivity of liver fat assessment tools and/or variation in study sample characteristics [44]. Nevertheless, we observed the prevalence of fatty liver was significantly greater in daily SSB consumers compared to non-consumers. As such, the relatively low prevalence of fatty liver disease in our study sample may not have any notable influence on the interpretation from our analyses. Understanding the role of added fructose in the etiology of fatty liver disease is of great interest from a public health perspective. However, we only can postulate that added fructose may play a role in fatty liver disease etiology because lack of information on added fructose for multi-ingredient foods in nutrient database does not allow us to separate out added fructose from total fructose, and the analyses using total fructose intake are likely confounded by consumption of fruits and vegetables. The consumption of low calorie and artificially sweetened, non-carbonated beverages was not captured using the FFQ. However, diet soda is likely to be the major beverage containing artificial sweeteners and is estimated to account for approximately 90% of aspartame used in all foods [45]. In addition, although we adjusted for a variety of dietary and lifestyle factors, residual confounding cannot be ruled out. Finally, the majority of our study population is middle-aged and Caucasian, which may minimize confounding from race/ethnicity and socioeconomic factors but limits the generalizability of results to other populations.
Conclusions
Whether sugar intake may have specific effects on the development of fatty liver disease, particularly after long-term consumption, is not yet fully understood. The present study contributes to the existing literature by illustrating that regular consumption of SSB is associated with greater prevalence of fatty liver disease, particularly in overweight and obese individuals. These cross-sectional data provide further evidence to support the association between habitual SSB consumption and increased cardiometabolic risk [46]; however, prospective observational studies and controlled intervention studies are required to determine the independent association of excess SSB intake on liver fat accumulation.
Supplementary Material
Acknowledgments
The authors thank Kara Livingston (Nutrition Epidemiology Department, Jean Mayer USDA Human Nutrition Research Center on Aging at Tufts University) for editing the manuscript and Gail Rogers (Nutrition Epidemiology Department, Jean Mayer USDA Human Nutrition Research Center on Aging at Tufts University) for her review of the statistical code.
Financial support
This project has been funded by the NIH/NHLBI’s Framingham Heart Study (Contract N01-HC-25195); the Boston University School of Medicine; and the United States Department of Agriculture, Agricultural Research Service (USDA Agreement No. 58-1950-0-014). C.E.S was supported by the NIH K08 award (HL112845).
Abbreviations
- ALT
alanine transaminase
- FFQ
food frequency questionnaire
- LPR
liver to phantom ratio
- MDCT
multidetector computed tomography
- NAFLD
nonalcoholic fatty liver disease
- SAT
abdominal subcutaneous adipose tissue
- SSB
sugar-sweetened beverage
- VAT
visceral adipose tissue
Footnotes
Conflict of interest
The authors who have taken part in this study declared that they do not have anything to disclose regarding funding or conflict of interest with respect to this manuscript.
Authors’ contributions
N.M.M. designed the analysis; J.M. analyzed the data and wrote the manuscript; C.S.F. and U.H. provided the measures of adiposity; N.M.M., C.S.F., P.F.J., E.K.S., C.E.S., and E.S. provided critical editorial comments; N.M.M. had primary responsibility for the final content. All authors read and approved the final manuscript.
Supplementary data
Supplementary data associated with this article can be found, in the online version, at http://dx.doi.org/10.1016/j.jhep.2015.03.032.
References
- 1.Chalasani N, Younossi Z, Lavine JE, Diehl AM, Brunt EM, Cusi K, et al. The diagnosis and management of non-alcoholic fatty liver disease: practice Guideline by the American Association for the Study of Liver Diseases, American College of Gastroenterology, and the American Gastroenterological Association. Hepatology. 2012;55:2005–2023. doi: 10.1002/hep.25762. [DOI] [PubMed] [Google Scholar]
- 2.Angulo P. Nonalcoholic fatty liver disease. N Engl J Med. 2002;346:1221–1231. doi: 10.1056/NEJMra011775. [DOI] [PubMed] [Google Scholar]
- 3.Speliotes EK, Massaro JM, Hoffmann U, Vasan RS, Meigs JB, Sahani DV, et al. Fatty liver is associated with dyslipidemia and dysglycemia independent of visceral fat: the Framingham Heart Study. Hepatology. 2010;51:1979–1987. doi: 10.1002/hep.23593. [DOI] [PMC free article] [PubMed] [Google Scholar]
- 4.Targher G, Day CP, Bonora E. Risk of cardiovascular disease in patients with nonalcoholic fatty liver disease. N Engl J Med. 2010;363:1341–1350. doi: 10.1056/NEJMra0912063. [DOI] [PubMed] [Google Scholar]
- 5.McCullough AJ. The clinical features, diagnosis and natural history of nonalcoholic fatty liver disease. Clin Liver Dis. 2004;8:521–533, viii. doi: 10.1016/j.cld.2004.04.004. [DOI] [PubMed] [Google Scholar]
- 6.Cohen JC, Horton JD, Hobbs HH. Human fatty liver disease: old questions and new insights. Science. 2011;332:1519–1523. doi: 10.1126/science.1204265. [DOI] [PMC free article] [PubMed] [Google Scholar]
- 7.Lim JS, Mietus-Snyder M, Valente A, Schwarz JM, Lustig RH. The role of fructose in the pathogenesis of NAFLD and the metabolic syndrome. Nat Rev Gastroenterol Hepatol. 2010;7:251–264. doi: 10.1038/nrgastro.2010.41. [DOI] [PubMed] [Google Scholar]
- 8.Theytaz F, Noguchi Y, Egli L, Campos V, Buehler T, Hodson L, et al. Effects of supplementation with essential amino acids on intrahepatic lipid concentrations during fructose overfeeding in humans. Am J Clin Nutr. 2012;96:1008–1016. doi: 10.3945/ajcn.112.035139. [DOI] [PubMed] [Google Scholar]
- 9.Le KA, Ith M, Kreis R, Faeh D, Bortolotti M, Tran C, et al. Fructose overconsumption causes dyslipidemia and ectopic lipid deposition in healthy subjects with and without a family history of type 2 diabetes. Am J Clin Nutr. 2009;89:1760–1765. doi: 10.3945/ajcn.2008.27336. [DOI] [PubMed] [Google Scholar]
- 10.Johnston RD, Stephenson MC, Crossland H, Cordon SM, Palcidi E, Cox EF, et al. No difference between high-fructose and high-glucose diets on liver triacylglycerol or biochemistry in healthy overweight men. Gastroenterology. 2013;145:e1012. doi: 10.1053/j.gastro.2013.07.012. [DOI] [PubMed] [Google Scholar]
- 11.Silbernagel G, Machann J, Unmuth S, Schick F, Stefan N, Haring HU, et al. Effects of 4-week very-high-fructose/glucose diets on insulin sensitivity, visceral fat and intrahepatic lipids: an exploratory trial. Br J Nutr. 2011;106:79–86. doi: 10.1017/S000711451000574X. [DOI] [PubMed] [Google Scholar]
- 12.Welsh JA, Sharma AJ, Grellinger L, Vos MB. Consumption of added sugars is decreasing in the United States. Am J Clin Nutr. 2011;94:726–734. doi: 10.3945/ajcn.111.018366. [DOI] [PMC free article] [PubMed] [Google Scholar]
- 13.Kannel WB, Feinleib M, McNamara PM, Garrison RJ, Castelli WP. An investigation of coronary heart disease in families. The Framingham offspring study. Am J Epidemiol. 1979;110:281–290. doi: 10.1093/oxfordjournals.aje.a112813. [DOI] [PubMed] [Google Scholar]
- 14.Splansky GL, Corey D, Yang Q, Atwood LD, Cupples LA, Benjamin EJ, et al. The Third Generation Cohort of the National Heart, Lung, and Blood Institute’s Framingham Heart Study: design, recruitment, and initial examination. Am J Epidemiol. 2007;165:1328–1335. doi: 10.1093/aje/kwm021. [DOI] [PubMed] [Google Scholar]
- 15.Speliotes EK, Massaro JM, Hoffmann U, Foster MC, Sahani DV, Hirschhorn JN, et al. Liver fat is reproducibly measured using computed tomography in the Framingham Heart Study. J Gastroenterol Hepatol. 2008;23:894–899. doi: 10.1111/j.1440-1746.2008.05420.x. [DOI] [PMC free article] [PubMed] [Google Scholar]
- 16.Porter SA, Pedley A, Massaro JM, Vasan RS, Hoffmann U, Fox CS. Aminotransferase levels are associated with cardiometabolic risk above and beyond visceral fat and insulin resistance: the Framingham Heart Study. Arterioscler Thromb Vasc Biol. 2013;33:139–146. doi: 10.1161/ATVBAHA.112.300075. [DOI] [PMC free article] [PubMed] [Google Scholar]
- 17.Maurovich-Horvat P, Massaro J, Fox CS, Moselewski F, O’Donnell CJ, Hoffmann U. Comparison of anthropometric, area- and volume-based assessment of abdominal subcutaneous and visceral adipose tissue volumes using multi-detector computed tomography. Int J Obes. 2007;31:500–506. doi: 10.1038/sj.ijo.0803454. [DOI] [PubMed] [Google Scholar]
- 18.Prati D, Taioli E, Zanella A, Della Torre E, Butelli S, Del Vecchio E, et al. Updated definitions of healthy ranges for serum alanine aminotransferase levels. Ann Intern Med. 2002;137:1–10. doi: 10.7326/0003-4819-137-1-200207020-00006. [DOI] [PubMed] [Google Scholar]
- 19.Rimm EB, Giovannucci EL, Stampfer MJ, Colditz GA, Litin LB, Willett WC. Reproducibility and validity of an expanded self-administered semiquantitative food frequency questionnaire among male health professionals. Am J Epidemiol. 1992;135:1114–1126. doi: 10.1093/oxfordjournals.aje.a116211. Discussion 1127–1136. [DOI] [PubMed] [Google Scholar]
- 20.Feskanich D, Rimm EB, Giovannucci EL, Colditz GA, Stampfer MJ, Litin LB, et al. Reproducibility and validity of food intake measurements from a semiquantitative food frequency questionnaire. J Am Diet Assoc. 1993;93:790–796. doi: 10.1016/0002-8223(93)91754-e. [DOI] [PubMed] [Google Scholar]
- 21.Salvini S, Hunter DJ, Sampson L, Stampfer MJ, Colditz GA, Rosner B, et al. Food-based validation of a dietary questionnaire: the effects of week-to-week variation in food consumption. Int J Epidemiol. 1989;18:858–867. doi: 10.1093/ije/18.4.858. [DOI] [PubMed] [Google Scholar]
- 22.Hu FB, Stampfer MJ, Rimm E, Ascherio A, Rosner BA, Spiegelman D, et al. Dietary fat and coronary heart disease: a comparison of approaches for adjusting for total energy intake and modeling repeated dietary measurements. Am J Epidemiol. 1999;149:531–540. doi: 10.1093/oxfordjournals.aje.a009849. [DOI] [PubMed] [Google Scholar]
- 23.Kannel WB, Belanger A, D’Agostino R, Israel I. Physical activity and physical demand on the job and risk of cardiovascular disease and death: the Framingham Study. Am Heart J. 1986;112:820–825. doi: 10.1016/0002-8703(86)90480-1. [DOI] [PubMed] [Google Scholar]
- 24.Fogli-Cawley JJ, Dwyer JT, Saltzman E, McCullough ML, Troy LM, Jacques PF. The 2005 Dietary Guidelines for Americans Adherence Index: development and application. J Nutr. 2006;136:2908–2915. doi: 10.1093/jn/136.11.2908. [DOI] [PubMed] [Google Scholar]
- 25.Grundy SM, Cleeman JI, Daniels SR, Donato KA, Eckel RH, Franklin BA, et al. Diagnosis and management of the metabolic syndrome: an American Heart Association/National Heart, Lung, and Blood Institute Scientific Statement. Circulation. 2005;112:2735–2752. doi: 10.1161/CIRCULATIONAHA.105.169404. [DOI] [PubMed] [Google Scholar]
- 26.Ma J, Sloan M, Fox CS, Hoffmann U, Smith CE, Saltzman E, et al. Sugar-sweetened beverage consumption is associated with abdominal fat partitioning in healthy adults. J Nutr. 2014;144:1283–1290. doi: 10.3945/jn.113.188599. [DOI] [PMC free article] [PubMed] [Google Scholar]
- 27.Zelber-Sagi S, Nitzan-Kaluski D, Goldsmith R, Webb M, Blendis L, Halpern Z, et al. Long term nutritional intake and the risk for non-alcoholic fatty liver disease (NAFLD): a population based study. J Hepatol. 2007;47:711–717. doi: 10.1016/j.jhep.2007.06.020. [DOI] [PubMed] [Google Scholar]
- 28.Abid A, Taha O, Nseir W, Farah R, Grosovski M, Assy N. Soft drink consumption is associated with fatty liver disease independent of metabolic syndrome. J Hepatol. 2009;51:918–924. doi: 10.1016/j.jhep.2009.05.033. [DOI] [PubMed] [Google Scholar]
- 29.Assy N, Nasser G, Kamayse I, Nseir W, Beniashvili Z, Djibre A, et al. Soft drink consumption linked with fatty liver in the absence of traditional risk factors. Can J Gastroenterol. 2008;22:811–816. doi: 10.1155/2008/810961. [DOI] [PMC free article] [PubMed] [Google Scholar]
- 30.Maersk M, Belza A, Stodkilde-Jorgensen H, Ringgaard S, Chabanova E, Thomsen H, et al. Sucrose-sweetened beverages increase fat storage in the liver, muscle, and visceral fat depot: a 6-mo randomized intervention study. Am J Clin Nutr. 2012;95:283–289. doi: 10.3945/ajcn.111.022533. [DOI] [PubMed] [Google Scholar]
- 31.Bravo S, Lowndes J, Sinnett S, Yu Z, Rippe J. Consumption of sucrose and high-fructose corn syrup does not increase liver fat or ectopic fat deposition in muscles. Appl Physiol Nutr Metab. 2013;38:681–688. doi: 10.1139/apnm-2012-0322. [DOI] [PubMed] [Google Scholar]
- 32.Hasson RE, Adam TC, Davis JN, Kelly LA, Ventura EE, Byrd-Williams CE, et al. Randomized controlled trial to improve adiposity, inflammation, and insulin resistance in obese African-American and Latino youth. Obesity. 2012;20:811–818. doi: 10.1038/oby.2010.343. [DOI] [PMC free article] [PubMed] [Google Scholar]
- 33.Hallfrisch J. Metabolic effects of dietary fructose. FASEB J. 1990;4:2652–2660. doi: 10.1096/fasebj.4.9.2189777. [DOI] [PubMed] [Google Scholar]
- 34.Mayes PA. Intermediary metabolism of fructose. Am J Clin Nutr. 1993;58:754S–765S. doi: 10.1093/ajcn/58.5.754S. [DOI] [PubMed] [Google Scholar]
- 35.Nagai Y, Nishio Y, Nakamura T, Maegawa H, Kikkawa R, Kashiwagi A. Amelioration of high fructose-induced metabolic derangements by activation of PPARalpha. Am J Physiol Endocrinol Metab. 2002;282:E1180–E1190. doi: 10.1152/ajpendo.00471.2001. [DOI] [PubMed] [Google Scholar]
- 36.Uyeda K, Repa JJ. Carbohydrate response element binding protein, ChREBP, a transcription factor coupling hepatic glucose utilization and lipid synthesis. Cell Metab. 2006;4:107–110. doi: 10.1016/j.cmet.2006.06.008. [DOI] [PubMed] [Google Scholar]
- 37.Roglans N, Vila L, Farre M, Alegret M, Sanchez RM, Vazquez-Carrera M, et al. Impairment of hepatic Stat-3 activation and reduction of PPARalpha activity in fructose-fed rats. Hepatology. 2007;45:778–788. doi: 10.1002/hep.21499. [DOI] [PubMed] [Google Scholar]
- 38.Badin PM, Louche K, Mairal A, Liebisch G, Schmitz G, Rustan AC, et al. Altered skeletal muscle lipase expression and activity contribute to insulin resistance in humans. Diabetes. 2011;60:1734–1742. doi: 10.2337/db10-1364. [DOI] [PMC free article] [PubMed] [Google Scholar]
- 39.Despres JP. Body fat distribution and risk of cardiovascular disease: an update. Circulation. 2012;126:1301–1313. doi: 10.1161/CIRCULATIONAHA.111.067264. [DOI] [PubMed] [Google Scholar]
- 40.Choi JW, Ford ES, Gao X, Choi HK. Sugar-sweetened soft drinks, diet soft drinks, and serum uric acid level: the Third National Health and Nutrition Examination Survey. Arthritis Rheum. 2008;59:109–116. doi: 10.1002/art.23245. [DOI] [PubMed] [Google Scholar]
- 41.Gao X, Qi L, Qiao N, Choi HK, Curhan G, Tucker KL, et al. Intake of added sugar and sugar-sweetened drink and serum uric acid concentration in US men and women. Hypertension. 2007;50:306–312. doi: 10.1161/HYPERTENSIONAHA.107.091041. [DOI] [PubMed] [Google Scholar]
- 42.Lanaspa MA, Ishimoto T, Li N, Cicerchi C, Orlicky DJ, Ruzicky P, et al. Endogenous fructose production and metabolism in the liver contributes to the development of metabolic syndrome. Nat Commun. 2013;4:2434. doi: 10.1038/ncomms3434. [DOI] [PMC free article] [PubMed] [Google Scholar]
- 43.McDevitt RM, Bott SJ, Harding M, Coward WA, Bluck LJ, Prentice AM. De novo lipogenesis during controlled overfeeding with sucrose or glucose in lean and obese women. Am J Clin Nutr. 2001;74:737–746. doi: 10.1093/ajcn/74.6.737. [DOI] [PubMed] [Google Scholar]
- 44.Browning JD, Szczepaniak LS, Dobbins R, Nuremberg P, Horton JD, Cohen JC, et al. Prevalence of hepatic steatosis in an urban population in the United States: impact of ethnicity. Hepatology. 2004;40:1387–1395. doi: 10.1002/hep.20466. [DOI] [PubMed] [Google Scholar]
- 45.Schernhammer ES, Bertrand KA, Birmann BM, Sampson L, Willett WC, Feskanich D. Consumption of artificial sweetener- and sugar-containing soda and risk of lymphoma and leukemia in men and women. Am J Clin Nutr. 2012;96:1419–1428. doi: 10.3945/ajcn.111.030833. [DOI] [PMC free article] [PubMed] [Google Scholar]
- 46.Malik VS, Popkin BM, Bray GA, Despres JP, Hu FB. Sugar-sweetened beverages, obesity, type 2 diabetes mellitus, and cardiovascular disease risk. Circulation. 2010;121:1356–1364. doi: 10.1161/CIRCULATIONAHA.109.876185. [DOI] [PMC free article] [PubMed] [Google Scholar]
Associated Data
This section collects any data citations, data availability statements, or supplementary materials included in this article.