Abstract
Magnetic Resonance Imaging (MRI) is a commonly used, non-invasive imaging technique that provides visualization of soft tissues with high spatial resolution. In both a research and clinical setting, the major challenge has been identifying a non-invasive and safe method for longitudinal tracking of delivered cells in vivo. The labeling and tracking of contrast agent labeled cells using MRI has the potential to fulfill this need. Contrast agents are often used to enhance the image contrast between the tissue of interest and surrounding tissues with MRI. The most commonly used MRI contrast agents contain Gd(III) ions. However, Gd(III) ions are highly toxic in their ionic form, as they tend to accumulate in the liver, spleen, kidney and bones and block calcium channels. Endohedral metallofullerenes such as trimetallic nitride endohedral metallofullerenes (Trimetasphere®) are one unique class of fullerene molecules where a Gd3N cluster is encapsulated inside a C80 carbon cage referred to as Gd3N@C80. These endohedral metallofullerenes have several advantages over small chelated Gd(III) complexes such as increased stability of the Gd(III) ion, minimal toxic effects, high solubility in water and high proton relativity. In this study, we describe the evaluation of gadolinium-based Trimetasphere® positive contrast agent for the in vitro labeling and in vivo tracking of human amniotic fluid-derived stem cells within lung tissue. In addition, we conducted a ‘proof-of-concept’ experiment demonstrating that this methodology can be used to track the homing of stem cells to injured lung tissue and provide longitudinal analysis of cell localization over an extended time course.
Keywords: Magnetic resonance imagining, Gadolinium, Contrast agent, Endohedral metallofullerenes, Cell tracking, Lung disease
1. Introduction
Magnetic Resonance Imaging (MRI) is a commonly used, non-invasive medical imaging technique that can provide high spatial resolution within soft tissue. This high contrast resolution is especially useful in imaging brain, muscles, heart, and other soft tissues within close proximity to each other. MRI utilizes the property of nuclear magnetic resonance (NMR) to image nuclei of atoms inside the body [1]. A strong magnetic field causes a small excess fraction of nuclei of the tissue being imaged to align themselves with the magnetic field [2]. A varying electromagnetic field is then applied, and changes to the state of nuclei energy produces a radio frequency signal, which can be measured with receiver coils. MRI is the preferred imaging modality over nuclear imaging methods such as positron emission tomography (PET) and single photon emission computed tomography (CT), because MRI does not use ionizing radiation and provides an excellent soft tissue contrast, field of imaging, and functional information [3].
One area where MRI is finding increased application is in the field of cellular therapy, which involves the therapeutic application of autologous or allogeneic cells to treat disease. Currently diverse cell types such as mesenchymal stem cells, perinatal stem cells, embryonic and induced pluripotent stem cells are being applied in both the research and clinical settings to treat diseases ranging from degenerative eye disease [4,5] to idiopathic pulmonary fibrosis [6]. In the research setting, the fate of the transplanted cells within an animal model are often evaluated at various time-points following euthanasia using techniques such as antibody staining and histology. However, in the clinical setting a major challenge has been identifying a non-invasive and safe method for longitudinal tracking of delivered cells. With widespread clinical translation of cellular therapies (>100 new clinical trails reported each year), methodologies to track administered cells in vivo are of increasing importance. The labeling and tracking of contrast agent-labeled cells using MRI has the potential to fulfill this need.
Contrast agents such as iron oxide [7], gadolinium [8] and metalloproteins [9] are commonly used to increase the MR contrast of biological structures. These agents function by X-ray attenuation or magnetic resonance signal enhancement by highlighting tissues or cells that otherwise would be difficult to delineate from their surroundings. Generally, contrast agents are divided into two types; those that can selectively enhance contrast either by shortening the longitudinal (T1) relaxation rate of the surrounding water protons, thus producing a brighter/hyper-intense contrasting signal, or by shortening the transverse (T2) relaxation rate, producing a darker/hypo-intense contrasting signal [10]. MRI contrast agents are generally categorized as T1 and T2 contrast agents based on their magnetic properties and relaxation mechanisms. Negative contrast agents have several disadvantages: (1) it is hard to distinguish the void from the contrast agent from other signal voids such as air within the lungs or from other artifacts from the presence of metals or calcium, (2) The resolution of the image influences the void detection. Finally, (3) signal loss from the negative contrast agent such as in the case of iron oxides renders it problematic to differentiate labeled cells from low signal in the tissue and hence negative contrast agents are not preferred to track cells in vivo [11,12].
The most commonly used MRI contrast agents are gadolinium-based contrast agents (GBCA) [13]. GBCA are the only FDA approved positive contrast agents for use with MRI. Gadolinium (Gd(III)) ions are paramagnetic metal ions that have the ability to form induced magnetic fields in the direction of the externally applied magnetic field, rendering them favorable for imaging soft tissues. GBCAs have several desirable properties such as high paramagnetism, relaxation enhancement and relatively high stability. GBCAs are generally used as T1 contrast agents that generate a positive image contrast [10]. However, Gd(III) ions cannot be administered in their ionic form as they tend to accumulate in the liver, spleen, kidney and bones, block calcium channels and hence are considered highly toxic [14,15]. Therefore, Gd(III) ions are usually found conjugated to chelating ligands, such as linear diethylenetriaminepentaacetic acid (DTPA), or tetraazacyclododecane tetraacetate (DOTA). Unfortunately, chelating Gd(III) ions limits the proton relativity of the Gd (III) ions thereby decreasing its effectiveness as a contrast agent [16]. Trimetallic nitride endohedral metallofullerenes (Trimetasphere®) is one unique class of fullerene molecules where a Gd3N cluster is encapsulated inside a C80 carbon cage referred to as Gd3-N@C80(Fig. 1). All elements to the right of ‘@’ symbol are part of the fullerene cage, while all elements listed to the left are contained within the fullerene cage. Endohedral metallofullerenes have several advantages over small chelated Gd(III) complexes such as the increased stability of the Gd(III) ion, minimal toxic effects, high solubility in water and high proton relaxivity [17,18] rendering them highly efficient contrast agents for MRI [19,20].
Fig. 1.
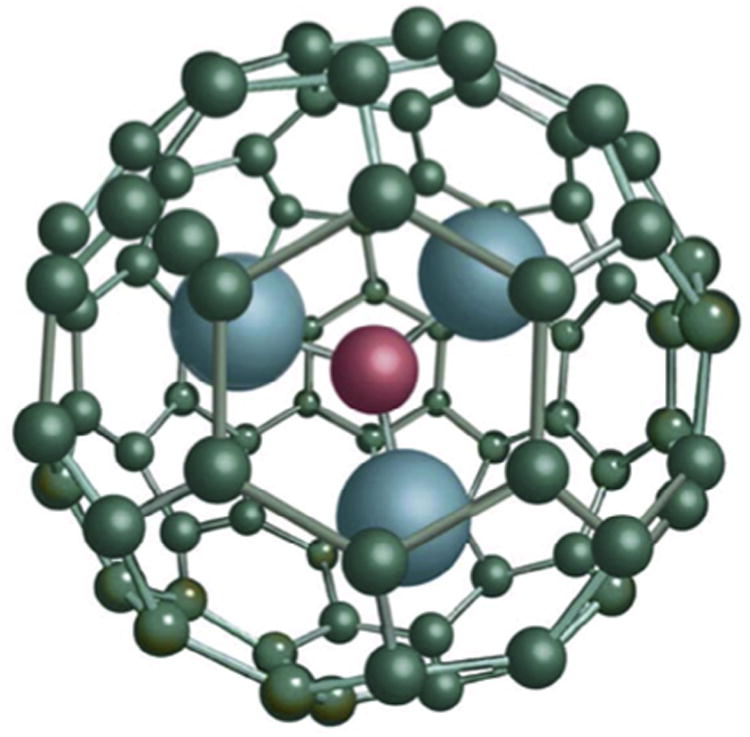
Structure of the Gd3N cluster and C80 carbon cage, known as a Trimetasphere® (reproduced with permission from ECS Transactions, 13 (14) 117–124 (2008) Copyright 2008, The Electrochemical Society.).
In this study, we describe the evaluation of gadolinium-based Trimetasphere® positive contrast agent for the in vitro labeling of human amniotic fluid stem (AFS) cells, and in vivo tracking of these cells following airway cell delivery. These cells are currently being used for the treatment of a myriad of diseases and disorders, including bone defects, Crohn's disease, bladder reconstruction, lung disease, liver disease, kidney disease, multiple sclerosis, stroke, diabetes and heart disease [21–38]. Recent evidence suggests cell therapy may be efficacious for the treatment of inflammatory lung disease [21,22], with the cells homing to the injured tissue and producing anti-inflammatory effects before the eventual clearance of the cells. Here, we demonstrate that AFS cells can be labeled with the Trimetasphere® positive contrast agent by passive uptake without any detrimental effects on cell viability or proliferation. Additionally, we evaluated the ability of the pre-labeled AFS cells to be detected using MRI in collagen phantoms and following airway delivery to lung tissue in vivo. Finally, we performed a ‘proof-of-concept’ experiment demonstrating that this methodology can be used to track the homing of pre-labeled cells to the injured lung tissue and provide longitudinal analysis of cell localization over an extended time course.
2. Materials and methods
2.1. Cell culture
Amniotic fluid stem (AFS) cells were derived as previously described [39]. Briefly, amniotic fluid cells were isolated by centrifugation of amniotic fluid from amniocentesis and allowed to proliferate in vitro and maintained in culture for 4 weeks. Cells were grown in α-MEM medium (Gibco, Life Technologies, Grand Island, NY) containing 15% ES-FBS, 1% glutamine and 1% penicillin/streptomycin (Gibco, Life Technologies, Grand Island, NY), supplemented with 18% Chang B and 2% Chang C (Irvine Scientific, Santa Ana, CA) at 37 °C with 5% CO2 atmosphere. A highly multipotent subpopulation of AFS cells can be isolated through positive selection for cells expressing the membrane receptor c-kit (CD117) [40]. Approximately 1% of cells present in amniotic fluid have been shown to be CD117-positive by fluorescence activated cell sorting (FACS). For immuno-selection of CD117-positive human cells from single-cell suspensions, the cells were incubated with a rabbit polyclonal antibody to CD117 (c-Kit), specific for the protein's extracellular domain (amino acids 23-322) (Santa Cruz Biotechnology, Santa Cruz, CA). The CD117-positive cells were purified by incubation with magnetic Goat Anti-Rabbit IgG MicroBeads and selection on a Mini-MACS apparatus (Miltenyi Biotec, Auburn, CA) following the protocol recommended by the manufacturer. Clonal AFS cell lines were generated by the limiting dilution method in 96-well plates.
2.2. Lentivirus infection
Clonal AFS cells were plated at 50,000 cells/well in a 6-well-plate and allowed to expand to become approximately 90% confluent. The mKATE-renLUC lentivirus was a kind gift from Dr. Frank Marini (Wake Forest School of Medicine, Winston Salem, NC) which encodes the far-red fluorescent protein and Renillaluciferin 2-monooxygenase to facilitate fluorescent and bioluminescent imaging. Cells were exposed to 2 mL of viral supernatant at a titer of 1 × 10⁵ TU/mL in each well and the plates centrifuged for 90 min at 1000×g. After the spin inoculation, the cells were incubated for another 48 h. The cells were then sorted by FACS to select the mKATE positive cell population.
2.3. Contrast agent
The Gd-containing Trimetasphere® was synthesized as described previously [41]. Briefly, graphite rods containing gadolinium oxide were burned as the electrode in an electric arc discharge reactor, and the resulting soot containing Trimetasphere® metallofullerenes and other types of fullerene species were extracted in o-xylene and subsequently purified by a combination of chemical separation methods and high performance liquid chromatography (HPLC) to isolate Gd3N@C80 with purity at >99%. The molecular weight (1446 g/mol) of Gd3N@C80 was determined using matrix-assisted laser desorption/ionization (MALDI) with a time-of-flight (TOF) mass spectrometer. Elemental analysis determined that each Gd3N@C80 molecule contains three Gd atoms. Further, atomic force microscopy (AFM) measurement of Gd3N@C80 showed the nanoparticles are 1.1–1.3 nm in diameter consistent with molecular simulations.
Gd3N@C80 was subsequently chemically functionalized to render high water solubility and desirable physiochemical properties for providing high T1-weighed relaxivity. Functional groups were covalently attached to the Gd3N@C80 cage surface through linkers that enhance the magnetic coupling between Gd inside the cage and surrounding water protons [42,43]. Hydroxylated Gd3N@C80 referred to as GdTMS(OH)χ was synthesized by reacting Gd3N@C80 (100 mg) with potassium superoxide (50 mg) in the presence of 18-crown-6 (8 mg) in o-xylene (50 mL) under inert gas at room temperature for 3 h, and the reaction mixture was washed with toluene and ether twice each. The resultant brown precipitate was reconstituted in DI water followed by dialysis in water with 1000 MWCO membranes to remove small molecule impurities, and the product was then further purified by size exclusion chromatography Sephadex column to collect fractions with higher T1-weighed relaxivity and desired particle size distribution. The final product was stored at room temperature for experiments. The gadolinium content of the new contrast agent was determined using inductively couple plasma mass spectrometry (ICP-MS). No free Gd (Gd outside the carbon cage) was detected using an Arsenazo III colorimetric test.
2.4. Viability and metabolism studies
For cell labeling, Gd-containing Trimetasphere® contrast agent was diluted in cell culture media at 0, 10, 50, 100 or 200 μg/mL and incubated with cells for 48 h. At this time, cell viability was evaluated using a fluorescence-based LIVE/DEAD® cell viability assay (Life Technologies, Grand Island, NY) according to manufacturer's instructions. Briefly, without removing the media containing the contrast agent, the calcein AM and ethidium homodimer (EthD-1) dyes were added to the wells at the appropriate dilution. Cells were incubated for 45 min prior to imaging with a Leica DM4000B fluorescent microscope. A researcher blinded to the experimental groups counted cells from 15 random fields of view, and the total cell viability was calculated. All studies were performed in triplicate. As a negative control, cells were exposed to 70% methanol for 30 min prior to the assay.
Cell proliferation was evaluated in contrast agent-labeled cells using the CellTiter 96® AQueous One Solution Cell Proliferation Assay (Promega, Madison, WI) according to manufacturer's instructions. Briefly, AFS cells were labeled with 0, 10, 50, 100 or 200 μg/mL Gd-containing Trimetasphere® contrast agent in a 96-well culture plate. Following 48 h of incubation, 20 μL of CellTiter 96® AQueous One Solution Reagent was added to each well, and incubated for 1-4 h in a cell culture incubator. The absorbance was recorded at 490 nm using a 96-well plate reader. All studies were performed in triplicate. As a negative control, cells were exposed to 70% methanol for 30 min prior to the assay.
2.5. Cell stress gene expression
To evaluate the potential for the MRI contrast agent to induce a cellular stress response not detectable through viability or metabolism experiments, we performed qPCR for a subset of genes associated with environmental stress and cellular adaption. Specifically AFS cells were incubated in the presence or absence of 200 μg/mL Gd-containing Trimetasphere® contrast agent. Following 48 h of incubation, total RNA was isolated using TRIZOL® reagent according to manufacturer's instructions (Life Technologies, Carlsbad, CA). Complementary DNA (cDNA) was synthesized using the Thermoscript Reverse Transcription System.
Primer sequences used for reverse transcription-polymerase chain reaction (RT-PCR) in this study were as follows:
c-Fos forward primer → 5′-CAAGCGGAGACAGACCAACT-3′,
c-Fos reverse primer → 50′-AGTCAGATCAAGGGAAGCCA-3′,
c-Jun forward primer → 5′-CCA AAG GAT AGT GCG ATG TTT-3′,
c-Jun reverse primer → 5′-CTG TCC CTC TCC ACT GCA AC-3′,
HSP27 forward primer → 5′-GGCATTTCTGGATGTGAGCC-3′,
HSP27 reverse primer → 5′-AGCAGGCAGGACATAGGTGC-3′,
HSP70 forward primer → 5′-ACCAAGCAGACGCAGATCTTC-3′,
HSP70 reverse primer → 5′-CGCCCTCGTACACCTGGAT-3′,
JNK1 forward primer → 5′-GGCTCAGGAGCTCAAGGAATAG-3′,
JNK1 reverse primer → 5′-GATTCTGAAATGGTCGGCTTAG-3′,
NFKB1 forward prime → 5′-CACGAATGACAGAGGCGTGTA-3′,
NFKB1 reverse primer → 5′-GGATTAGCTCTTTTTCCCGATCT-3′,
p53 forward primer → 5′-CCCCTCCTGGCCCCTGTCATCTTC-3′,
p53 reverse primer → 5′-GCAGCGCCTCACAACCTCCGTCAT-3′.
RT-PCR reactions were run using a BioRad CFX96 and CFX384 Real-Time Systems with glyceraldehyde-3-phosphate dehydrogenase (GAPDH) used as an internal control. The amount of DNA immuno-precipitated was determined using quantitative realtime PCR using Power SYBR green PCR master mix (SA Biosciences). Relative mRNA levels were evaluated by BioRad CFX Manager Software (BioRad) and calculated using the 2−ΔΔCt method, and normalized to the expression level in AFS cells cultured without exposure to contrast agent.
2.6. Collagen phantoms
For in vitro studies, collagen phantoms were prepared with a final collagen concentration of 550 μg/mL Briefly, Type I rat tail collagen (BD Biosciences, Bedford, MA) was diluted in ice-cold PBS to give a 2.2 mg/mL solution, after which pH was adjusted to 7.0. To accelerate gel formation, fibrinogen/thrombin crosslinking was employed. Fibrinogen (Sigma–Aldrich, St. Louis, MO) was dissolved in PBS to make a 50 mg/mL solution and thrombin (Sigma–Aldrich, St. Louis, MO) was dissolved in PBS to make a 20 IU/mL solution. All solutions were then sterile filtered with a 0.4-μm syringe filter. To embed cells in collagen phantoms, cell pellets were resuspended in 2.2 mg/mL collagen solution and fibrinogen and collagen/cell solutions were mixed together in a 1:1 ratio by volume. This solution was then in turn mixed with the thrombin solution in a 1:1 ratio by volume to induce rapid gel formation. For cell labeling, following infection with the mKATE-renLUC lentivirus as described above, Gd-containing Trimetasphere® contrast agent was diluted in cell culture media at 10, 50, 100 or 200 μg/mL and incubated with cells for 12, 24, or 48 h. Following incubation, cells were washed three times in phosphate-buffered saline (PBS) and collected by trypsinization and counted manually on a hemocytometer with trypan blue dye exclusion. Cells were then suspended in the collagen phantom at 500,000 cells/mL and cross-linked as described above. Alternatively, for cell dilution studies, following infection with the mKATE-renLUC lentivirus, 100 μg/mL of Gd-containing Trimetasphere® contrast agent was incubated with the cells for 24 h. These cells were then resuspended in collagen phantoms at total cell numbers of 500,000, 250,000, 125,000, 62,500, 31,250, 15,625, 7813, 3906, 1953, 488, 244, 122, 61 or 0 cells (n = 3) within 100 μL of gel.
2.7. Bioluminescent imaging
Bioluminescent imaging was performed using a Xenogen IVIS 100 imaging system, per the manufacturer's directions. For in vitro imaging of Renilla luciferase labeled cells, cells in collagen phantoms (as described above) were prepared containing the substrate coelenterazine in opaque walled 96-well plates (Corning Life Sciences, New York, NY). Regions of Interests (ROIs) were drawn using Living Image 2.5 software (Caliper). Photon radiance from each well was expressed as photons per second per centimeter squared per steradian and then expressed relative to the 0 cell control wells.
2.8. Mouse studies
All study procedures and protocols were approved by the Wake Forest University Health Sciences Animal Care and Use Committee. C57Bl/6 mice were sourced from Jackson Laboratories (Bar Harbor, ME). Mice (n = 3) were injected IP with ketamine/xylazine anesthetic and safely secured onto a Perspex work stand (Hallowell EMC, Pittsfield, MA). Lidocaine jelly was then applied to their vocal cords. Using a speculum mounted on an otoscope, a 1.22 mm diameter intubation tube was inserted through the cords into the trachea. A single intra-tracheal intubation was performed to administer 5 × 10⁵ contrast agent-labeled cells to the lungs in a total volume of 50 μL PBS. A second group of mice (n = 3) received saline-only and were imaged at the same time-points as animals that received cells.
NOD-SCID-gamma (NOD.Cg-Prkdcscid Il2rgtm1Wjl/SzJ) mice were sourced from Jackson Laboratories (Bar Harbor, ME). Under ketamine/xylazine anesthesia, lung injury was induced in the right lung lobes of these mice (n = 6). Briefly, mice were placed on a Styrofoam base in a supine position, with their arms gently tied to the base to expose the chest. Care was taken not to disrupt normal breathing. Mice received a single exposure to 4 Gy/min X-ray radiation for a total of 12 Gy exposure to the right lung lobes, with other tissues protected using a specifically designed lead shield. This lead shield was designed based on serial MRI sections, and ensured minimal radiation exposure to other tissues such as the heart and other lung lobes. Immediately following exposure mice were removed from the base and monitored until recovery. Animals will be monitored adverse events, including difficulty breathing, skin burns, poor appetite, insufficient weight gain, lack of urination/defecation, reluctance to move, abnormal posturing, weight loss, or general failure to thrive. No adverse events were observed in this study. Twelve hours post-irradiation, 4 million contrast agent-labeled AFS cells were delivered by intra-tracheal intubation, as described above, to 3 mice with 3 control mice receiving vehicle saline only. MRI was performed to track prelabeled cell localization 24 h, 1 week and 1 month following cell delivery.
2.9. Magnetic Resonance Imaging
All MRI experiments were performed on a 7.0 Tesla horizontal magnet small animal scanner (Bruker Biospin Inc., Billerica, MA), with an actively shielded gradient set capable of a maximum gradient of 400 mT/m. A custom-made Litz volume coil with 25 mm ID (Doty Scientific, Inc., Columbia, SC) was used for both signal transmission and receiving. An ECG and respiration gated FLASH pulse sequence were used for image acquisition with the following parameters: repetition time (TR) = 53.6 ms, echo time (TE) = 2.6 ms, flip angle (FA) = 30°, number of excitations (NEX) = 4, matrix size = 256 × 192, slice thickness (thk) = 0.60 mm, and field of view (FOV) = 3.0 cm, giving an in-plane resolution of 117 × 156 μm. The respiration and ECG of the mice were monitored (SA Instruments Inc., Stoney Brook, NY). The animals were anesthetized with 3% isoflurane and oxygen at a flow rate of 3 L/min initially, and then maintained with a mixture of 1.5% isoflurane and oxygen at a flow rate of 1 L/min. Mice were imaged prior to cell administration and 24 h, 7 days and 1 month after cell administration.
2.10. Image processing
For localization of labeled cells within the lung tissue, contiguous MRI slices that covered the entire discernable volume of the hyper-intense region were analyzed individually. Mimics® software (Materialise, Leuven, Belgium) was used to specifically label the hyper-intense regions in each slice. The criteria for a pixel to be included in the hyper-intense area were: the pixel must have an intensity of more than 150% of the average baseline signal intensity of nearby pulmonary tissue and the pixel must be located inside the pulmonary tissue. The 150% above background MR signal intensity threshold was selected using non-cell control images, and this level was selected to filter MR signal that was produced by normal biological tissue and allow the identification of signal greater than this background level as contrast agent-labeled cells. This methodology reduces the risk of false positive detection of cells within the lung tissue. The product of that area and the slice thickness equaled the contribution of that slice to the total volume of the hyper-intense region. The volumes of the hyper-intense regions measured ranged from 0.6 mm3 to 3.4 mm3. In addition to these regions, anatomical features including the pulmonary area, heart, ribs and other tissues were also pseudo colored and compiled.
2.11. Histology
Animals were euthanized by an intraperitoneal injection of 150 mg/kg Lethobarb. The total lung tissue was excised following perfusion with 4% paraformaldehyde (PFA) via tracheal intubation. Total lung tissue was ligated at the upper trachea, excised and immersed in 4% PFA for 48 h and processed for histology. To detect labeled cells histologically, sections from throughout the total lung were cut and incubated with primary antibody for mKATE (1:500 rabbit polyclonal Anti-tRFP antibody, #AB234, Evrogen, Farmingdale, NY) for 1 h at room temperature. Sections were then incubated with secondary antibody (AlexaFluor® 568 donkey anti-rabbit IgG, Life Technologies, Grand Island, NY) for 1 h at room temperature. Slides were counter stained with DAPI (Sigma, St. Louis, MO) and mounted with Dako Fluorescent Mounting Medium (Dako, Carpinteria, CA). Slides were visualized with the Leica DM4000B fluorescent microscope to determine presence of labeled cells.
3. Results
3.1. Post-labeling cell viability, proliferation and gene expression
Human AFS cells were labeled with Gd-containing Trimetasphere® contrast agent diluted in cell culture media at 0, 10, 50, 100 or 200 μg/mL and incubated for 48 h. These concentration range and incubation times were selected based on our previous experience with other contrast agents. Cells appeared to uptake the contrast agent following exposure, and successful cell labeling could be visualized by the brown coloration of the cell pellet following collection and washing. To evaluate cell viability post-labeling, cells were stained with calcein AM and EthD-1 dyes (Fig. 2A–F), and total cell viability was calculated manually. Sample viability was calculated to be 0 μg/mL: 85.8% ± 8.27%, 10 μg/mL: 91.0% ±7.04%, with 50 μg/mL: 88.95% ± 12.3%, with 100 μg/mL: 90.1% ±12.7%, and with 200 μg/mL: 86.2% ± 8.5% (Fig. 2G). Negative control samples treated with 70% methanol for 30 min prior to the assay only contained dead cells. There were no significant differences in viability between the untreated and any dose of Gd-containing Trimetasphere® contrast agent-labeled cells (p = 0.67) suggesting no detrimental effect of contrast agent on cell viability.
Fig. 2.
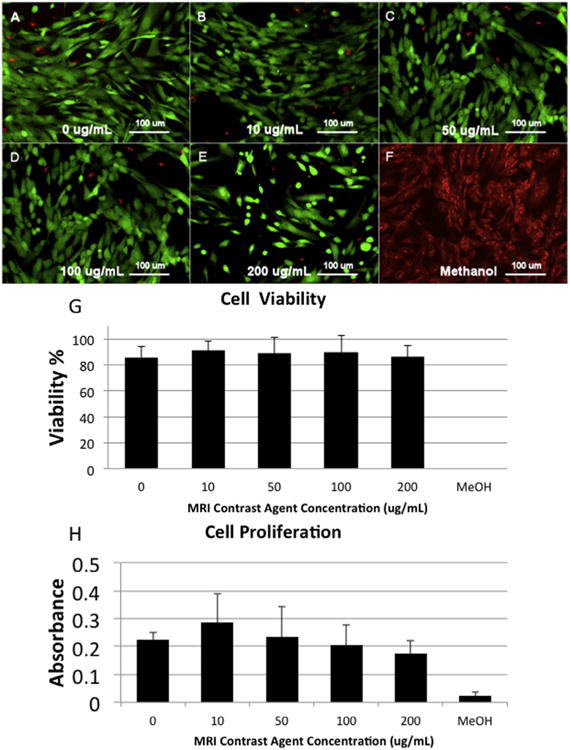
(A–F) LIVE/DEAD assay images for the range of tested contrast agent doses (0–200 μg/mL) incubated with human amniotic fluid stem cells for 48 h as well as a methanol-treated negative control. (G) Quantification of the LIVE/DEAD assay showed no significant effect on contrast agent concentration on cell viability. (H) Contrast agent concentration also had no significant impact on cell proliferation at any of the evaluated doses.
To evaluate the effect of Gd-containing Trimetasphere® contrast agent-labeling on the proliferation of human AFS cells, we performed an MTS-based cell proliferation assay using cell metabolism as an indirect measure of cell proliferation. With the contrast agent concentrations and incubation times as described above, we did not detect any significant differences in cell proliferation between the untreated and any dose of Gd-containing Trimetasphere® contrast agent-labeled cells (p = 0.48) (Fig. 2H). However there was a slight trend for increased cell proliferation at 10 μg/mL contrast agent concentration. It is not clear if this has any biological significance.
We also investigated the potential for Gd-containing Trimetasphere® contrast agent-labeling of AFS cells to activate cellular response networks that are usually upregulated with cellular stress and can account for immuno-modulatory effects of various cell types. Specifically we analyzed the expression changes of genes c-Fos, c-Jun, HSP27, HSP70, JNK, NF-kB and p53 with, or without exposure to the highest concentration and incubation time with the contrast agent Fig. 3. We found no significant changes in all gene expression for all genes, except for HSP27. Gene expression for HSP27 following exposure to contrast agent was reduced approximately 4-fold (p = .049). However due to the low expression levels in the basal conditions it is unclear whether this finding has any biological significance.
Fig. 3.
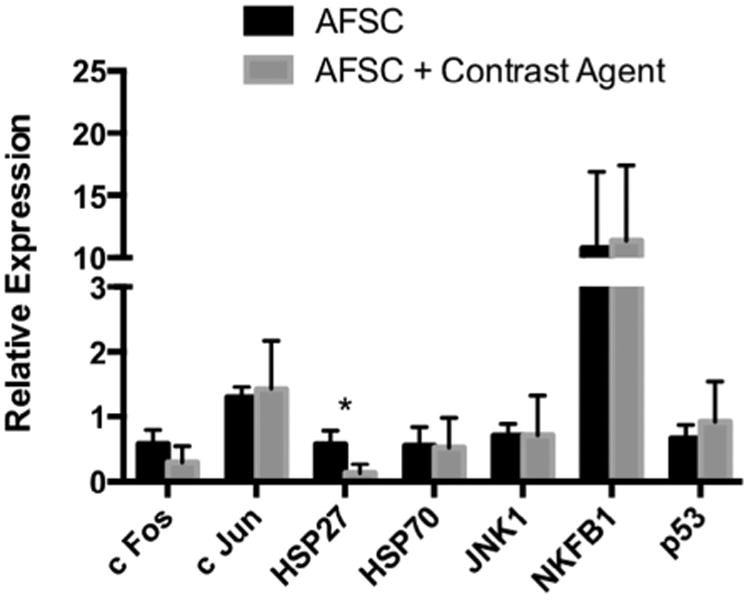
Analysis of cellular response network-associated genes as biomarkers of potential cellular stress. These data demonstrate that Gd-containing Trimetasphere® contrast agent labeling of AFS cells so not activate cellular stress response networks to any detectable level (*p = 0.049).
3.2. In vitro imaging and optimization
To optimize contrast agent labeling dilution and incubation time for MRI, we re-suspended Gd-containing Trimetasphere® contrast agent-labeled human AFS cells in collagen phantoms to approximate the background MR signal of lung tissue. Cells labeled with 0, 10, 50, 100 or 200 μg/mL of contrast agent and incubated for 12, 24 or 48 h were re-suspended in the collagen phantoms at 500,000 cells/mL. The signal intensity was measured and expressed relative to the background signal intensity. The 12 h incubation time resulted in the lowest signal intensity expressed relative to background signal, with relative signal intensities calculated as 10 μg/mL: 1.21 ±0.07, 50 μg/mL: 1.25 ±0.06, 100 μg/mL: 1.28 ± 0.06, and 200 μg/mL: 1.34 ± 0.06 (n = 4) (Fig. 4). 24 h incubation resulted in significantly higher relative signal intensity at all concentrations (p ≤ 0.001, n = 4) with relative signal intensities calculated for 10μg/mL: 1.74 ±0.02, 50 μg/mL: 1.90 ±0.05, 100 μg/mL: 1.98 ±0.05, and 200 μg/mL: 2.12 ±0.06. Forty-eight hour incubation showed a slight decrease in relative signal intensity compared to 24 h incubation, with relative signal intensities calculated for 10 μg/mL: 1.71 ±0.07, 50 μg/mL: 1.84 ±0.05, 100 μg/mL: 1.90 ± 0.04, and 200 μg/mL: 1.93 ± 0.04, however these differences were not significant (p = 0.08). Based on these data, the incubation dose of 100 μg/mL at the 24-h time point was determined to produce a strong MR signal while maintaining suitable cell viability and proliferation.
Fig. 4.
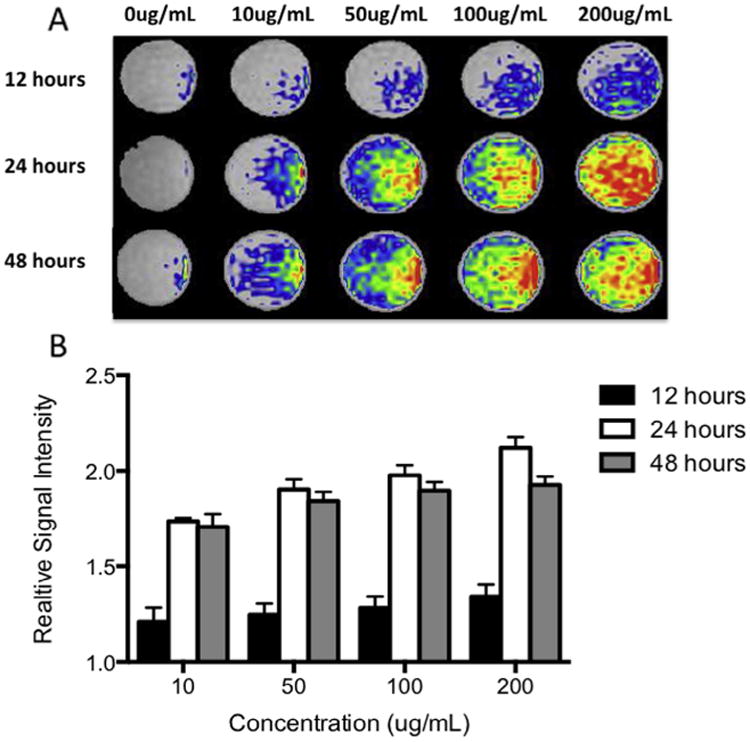
(A) Optimization of contrast agent labeling dilution and incubation time for MR imaging. Contrast agent-labeled human amniotic fluid stem cells were suspended in collagen phantoms to resemble the background signal of lung tissue and imaged. (B) Quantification of the MR signal intensity (relative to unlabeled cells in collagen phantom) showed strongest signal with the higher concentration and incubation times.
3.3. Evaluation of cell detection limits
We next measured the MR signal intensity in relation to a range of cell densities within the collagen phantoms. To enable a comparison to another commonly used cell-tracking modality we compared the MR signal for each cell density to that of the bioluminescence produced by the luciferase co-labeled cells. Although the bioluminescence produced by the labeled cells facilitated the easy detection of cells within the collagen phantoms, the detection limit of this system was above 3906 cells, at which point lower cell numbers became indistinguishable from the 0 cell controls (p = 0.168) (Fig. 5A). Although not significantly different from 0 cell controls, lower values did register a bioluminescent signal, however the variance between samples was large. The same collagen phantoms containing the mKATE-renLUC cells were also imaged using MR to provide an in vitro comparison of the two imaging modalities. While the MR signal produced by the contrast agent-labeled cells had lower maximum relative signal intensity than the bioluminescent relative signal intensity, the minimum detection limit was lower. At the lowest evaluated cell number (61 cells), the MR signal produced by the cells was distinguishable from the 0 cell controls, producing a signal 1.552 ±0.05 times greater than the background signal (p ≤ 0.001, n = 4) (Fig. 5B).
Fig. 5.
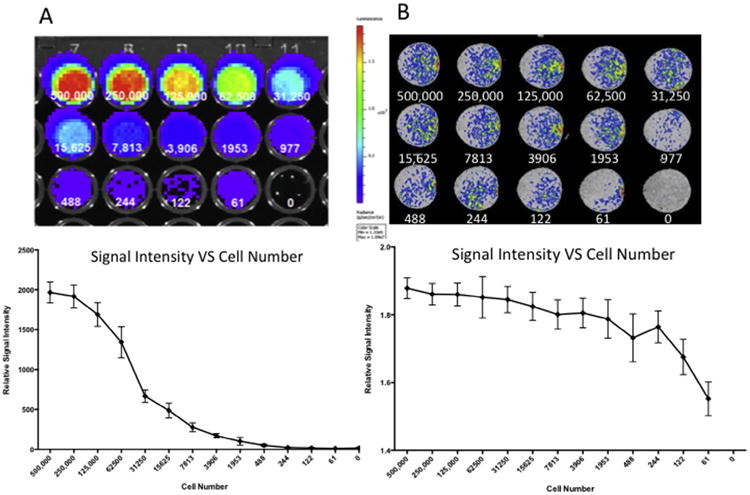
We compared the bioluminescence produced by the luciferase co-labeled cells to the MR signal for each human amniotic fluid stem cells incubated with 100 μg/mL contrast agent for 24 h. (A) Bioluminescent imaging produced a strong signal, with the detection limit of this system was above 3906 cells, at which point lower cell numbers became statistically indistinguishable from the 0 cell controls. (B) The MR signal produced by the contrast agent-labeled cells had a lower maximum intensity than the bioluminescent signal, but with a lower minimum cell number detection limit. At the lowest evaluated cell number (61 cells), the MR signal produced by the cells was statistically distinguishable from the 0 cell controls.
3.4. In vivo imaging of contrast agent-labeled cells
To demonstrate the in vivo imaging of contrast agent-labeled cells within lung tissue, mice received 5 × 10⁵ contrast agent-labeled cells to the lungs in a total volume of 50 μL PBS while control mice received saline vehicle only. MR images were acquired 24 h post-delivery of cells or saline vehicle. As shown in Fig. 6A, in saline-injected animals the lung tissue appeared dark, with several bright areas representing blood flow in the pulmonary vessels and arteries. In contrast, in the animals receiving 5 × 10⁵ contrast agent-labeled cells, a hyper-intense signal was observed throughout the lung lobes (Fig. 6B and Video 1), and appeared localized to the airway structures suggesting localization consistent with the airway delivery route. To confirm cellular localization, animals were euthanized immediately following MR imaging and the entire pulmonary tissue was processed for histological analysis. Tissue sections were cut in the anterior/posterior direction in order to match sections to the long axis slices of the MRI.
Fig. 6.
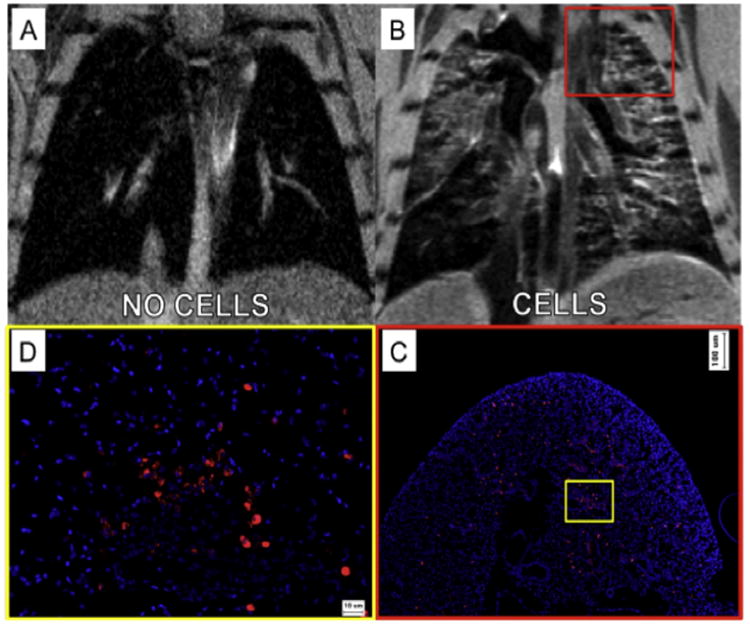
In vivo intra-tracheal delivery of contrast agent-labeled amniotic fluid stem cells. (A) In animals receiving saline vehicle only, the lungs appear dark with only some positive signal representing arterial or venous pulmonary blood flow. (B) Twenty-four hours after delivery of 5 × 10⁵ labeled cells, hyper-intense signal was observed throughout the lung lobes, localized to the airway structures, suggesting localization consistent with the airway delivery route. (C) Histological analysis of cell localization supported the MR imaging data, showing similar distribution, concentration and localization of cells as observed in each raw MRI image slice at low magnification, and (D) high magnification analysis.
Video 1.
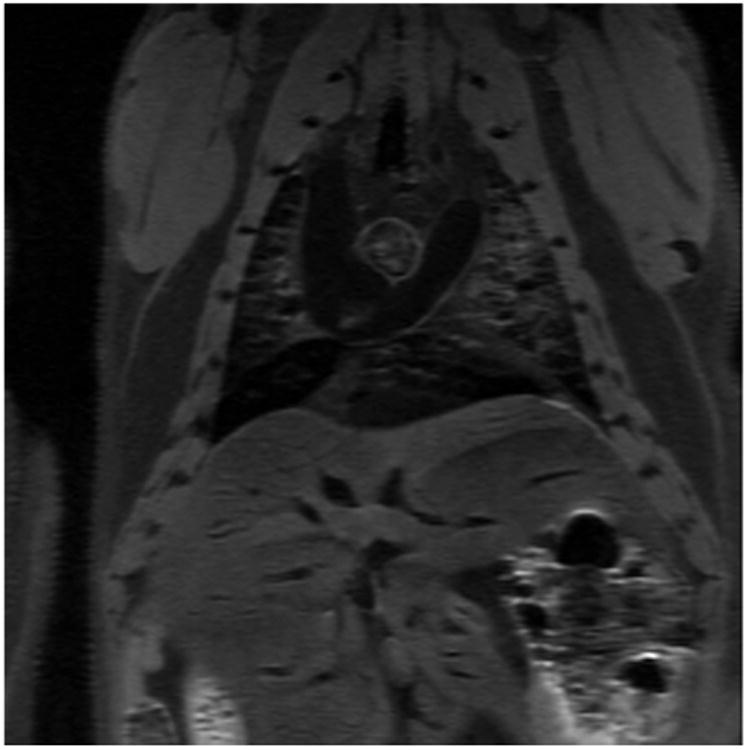
Raw MR image data from mouse receiving 5 × 10⁵ contrast agent-labeled cells via tracheal intubation.
Labeled cells were visualized using immuno-histochemical staining for the mKATE fluorescent tag. Low magnification histological analysis of cell localization supported the MR imaging data, showing similar distribution, concentration and localization of labeled cells as observed in each raw MRI image slice (Fig. 6C). Specifically, we observed concentration of cells throughout the airways, concentrated in the upper and middle lobes, with a lower concentration of cells reaching the lower lung lobes. Higher magnification histological analysis confirmed that the pre-labeled cells were present throughout the airways, alveoli and interstitial tissues of the mouse lung (Fig. 6D). As this short-term experiment was designed to confirm visualization of cells by MRI using standard histological methods, tissue integration, or cellular longevity within the lung tissues was not explored.
In order to better visualize the hyper-intense MR signal produced by the labeled cells from the background signal and bright appearing artifacts produced by blood flow or other factors within the pulmonary area, we performed post-imaging analysis to objectively define areas corresponding to the labeled cells. First, slice-by-slice analysis was performed to pseudocolor various organs to provide situational context and facilitate localization (lungs: pink, heart: red, bone: white, skin: orange). Assignment was performed manually using 3 axis of visualization to ensure accurate tissue assignment. Following gating on the total area assigned to pulmonary tissue, pixels with an intensity of more than 150% of the average signal intensity of pulmonary tissue volume was pseudo colored green. This cut-off limit was selected based on the non-cell control MR data. An example of this assignment process is shown in Fig. 7. Alternatively, the data can be represented as a graded color scale representing voxel intensity as shown in Supplementary Fig. 1.
Fig. 7.
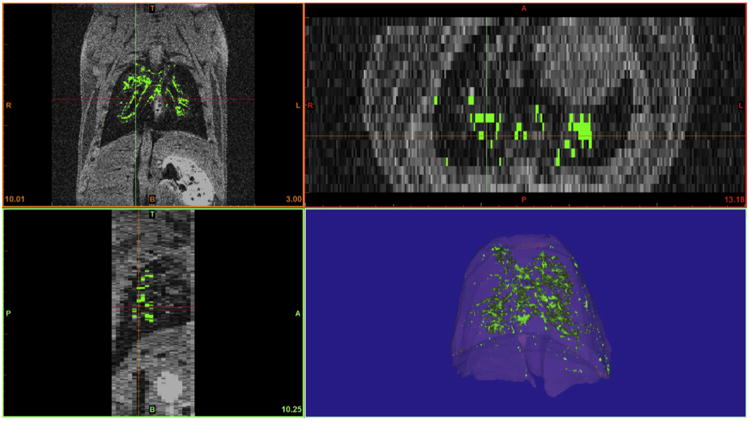
Post-imaging analysis was performed to facilitate localization and specifically define areas corresponding to the labeled cells. Cellular localization was evaluated using 3 axis of visualization (coronal, transverse and sagittal planes) to ensure accurate tissue assignment. Pixels with an intensity of more than 150% of the average signal intensity of pulmonary tissue volume were assigned as labeled cells and pseudo-colored green. Additional pseudo-coloring of lung tissue facilitated and enhanced view of the pulmonary localization of labeled cells within this tissue.
The major advantage of this post-imaging analysis is the ability to visualize and manipulate the 3D image, selecting the inclusion of other tissue types to provide situational context and cellular localization. The localization of labeled cells can be viewed from any angle or magnification as a compiled 3D structure, or as individual computed 2D slices, provided on any selected axis. Examples of different tissues and organ/cell selections are shown in Supplementary Fig. 2 and visualization of these tissues and viewing angles and magnifications are demonstrated in Supplementary Video 1.
3.5. Tracking cells in an in vivo injury model
We hypothesized that this imaging technique would be useful in tracking cells following administration to animals or human patients with lung disease or injury. The ability to track administered cells within the lung tissue will provide valuable information on cell homing and migration to areas of injury and for clinical safety studies. To investigate whether this imaging modality would be an effective system to visualize cell homing migration to injured lung tissue, we administered contrast agent-labeled cells to mice who had received targeted radiation injury to one half of their lung tissue, with other tissues protected using a specifically designed lead shield. The shield was designed to spare other tissues such as the heart, stomach and kidneys from radiation. This was achieved by developing a lead shield based on mapping individual MRI slices to select an area maximizing exposure to lung tissue but minimizing exposure to the heart and spinal cord. An example of the mapping used for shield design is shown in Fig. 8A. One month following lung irradiation, we observed radiation-induced alopecia on both the ventral and dorsal areas targeted by radiation, demonstrating successful exposure of the lung lobes (Fig. 8B, ventral view shown).
Fig. 8.
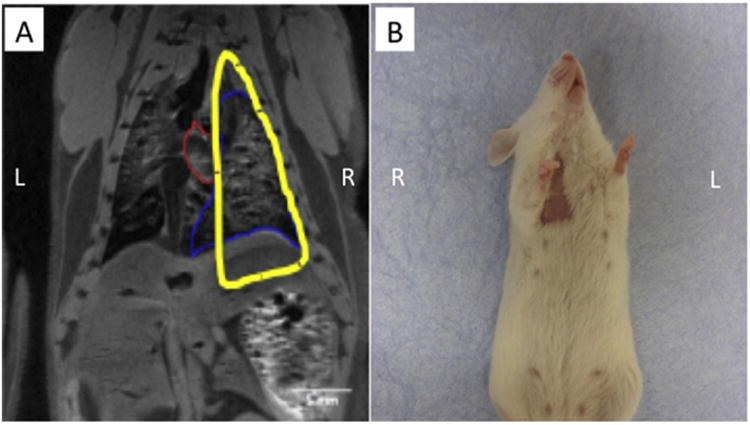
(A) A lead shield was designed by mapping individual MRI slices to specifically injure the right lung lobes of the mouse, while sparing other tissues such as the heart, stomach and kidneys. (B) One month following lung irradiation, we observed radiation-induced alopecia on both the ventral and dorsal areas targeted by radiation, demonstrating successful exposure of the targeted lung lobes.
Four million contrast agent-labeled AFS cells were administered via tracheal intubation 12 h following exposure to radiation. MRI was performed immediately prior to cell administration (Fig. 9A), as well as 24 h, 1 week and 1 month following cell delivery. As shown in the raw MR images slices, the higher cell dose (4 million vs. 0.5 million) provided an easily distinguishable hyper-intense region located primarily in the irradiated mouse right lung lobes, with minimal localization in the uninjured left lung lobe (Fig. 9B). The extent of MR signal and the concentration of the cells in the irradiated lung areas were surprising, and demonstrate the ability of this cell type to home and migrate towards an area of injury.
Fig. 9.
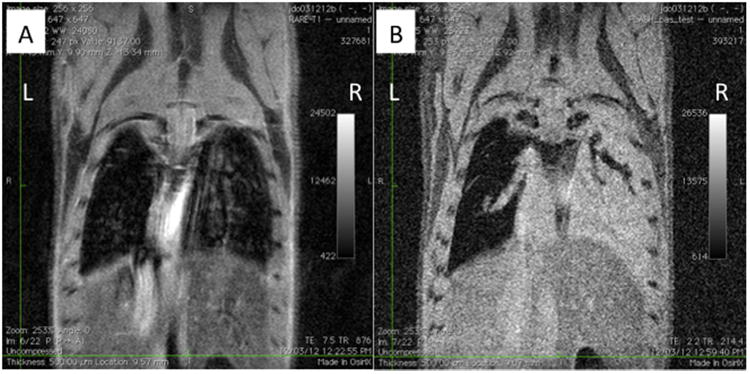
(A) Raw MRI data 12 h after partial lung irradiation and prior to cell delivery. (B) Four million fetal stem cells were administered post-irradiation via tracheal administration. After 24 h after tracheal delivery, AFS cells accumulate in the irradiated mouse right lung.
These measurements were repeated at the time points described above, and analyzed using the organ background signal and average signal intensity gating procedure as previously described. Twenty-four hours after cell delivery, we observed a concentration of contrast agent-labeled cells primarily in the irradiated right lung, with some signal also located within the upper left lung lobes (Fig. 10A). Cells were also concentrated in the ventral and posterior lung tissue within the right lung. One week following cell delivery, the concentration of contrast-agent labeled cells in the right lung lobes had increased, while the signal initially present in the upper left lung lobes was reduced (Fig. 10B). While the ventral concentration of cells within the right lung tissue was still observed, it appeared that the concentration of cells in the lower dorsal areas had decreased, and become more evenly distributed throughout the right lung lobe. These data demonstrate that the delivered cells rapidly accumulate in the areas of lung tissue exposed to radiation and remain localized in these areas for at least one week. Interestingly, analysis at the one-month time point, cells could no longer be detected in the lungs of animals, suggesting the localization of cells was temporary in nature (Fig. 10C). This is supported by other studies using these cells [40,44] showing the ability of AFS cells to rapidly migrate into damaged tissues, followed by the clearance of cells. Three-dimensional reconstruction of pulmonary tissue and cell distribution is shown in Supplementary Video 2. While this study was not designed to evaluate imaging of cells following long term engraftment, it demonstrates that this imaging modality is suitable for repeat, longitudinal analysis to track the localization of cells within pulmonary tissue over time.
Fig. 10.
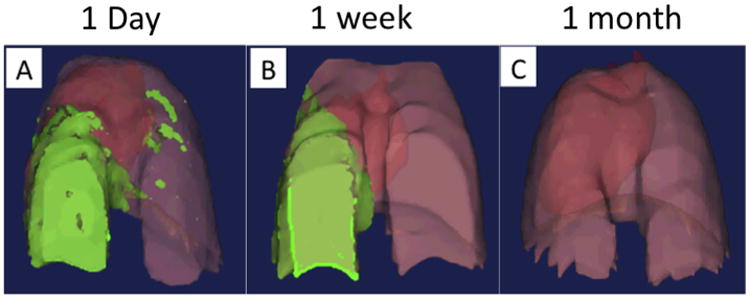
Tracheal delivery of stem cells to mice with targeted radiation-induced lung injury. Stem cell accumulation within the injured lung tissue increased over a 1-week period, with a loss of cells from uninjured lung tissue and a slight increase in the injured tissue. After 1 month cells could no longer be detected.
4. Discussion
In this study we have described methodology to label an adherent stem cell population with a Gd-containing Trimetasphere® contrast agent without adverse effects on cell viability or proliferation, and which provides a strong positive MR signal that facilitates the non-invasive tracking of administered cells within the lung tissue.
In conventional MRI, superparamagnetic iron oxide (SPIO) nanoparticles produce negative signals that are often confounded by the presence of artifacts due to hemorrhages, air, and partial-volume effects. To address these issues, some attempts have been made to generate positive contrast using SPIO contrast agents. Cunningham et al. developed a methodology to produce positive contrast using SPIO by using spectrally selective RF pulses to excite and refocus the off-resonance water surrounding the labeled cells, while suppressing on-resonance signal [45]. This technique was successful in in vitro and in vivo studies, however one limitation was unwanted magnetization of regions such as lipids and tissue near the lungs that could produce artifacts if tracking cell localization within the lung tissue.
Gadolinium chelates are the most commonly used positive contrast agents, however these are suboptimal for cell labeling and tracking studies because of their small size and high hydrophobicity, which hinder spontaneous cell uptake and retention. Gd2O3 nanoparticles have somewhat addressed these issues, demonstrating enhanced relaxivity and increased uptake efficiency. In a study described by Loai et al. endothelial cells were readily labeled with gadolinium oxide nanoparticles and showed positive T1 contrast using a 7 Tesla MRI [46]. While these studies are promising, some toxicity of the contrast agent was observed.
Our evaluation of the Gd-containing Trimetasphere® contrast agent focused on two main properties: (1) the passive uptake of the contrast agent by cells, while maintaining cell viability and proliferation, and (2) the detection of contrast agent-labeled cells within the lung using non-invasive, high resolution MRI. By adding the contrast agent to the cell culture medium, we found that the cells would uptake the agent without any need to stimulate or serum-starve the cells. At the doses evaluated, we could determine successful uptake of the contrast agent by the brown coloration of the cells, which correlated to the contrast agent concentration. Our results indicate that at all concentrations evaluated the culture and uptake of the contrast agent had no effect on cell viability, proliferation or induction of cellular stress responses.
Optimization of the dosing and incubation time to adequately label our stem cells with the contrast agent determined that a concentration of 100 μg/mL incubated for 24 h was suitable to produce a significant increase in the MRI signal. Increasing the incubation time to 48 h did not improve the signal intensity suggesting that the cellular uptake of the contrast agent had reached saturation at 24 h. While we did detect a higher signal when using 200 μg/mL of the contrast agent compared to 100 μg/mL, we believe the increased cost involved to achieve only a modest gain in signal was not economical (100 μg/mL: 1.98 ±0.05 vs. 200 μg/mL: 2.12 ±0.06). The potential to reduce contrast agent concentration further, without diminishing signal intensity is an area worth exploring in future studies.
It is difficult to directly compare such different methodologies for cell labeling and imaging, such as bioluminescence and MRI due to the major differences in the labeling and imaging techniques. For example, to enable bioluminescent imaging of cells, our cells were induced to express the luciferase enzyme using genetic manipulation techniques. While this is a standard method in many laboratories, it is not favorable for use in primary cell lines, large numbers of cells, or for human clinical applications. The passive uptake of contrast agent may represent a more rapid and simpler labeling technique. Additionally, bioluminescence and MRI cell tracking modalities use different methods for reporter activation (enzyme-catalyzed chemical reaction vs. T1 relaxation rate shortening) as well as different imaging techniques (photon detection vs. nuclear magnetic resonance). One main disadvantage of bioluminescent cell tracking is that the data produced is two-dimensional (2D) and does not provide any anatomical information other than a standard 2D photographic image, unless combined with a secondary imaging modality such as X-ray or CT. For this reason this methodology has remained primarily in the research field.
For this study we infected a stem cell line with a lentivirus expressing mKATE and Renilla luciferase genes. This enabled us to co-label these cells with the contrast agent and perform both imaging methods on the same cell populations. The bioluminescent imaging produced a detectable signal for all cell concentrations measured, although this rapidly declined for the lower cell concentrations. There was also a high background signal from the surrounding phantom and culture plate, causing difficulties in accurately distinguishing between the lower cell concentrations and no-cell control wells. In comparison, the contrast agent-labeled cells imaged with MRI produced a moderate, but distinguishable positive signal over all the evaluated cell concentrations. The low level of background signal produced in the phantoms is consistent with pulmonary tissue MR signal, suggesting that this methodology has the potential of visualizing very low numbers of cells within lung tissue in vivo. In this study the lowest cell number evaluated produced MR signal intensity that was detectable above background signal. While we did detect a diminishing signal with lower cell numbers, there still exists the potential to detect lower cell numbers. However, whether this accurately translates into in vivo applications needs to be explored.
We performed two in vivo proof of concept studies with the goal of demonstrating the potential of Gd-containing Trimetasphere® contrast agent-labeled cells to be administered and tracked within lung tissue. Our first experiment utilized an uninjured mouse with imaging performed shortly after cell delivery to evaluate whether our in vitro imaging methodology was translatable to the in vivo model. We confirmed that contrast agent-labeled cells produced a bright and detectable MR signal in vivo that could easily be distinguished from the surrounding pulmonary tissue. Cellular localization was confirmed using standard histological methods, and image processing was performed to visualize cellular localization and tissues in 3D. Our results indicate that the in vivo imaging methodology validates our in vitro imaging methodology. While not performed in this study, it may also be possible to quantify cell number and concentration within voxels, areas, or total lung tissue. However, this methodology would need to be established with in vivo dosing studies, and was outside of the scope of these proof-of-concept studies.
The second in vivo study was designed to demonstrate the feasibility of the use of this technique in longitudinal, non-invasive cell tracking studies. Use of mice with targeted radiation injury to one half of their lung tissue facilitated the investigation of the homing of the AFS cells to the injured tissue as well as the evaluation of the timing of both the migration and cell clearance events. We increased the delivered dose of cells from 0.5 million to 4 million, as we anticipated the gradual loss of cells, and resulting loss of signal intensity over each measurement. The concentration of contrast agent-labeled cells in the injured lung tissue, as well as the resultant hyper-intense MR signal from these cells was unanticipated. At early time-points we had expected a similar cellular localization to that observed in the first in vivo studies, with perhaps a detectable increase in cell concentration in the injured lobes compared to the uninjured. However, we observed a rapid migration to the injured tissue, with only small areas of uninjured lung tissue appearing to have labeled cells present. This was consistent with observation after 1 week of cell delivery, with the only detectable differences being a decrease in the signal produced in the uninjured lung tissue, and a slight increase and change in distribution in the injured lung tissue. For the final time-point of this study we observed a decrease in MRI signal similar to background levels, suggesting that the cells had been cleared by 1 month. While the time-points evaluated in this study were not ideal for these specific migration dynamics, with the majority of cell clearance appearing to occur between 1 week and 1 month time-point, this imaging methodology will now assist our future studies evaluating the specific timing of cell migration, persistence and clearance which would be very beneficial for clinical applications. Future studies will evaluate a range of cell doses, routes of administration and increased number of time-points to provide valuable data for the optimization of cell dosing, timing and delivery for future clinical trials.
While there are many advantageous aspects of this cell tracking methodology that make it attractive for widespread application for research and clinical studies, there are some drawbacks that need to be considered. Some of these problems are common to all MRI-based cell-tracking methodologies, such as the accuracy of detection and elimination of susceptibility boundaries. Due to the nature of the passive labeling with the contrast agent, cellular division will result in the gradual dilution of the contrast agent and resulting signal. Further studies will need to be performed to determine at which point the signal is no longer detectable, or whether this property could be utilized to evaluate cellular proliferation in vivo, similarly to techniques utilizing fluorescent dyes (Hoechst 33342, CFSE, etc.). Additionally, there is the risk that the labeled cells may transfer the contrast agent to other cells, either through exocytosis, cell lysis or phagocytosis of the cells. This may result in the loss of cell signal or the production of false positives. The major advantage of the development of non-toxic, bright, positive contrast agents is the ability to evaluate cell localization within “dark” appearing tissues such as the lung. However, this property prevents the detection of labeled cells if they migrate out of the lung and into other tissues that have a brighter background signal. Additionally, caution needs to be taken when attempting to detect labeled cells close to larger blood vessels, as imaging artifacts can be produced by the movement of blood within these vessels, potentially producing false positive results. These factors may limit the application of this technology to localized administration to the airways, such as described in this study.
These studies represent the first reported use of the Gd-containing Trimetasphere® contrast agent to label and deliver exogenous cells to the lung, and perform longitudinal MRI to evaluate the dynamics of cell homing, migration and clearance within the lung. This contrast agent is non-toxic and produces a fast T1 relaxation time, resulting in a hyper-intense MR signal that is easily detectable above tissue background signal. We believe that these findings are a strong starting point for future pre-clinical applications of this imaging methodology for answering various questions about the optimum timing of administration, cell location, and cell viability over time. This approach may also find application in clinical studies, particularly for Phase I trials for cellular therapies for lung diseases such as idiopathic pulmonary fibrosis, chronic obstructive pulmonary disease and cystic fibrosis. The ability to use a non-invasive and safe method for longitudinal tracking of delivered cells could provide an additional outcome measure for safety and efficacy of the therapy.
Supplementary Material
Acknowledgments
We would like to thank Tom Smith for his assistance with murine tracheal intubations and training, Heather Sawyer for assistance with the 7T MRI and Frank Marini and his group for the mKATE-renLUC lentivirus. This research has been supported, in part, by the American Lung Association, The Cystic Fibrosis Foundation and the Chapman Foundation.
Footnotes
Appendix A. Supplementary data: Supplementary data associated with this article can be found, in the online version, at http://dx.doi.org/10.1016/j.ymeth.2015.11.004.
Contributor Information
Sean V. Murphy, Email: semurphy@wakehealth.edu.
Austin Hale, Email: halear0@gmail.com.
Tanya Reid, Email: tareid@wakehealth.edu.
John Olson, Email: jdolson3@earthlink.net.
Amritha Kidiyoor, Email: akidiyoo@wakehealth.edu.
Josh Tan, Email: jtan@wakehealth.edu.
Zhiguo Zhou, Email: zhouz@lunainc.com.
John Jackson, Email: jojackso@wakehealth.edu.
Anthony Atala, Email: aatala@wakehealth.edu.
References
- 1.Henderson RG. Nuclear magnetic resonance imaging: a review. J R Soc Med. 1983;76(3):206–212. doi: 10.1177/014107688307600312. [DOI] [PMC free article] [PubMed] [Google Scholar]
- 2.Pykett IL, Newhouse JH, Buonanno FS, Brady TJ, Goldman MR, Kistler JP, et al. Principles of nuclear magnetic resonance imaging. Radiology. 1982;143(1):157–168. doi: 10.1148/radiology.143.1.7038763. [DOI] [PubMed] [Google Scholar]
- 3.Pichler BJ, Wehrl HF, Judenhofer MS. Latest advances in molecular imaging instrumentation. J Nucl Med : Off Pub Soc Nucl Med. 2008;49(Suppl 2):5S–23S. doi: 10.2967/jnumed.108.045880. [DOI] [PubMed] [Google Scholar]
- 4.Buchholz DE, Hikita ST, Rowland TJ, Friedrich AM, Hinman CR, Johnson LV, et al. Derivation of functional retinal pigmented epithelium from induced pluripotent stem cells. Stem Cells. 2009;27(10):2427–2434. doi: 10.1002/stem.189. [DOI] [PubMed] [Google Scholar]
- 5.Schwartz SD, Hubschman JP, Heilwell G, Franco-Cardenas V, Pan CK, Ostrick RM, et al. Embryonic stem cell trials for macular degeneration: a preliminary report. Lancet. 2012;379(9817):713–720. doi: 10.1016/S0140-6736(12)60028-2. [DOI] [PubMed] [Google Scholar]
- 6.Ortiz LA, Gambelli F, McBride C, Gaupp D, Baddoo M, Kaminski N, et al. Mesenchymal stem cell engraftment in lung is enhanced in response to bleomycin exposure and ameliorates its fibrotic effects. Proc Natl Acad Sci U S A. 2003;100(14):8407–8411. doi: 10.1073/pnas.1432929100. [DOI] [PMC free article] [PubMed] [Google Scholar]
- 7.Johnson WK, Stoupis C, Torres GM, Rosenberg EB, Ros PR. Superparamagnetic iron oxide (SPIO) as an oral contrast agent in gastrointestinal (GI) magnetic resonance imaging (MRI): comparison with state-of-the-art computed tomography (CT) Magn Reson Imaging. 1996;14(1):43–49. doi: 10.1016/0730-725x(95)02044-t. [DOI] [PubMed] [Google Scholar]
- 8.Wolf GL. Current status of MR imaging contrast agents: special report. Radiology. 1989;172(3):709–710. doi: 10.1148/radiology.172.3.2672095. [DOI] [PubMed] [Google Scholar]
- 9.Matsumoto Y, Jasanoff A. Metalloprotein-based MRI probes. FEBS Lett. 2013;587(8):1021–1029. doi: 10.1016/j.febslet.2013.01.044. [DOI] [PMC free article] [PubMed] [Google Scholar]
- 10.Caravan P, Ellison JJ, McMurry TJ, Lauffer RB. Gadolinium(III) chelates as MRI contrast agents: structure, dynamics, and applications. Chem Rev. 1999;99(9):2293–2352. doi: 10.1021/cr980440x. [DOI] [PubMed] [Google Scholar]
- 11.Rogers WJ, Meyer CH, Kramer CM. Technology insight: in vivo cell tracking by use of MRI. Nat Clin Pract Cardiovasc Med. 2006;3(10):554–562. doi: 10.1038/ncpcardio0659. [DOI] [PubMed] [Google Scholar]
- 12.Mani V, Briley-Saebo KC, Itskovich VV, Samber DD, Fayad ZA. Gradient echo acquisition for superparamagnetic particles with positive contrast (GRASP): sequence characterization in membrane and glass superparamagnetic iron oxide phantoms at 1.5T and 3T. Magn Reson Med : Off J Soc Magn Reson Med/Soc Magn Reson Med. 2006;55(1):126–135. doi: 10.1002/mrm.20739. [DOI] [PubMed] [Google Scholar]
- 13.Aime S, Cabella C, Colombatto S, Geninatti Crich S, Gianolio E, Maggioni F. Insights into the use of paramagnetic Gd(III) complexes in MR-molecular imaging investigations. J Magn Reson Imaging: JMRI. 2002;16(4):394–406. doi: 10.1002/jmri.10180. [DOI] [PubMed] [Google Scholar]
- 14.Lansman JB. Blockade of current through single calcium channels by trivalent lanthanide cations. Effect of ionic radius on the rates of ion entry and exit. J Gen Physiol. 1990;95(4):679–696. doi: 10.1085/jgp.95.4.679. [DOI] [PMC free article] [PubMed] [Google Scholar]
- 15.Biagi BA, Enyeart JJ. Gadolinium blocks low- and high-threshold calcium currents in pituitary cells. Am J Physiol. 1990;259(3 Pt. 1):C515–20. doi: 10.1152/ajpcell.1990.259.3.C515. [DOI] [PubMed] [Google Scholar]
- 16.Rohrer M, Bauer H, Mintorovitch J, Requardt M, Weinmann HJ. Comparison of magnetic properties of MRI contrast media solutions at different magnetic field strengths. Invest Radiol. 2005;40(11):715–724. doi: 10.1097/01.rli.0000184756.66360.d3. [DOI] [PubMed] [Google Scholar]
- 17.Meng J, Wang DL, Wang PC, Jia L, Chen C, Liang XJ. Biomedical activities of endohedral metallofullerene optimized for nanopharmaceutics. J Nanosci Nanotechnol. 2010;10(12):8610–8616. doi: 10.1166/jnn.2010.2691. [DOI] [PMC free article] [PubMed] [Google Scholar]
- 18.Kumar K, MacFarland DK, Zhou Z, Kepley CL, Walker KL, Wilson SR, et al. Fullerene-based nanostructures: a novel high-performance platform technology for magnetic resonance imaging (MRI) Drug Delivery Nanopart Formul Charact. 2009;191:330. [Google Scholar]
- 19.MacFarland DR. Trimetasphere metallofullerene MRI contrast agents with high molecular relaxivity. ECS Trans. 2008;13(14):117–124. [Google Scholar]
- 20.MacFarland DK, Walker KL, Lenk RP, Wilson SR, Kumar K, Kepley CL, et al. Hydrochalarones: a novel endohedral metallofullerene platform for enhancing magnetic resonance imaging contrast. J Med Chem. 2008;51(13):3681–3683. doi: 10.1021/jm800521j. [DOI] [PMC free article] [PubMed] [Google Scholar]
- 21.Murphy S, Lim R, Dickinson H, Acharya R, Rosli S, Jenkin G, et al. Human amnion epithelial cells prevent bleomycin-induced lung injury and preserve lung function. Cell Transplant. 2011;20(6):909–923. doi: 10.3727/096368910X543385. [DOI] [PubMed] [Google Scholar]
- 22.Murphy SV, Shiyun SC, Tan JL, Chan S, Jenkin G, Wallace EM, et al. Human amnion epithelial cells do not abrogate pulmonary fibrosis in mice with impaired macrophage function. Cell Transplant. 2012;21(7):1477–1492. doi: 10.3727/096368911X601028. [DOI] [PubMed] [Google Scholar]
- 23.Hodges RJ, Jenkin G, Hooper SB, Allison B, Lim R, Dickinson H, et al. Human amnion epithelial cells reduce ventilation-induced preterm lung injury in fetal sheep. Am J Obstet Gynecol. 2012;206(5):448.e8–448.e15. doi: 10.1016/j.ajog.2012.02.038. [DOI] [PubMed] [Google Scholar]
- 24.Hodges RJ, Lim R, Jenkin G, Wallace EM. Amnion epithelial cells as a candidate therapy for acute and chronic lung injury. Stem Cells Int. 2012;2012:709763. doi: 10.1155/2012/709763. [DOI] [PMC free article] [PubMed] [Google Scholar]
- 25.Murphy SV, Lim R, Heraud P, Cholewa M, Le Gros M, de Jonge MD, et al. Human amnion epithelial cells induced to express functional cystic fibrosis transmembrane conductance regulator. PLoS One. 2012;7(9):e46533. doi: 10.1371/journal.pone.0046533. [DOI] [PMC free article] [PubMed] [Google Scholar]
- 26.Vosdoganes P, Hodges RJ, Lim R, Westover AJ, Acharya RY, Wallace EM, et al. Human amnion epithelial cells as a treatment for inflammation-induced fetal lung injury in sheep. Am J Obstet Gynecol. 2011;205(2):156.e26–156.e33. doi: 10.1016/j.ajog.2011.03.054. [DOI] [PubMed] [Google Scholar]
- 27.Vosdoganes P, Wallace EM, Chan ST, Acharya R, Moss TJ, Lim R. Human amnion epithelial cells repair established lung injury. Cell Transplant. 2013;22(8):1337–1349. doi: 10.3727/096368912X657657. [DOI] [PubMed] [Google Scholar]
- 28.Furth ME, Atala A. Stem cell sources to treat diabetes. J Cell Biochem. 2009;106(4):507–511. doi: 10.1002/jcb.22000. [DOI] [PubMed] [Google Scholar]
- 29.Schwartz RE, Reyes M, Koodie L, Jiang Y, Blackstad M, Lund T, et al. Multipotent adult progenitor cells from bone marrow differentiate into functional hepatocyte-like cells. J Clin Investig. 2002;109(10):1291–1302. doi: 10.1172/JCI15182. [DOI] [PMC free article] [PubMed] [Google Scholar]
- 30.Manuelpillai U, Lourensz D, Vaghjiani V, Tchongue J, Lacey D, Tee JY, et al. Human amniotic epithelial cell transplantation induces markers of alternative macrophage activation and reduces established hepatic fibrosis. PLoS One. 2012;7(6):e38631. doi: 10.1371/journal.pone.0038631. [DOI] [PMC free article] [PubMed] [Google Scholar]
- 31.Shaw SW, David AL, De Coppi P. Clinical applications of prenatal and postnatal therapy using stem cells retrieved from amniotic fluid. Curr Opin Obstet Gynecol. 2011;23(2):109–116. doi: 10.1097/GCO.0b013e32834457b1. [DOI] [PubMed] [Google Scholar]
- 32.Perin L, Sedrakyan S, Giuliani S, Da Sacco S, Carraro G, Shiri L, et al. Protective effect of human amniotic fluid stem cells in an immunodeficient mouse model of acute tubular necrosis. PLoS One. 2010;5(2):e9357. doi: 10.1371/journal.pone.0009357. [DOI] [PMC free article] [PubMed] [Google Scholar]
- 33.Tajiri N, Acosta S, Glover LE, Bickford PC, Jacotte Simancas A, Yasuhara T, et al. Intravenous grafts of amniotic fluid-derived stem cells induce endogenous cell proliferation and attenuate behavioral deficits in ischemic stroke rats. PLoS One. 2012;7(8):e43779. doi: 10.1371/journal.pone.0043779. [DOI] [PMC free article] [PubMed] [Google Scholar]
- 34.Liu YH, Vaghjiani V, Tee JY, To K, Cui P, Oh DY, et al. Amniotic epithelial cells from the human placenta potently suppress a mouse model of multiple sclerosis. PLoS One. 2012;7(4):e35758. doi: 10.1371/journal.pone.0035758. [DOI] [PMC free article] [PubMed] [Google Scholar]
- 35.Rehni AK, Singh N, Jaggi AS, Singh M. Amniotic fluid derived stem cells ameliorate focal cerebral ischaemia-reperfusion injury induced behavioural deficits in mice. Behav Brain Res. 2007;183(1):95–100. doi: 10.1016/j.bbr.2007.05.028. [DOI] [PubMed] [Google Scholar]
- 36.Wei JP, Zhang TS, Kawa S, Aizawa T, Ota M, Akaike T, et al. Human amnion-isolated cells normalize blood glucose in streptozotocin-induced diabetic mice. Cell Transplant. 2003;12(5):545–552. doi: 10.3727/000000003108747000. [DOI] [PubMed] [Google Scholar]
- 37.Bollini S, Cheung KK, Riegler J, Dong X, Smart N, Ghionzoli M, et al. Amniotic fluid stem cells are cardioprotective following acute myocardial infarction. Stem Cells Dev. 2011;20(11):1985–1994. doi: 10.1089/scd.2010.0424. [DOI] [PubMed] [Google Scholar]
- 38.Delo DM, Olson J, Baptista PM, D'Agostino RB, Jr, Atala A, Zhu JM, et al. Non-invasive longitudinal tracking of human amniotic fluid stem cells in the mouse heart. Stem Cells Dev. 2008;17(6):1185–1194. doi: 10.1089/scd.2008.0028. [DOI] [PMC free article] [PubMed] [Google Scholar]
- 39.Kaviani A, Perry TE, Dzakovic A, Jennings RW, Ziegler MM, Fauza DO. The amniotic fluid as a source of cells for fetal tissue engineering. J Pediatr Surg. 2001;36(11):1662–1665. doi: 10.1053/jpsu.2001.27945. [DOI] [PubMed] [Google Scholar]
- 40.De Coppi P, Bartsch G, Jr, Siddiqui MM, Xu T, Santos CC, Perin L, et al. Isolation of amniotic stem cell lines with potential for therapy. Nat Biotechnol. 2007;25(1):100–106. doi: 10.1038/nbt1274. [DOI] [PubMed] [Google Scholar]
- 41.Stevenson S, Fowler PW, Heine T, Duchamp JC, Rice G, Glass T, et al. A stable non-classical metallofullerene family. Nature. 2000;408(6811):427–428. doi: 10.1038/35044199. [DOI] [PubMed] [Google Scholar]
- 42.Adiseshaiah P, Dellinger A, MacFarland D, Stern S, Dobrovolskaia M, Ileva L, et al. A novel gadolinium-based trimetasphere metallofullerene for application as a magnetic resonance imaging contrast agent. Invest Radiol. 2013;48(11):745–754. doi: 10.1097/RLI.0b013e318294de5d. [DOI] [PubMed] [Google Scholar]
- 43.Dellinger A, Olson J, Link K, Vance S, Sandros MG, Yang J, et al. Functionalization of gadolinium metallofullerenes for detecting atherosclerotic plaque lesions by cardiovascular magnetic resonance. J Cardiovasc Magn Reson : Off J Soc Cardiovasc Magn Reson. 2013;15:7. doi: 10.1186/1532-429X-15-7. [DOI] [PMC free article] [PubMed] [Google Scholar]
- 44.Xiao GY, Liu IH, Cheng CC, Chang CC, Lee YH, Cheng WT, et al. Amniotic fluid stem cells prevent follicle atresia and rescue fertility of mice with premature ovarian failure induced by chemotherapy. PLoS One. 2014;9(9):e106538. doi: 10.1371/journal.pone.0106538. [DOI] [PMC free article] [PubMed] [Google Scholar]
- 45.Cunningham CH, Arai T, Yang PC, McConnell MV, Pauly JM, Conolly SM. Positive contrast magnetic resonance imaging of cells labeled with magnetic nanoparticles. Magn Reson Med : Off J Soc Magn Reson Med/Soc Magn Reson Med. 2005;53(5):999–1005. doi: 10.1002/mrm.20477. [DOI] [PubMed] [Google Scholar]
- 46.Loai Y, Sakib N, Janik R, Foltz WD, Cheng HL. Human aortic endothelial cell labeling with positive contrast gadolinium oxide nanoparticles for cellular magnetic resonance imaging at 7 Tesla. Mol Imaging. 2012;11(2):166–175. [PubMed] [Google Scholar]
Associated Data
This section collects any data citations, data availability statements, or supplementary materials included in this article.


