

Abstract
Early detection of the highly aggressive malignancy cholangiocarcinoma (CCA) remains a challenge but has the potential to render the tumor curable by surgical removal. This study evaluates a biomarker panel for the diagnosis of CCA by DNA methylation analyses of biliary brush samples. The methylation status of 13 candidate genes (CDO1, CNRIP1, DCLK1, FBN1, INA, MAL, SEPT9, SFRP1, SNCA, SPG20, TMEFF2, VIM, and ZSCAN18) was investigated in 93 tissue samples (39 CCAs and 54 nonmalignant controls) using quantitative methylation‐specific polymerase chain reaction. The 13 genes were further analyzed in a test series of biliary brush samples (15 CCAs and 20 nonmalignant primary sclerosing cholangitis controls), and the methylation status of the four best performing markers was validated (34 CCAs and 34 primary sclerosing cholangitis controls). Receiver operating characteristic curve analyses were used to evaluate the performance of individual biomarkers and the combination of biomarkers. The 13 candidate genes displayed a methylation frequency of 26%‐82% in tissue samples. The four best‐performing genes (CDO1, CNRIP1, SEPT9, and VIM) displayed individual methylation frequencies of 45%‐77% in biliary brushes from CCA patients. Across the test and validation biliary brush series, this four‐gene biomarker panel achieved a sensitivity of 85% and a specificity of 98%, with an area under the receiver operating characteristic curve of 0.944. Conclusion: We report a straightforward biomarker assay with high sensitivity and specificity for CCA, outperforming standard brush cytology, and suggest that the biomarker panel, potentially in combination with cytological evaluation, may improve CCA detection, particularly among primary sclerosing cholangitis patients. (Hepatology 2015;61:1651–1659)
Abbreviations
- AUC
area under the curve
- CCA
cholangiocarcinoma
- CRC
colorectal cancer
- ERC
endoscopic retrograde cholangiography
- PMR
percent methylated reference
- PSC
primary sclerosing cholangitis
- qMSP
quantitative methylation‐specific polymerase chain reaction
- ROC
receiver operating characteristic
Cholangiocarcinoma (CCA) is a highly aggressive malignancy which is rare in the general population1 but is associated with the chronic liver disease primary sclerosing cholangitis (PSC). Primary sclerosing cholangitis is characterized by a progressive inflammation that leads to stricturing of the bile ducts and ultimately to cirrhosis and liver failure. Approximately 10% of PSC patients develop CCA, an epithelial cancer of the bile ducts which is associated with poor prognosis (median survival approximately 7 months).2 In PSC patients, differentiating benign biliary strictures from malignant changes is particularly challenging, even when using a combination of imaging modalities and biliary brush cytology.3, 4, 5 Due to the late clinical presentation and high mortality of CCA, early detection of in situ tumor cells using biomarkers with high sensitivity and specificity could be valuable as more patients could qualify for curative treatment by resection or transplantation.6 Today, the presence of advanced CCA is usually considered a contraindication for liver transplantation, due to poor survival rates.7 Efforts have been made to identify suitable biomarkers for noninvasive or minimally invasive detection of CCA in patients with and without concomitant PSC. Serum carbohydrate antigen 19‐9 is the most commonly used marker. However, the sensitivity and specificity of carbohydrate antigen 19‐9 vary considerably between studies.8 In addition, carbohydrate antigen 19‐9 may be elevated in benign conditions, negatively affecting the cancer specificity of this marker.9
Aberrant DNA methylation has been shown to be more frequent than genetic changes in cancer development10, 11 and often represents early events.12 Genes that are frequently methylated in tumor samples compared to normal tissue may represent potential biomarkers for noninvasive and early detection of several cancer types, including colorectal (CRC),13, 14, 15 prostate cancer,16 and bladder cancer.17 Recently, Shin and colleagues18 demonstrated that they could detect the majority of CCAs by analyzing DNA methylation biomarkers in bile from such patients. That study represents a “proof‐of‐principle” that a minimally invasive method can be used in the diagnosis of CCA.
Although several genes have been reported to be methylated in CCA,19, 20 only a handful have high enough sensitivity and specificity to be potential biomarkers for cancer detection using biliary brush specimens. We have previously identified biomarkers for adenomas and CRC,15 as well as for CCA.21 The aim of the present study was to determine whether biliary brush specimens can be used for CCA diagnostics and to identify the best‐performing biomarker panel.
Materials and Methods
Patient Samples
Tumor Biopsies and Nonmalignant Tissue Controls
A total of ninety‐three fresh‐frozen or formalin‐fixed, paraffin‐embedded surgical resection samples with CCA (n = 39) and nonmalignant controls (n = 54; including autoimmune hepatitis [n = 6], alcohol‐related liver disease [n = 6], cryptogenic cirrhosis [n = 1], hemochromatosis [n = 1], primary biliary cirrhosis [n = 7], PSC [n = 30], and disease‐free [n = 3]) were included. The 39 CCAs were from 27 patients. The majority (21/39, 54%) of the tumors were sporadic, whereas the rest were from PSC patients. The samples were obtained from Oslo University Hospital‐Rikshospitalet, with the exception of four fresh‐frozen CCAs obtained from Imperial College, London. The fresh‐frozen biopsies (n = 13 with CCA and n = 21 nonmalignant controls) were snap‐frozen immediately after surgery and stored at −80°C. Archival samples (n = 26 with CCA and n = 33 nonmalignant controls) were obtained from the Department of Pathology, Oslo University Hospital‐Rikshospitalet. The routine histopathological diagnosis of all samples was verified by a reference pathologist (O.P.C.). See Supporting Tables S1 and S2 for a detailed clinical description of the sample series. All samples were processed and evaluated as previously reported.21
Biliary Brush Specimens
This study included a total of 103 biliary brushes from 92 patients, obtained from Oslo University Hospital‐Rikshospitalet. The test series comprised 35 biliary brush samples from 32 patients. Twelve of these patients (15 samples) were diagnosed with CCA, and the remaining 20 samples represented nonmalignant PSC controls. The validation series consisted of 68 biliary brush specimens from 60 patients. Thirty patients (34 samples) were diagnosed with CCA, and 30 patients (34 samples) were controls. All control samples were collected from individuals who did not display any evidence of malignancy at the time of the biliary brushing. Absence of malignant development was also confirmed during follow‐up (test series: median 42 months, range 24‐49 months; validation series: median 44 months, range 13‐58 months). In addition to the CCA sample series, biliary brush samples from five gallbladder and four pancreatic cancer patients were analyzed. See Supporting Table S3 for detailed clinical information. The biliary brush samples were obtained during endoscopic retrograde cholangiography (ERC) by brushing dominant bile duct strictures. The samples were collected from patients and either snap‐frozen and stored at −80°C or ethanol‐preserved and stored at −20°C in 70% ethanol prior to molecular analyses. One to two brushes were subjected to cytology by a reference pathologist (P.J.) as part of the diagnostic routine and scored according to previously published criteria4 (Supporting Table S3). Among the brush samples, 13 had a corresponding biopsy sample from the same patient. The biopsies and brush samples were collected at different time points.
Selection of Genes
In the present study we included five CCA biomarkers (CDO1, DCLK1, SFRP1, ZSCAN18, and TMEFF2). The TMEFF2 gene has previously been shown to be aberrantly methylated in bile duct malignancy,22, 23 and the four remaining CCA biomarkers were recently identified by us.21 We and others have additionally shown that several genes are methylated across multiple gastrointestinal cancer types.15, 21, 24, 25, 26 Based on this, we also included six recently identified biomarkers with high sensitivity for CRC (CNRIP1, FBN1, INA, MAL, SNCA, and SPG20),15 as well as two biomarkers that are currently used in commercially available noninvasive clinical tests for CRC, SEPT9 (Epi proColon) and VIM (ColoSure). We have previously shown that the majority of these genes are also downregulated in various methylated cancer cell lines as well as in cholangiocarcinomas.15, 21, 27, 28, 29 All 13 genes were subjected to analyses in CCA and nonmalignant control samples, as well as in biliary brush samples collected during ERC. Their individual and combined performances were evaluated.
DNA Methylation Analysis
Bisulfite Treatment
For both tissue and biliary brush samples, DNA was isolated (see Supporting Information) and 1.3 μg was bisulfite‐treated using the EpiTect bisulfite kit (Qiagen) according to the manufacturer's protocol. Desulfonation and washing steps were performed using a QIAcube (Qiagen), and the bisulfite‐treated DNA was eluted in 40 μL elution buffer.
Quantitative Methylation‐Specific Polymerase Chain Reaction
The primer and probe sequences as well as the reaction conditions for ALU (normalization control), CDO1, CNRIP1, DCLK1, FBN1, INA, MAL, SFRP1, SNCA, SPG20, TMEFF2, and ZSCAN18 were previously reported.15, 17, 21 For SEPT9 and VIM, primers and probes were modified24, 30 using Primer Express v3.0 (Life Technologies). All quantitative methylation‐specific polymerase chain reaction (qMSP) assays were designed to have a maximum length of 150 bases and covered ≥7 CpG sites. The methylation status of these sites in the sample of interest determines whether the qMSP product amplifies or not. In order to discriminate successfully converted bisulfite‐modified DNA from potentially nonconverted DNA, a minimum of five cytosines (not included in CpG sites) were included in each assay. All primers, probes, and the number of targeted CpGs for the individual qMSP assays are summarized in Supporting Table S4. Primers were purchased from BioNordika‐Medprobe (Oslo, Norway), and probes were from Life Technologies. All qMSPs were carried out in triplicate in 384‐well plates. The total reaction volume was 20 μL and included 0.9 μM of each primer, 0.2‐μM probes (labeled with 6‐fluorescein amidite and a nonfluorescent quencher), 30 ng bisulfite‐treated template, and 1× TaqMan Universal PCR master mix NoAmpErase UNG (Life Technologies). Amplification was performed at 95°C for 15 minutes before 45 cycles of 15 seconds at 95°C and 1‐minute elongation at 60°C, using the TaqMan‐7900HF (Life Technologies). Bisulfite‐converted completely methylated DNA (Millipore) served as a positive control and was also used to generate a standard curve by 1:5 serial dilutions (32.5‐0.052 ng). The ALU‐C4 gene31 was used for normalization. In addition, bisulfite‐treated and untreated DNA from normal lymphocytes and water blanks were used as negative controls.
For DNA methylation analyses, tissue samples were censored after cycle 35 and brush samples after 40 using the SDS2.3 software (Life Technologies), and the median quantity value was used for further processing (Microsoft Excel). Briefly, percent methylated reference (PMR) was calculated by dividing the gene:ALU ratio in the sample by the gene:ALU ratio of the positive control (completely methylated DNA) and multiplying by 100. To ensure high specificity, individual scoring thresholds to call samples unmethylated or methylated were established for each assay for each sample type (fresh‐frozen tissue, archival tissue, and brush samples). The thresholds were set using the integer above the highest PMR value across the respective normal samples, and samples with higher PMR values than the thresholds were scored as methylation‐positive (Supporting Table S5).
Ethics
All patients in this study gave informed consent, and the project was approved by the regional committee for research ethics in southeastern Norway (S‐08512b2008/16133).
Statistics
Receiver operating characteristic (ROC) curve analysis using individual PMR values was used to evaluate the suitability of the methylated genes to separate CCAs from nonmalignant PSC controls. The ROC curves for the combined biomarker panel were based on the sum of PMR values.
Results
Methylated Genes in Tissue Samples
The methylation status of the biomarkers CNRIP1, FBN1, INA, MAL, SEPT9, SNCA, SPG20, TMEFF2, and VIM in a series of CCAs (n = 39) versus 54 nonmalignant controls resulted in a sensitivity of 82%, 18%, 31%, 79%, 26%, 31%, 54%, 73%, and 37%, respectively, and a specificity of 100% (Supporting Table S6). The resulting areas under the curve (AUC) for these individual genes are summarized in Table 1. Methylation frequencies and ROC curves for CDO1, DCLK1, SFRP1, and ZSCAN18 have been reported previously in the same sample series (combined sensitivity of 87%, specificity of 100%, and AUC of 0.924).21 Supporting Fig. S1 summarizes available gene expression data for CDO1, CNRIP1, SEPT9, and VIM from The Cancer Genome Atlas.
Table 1.
AUC Values From ROC Analyses of Individual Genes Analyzed in Tissue and Biliary Brush Samples
| Tissue Samples | Biliary Brush Samples | |||||||
|---|---|---|---|---|---|---|---|---|
| Test Series | Validation Series | Combined Series | ||||||
| Gene | AUC | Asymptotic Significance | AUC | Asymptotic Significance | AUC | Asymptotic Significance | AUC | Asymptotic Significance |
| CDO1 | 0.907b | 2.39E‐11 | 0.815 | 0.002 | 0.975 | 1.33E‐10 | 0.933 | 2.58E‐13 |
| CNRIP1 | 0.931 | 1.51E‐12 | 0.818 | 0.001 | 0.930 | 5.97E‐9 | 0.901 | 1.27E‐11 |
| SEPT9 | 0.632a | 0.032 | 0.789a | 0.004 | 0.799 | 5.13E‐5 | 0.795 | 6.60E‐7 |
| VIM | 0.684a | 0.003 | 0.825 | 0.001 | 0.789 | 9.55E‐5 | 0.797 | 5.15E‐7 |
| TMEFF2 | 0.930a | 2.67E‐12 | 0.663a | 0.107 | — | — | — | — |
| MAL | 0.905 | 3.19E‐11 | 0.770 | 0.007 | — | — | — | — |
| SFRP1 | 0.795b | 1.31E‐6 | 0.710 | 0.036 | — | — | — | — |
| ZSCAN18 | 0.769b | 1.07E‐5 | 0.753 | 0.011 | — | — | — | — |
| SPG20 | 0.765 | 1.40E‐5 | 0.503 | 0.973 | — | — | — | — |
| DCLK1 | 0.752b | 3.56E‐5 | 0.682 | 0.069 | — | — | — | — |
| INA | 0.734 | 1.24E‐4 | 0.675 | 0.080 | — | — | — | — |
| SNCA | 0.647 | 0.016 | 0.250 | 0.012 | — | — | — | — |
| FBN1 | 0.546 | 0.450 | 0.750 | 0.012 | — | — | — | — |
For tissue samples, sample set includes 34 fresh frozen (n = 13 with CCA and n = 21 nonmalignant normals) and 59 formalin‐fixed tissue samples (n = 26 with CCA and n = 33 nonmalignant normals). For biliary brushes, test series includes 35 biliary brush samples (n = 15 with CCA and n = 20 controls). Validation series includes 68 biliary brush samples (n = 34 with CCA and n = 34 controls).
For tissue sample, data missing for one CCA. For biliary brushes, data missing from one CCA and one control.
Previously published results.21
Methylated Genes in Biliary Brush Samples
Using qMSP, the promoter methylation of all 13 genes, CNRIP1, SEPT9, ZSCAN18, CDO1, TMEFF2, MAL, SFRP1, VIM, FBN1, DCLK1, INA, SPG20, and SNCA, was analyzed in a test series of biliary brush cytology specimens (n = 35), resulting in methylation frequencies of 67%, 67%, 53%, 47%, 40%, 40%, 40%, 33%, 33%, 27%, 20%, 20%, and 7%, respectively. All genes were unmethylated in the 20 nonmalignant controls, providing 100% specificity. From ROC curve analysis, CDO1, CNRIP1, SEPT9, and VIM showed the highest individual AUC values of 0.815, 0.818, 0.789, and 0.825, respectively (all AUC values are listed in Table 1). A biomarker panel based on these four genes achieved an AUC value of 0.854 (asymptotic significance 4.60E‐4) in biliary brush samples. The panel was considered positive if a minimum of one out of the four genes included was methylated, resulting in a sensitivity and specificity of 73% and 100%, respectively (Table 2).
Table 2.
Methylation Frequency of Individual Markers and the Combined Biomarker Panel in Biliary Brush Sample Sets
| Samples/Biomarkers | CDO1 | CNRIP1 | SEPT9 | VIM | Biomarker Panel |
|---|---|---|---|---|---|
| CCA biliary brush test set (n = 15) | 47% (7/15) | 67% (10/15) | 67% (10/15) | 33% (5/15) | 73% (11/15) |
| CCA biliary brush validation set (n = 34) | 91% (29/32) | 72% (23/32) | 53% (17/32) | 50% (16/32) | 91% (29/32) |
| CCA biliary brush sample sets combined (n = 49) | 77% (36/47) | 70% (33/47) | 57% (27/47) | 45% (21/47) | 85% (40/47) |
| Control/PSC biliary brush sample sets combined (n = 54) | 2% (1/50) | 0% (0/50) | 0% (0/49) | 0% (0/50) | 2% (1/49) |
These four best‐performing genes from the test series, CDO1, CNRIP1, SEPT9, and VIM, were subsequently analyzed in a larger validation series (n = 68). The methylation frequencies were somewhat higher than for the test series, ranging 50%‐91% for the individual markers; and as many as 29 of the 32 CCA samples (91%) could be detected by the four‐gene panel. The ROC curve analysis of the validation series revealed an AUC of 0.976 (asymptotic significance 1.22E‐10) in CCAs versus controls. For both sample series combined (n = 103), the frequency of methylation for the individual genes ranged 45%‐77% (representative traces of qMSP analyses are shown in Supporting Fig. S2), and the biomarker panel displayed a sensitivity of 85% with 98% specificity (Table 2) with a combined AUC value of 0.944 (asymptotic significance 6.67E‐14) (Fig. 1).
Figure 1.
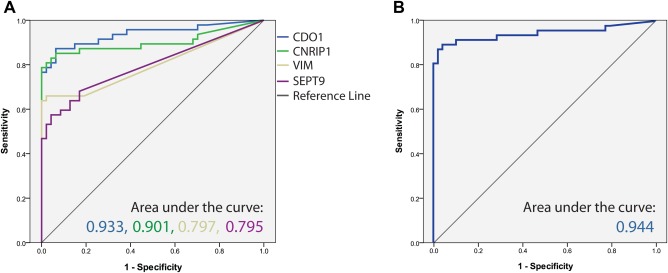
Receiver operating characteristic curves for the four‐gene biomarker panel in all biliary brush samples. The area under the ROC curve is depicted for (A) the biomarkers CDO1, CNRIP1, SEPT9, and VIM and for (B) the combined biomarker panel, which is based on the sum of the four PMR values.
Performance of the Biomarker Panel Versus Routine Cytology of Biliary Brush Samples
We compared the results of the routine cytological analyses with that of the four‐gene biomarker panel in biliary brush samples (Fig. 2). In the test series, cytology had been performed in 12/15 biliary brush samples from CCA patients and was scored positive in seven of them, achieving a sensitivity of 58%, whereas the biomarker panel was analyzed in all 15 samples and was positive in 11 of them, providing a sensitivity of 73%. Both analyses provided 100% specificity. In the validation series, cytology was performed in 32/34 biliary brush samples with CCA and detected 63% of them. Additionally, among the 34 control samples one sample was scored as positive, resulting in 97% specificity. In comparison, the biomarker panel detected 91% (29/32 samples) of the CCA samples, with 97% specificity.
Figure 2.
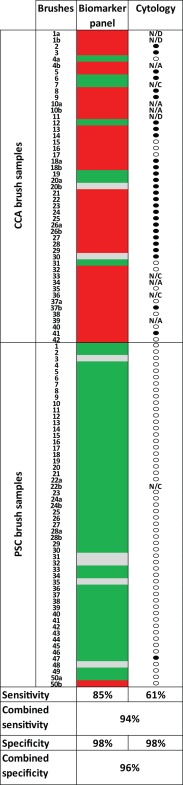
Comparing the performance of the biomarker panel with that of conventional cytology in biliary brush samples. For the biomarker panel (CDO1, CNRIP1, SEPT9, and VIM), see the following color code: red, methylated; green, unmethylated; gray, not available. For cytology: closed circle, positive; open circle, negative (scored according to Boberg et al.4). Control sample 50 has been discussed in the main text. Abbreviations: N/A, not available; N/C, not enough cells present for analysis; N/D, no data.
For two of the patients (5 and 12 in Fig. 2) cytology was performed on two parallel brushes, and the most severe category was used in comparison with the biomarker panel. Across the test and validation series, cytology failed in 19 brushes: 11 were incorrectly scored as negative, one was incorrectly scored as positive, four provided insufficient material, and the three remaining samples could not be interpreted (most likely due to fungal contamination). Conversely, the biomarker panel was negative in seven of the biliary brush samples from CCA patients, including two which were also scored as negative by cytology. One brush from a PSC control was scored as positive. Combining the two analyses (positive biomarker panel, positive cytology, or both) resulted in an improved sensitivity (94%) compared to the individual achievement of each modality (Fig. 2).
For seven of the CCA and four of the PSC patients, two independent brushes from each individual were analyzed. Concordant results between the two brushes were found for five of the CCA patients and three controls (Fig. 2). At the patient level (in contrast to the biliary brush sample level presented above), individuals with one or more positive brush samples were counted as positive. This resulted in a sensitivity of 85% (35/41 patients) and a specificity of 98% for the biomarker panel. Among the 39 patients with CCA evaluated by cytology, 24 were identified as positive, resulting in a sensitivity and specificity of 62% and 98%, respectively. Combining both analyses resulted in 95% sensitivity and 96% specificity.
Biomarker Panel Performance in Gallbladder and Pancreatic Cancers
Among the four gallbladder cancer patients, the biomarker panel was positive in three (75%) of the biliary brush samples analyzed by qMSP. In comparison, brush cytology identified one of five analyzed patients (20%). Combining these results did not improve the overall sensitivity (60%). Similarly, for pancreatic cancer patients the biomarker panel identified three of four (75%) tumors, whereas brush cytology was positive in two out of the four (50%) samples. Combining both methods (positive biomarker panel or positive cytology) led to detection of all four (100%) cancers (see Supporting Fig. S3).
Comparison of Paired Tissue and Biliary Brush Samples
Paired tissue and brush samples were available from 13 of the patients included in this study (nine with CCA and four controls with PSC but no CCA). As expected, the methylation status of the four‐gene biomarker panel showed good concordance between the biliary brush samples and the corresponding tissue sample (Supporting Fig. S4). Among the eight patients with methylation‐positive CCA, six were detected by analysis of the corresponding biliary brush sample. It should be noted that the two CCA patients who could not be detected by methylation analysis of the biliary brush samples had low PMR values in their tissue sample (just above the scoring threshold, data not shown). It should also be noted that the biopsies and brush samples were collected at different time points. One CCA and the four nonmalignant control samples were methylation‐negative in both tissue and biliary brush samples.
Discussion
We have shown aberrant methylation of CNRIP1, FBN1, INA, MAL, SEPT9, SNCA, SPG20, and VIM in CCA, all novel targets genes for this malignancy. Furthermore, we have evaluated whether the methylation status of these genes and of the previously reported CDO1, DCLK, SFRP1, TMEFF2, and ZSCAN18 genes21, 22, 23 have diagnostic potential as a minimally invasive CCA test. Analyses of biliary brush samples showed that the best‐performing single markers (based on AUC values) were CDO1, CNRIP1, and VIM. We, and others, have previously shown that a biomarker panel including a manageable number of genes can provide higher sensitivity and specificity than individual markers15, 24, 32 and most likely an increased robustness to a noninvasive routine and/or commercial test. The best‐performing panel in the present study included CDO1, CNRIP1, SEPT9, and VIM. Although the role of these genes in cancer is not fully understood (Supporting Information), the high performance of the identified four‐gene biomarker panel suggests that it could be suitable for discriminating malignant bile duct changes from the benign and inflammatory‐related changes observed in PSC patients. Since DNA methylation frequently occurs early in carcinogenesis, this biomarker panel has the potential to diagnose CCA at an early stage that can be cured by liver transplantation.
Several aberrantly methylated genes are often shared among cancer types in general33 and cancers of the gastrointestinal tract in particular.24 Previous analyses performed in our laboratory, using a substantial number of cancer cell lines, further underscored this observation.15, 21 Thus, several high‐performing biomarkers of CRC were selected for analyses in the present study, including a six‐gene biomarker panel previously identified by us.15 As expected, these genes were also methylated in CCA, although at lower frequencies. Such a dual presentation (in both CCA and the much more common CRC) could potentially negatively affect the diagnostic accuracy, in particular of a blood‐based test. However, using site‐specific sampling, here represented by biliary brush samples, will reduce the potential source of false positives.
Biliary dysplasia has previously been shown to be a marker of CCA in liver biopsy from PSC patients.34 For this patient group biliary brushes represent an attractive source of biological material since they can be regularly obtained during patient follow‐up. Conventional biliary brush cytology is currently a mainstay in CCA diagnosis. Although the specificity of this technique is generally high, the sensitivity varies considerably between centers, usually in the range 30%‐70%.4, 35 This variation can in part be explained by the difficulties in differentiating between malignant changes and the reactive inflammatory epithelium seen in patients with PSC. Also, different degrees of dysplasia can be present in these patients, and it is not straightforward to determine the scoring thresholds for categorizing these. This underscores that brush sample cytology currently is not a standardized method and that the results will be dependent on the sampling technique of the endoscopist and the experience of the cytopathologist who prepares and scores the sample.36 In the present study the brush cytology samples have been scored according to previously established criteria from our institution.4 Although the issues concerning sampling technique during ERC and whether the biliary brushes will contain representative material or not will also influence a molecularly based test, the analytical part of such a test could, in contrast to cytology, easily be standardized and run routinely in any diagnostic lab, preferably using fluorescence‐based real‐time polymerase chain reaction. Parsi and colleagues recently used such technology to analyze a panel of DNA methylation markers in a subset of biliary brush samples, achieving a sensitivity and specificity of ∼80%.37 Although limited by a small sample number of CCAs, the Parsi et al. study represents a clinical proof‐of‐principle, demonstrating that molecular analyses of brush samples can be used in the diagnosis of CCA. However, in a clinical setting, a higher specificity would be crucial in order to avoid unnecessary cancer treatment of patients without CCA. Moreover, the PSC background of CCA may represent a particular challenge since the presence of chronic inflammation has been shown to increase aberrant DNA methylation.38 The biomarker panel presented here was adjusted to achieve a specificity of 100% in the test series, which naturally comes at a cost of reduced sensitivity. In spite of this, the biomarker panel achieved a higher sensitivity compared to conventional brush cytology (85% versus 61%, respectively). Overall, our molecular findings coincided well with the cytology. Importantly, combining the two approaches further increased the sensitivity to 94% across the biliary brush sample series, underscoring the idea that more PSC patients with malignant transformation could be detected by implementing this biomarker panel–based test in clinical practice.
Interestingly, for some of the CCA patients included in the study we had two available brush samples collected at separate follow‐ups. For one of these patients the biomarker panel was negative in one brush and positive in the other. This discrepancy most likely reflects the challenge of collecting representative material during the bile duct brushing procedure. This further underscores the advantage of testing multiple brushes from the same individual, which increases the sensitivity of the test without necessarily compromising the specificity. This was clearly seen for the cytology in the present analysis, where two parallel brushes had been sampled and analyzed from some of the cancer patients. The brushes had diverging results, and the most severe category was used in the comparison with the biomarker panel. The low costs of the qMSP analysis further support a molecular approach, in addition to the intrinsic analytical sensitivity of the method.39
From the inherent nature of ERC‐derived brush samples one might expect a bias in the final biomarker results in the sense that extrahepatic lesions may be easier to detect compared with intrahepatic lesions. Although the number of intrahepatic cancers included in this study (15/49 cancers) is too low for conclusive data, the performance of the biomarker panel is not decreased in this group (Mann‐Whitney U, P = 0.380; data not shown). Rather, the high sensitivity, also for the intrahepatic lesions, may suggest a potential for the biomarker panel to detect cancer cells and/or free‐floating tumor DNA from lesions located upstream in the biliary tree, independent of tumor location. This is further underscored by the promising sensitivity for gallbladder cancers in the present study.
In eight of 49 CCA cases in the biliary brush series, a biopsy confirming the presence of CCA was lacking. By thorough clinical, radiological, and tumor marker assessment, these patients were determined to have CCAs and included in the study. Control brush cytology specimens were obtained from nonmalignant bile ducts, including from PSC patients. To make sure that they were representative controls and that they did not develop malignancy shortly after sample collection, these patients were followed up for a median of 43 months. In a single control PSC patient (sample 50, Fig. 2), the biomarker panel analysis provided a false positive in one of the two collected brushes. Although no malignancy had been detected in the analyzed specimen, unusually large dysplastic nodules were reported in the explanted liver. For the CCAs, routine histopathological tumor diagnoses were verified by a reference pathologist, and only tumors with >5% tumor cells were included in subsequent analyses. The majority of them were advanced. For one of the few CCA patients who could not be detected by biomarker analysis (false negative) the time lag from biliary brush collection (2008) to confirmation of CCA by biopsy (2012) was substantial. This obviously may have negatively affected the end result. Interestingly, one of the positive biliary brushes was from a patient with a tumor of limited size (15 mm) identified in the explanted liver. There were no signs of spreading, which indicates that this could represent an early CCA. We also observed a methylation‐positive brush sample from a patient with the lowest grade of dysplasia (data not shown), indicating that the biomarker panel also may detect CCAs at an early stage.
In the present study the performance of the novel biomarker panel was evaluated in both a test and a validation series of biliary brushings. The collective number of samples (n = 103), including 49 CCAs, is to our knowledge among the largest reported and supports the biomarker panel as a robust classifier. However, the potential of these markers to detect early‐stage CCA (i.e., CCA in situ) by a longitudinal follow‐up of PSC patients should also be assessed, preferably in prospective studies.
In summary, we have defined a novel biomarker panel (CDO1, CNRIP1, SEPT9, and VIM) that accurately identifies malignancy in biliary brush samples from CCA patients. The cancer specificity was also retained among PSC patients who present with inflammatory biliary epithelium. Combining the biomarker panel with conventional brush cytology increased the sensitivity for CCA detection. The identified biomarker panel is promising for the development of a routine molecular test for monitoring PSC patients for CCA development.
Supporting information
Additional Supporting Information may be found at onlinelibrary.wiley.com/doi/10.1002/hep.27707/suppinfo
Supplementary Information
Potential conflict of interest: Nothing to report.
Supported by a Ph.D. grant from The Norwegian PSC Research Center (to K.A.). This work was partly supported by the Research Council of Norway through its Centres of Excellence funding scheme (project 179571). The study was also supported by grants from the Norwegian Cancer Society and South‐Eastern Norway Regional Health Authority (project 39535/ 2013067).
References
- 1. Bragazzi MC, Cardinale V, Carpino G, Venere R, Semeraro R, Gentile R, et al. Cholangiocarcinoma: epidemiology and risk factors. Transl Gastrointest Cancer 2012;1:21‐32. [Google Scholar]
- 2. Ahrendt SA, Pitt HA, Nakeeb A, Klein AS, Lillemoe KD, Kalloo AN, et al. Diagnosis and management of cholangiocarcinoma in primary sclerosing cholangitis. J Gastrointest Surg 1999;3:357‐367. [DOI] [PubMed] [Google Scholar]
- 3. Boberg KM, Bergquist A, Mitchell S, Pares A, Rosina F, Broome U, et al. Cholangiocarcinoma in primary sclerosing cholangitis: risk factors and clinical presentation. Scand J Gastroenterol 2002;37:1205‐1211. [DOI] [PubMed] [Google Scholar]
- 4. Boberg KM, Jebsen P, Clausen OP, Foss A, Aabakken L, Schrumpf E. Diagnostic benefit of biliary brush cytology in cholangiocarcinoma in primary sclerosing cholangitis. J Hepatol 2006;45:568‐574. [DOI] [PubMed] [Google Scholar]
- 5. Campbell WL, Ferris JV, Holbert BL, Thaete FL, Baron RL. Biliary tract carcinoma complicating primary sclerosing cholangitis: evaluation with CT, cholangiography, US, and MR imaging. Radiology 1998;207:41‐50. [DOI] [PubMed] [Google Scholar]
- 6. Boberg KM, Jebsen P, Clausen OP, Aabakken L, Brekke I, Schrumpf E. Cholangiocarcinoma in situ in primary sclerosing cholangitis: diagnosis by brush cytology and treatment by liver transplantation. J Hepatol 2003;39:453. [DOI] [PubMed] [Google Scholar]
- 7. Brandsaeter B, Isoniemi H, Broome U, Olausson M, Backman L, Hansen B, et al. Liver transplantation for primary sclerosing cholangitis; predictors and consequences of hepatobiliary malignancy. J Hepatol 2004;40:815‐822. [DOI] [PubMed] [Google Scholar]
- 8. Boberg KM, Lind GE. Primary sclerosing cholangitis and malignancy. Best Pract Res Clin Gastroenterol 2011;25:753‐764. [DOI] [PubMed] [Google Scholar]
- 9. Sinakos E, Saenger AK, Keach J, Kim WR, Lindor KD. Many patients with primary sclerosing cholangitis and increased serum levels of carbohydrate antigen 19‐9 do not have cholangiocarcinoma. Clin Gastroenterol Hepatol 2011;9:434‐439. [DOI] [PubMed] [Google Scholar]
- 10. Schuebel KE, Chen W, Cope L, Glockner SC, Suzuki H, Yi JM, et al. Comparing the DNA hypermethylome with gene mutations in human colorectal cancer. PLoS Genet 2007;3:1709‐1723. [DOI] [PMC free article] [PubMed] [Google Scholar]
- 11. Tsai HC, Baylin SB. Cancer epigenetics: linking basic biology to clinical medicine. Cell Res 2011;21:502‐517. [DOI] [PMC free article] [PubMed] [Google Scholar]
- 12. Laird PW. The power and the promise of DNA methylation markers. Nat Rev Cancer 2003;3:253‐266. [DOI] [PubMed] [Google Scholar]
- 13. Zou H, Harrington JJ, Shire AM, Rego RL, Wang L, Campbell ME, et al. Highly methylated genes in colorectal neoplasia: implications for screening. Cancer Epidemiol Biomarkers Prev 2007;16:2686‐2696. [DOI] [PubMed] [Google Scholar]
- 14. deVos T, Tetzner R, Model F, Weiss G, Schuster M, Distler J, et al. Circulating methylated SEPT9 DNA in plasma is a biomarker for colorectal cancer. Clin Chem 2009;55:1337‐1346. [DOI] [PubMed] [Google Scholar]
- 15. Lind GE, Danielsen SA, Ahlquist T, Merok MA, Andresen K, Skotheim RI, et al. Identification of an epigenetic biomarker panel with high sensitivity and specificity for colorectal cancer and adenomas. Mol Cancer 2011;10:85. [DOI] [PMC free article] [PubMed] [Google Scholar]
- 16. Cairns P, Esteller M, Herman JG, Schoenberg M, Jeronimo C, Sanchez‐Cespedes M, et al. Molecular detection of prostate cancer in urine by GSTP1 hypermethylation. Clin Cancer Res 2001;7:2727‐2730. [PubMed] [Google Scholar]
- 17. Costa VL, Henrique R, Danielsen SA, Duarte‐Pereira S, Eknaes M, Skotheim RI, et al. Three epigenetic biomarkers, GDF15, TMEFF2, and VIM, accurately predict bladder cancer from DNA‐based analyses of urine samples. Clin Cancer Res 2010;16:5842‐5851. [DOI] [PubMed] [Google Scholar]
- 18. Shin SH, Lee K, Kim BH, Cho NY, Jang JY, Kim YT, et al. Bile‐based detection of extrahepatic cholangiocarcinoma with quantitative DNA methylation markers and its high sensitivity. J Mol Diagn 2012;14:256‐263. [DOI] [PubMed] [Google Scholar]
- 19. Isomoto H. Epigenetic alterations associated with cholangiocarcinoma [review]. Oncol Rep 2009;22:227‐232. [PubMed] [Google Scholar]
- 20. Tischoff I, Wittekind C, Tannapfel A. Role of epigenetic alterations in cholangiocarcinoma. J Hepatobiliary Pancreat Surg 2006;13:274‐279. [DOI] [PubMed] [Google Scholar]
- 21. Andresen K, Boberg KM, Vedeld HM, Honne H, Hektoen M, Wadsworth CA, et al. Novel target genes and a valid biomarker panel identified for cholangiocarcinoma. Epigenetics 2012;7:1249‐1257. [DOI] [PMC free article] [PubMed] [Google Scholar]
- 22. Kim BH, Cho NY, Choi M, Lee S, Jang JJ, Kang GH. Methylation profiles of multiple CpG island loci in extrahepatic cholangiocarcinoma versus those of intrahepatic cholangiocarcinomas. Arch Pathol Lab Med 2007;131:923‐930. [DOI] [PubMed] [Google Scholar]
- 23. Kim BH, Cho NY, Shin SH, Kwon HJ, Jang JJ, Kang GH. CpG island hypermethylation and repetitive DNA hypomethylation in premalignant lesion of extrahepatic cholangiocarcinoma. Virchows Arch 2009;455:343‐351. [DOI] [PubMed] [Google Scholar]
- 24. Lind GE, Ahmed D, Lothe RA. Vimentin in upper gastrointestinal pathologies [letter]. Cancer Epidemiol Biomarkers Prev 2012;21:1889. [DOI] [PubMed] [Google Scholar]
- 25. Moinova H, Leidner RS, Ravi L, Lutterbaugh J, Barnholtz‐Sloan JS, Chen Y, et al. Aberrant vimentin methylation is characteristic of upper gastrointestinal pathologies. Cancer Epidemiol Biomarkers Prev 2012;21:594‐600. [DOI] [PMC free article] [PubMed] [Google Scholar]
- 26. Vedeld HM, Andresen K, Eilertsen I, Nesbakken A, Seruca R, Gladhaug I, et al. The novel colorectal cancer biomarkers CDO1, ZSCAN18 and ZNF331 are frequently methylated across gastrointestinal cancers. Int J Cancer 2015;136:844‐853. [DOI] [PMC free article] [PubMed] [Google Scholar]
- 27. Lind GE, Raiborg C, Danielsen SA, Rognum TO, Thiis‐Evensen E, Hoff G, et al. SPG20, a novel biomarker for early detection of colorectal cancer, encodes a regulator of cytokinesis. Oncogene 2011;30:3967‐3978. [DOI] [PMC free article] [PubMed] [Google Scholar]
- 28. Vedeld HM, Skotheim RI, Lothe RA, Lind GE. The recently suggested intestinal cancer stem cell marker DCLK1 is an epigenetic biomarker for colorectal cancer. Epigenetics 2014;9:346‐350. [DOI] [PMC free article] [PubMed] [Google Scholar]
- 29. Lind GE, Ahlquist T, Kolberg M, Berg M, Eknaes M, Alonso MA, et al. Hypermethylated MAL gene—a silent marker of early colon tumorigenesis. J Transl Med 2008;6:13. [DOI] [PMC free article] [PubMed] [Google Scholar]
- 30. Lofton‐Day C, Model F, deVos T, Tetzner R, Distler J, Schuster M, et al. DNA methylation biomarkers for blood‐based colorectal cancer screening. Clin Chem 2008;54:414‐423. [DOI] [PubMed] [Google Scholar]
- 31. Weisenberger DJ, Campan M, Long TI, Kim M, Woods C, Fiala E, et al. Analysis of repetitive element DNA methylation by MethyLight. Nucleic Acids Res 2005;33:6823‐6836. [DOI] [PMC free article] [PubMed] [Google Scholar]
- 32. Anglim PP, Galler JS, Koss MN, Hagen JA, Turla S, Campan M, et al. Identification of a panel of sensitive and specific DNA methylation markers for squamous cell lung cancer. Mol Cancer 2008;7:62. [DOI] [PMC free article] [PubMed] [Google Scholar]
- 33. Esteller M, Corn PG, Baylin SB, Herman JG. A gene hypermethylation profile of human cancer. Cancer Res 2001;61:3225‐3229. [PubMed] [Google Scholar]
- 34. Fleming KA, Boberg KM, Glaumann H, Bergquist A, Smith D, Clausen OP. Biliary dysplasia as a marker of cholangiocarcinoma in primary sclerosing cholangitis. J Hepatol 2001;34:360‐365. [DOI] [PubMed] [Google Scholar]
- 35. Charatcharoenwitthaya P, Enders FB, Halling KC, Lindor KD. Utility of serum tumor markers, imaging, and biliary cytology for detecting cholangiocarcinoma in primary sclerosing cholangitis. Hepatology 2008;48:1106‐1117. [DOI] [PubMed] [Google Scholar]
- 36. Chadwick BE. Beyond cytomorphology: expanding the diagnostic potential for biliary cytology. Diagn Cytopathol 2012;40:536‐541. [DOI] [PubMed] [Google Scholar]
- 37. Parsi MA, Li A, Li CP, Goggins M. DNA methylation alterations in endoscopic retrograde cholangiopancreatography brush samples of patients with suspected pancreaticobiliary disease. Clin Gastroenterol Hepatol 2008;6:1270‐1278. [DOI] [PMC free article] [PubMed] [Google Scholar]
- 38. Chiba T, Marusawa H, Ushijima T. Inflammation‐associated cancer development in digestive organs: mechanisms and roles for genetic and epigenetic modulation. Gastroenterology 2012;143:550‐563. [DOI] [PubMed] [Google Scholar]
- 39. Eads CA, Danenberg KD, Kawakami K, Saltz LB, Blake C, Shibata D, et al. MethyLight: a high‐throughput assay to measure DNA methylation. Nucleic Acids Res 2000;28:E32. [DOI] [PMC free article] [PubMed] [Google Scholar]
Associated Data
This section collects any data citations, data availability statements, or supplementary materials included in this article.
Supplementary Materials
Additional Supporting Information may be found at onlinelibrary.wiley.com/doi/10.1002/hep.27707/suppinfo
Supplementary Information