

Abstract
BACKGROUND
The mammalian target of rapamycin (mTOR) pathway is essential for tumor development, yet mTOR inhibitors have yielded modest results. This phase 1 study investigated the mTORC1/mTORC2 inhibitor CC‐223 in patients with advanced cancer.
METHODS
Patients with advanced solid tumors or multiple myeloma received an initial dose of 7.5‐60 mg of CC‐223, followed by oral daily dosing in 28‐day cycles until disease progression. The primary objective was to determine the safety, tolerability, nontolerated dosage, maximum tolerated dosage (MTD), and preliminary pharmacokinetic profile. Secondary objectives were to evaluate pharmacodynamic effects and to describe preliminary efficacy.
RESULTS
Twenty‐eight patients were enrolled and received ≥1 dose of CC‐223. The most common treatment‐related grade 3 adverse events were hyperglycemia, fatigue, and rash. Four patients had dose‐limiting toxicities, including hyperglycemia, rash, fatigue, and mucositis. Therefore, 45 mg/d was determined to be the MTD. The pharmacokinetics of CC‐223 demonstrated a mean terminal half‐life ranging from 4.86 to 5.64 hours and maximum observed plasma concentration ranging from 269 to 480 ng/mL in patients who received CC‐223 ≥45 mg/d. Phosphorylation of mTORC1/mTORC2 pathway biomarkers in blood cells was inhibited by CC‐223 ≥30 mg/d with an exposure‐response relationship. Best responses included 1 partial response (breast cancer; response duration 220 days; 30‐mg/d cohort), stable disease (8 patients across ≥15 mg/d cohorts; response duration range, 36‐168 days), and progressive disease (12 patients). The disease control rate was 32%.
CONCLUSIONS
CC‐223 was tolerable, with manageable toxicities. Preliminary antitumor activity, including tumor regression, and evidence of mTORC1/mTORC2 pathway inhibition were observed. Cancer 2015;121:3435–43. © 2015 American Cancer Society.
Keywords: AKT, mTOR, mTORC1/mTORC2, rapalogs
Short abstract
CC‐223 inhibits both mTORC1 and mTORC2, a feature thought to increase the efficiency of mTOR pathway suppression that distinguishes this agent from rapamycin and its analogs that primarily target mTORC1 alone. In a phase 1 study of patients with advanced solid tumors or multiple myeloma, CC‐223 was tolerable with manageable toxicities, and treatment was associated with early signs of disease control, including tumor regression.
INTRODUCTION
The phosphoinositide 3‐kinase (PI3K), protein kinase B (AKT), mammalian target of rapamycin (mTOR) pathway is essential for tumor cell proliferation, survival, and metabolic activity in many cancers.1, 2
Inhibitors of the mTOR pathway, such as rapamycin and its analogs (ie, rapalogs), have been extensively studied as anticancer treatments, and several (temsirolimus, everolimus, and ridaforolimus) have been approved or are in phase 3 trials for different cancer types.3, 4, 5 However, these have yielded modest single‐agent clinical activity.4, 5, 6 Rapalogs predominantly inhibit mTOR complex 1 (mTORC1), and the efficacy of rapalogs may be partially restricted by failure to prevent AKT activation through mTOR complex 2 (mTORC2), a functionally distinct mTOR complex, or by limited inhibition of mTORC1‐mediated phosphorylation of eukaryotic translation initiation factor 4E–binding protein 1 (4EBP1).6, 7 The 4EBPs are critical mediators of mTORC1 effects on cell proliferation,8 and rapalogs do not inhibit mTORC1‐mediated phosphorylation of 4EBP1.7 Inhibition of both mTORC1 and mTORC2 leads to more effective inhibition of cancer cell proliferation than blocking mTORC1 alone.6, 8 Inhibitors of mTOR kinase that function through both the 4EBP1 and p70 S6 kinase 1 arms of mTORC1 and the mTORC2 kinase pathway are in clinical development.9, 10
CC‐223 is an adenosine‐5′‐triphosphate–competitive inhibitor of the mTOR kinase that targets mTORC1 (both 4EBP1 and p70 S6 kinase 1) and mTORC2, preventing upregulation of AKT phosphorylation, differentiating it from the rapalogs.11, 12 In preclinical studies, CC‐223 was a potent (half‐maximal inhibitory concentration = 16 nM) mTOR kinase inhibitor with >150‐fold sensitivity over the related lipid kinase, PI3Kα.12, 13 CC‐223 is active against many non‐Hodgkin lymphoma cell lines13 and solid tumor lines, including breast, glioma, hepatocellular carcinoma (HCC), and non–small cell lung cancer. CC‐223 has demonstrated single‐agent activity in several human tumor xenograft models, including U87 glioblastoma multiforme and PC3 prostate cancer.12, 13
The primary objective of this phase 1 study was to determine the safety, tolerability, nontolerated dosage (NTD), and maximum tolerated dosage (MTD) of orally administered CC‐223 and the preliminary pharmacokinetics (PK) of CC‐223 in patients with advanced solid tumors (AST) or multiple myeloma (MM). Secondary objectives were to evaluate inhibition of tissue biomarkers S6 ribosomal protein (S6RP), 4EBP1, and AKT following treatment and to describe preliminary efficacy of CC‐223.
PATIENTS AND METHODS
Patients
Patients ≥18 years of age with histologically or cytologically confirmed MM or AST who had progressed on standard therapy or were unable to tolerate standard anticancer therapy were eligible. An Eastern Cooperative Oncology Group performance status ≤1 was required for patients with solid tumors or ≤2 for patients with hematologic malignancies. Eligible patients had adequate bone marrow, hepatic, and renal function. Patients with symptomatic central nervous system metastases, acute or chronic pancreatitis, impaired cardiac function, diabetes requiring treatment, grade ≥2 peripheral neuropathy, or grade ≥2 diarrhea were excluded.
Study Design
This phase 1/2 study was divided into 2 parts: dose escalation to MTD (Part A) and dose expansion into parallel cohorts of selected tumor types (Part B). We herein describe the results of Part A (Part B is ongoing). In Part A, patients received escalating doses of CC‐223 in a modified accelerated titration design.14
This study was conducted in compliance with the Declaration of Helsinki and its amendments, the relevant International Conference on Harmonisation Good Clinical Practice guidelines, and local Institutional Review Boards, Independent Ethics Committees, or Research Ethics Boards. All study participants provided written informed consent before enrolling.
Treatment
On day −1, patients received an initial dose of CC‐223, starting at 7.5 mg, followed by 48‐hour observation and PK sample collection. Oral daily dosing began on day 1 and was maintained in 28‐day cycles until clinically significant disease progression, intolerable toxicities, or consent withdrawal. Patients fasted ≥6 hours before each CC‐223 dose. Initial cohorts of 1 patient each received CC‐223 at dose increments of 100% until the first instance of CC‐223‐related, grade ≥2 toxicity, at which point the accelerated dose escalation phase was terminated and the cohort expanded to 6 patients. Thereafter, CC–223 was increased in ∼50% increments in cohorts of 6 patients. If ≥2 patients experienced dose–limiting toxicity (DLT), the dose was considered nontolerated and dose escalation was stopped. The MTD was defined as the last dose tested below the NTD with 0 or 1 of 6 evaluable patients experiencing DLT during cycle 1. Adverse events (AEs) and DLTs were assessed using the National Cancer Institute Common Terminology Criteria for Adverse Events (version 4).15
The Safety Review Committee allowed additional patients to be enrolled in selected dosing cohorts to gather further PK, pharmacodynamic (PD), and safety data. Patients in lower‐dose cohorts were allowed to receive higher doses once tolerability of that dose was established. A protocol amendment revised the criteria for DLTs to allow management of selected, expected AEs (eg, hyperglycemia, rash) with optimal supportive care. Patients requiring dose reductions because of DLTs or dose delays because of AEs were permitted to continue treatment as tolerated.
Assessments
Tumor assessments were based on computed tomography or magnetic resonance imaging. Tumor responses were based on response evaluation criteria in solid tumors (RECIST) version 1.1,16 international uniform response criteria for MM,17 and revised response assessment criteria for high‐grade gliomas.18 All patients who met eligibility criteria, completed ≥1 cycle of CC‐223, and had baseline and ≥1 postbaseline efficacy assessment were considered evaluable for efficacy.
Pharmacokinetic Evaluation
Blood samples for PK were collected predose on day −1 and at 0.5, 1, 1.5, 3, 5, 8, 24, and 48 hours postdose, as well as predose on day 15 and at 0.5, 1, 1.5, 3, 5, and 8 hours postdose. Urine for PK analyses on day −1 through day 0 was taken <30 minutes before dosing and 0‐4, 4‐8, and 8‐24 hours postdose. Plasma and urine CC‐223 were measured using validated chiral liquid chromatography mass spectrometry methods. Blood samples for biomarker analyses were collected at screening within 24 hours of day −1; within 15 minutes predose on days −1, 1, 8, 15, and 22 of cycle 1; and predose on day 1 in cycle 2. Blood samples were drawn on day −1 at 1.5, 3, and 5 hours postdose; on days 1, 8, 15, and 22 at 1.5 hours postdose in cycle 1; and on day 1 at 1.5 hours postdose in cycle 2. Pharmacokinetic parameters were calculated using nonlinear mixed effects modeling (NONMEM, version 7.2; ICON, Dublin, Ireland).
Blood Biomarker Analysis
Blood samples (2 mL) were collected in sodium‐heparin tubes from patients in all cohorts. The blood was loaded into a 96 deep‐well plate, incubated for 1 hour at 37°C, then stimulated with anti–immunoglobulin D and lipopolysaccharide for 15 minutes. The samples were treated with Lyse/Fix Buffer (Becton‐Dickinson; Franklin Lakes, NJ) for 10 minutes at 37°C. The plates were centrifuged and aspirated, and 1 mL of ice‐cold 100% methanol was added to the wells. Following overnight incubation at −80°C, plates were centrifuged, aspirated, and washed twice with phosphate‐buffered saline containing 0.5% bovine serum albumin. Samples were stained with cell surface markers (CD3, CD14, and CD20) and intracellular markers (pAKT, pS6RP, and p4EBP1), then washed twice and fixed with 1.6% paraformaldehyde; data were acquired on a flow cytometer. The raw measurements were expressed as median fluorescence intensity values, which were normalized against calibration beads using a linear regression transformation performed on a log‐log scale, and then reported as equivalent reference fluorophores.
Immuno‐histochemical Staining
Optional pretreatment and on‐treatment tumor biopsies were collected from 2 patients (30‐mg/d cohort) for immune‐histochemical analyses of pS6RP, p4EBP1, pPRAS40, pAKT, Ki‐67, and terminal deoxynucleotidyl transferase dUTP nick end labeling (TUNEL), as described previously.19 Paraffin‐embedded tissue blocks were sectioned, and immunohistochemistry was performed for each antibody.
Sequence Analysis
Pretreatment tumor samples for DNA extraction were obtained from 4 patients and analyzed using next‐generation sequencing (Foundation Medicine, Cambridge, MA). DNA was extracted from 40 μg of formalin‐fixed paraffin embedded pre‐treatment tumor samples. DNA sequencing was performed for 3230 exons from 182 cancer‐related genes plus 37 introns from 14 genes often rearranged in cancer on indexed, adaptor‐ligated, hybridization‐captured libraries (Agilent SureSelect custom kit). For all specimens, ≥25% of the nuclear area was malignant tumor cells; therefore, no micro/macro‐dissection tissue enrichment was performed. Sequencing on the HiSeq2000 instrument (Illumina, San Diego, CA) was to an average median depth of >500×, with >99% of bases covering >100×. Sequence data from genomic DNA and complementary DNA were mapped to the reference human genome (hg19) using the Burrows‐Wheeler Aligner1 program and processed using publicly available SAMtools2, Picard (http://picard.sourceforge.net), and GATK3 (Broad Institute, Cambridge, MA). Genomic base substitutions and indels were detected using custom tools optimized for mutation calling in heterogeneous tumor samples, based on statistical modeling of sequence quality scores and local sequence assembly. Variations were filtered using dbSNP and custom artifact database, then annotated for known and likely somatic mutations using Catalogue of Somatic Mutations in Cancer (Wellcome Trust Sanger Institute, Genome Research, London, UK). Copy number alterations were detected by comparing targeted genomic DNA sequence coverage with a process‐matched normal control sample. Genomic rearrangements were detected by clustering chimeric reads mapping to targeted introns.
Statistical Analysis
Summary/descriptive statistics (eg, means, medians) were used to describe continuous variables; frequency and percentages were used to describe discrete variables. Population PK/PD modeling was performed using NONMEM version 7.2 (ICON).
RESULTS
Study Population
Twenty‐eight patients were enrolled and received ≥1 CC‐223 dose (Table 1) in five escalating dose cohorts. All enrolled patients had AST or MM, and 14 patients (50%) had received >3 prior treatment regimens. Patients received CC‐223 for a median of 54 days, which was longest in the 60‐mg/d cohort (58 days). Six and 22 patients required dose reductions and interruptions, respectively (Table 2). Overall, the median time to dose reduction was 25 days. Four patients were removed from the study during cycle 1 and replaced because they had disease progression, withdrew consent, or did not meet inclusion/exclusion criteria. Intracohort dose escalation occurred in 2 patients who started dosing at 30 mg/d and increased to 45 mg/d.
Table 1.
Patient Characteristics (N = 28)
| Characteristic | Value |
|---|---|
| Age, mean (range), y | 50 (25‐80) |
| Sex, n (%) | |
| Men | 9 (32) |
| Women | 19 (68) |
| ECOG performance status, n (%) | |
| 0 | 16 (57) |
| 1 | 11 (39) |
| 2 | 1 (4) |
| Tumor type, n (%) | |
| Colorectal cancer | 6 (21) |
| Breast cancer | 3 (11) |
| Pancreatic cancer | 3 (11) |
| Non–small cell lung cancer | 2 (7) |
| Glioblastoma multiforme | 2 (7) |
| HCC | 2 (7) |
| Salivary gland cancer | 2 (7) |
| Othera | 8 (29) |
| Prior systemic anticancer therapies, n (%) | |
| 1‐3 | 14 (50) |
| >3 | 14 (50) |
Abbreviation: ECOG, Eastern Cooperative Oncology Group; HCC, hepatocellular carcinoma.
Other tumors (n=1 each): adenocystic, adrenal, esophageal, multiple myeloma, neuroendocrine, paraganglioma, renal, and sarcoma.
Table 2.
Study Population
| 15 mg | 30 mg | 45 mg | 60 mg | Total | |
|---|---|---|---|---|---|
| Dose reductions | 0 | 0 | 1 | 5 | 6 |
| Dose interruptions | 2 | 8 | 5 | 7 | 22 |
| Removed from study | 0 | 2 | 1 | 1 | 4 |
| Discontinued due to AE | 0 | 1 | 2 | 0 | 3 |
| Died | 0 | 2 | 2 | 1 | 5 |
Abbreviation: AE, adverse event.
Safety
Four patients experienced DLTs during treatment cycle 1, including grade 3 hyperglycemia (30 mg/d), grade 3 rash lasting 5 days (45 mg/d), grade 3 fatigue lasting 10 days (60 mg/d), and grade 3 mucositis lasting 6 days (60 mg/d). Thus, 45 mg/d was determined to be the MTD; 60 mg/d was the NTD.
The most common treatment‐related AEs were fatigue (64%), nausea (50%), diarrhea (46%), hyperglycemia (43%), mucositis (39%), vomiting (32%), decreased appetite (32%), asthenia (25%), and rash (25%) (Table 3). The most common treatment‐related AE of grade ≥3 was hyperglycemia (18%), which was reported in the 30‐mg/d (n = 2), 45‐mg/d (n = 1), and 60‐mg/d cohorts (n = 2). Hyperglycemia was monitored by daily fingerstick glucose testing and managed effectively with metformin and/or insulin. One case of treatment‐related grade 3 pneumonitis was reported. Most enrolled patients (n = 17; 61%) discontinued treatment because of disease progression, with similar percentages in the 30‐mg/d (56%), 45–mg/d (56%), and 60‐mg/d (57%) cohorts.
Table 3.
Most Common Treatment‐Related Adverse Events Reported in ≥10% of Patients
| Adverse Event | Dose | Overall (N = 28) | ||||||||||
|---|---|---|---|---|---|---|---|---|---|---|---|---|
| 7.5 mg (n = 1) | 15 mg (n = 2) | 30 mg (n = 9) | 45 mg (n = 9) | 60 mg (n = 7) | ||||||||
| Any Grade | Grade ≥3 | Any Grade | Grade ≥3 | Any Grade | Grade ≥3 | Any Grade | Grade ≥3 | Any Grade | Grade ≥3 | Any Grade | Grade ≥3 | |
| Fatigue | 1 (100) | 0 | 1 (50) | 0 | 4 (44) | 0 | 5 (56) | 1 (11) | 7 (100) | 1 (14) | 18 (64) | 2 (7) |
| Nausea | 1 (100) | 0 | 0 | 0 | 4 (44) | 0 | 6 (67) | 0 | 3 (43) | 0 | 14 (50) | 0 |
| Diarrhea | 0 | 0 | 1 (50) | 0 | 3 (33) | 0 | 4 (44) | 0 | 5 (71) | 1 (14) | 13 (46) | 1 (4) |
| Hyperglycemia | 0 | 0 | 0 | 0 | 4 (44) | 2 (22) | 4 (44) | 1 (11) | 4 (57) | 2 (29) | 12 (43) | 5 (18) |
| Mucositis | 0 | 0 | 1 (50) | 0 | 2 (22) | 0 | 3 (33) | 0 | 5 (71) | 2 (29) | 11 (39) | 2 (7) |
| Decreased appetite | 0 | 0 | 0 | 0 | 4 (44) | 0 | 3 (33) | 0 | 2 (29) | 0 | 9 (32) | 0 |
| Vomiting | 0 | 0 | 0 | 0 | 2 (22) | 0 | 2 (22) | 0 | 5 (71) | 0 | 9 (32) | 0 |
| Asthenia | 0 | 0 | 1 (50) | 0 | 2 (22) | 0 | 1 (11) | 0 | 3 (43) | 0 | 7 (25) | 0 |
| Rash | 0 | 0 | 1 (50) | 0 | 1 (11) | 0 | 2 (22) | 1 (11) | 3 (43) | 1 (14) | 7 (25) | 2 (7) |
| Dysgeusia | 1 (100) | 0 | 1 (50) | 0 | 0 | 0 | 2 (22) | 0 | 1 (14) | 0 | 5 (18) | 0 |
| Arthralgia | 0 | 0 | 0 | 0 | 0 | 0 | 2 (22) | 0 | 2 (29) | 1 (14) | 4 (14) | 1 (4) |
| Increased glycosylated hemoglobin | 0 | 0 | 0 | 0 | 0 | 0 | 2 (22) | 0 | 2 (29) | 0 | 4 (14) | 0 |
| Pruritus | 0 | 0 | 1 (50) | 0 | 1 (11) | 0 | 2 (22) | 0 | 0 | 0 | 4 (14) | 0 |
| Dry mouth | 0 | 0 | 0 | 0 | 1 (11) | 0 | 2 (22) | 0 | 0 | 0 | 3 (11) | 0 |
| Dyspnea | 0 | 0 | 0 | 0 | 1 (11) | 0 | 1 (11) | 0 | 1 (14) | 0 | 3 (11) | 0 |
| Rash pruritic | 0 | 0 | 0 | 0 | 1 (11) | 0 | 0 | 0 | 2 (29) | 2 (29) | 3 (11) | 2 (7) |
| Thrombocytopenia | 0 | 0 | 0 | 0 | 1 (11) | 0 | 2 (22) | 0 | 0 | 0 | 3 (11) | 0 |
Data are presented as n (%).
Five patients died within 28 days of last treatment. Each death was attributed to disease progression unrelated to treatment.
Efficacy
Twenty patients were evaluable for efficacy. No patient had a complete response. One breast cancer patient (3.6%) in the 30‐mg/d cohort had a partial response (PR) (Fig. 1A). In addition, 5 patients had reduction in target lesions (Fig. 1B). The best overall response rate per investigator (safety population) was 3.6% (90% confidence interval, 0.2%‐15.9%), and 8 patients (29%) had stable disease (SD); therefore, the disease control rate was 32.1% (90% confidence interval, 17.9%‐49.4%), and there was no clear dose dependence. Six patients had disease control durations of >100 days (range, 110‐220 days), including 2 of 3e patients with breast cancer (1 PR and 1 SD) with disease control durations of 220 and 168 days, respectively.
Figure 1.
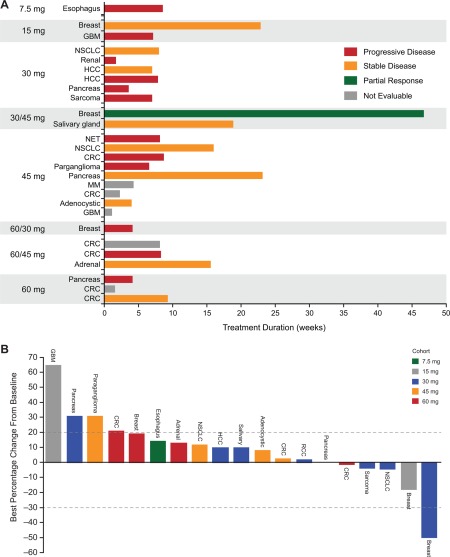
(A) Response relative to time on CC‐223 treatment and (B) best percentage change from baseline in total length of target lesions were evaluated in 28 and 19 patients, respectively. Abbreviations: CRC, colorectal carcinoma; GBC, glioblastoma multiforme; HCC, hepatocellular carcinoma; MM, multiple myeloma; NET, (gastrointestinal) neuroendocrine tumor (of nonpancreatic origin); NSCLC, non–small cell lung cancer; RCC, renal cell carcinoma.
The patient with PR had estrogen receptor–positive/human epidermal growth factor receptor 2–negative breast cancer with >50% regression in target lesions; her response lasted 220 days (Supporting Fig. 1). She had received 7 prior anticancer regimens, including chemotherapy, antibody therapy, protein kinase inhibitors, and hormonal therapy, but no prior everolimus. Her best prior response was SD lasting 8 months following PI3K inhibitor therapy. She was treated with CC‐223 for 11 cycles (30 mg/d for 5 cycles followed by 45 mg/d for 6 cycles without dose interruptions or reductions) until progression.
Pharmacokinetics
Of 28 enrolled patients, 27 were evaluable for PK. CC‐223 was absorbed rapidly, with peak plasma concentration (Cmax) levels achieved 1‐3 hours after single and multiple daily doses (Fig. 2). The mean terminal half‐life of CC‐223 was 4.86‐5.64 hours over the 30‐ to 60‐mg CC‐223 daily dose range. The mean exposure to CC–223 Cmax and area under the concentration time curve (AUC) from time 0 to infinity increased in a dose‐proportional manner over the 30‐ to 60‐mg dose range following single or multiple doses. The ratio of AUC from 0‐24 hours postdose (AUC0‐24) between day 15 and day 1 was ≤22% (Supporting Table 1), suggesting a small amount of accumulation after multiple dosing. A small fraction of CC‐223 (<0.2%) was excreted unchanged in urine, and renal clearance was negligible, suggesting that metabolism may be the primary clearance route.
Figure 2.
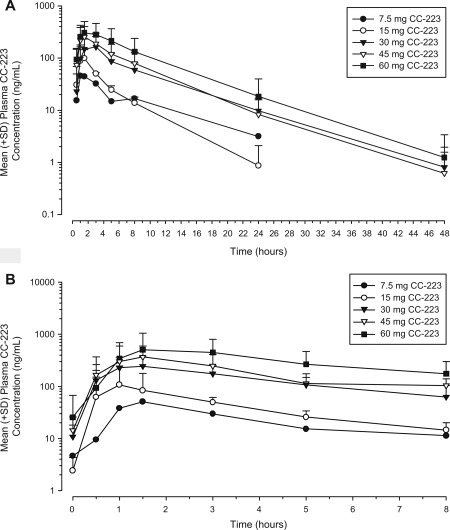
Mean (+standard deviation [SD]) plasma concentration‐time profiles of CC‐223 are presented on semi‐log scale on (A) day −1 after single dose and (B) day 15 after multiple doses.
Pharmacodynamics/Biomarker Analyses
Pharmacodynamic effects were assessed through measuring biomarker phosphorylation for mTORC1 (S6RP and 4EBP1) and mTORC2 (AKT) in peripheral blood samples after single and multiple doses of CC‐223. Inhibition of pS6RP, p4EBP1, and pAKT was observed in B cells, T cells, and monocytes under both stimulated and nonstimulated conditions (Supporting Table 2). Biomarker inhibition varied among blood cell types and was achieved for pS6RP (>70%), p4EBP1 (>40%), and pAKT (>48%) at the 30‐, 45‐, and 60‐mg dose levels at 3 hours on treatment (Fig. 3). The highest inhibition occurred in stimulated B cells and nonstimulated monocytes for pS6RP, T cells for p4EBP1, and stimulated B cells and monocytes for pAKT. Inhibition kinetics were similar for the 3 biomarkers. The highest levels of inhibition were found 1.5‐3 hours postdose and were sustained for ≥5 hours. At 24 hours, following first‐dose administration, inhibition returned to near‐baseline levels in most patients, whereas inhibition persisted at 24 hours following multiple‐dose administration in some patients. Robust comparative analyses were limited by small cohort size and interpatient variability.
Figure 3.
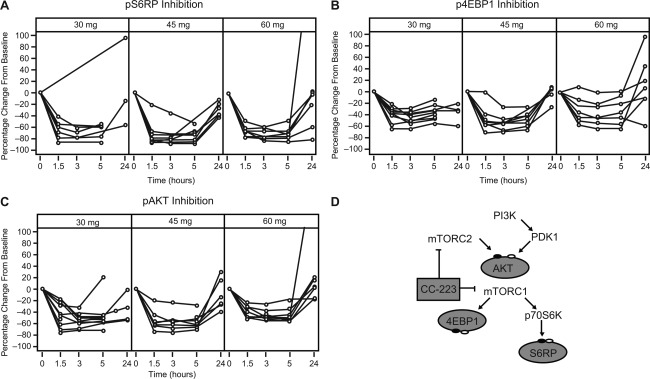
Dose‐related plasma biomarker inhibition. Following a single dose of CC‐223 on day −1, cycle 1, inhibition (post‐dose assessments relative to the baseline value) of (A) pS6RP, (B) p4EBP1, and (C) pAKT in stimulated peripheral blood B cells, T cells, and monocytes, respectively, was observed in all patients following doses ranging from 30 to 60 mg. The phosphorylation of AKT (for mTORC2 activity) and p4EBP1 and pS6RP (mTORC1 activity) in relevant cell types were evaluated using flow cytometry with specific antibodies and expressed as equivalent reference fluorophore, ERF. (D) Model of CC‐223 mechanism of action. CC‐223 inhibits phosphorylation of 4EBP1, S6RP, and AKT through suppression of both mTORC1 and mTORC2. Abbreviations: 4EBP1, 4E–binding protein 1; AKT, protein kinase B; mTORC1, mammalian target of rapamycin complex 1; mTORC2, mammalian target of rapamycin complex 2; p4EBP1, phosphorylated 4E‐binding protein 1; p70S6K, p70 S6 kinase 1; pAKT, phosphorylated protein kinase B; PDK1, 3‐phosphoinositide‐dependent protein kinase 1; PI3K, phosphoinositide 3‐kinase; pS6RP, phosphorylated S6 ribosomal protein; S6RP, S6 ribosomal protein.
Pretreatment tumor tissue for gene sequencing was obtained from 4 patients, including 2 with SD ≥110 days who had genetic abnormalities associated with mTORC1/mTORC2 pathway activation (Phosphatase and tensin homolog (PTEN) deletion and PIK3CA mutation). Quantitative image analysis of immuno‐histochemically stained pre‐ and on‐treatment (days 15‐22) biopsies from 2 patients (HCC and salivary gland tumor) were evaluated. Significant inhibition of pS6RP, pAKT, and Ki67 staining was detected (Supporting Fig. 2), and an increase in TUNEL‐positive cells (data not shown) was seen in both the HCC and salivary gland tumor samples after treatment with CC‐223. Additionally, the HCC sample showed inhibition of p4EBP1 after treatment initiation (data not shown). These preliminary PD data are consistent with suppression of both mTORC1 and mTORC2 activity in blood and tumor tissue.
Increases in glucose, insulin, and C‐peptide levels were CC‐223 dose‐dependent in patients receiving doses ≥30 mg/d (Table 3; Supporting Fig. 3).
Exposure‐Response Analysis and PK/PD Correlation
A direct inhibitory model (maximum observed PK effect) was used to describe the concentration–effect relationship between CC‐223 concentrations and changes in PD endpoints (pAKT, p4EBP1, and pS6RP in stimulated B cells, T cells, and monocytes, respectively) relative to baseline. Under stimulated conditions, the concentration‐effect relationships were best characterized for p4EBP1 measured in stimulated T cells, and for pAKT and pS6RP measured in stimulated B cells and monocytes (Fig. 4) because PK/PD modeling resulted in successful minimization of covariance in nonlinear mixed effects modeling.
Figure 4.
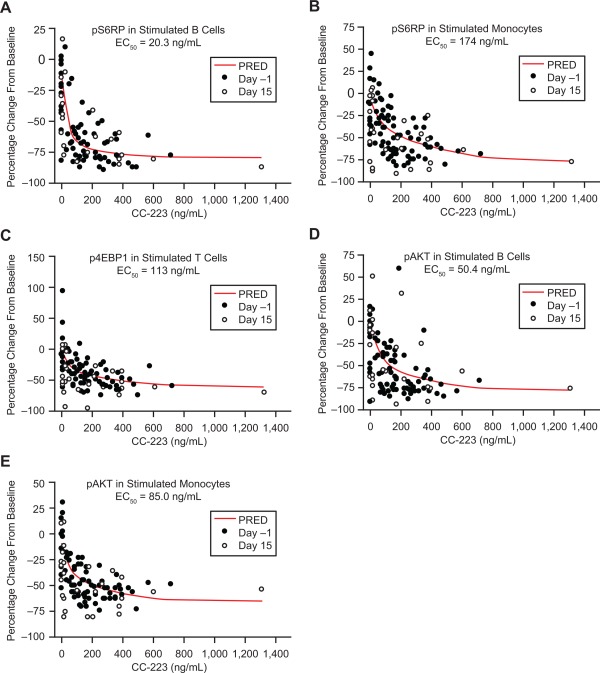
Pharmacokinetics/pharmacodynamics correlations: (A) pS6RP in stimulated B cells. (B) pS6RP in stimulated monocytes. (C) p4EBP1 in stimulated T cells. (D) pAKT in stimulated B cells. (E) pAKT in stimulated monocytes. Abbreviations: EC50, half maximal effective concentration; p4EBP1, phosphorylated 4E‐binding protein 1; pAKT, phosphorylated protein kinase B; PRED, predicted; pS6RP, phosphorylated S6 ribosomal protein.
Half‐maximal effective concentration (EC50) values for pAKT inhibition in stimulated B cells and monocytes were 50.4 and 85.0 ng/mL, respectively; EC50 values for pS6RP inhibition in stimulated B cells and monocytes were 20.3 and 174 ng/mL, respectively. The EC50 value for p4EBP1 inhibition in stimulated T cells was 113 ng/mL (Fig. 4). The mean steady‐state plasma CC‐223 at 30 and 45 mg/d was ∼60 and ∼87 ng/mL (AUC0‐24 divided by 24 hours), respectively, which was greater than or close to the EC50 for pAKT, pS6RP, and p4EBP1 inhibition in stimulated B cells. These results suggest that a single dose of ≥30 mg CC‐223 may provide overall inhibition of these biomarkers during a 24‐hour dosing interval.
DISCUSSION
The PI3K/AKT/mTOR pathway is frequently activated in human cancers, leading to aberrant metabolism, increased proliferation, and resistance to apoptosis in cancer cells.1 Although considerable evidence confirms the importance of this pathway in human cancers, the clinical activity of rapalog monotherapy is modest, potentially due to insufficient inhibition of AKT and 4EBP1 phosphorylation.7, 8, 20, 21 In preclinical studies, dual suppression of mTORC1 and mTORC2 can increase antitumor activity versus agents exclusively targeting mTORC1.13, 22 Active‐site inhibitors such as CC‐223 that target both mTORC1 and mTORC2 through mTOR kinase activity inhibit activation of AKT and 4EBP1 and are promising therapeutic agents.12, 13
In this phase 1 study, single‐agent CC‐223 was administered to 28 pretreated patients with AST or MM. The MTD was 45 mg/d, although 11.1% of patients at the MTD required dose reductions and 55.6% required interruptions. CC‐223 was associated with a safety profile similar to that of other mTORC1/mTORC2 inhibitors, such as MLN0128/INK128 and AZD8055.9, 23 Common CC‐223–related AEs were fatigue, nausea, diarrhea, and hyperglycemia; the most common grade 3 AE was hyperglycemia (18%). Hyperglycemia, hypercholesterolemia, and other metabolic abnormalities are common in patients treated with other mTOR inhibitors, including the rapalogs everolimus and temsirolimus.24, 25, 26, 27 In the present study, dose‐dependent glucose and C‐peptide level elevations occurred in patients receiving CC‐223 ≥30 mg/d. Interestingly, neither hypercholesterolemia nor hypertriglyceridemia was a frequent event in patients treated with CC‐223, a finding similar to that observed with other mTORC1/mTORC2 inhibitors.9, 23
The pharmacokinetics of CC‐223 were dose‐proportional. Pharmacodynamic analyses showed a relationship between CC‐223 exposure and pAKT, p4EBP1, and pS6RP reduction in stimulated B cells, T cells, and monocytes, respectively, thus differentiating CC–223 from rapalogs that typically cause pAKT activation and minimal p4EBP1 inhibition.22, 28 Substantial pS6RP (>70%), p4EBP1 (>40%), and pAKT (>50%) inhibition was observed at ≥30 mg CC‐223, although pS6RP and pAKT inhibition was more complete than p4EBP1 inhibition. Additionally, preliminary evidence of inhibition of pS6RP, p4EBP1, pAKT, and proliferation marker Ki‐67 was observed in paired tumor biopsies in 2 patients.
Our dose‐escalation study demonstrated early evidence of clinical activity through durable tumor control with one PR (3.6%) lasting 220 days in 1 patient with breast cancer and 8 patients (29%) with SD (>100 days in 5 patients), including 2 patients with tumors exhibiting molecular abnormalities associated with mTORC1/mTORC2 pathway activation. In a phase 1 study of AZD8055 (mTORC1/mTORC2 inhibitor), the best response was SD in 7 patients (14.3%).9 In a phase 1 study of MLN0128, 1 patient (4%) with MM had a response lasting ∼2 months and 15 patients (56%) had SD.10
Given the evidence of mTORC1/mTORC2 pathway inhibition, acceptable safety profile, dose–proportional PK, exposure‐related PD effects, and encouraging antitumor activity, cohorts of patients with MM, diffuse large B‐cell lymphoma, and selected solid tumors are currently being evaluated in the expansion phase of this study. During this expansion phase, flurodeoxyglucose‐positron emission tomography imaging will be explored as a potential visual biomarker of PD activity, and tumor biopsies will be obtained to evaluate molecular parameters associated with CC‐223 treatment.
FUNDING SUPPORT
Funding for this clinical trial was provided by Celgene. The authors received medical writing assistance from Stephanie K. Doerner, PhD, of ProEd Communications, Inc., funded by Celgene Corporation.
CONFLICT OF INTEREST DISCLOSURES
Dr. Kelly received research funding for conducting (as Principal Investigator) a Celgene‐sponsored clinical trial of a different agent, CC‐122. Sarah Cannon Research Institute has received expenses from Celgene on behalf of Dr. Infante. Drs. Xu, Wong, Liu, Wu, Mortensen, Chopra, and Hege are employees of Celgene. Dr. Liu is a regular employee of Celgene Corporation and receives payment from the company for characterizing the pharmacokinetics of an investigated drug including CC‐223 in the current study. Drs. Wu, Chopra, and Hege are employed by and own stock in Celgene.
Supporting information
Supplementary Information
ClinicalTrials.gov Identifier: NCT01177397.
See editorial on pages 3390–2, this issue.
REFERENCES
- 1. Massacesi C, di Tomaso E, Fretault N, Hirawat S. Challenges in the clinical development of PI3K inhibitors. Ann N Y Acad Sci. 2013;1280:19‐23. [DOI] [PMC free article] [PubMed] [Google Scholar]
- 2. Vander Heiden MG, Cantley LC, Thompson CB. Understanding the Warburg effect: the metabolic requirements of cell proliferation. Science. 2009;324:1029‐1033. [DOI] [PMC free article] [PubMed] [Google Scholar]
- 3. Demetri GD, Chawla SP, Ray‐Coquard I, et al. Results of an international randomized phase III trial of the mammalian target of rapamycin inhibitor ridaforolimus versus placebo to control metastatic sarcomas in patients after benefit from prior chemotherapy. J Clin Oncol. 2013;31:2485‐2492. [DOI] [PubMed] [Google Scholar]
- 4. Hudes G, Carducci M, Tomczak P, et al. Temsirolimus, interferon alfa, or both for advanced renal‐cell carcinoma. N Engl J Med. 2007;356:2271‐2281. [DOI] [PubMed] [Google Scholar]
- 5. Motzer RJ, Escudier B, Oudard S, et al. Efficacy of everolimus in advanced renal cell carcinoma: a double‐blind, randomised, placebo‐controlled phase III trial. Lancet. 2008;372:449‐456. [DOI] [PubMed] [Google Scholar]
- 6. Markman B, Dienstmann R, Tabernero J. Targeting the PI3K/Akt/mTOR pathway—beyond rapalogs. Oncotarget. 2010;1:530‐543. [DOI] [PMC free article] [PubMed] [Google Scholar]
- 7. Ducker GS, Atreya CE, Simko JP, et al. Incomplete inhibition of phosphorylation of 4E‐BP1 as a mechanism of primary resistance to ATP‐competitive mTOR inhibitors. Oncogene. 2014;33:1590‐1600. [DOI] [PMC free article] [PubMed] [Google Scholar]
- 8. Dowling RJ, Topisirovic I, Alain T, et al. mTORC1‐mediated cell proliferation, but not cell growth, controlled by the 4E‐BPs. Science. 2010;328:1172‐1176. [DOI] [PMC free article] [PubMed] [Google Scholar]
- 9. Naing A, Aghajanian C, Raymond E, et al. Safety, tolerability, pharmacokinetics and pharmacodynamics of AZD8055 in advanced solid tumours and lymphoma. Br J Cancer. 2012;107:1093‐1099. [DOI] [PMC free article] [PubMed] [Google Scholar]
- 10. Ghobrial IM, Siegel D, Vij R, et al. MLN0128 (INK128), an investigational oral dual TORC1/2 inhibitor, in patients (pts) with relapsed or refractory multiple myeloma (MM), non‐Hodgkin's lymphoma (NHL), or Waldenstrom macroglobulinemia (WM): preliminary results from a phase 1 dose escalation study. Blood. 2012;120(suppl). Abstract 4038. [Google Scholar]
- 11. Goy A, Ribrag V, Varga A, et al. Phase I expansion trial of an oral TORC1/TORC2 inhibitor (CC‐223) in diffuse large B‐cell lymphoma (DLBCL) and multiple myeloma (MM). Presented at: 49th Annual Meeting of the American Society of Clinical Oncology (ASCO); May 31‐June 4, 2013; Chicago, IL. Abstract 8522.
- 12. Mortensen DS, Fultz KE, Hickman M, et al. The discovery and preclinical characterization of CC‐223, a novel mTOR kinase inhibitor under clinical investigation. Eur J Cancer. 2012;48(suppl 6):103. Abstract 337. [Google Scholar]
- 13. Xu S, Tran T, Tsuji T, et al. CC‐223, a selective mTOR kinase inhibitor, potently inhibits proliferation of a large panel of cancer cell lines in vitro. Eur J Cancer. 2012;48(suppl 6):103. Abstract 338. [Google Scholar]
- 14. Simon R, Freidlin B, Rubinstein L, Arbuck SG, Collins J, Christian MC. Accelerated titration designs for phase I clinical trials in oncology. J Natl Cancer Inst. 1997;89:1138‐1147. [DOI] [PubMed] [Google Scholar]
- 15.US Department of Health and Human Services, National Institutes of Health, National Cancer Institute. Common Terminology Criteria for Adverse Events, version 4.0. 2009. http://evs.nci.nih.gov/ftp1/CTCAE/About.html. Accessed September 4, 2014.
- 16. Eisenhauer EA, Therasse P, Bogaerts J, et al. New response evaluation criteria in solid tumours: revised RECIST guideline (version 1.1). Eur J Cancer. 2009;45:228‐247. [DOI] [PubMed] [Google Scholar]
- 17. Durie BG, Harousseau JL, Miguel JS, et al. International uniform response criteria for multiple myeloma. Leukemia. 2006;20:1467‐1473. [DOI] [PubMed] [Google Scholar]
- 18. Wen PY, Macdonald DR, Reardon DA, et al. Updated response assessment criteria for high‐grade gliomas: response assessment in neuro‐oncology working group. J Clin Oncol. 2010;28:1963‐1972. [DOI] [PubMed] [Google Scholar]
- 19. Cloughesy TF, Yoshimoto K, Nghiemphu P, et al. Antitumor activity of rapamycin in a phase I trial for patients with recurrent PTEN‐deficient glioblastoma. PLoS Med. 2008;5:e8. [DOI] [PMC free article] [PubMed] [Google Scholar]
- 20. O'Reilly KE, Rojo F, She Q‐B, et al. mTOR inhibition induces upstream receptor tyrosine kinase signaling and activates Akt. Cancer Res. 2006;66:1500‐1508. [DOI] [PMC free article] [PubMed] [Google Scholar]
- 21. Sun S‐Y, Rosenberg LM, Wang X, et al. Activation of Akt and eIF4E survival pathways by rapamycin‐mediated mammalian target of rapamycin inhibition. Cancer Res. 2005;65:7052‐7058. [DOI] [PubMed] [Google Scholar]
- 22. Thoreen CC, Kang SA, Chang JW, et al. An ATP‐competitive mammalian target of rapamycin inhibitor reveals rapamycin‐resistant functions of mTORC1. J Biol Chem. 2009;284:8023‐8032. [DOI] [PMC free article] [PubMed] [Google Scholar]
- 23. Infante JR, Tabernero J, Cervantes A, et al. A phase 1, dose‐escalation study of MLN0128, an investigational oral mammalian target of rapamycin complex 1/2 (mTORC1/2) catalytic inhibitor, in patients (pts) with advanced non‐hematologic malignancies. Mol Cancer Ther. 2013;12(11 suppl). Abstract C252. [Google Scholar]
- 24. Wolpin BM, Hezel AF, Abrams T, et al. Oral mTOR inhibitor everolimus in patients with gemcitabine‐refractory metastatic pancreatic cancer. J Clin Oncol. 2009;27:193‐198. [DOI] [PMC free article] [PubMed] [Google Scholar]
- 25. Bitting RL, Healy P, Creel PA, et al. A phase Ib study of combined VEGFR and mTOR inhibition with vatalanib and everolimus in patients with advanced renal cell carcinoma. Clin Genitourin Cancer. 2014;112:241‐250. [DOI] [PMC free article] [PubMed] [Google Scholar]
- 26. Rini BI, Bellmunt J, Clancy J, et al. Randomized phase III trial of temsirolimus and bevacizumab versus interferon alfa and bevacizumab in metastatic renal cell carcinoma: INTORACT Trial. J Clin Oncol. 2014;32:752‐759. [DOI] [PubMed] [Google Scholar]
- 27. Rugo HS, Pritchard KI, Gnant M, et al. Incidence and time course of everolimus‐related adverse events in postmenopausal women with hormone receptor‐positive advanced breast cancer: insights from BOLERO‐2. Ann Oncol. 2014;25:808‐815. [DOI] [PMC free article] [PubMed] [Google Scholar]
- 28. Gibbons JJ, Abraham RT, Yu K. Mammalian target of rapamycin: discovery of rapamycin reveals a signaling pathway important for normal and cancer cell growth. Semin Oncol. 2009;36:S3‐S17. [DOI] [PubMed] [Google Scholar]
Associated Data
This section collects any data citations, data availability statements, or supplementary materials included in this article.
Supplementary Materials
Supplementary Information