Abstract
Recently, acoustically oscillated sharp-edges have been utilized to achieve rapid and homogeneous mixing in microchannels. Here, we present a numerical model to investigate acoustic mixing inside a sharp-edge-based micromixer in the presence of a background flow. We extend our previously reported numerical model to include the mixing phenomena by using perturbation analysis and the Generalized Lagrangian Mean (GLM) theory in conjunction with the convection-diffusion equation. We divide the flow variables into zeroth-order, first-order, and second-order variables. This results in three sets of equations representing the background flow, acoustic response, and the time-averaged streaming flow, respectively. These equations are then solved successively to obtain the mean Lagrangian velocity which is combined with the convection-diffusion equation to predict the concentration profile. We validate our numerical model via a comparison of the numerical results with the experimentally obtained values of the mixing index for different flow rates. Further, we employ our model to study the effect of the applied input power and the background flow on the mixing performance of the sharp-edge-based micromixer. We also suggest potential design changes to the previously reported sharp-edge-based micromixer to improve its performance. Finally, we investigate the generation of a tunable concentration gradient by a linear arrangement of the sharp-edge structures inside the microchannel.
I. INTRODUCTION
The ability to achieve rapid and homogeneous mixing at microscales is essential for various lab-on-a-chip applications such as biomedical diagnostics, chemical kinetic studies, enzyme reactions, and drug delivery.1–3 Due to the inherent length scales, microfluidic flow is usually laminar such that the mixing phenomenon is governed by the slow diffusion process, making rapid and efficient mixing challenging.4–8 To overcome this limitation, a number of passive and active microfluidic mixers have been reported, as reviewed in Refs. 9 and 10.
Recently, acoustic-based micromixers have garnered significant interest owing to their non-invasive nature.11–16 The earlier acoustic-based mixers relied upon acoustic waves propagating in the fluid media to cause pressure fluctuations and perturb the laminar flow to achieve mixing.17–22 Later, to enhance the mixing performance of acoustic-based mixers, bubble-based mixers were reported which perturbed the laminar flow via the generation of acoustically induced microvortices.23–25 However, bubble-based micromixers suffer from a number of limitations concerning the bubble instability, heat generation, and difficult bubble trapping process.26 To overcome these limitations, we recently reported an oscillating sharp-edge-based micromixer26 using acoustically generated microvortices similar to the bubble-based micromixers, but with the added advantage of convenient and stable operation. We also reported a numerical study27 of the acoustic streaming patterns around the oscillating sharp-edges to gain insights into the flow patterns inside a sharp-edge-based micromixer. In the previous study,27 we considered a periodic cell of the sharp-edge-based micromixer and investigated the flow patterns to predict the effect of various geometrical and operational parameters on the performance of the sharp-edge-based micromixer. Another numerical study of the flow patterns around a single sharp-edge and their scaling has been reported recently by Ovchinnikov et al.28
More recently, the sharp-edge-based mixing platform has been utilized for other bio-medical applications such as a chemical gradient generator,29 and liquefaction of high viscosity samples such as human sputum.30 While promising applications of the sharp-edge platform have been demonstrated experimentally including particle trapping by acoustic radiation forces,31 the numerical studies reported so far have focused only on the investigation of the flow field around the sharp-edges in the absence of a background flow, without any modeling of the mixing phenomena. This is a major limitation since both a background flow as well as mixing phenomena are essential for most of the relevant practical applications of the sharp-edge-based devices. Therefore, an improved numerical model considering a background flow as well as the explicit modeling of the convection-diffusion process is required to provide a deeper understanding of the mixing phenomena inside a sharp-edge-based micromixer. Such a numerical model can be highly useful to realize the full potential of the sharp-edge-based mixing platform by serving as a design tool as well as helping to explore further potential applications.
In this work, we address three major limitations of the existing numerical models: (i) First, while the reported studies so far have aimed at understanding the flow field around sharp-edges, in the current model, we include the modeling of the convection-diffusion equation with the appropriate velocity field based on the Generalized Lagrangian Mean (GLM) theory.32 This allows us to investigate the mixing profiles inside a sharp-edge-based micromixer which, to the best of our knowledge, has never been explored previously. Specifically, we consider the perturbation approach for the flow variables including the zeroth-order terms to obtain the zeroth-, first-, and second-order equations, which are then successively solved. Using the solution from the zeroth-order and the second-order problem, we identify the appropriate flow velocity based on the GLM theory32 that governs the mixing phenomenon inside the sharp-edge-based micromixer, which is further utilized to obtain the concentration profile inside the micromixer. (ii) Second, we allow for a non-zero background laminar flow to consider a more realistic case of the interaction of acoustic waves with a moving laminar flow, rather than the stationary flow considered in the previously reported numerical studies.27,28 As mentioned previously, the appropriate modeling of the background flow is essential to study the aforementioned practical applications of a sharp-edge-based micromixer such as sputum liquefaction30 and chemical gradient generation.29 To the best of our knowledge, the interaction of a background flow with the acoustic streaming flow has never been investigated previously for a sharp-edge based device. The background flow contributes to the mixing phenomenon via the inclusion of the zeroth-order terms in the formulation, which have not been considered in the numerical studies reported so far.27,28 Thus, the governing equations solved in the current work differ significantly from the previously reported numerical studies on the sharp-edge based devices. (iii) Lastly, none of the previously reported work on sharp-edge based devices have considered the full fluidic domain. Specifically, the sharp-edge based devices have been either modeled as an infinite domain28 or as a periodic domain.27 In this work, we consider the full device as our computational domain, thereby precluding the need for periodic boundary conditions or perfectly matched layers. Thus, our model allows for the consideration of a finite number of sharp-edges in the micromixer, which is essential to investigate the mixing by successive pairs of sharp-edges.
In this work, we first establish the numerical convergence of our model followed by a comparison of our numerical results with the experimentally measured values of mixing index. Further, we employ our numerical model to study the effect of operational parameters such as the background flow velocity and the applied power. We also investigate other geometrical designs of the sharp-edge-based micromixer and compare their mixing performance with the typical design employed in experiments to suggest potential design improvements to the sharp-edge-based micromixer. Finally, we investigate the generation of a concentration gradient inside the microchannel by arranging the sharp-edge structures in a ladder-like fashion inside the microchannel. We believe that our current numerical model offers significant improvement over the existing numerical models and therefore can be highly useful as a design tool that can help in optimizing the performance of various acoustofluidic mixing devices as well as exploring further applications to realize the full potential of the sharp-edge-based mixing platform.
II. EXPERIMENTAL PROCEDURE
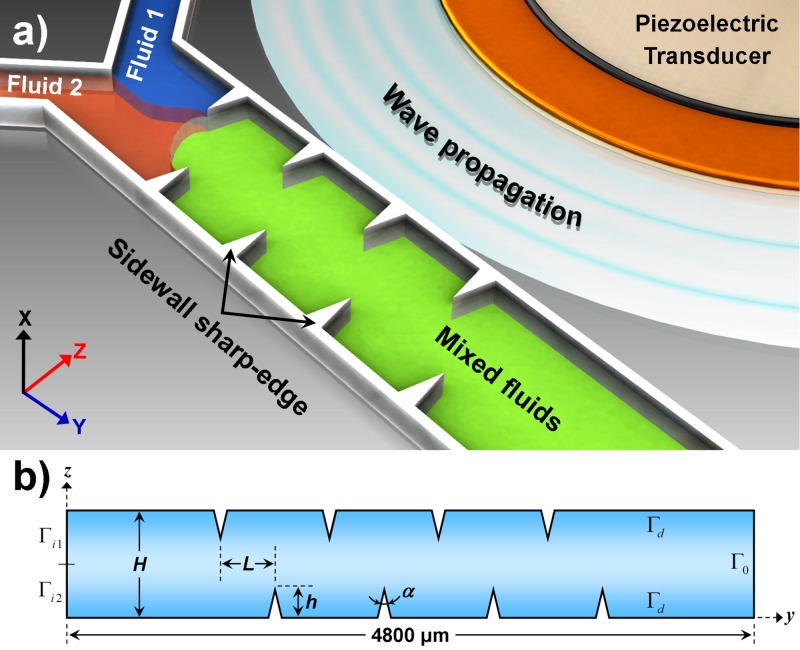
Figure 1(a) shows the schematic of a typical sharp-edge-based micromixer, as employed in our experimental studies.26 The micromixer consists of a single-layer PDMS (poly-dimethylsiloxane) channel with eight sharp-edges on its sidewalls, four on each side. The channel was fabricated using standard soft lithography and bonded onto a glass slide along with a piezoelectric transducer (model no. 273-073, RadioShack®). The actuation of the piezoelectric transducer causes the sharp-edges to oscillate, thereby generating a pair of counter-rotating vortices in the fluid around the tip of each sharp-edge. The length, the width, and the height of the microchannel were 1 cm, 600 μm, and 50 μm, respectively, while sharp-edges were designed to be 200 μm long with a tip angle of . As typically done in microfluidic studies to visualize and characterize the flow inside the channel, a solution containing 1.9 μm diameter dragon green fluorescent beads (Bangs Laboratories, Inc.™) was introduced into the channel. The mixing performance was characterized using DI water and fluorescent dye (fluorescein) which were injected into the channel through the two separate inlets. A full experimental characterization of the sharp-edge-based micromixer, including the effect of geometrical and operational parameters as well as the mixing performance (mixing time, mixing length, etc.) can be found in Refs. 26 and 30.
FIG. 1.
(a) Schematic of a typical sharp-edge-based micromixer showing a microfluidic channel with two inlets and sharp-edge structures on sidewalls. The sharp-edges are acoustically oscillated via a piezoelectric transducer. (b) The computational domain considered in the numerical model showing various boundary indicators.
III. THEORY
The balance laws governing the motion of a linear viscous compressible fluid are the balance of mass (or the continuity equation) and the balance of momentum (or the compressible Navier-Stokes equation)33,34
| (1) |
and
| (2) |
where ρ is the mass density, is the fluid velocity, p is the fluid pressure, and μ and are the dynamic shear viscosity and bulk viscosity, respectively. To describe the fluid motion, these equations need to be complemented by a constitutive relation linking the pressure and density. We assume a linear relation between p and ρ35–37
| (3) |
where c0 is the speed of sound in the fluid at rest. Eqs. (1)–(3), combined with the appropriate boundary conditions, fully determine the motion of the fluid inside the micromixer. The balance law governing the concentration profile, usually referred as convection-diffusion equation, is38
| (4) |
where c is the concentration and D is the diffusion coefficient. However, owing to the widely separated length scales (characteristic dimensions of the device vs. wavelength),39 a direct solution of these equations is both numerically challenging as well as expensive. For example, a typical dimension of a sharp-edge-based micromixer is in the range of , while the characteristic wavelength is of the order of . Due to the dissipative nature of the fluid, the response of a fluid to a harmonic forcing is not, in general, harmonic.27 In the study of acoustic streaming, it is customary to divide the response of fluid to a harmonic actuation into two components: (i) a harmonic component with period equal to the forcing period and (ii) a time-averaged second-order component, where the latter is generally referred to as the acoustic streaming.37 Following our recent model,27 we employ Nyborg's perturbation technique40 in which fluid velocity, density, and pressure are considered to have the following form:
where ε is a non-dimensional smallness parameter.41 Here, the smallness parameter, ε, can be chosen as the ratio of the amplitude of the first-order velocity to the speed of sound in the fluid at rest.42 Usually, the zeroth-order velocity field is assumed to be zero, thereby precluding the presence of a background flow.36 However, in case of the sharp-edge-based micromixer, there is an additional background flow imposed, which needs to be considered to study the response of a moving flow to acoustic actuation. Noting this, letting
| (6) |
followed by the substitution of Eq. (5) into Eqs. (1) and (2), and subsequent separation of terms of order zero in ε results in the following set of zeroth-order equations:
| (7) |
| (8) |
Repeating the same procedure for the terms of order one in ε results in the following first-order equations governing the first-order acoustic response of the fluid:
| (9) |
| (10) |
Again repeating the procedure for the terms of order two in ε followed by a time-averaging operation over a period of oscillation yields the following set of equations governing the time-averaged second-order response of the fluid:
| (11) |
| (12) |
where denotes the time average of the quantity A over a full oscillation time period. In a general case, as pointed out by Stuart,43 inertial terms in Eq. (12) can be significant and must be retained in the formulation. Similarly, to fully account for the effects of viscous attenuation of the acoustic wave, both within and outside the boundary layer, we retain the last term in Eq. (12) associated with the bulk viscosity. The various notions of mean trajectories and the rationale of identifying the appropriate velocity field to be used in Eq. (4) will be discussed in Sec. IV C.
IV. NUMERICAL MODELING
A. Model system and computational domain
As described in Sec. II, the sharp-edge-based micromixer used in our experiments consists of a single-layer PDMS microchannel with eight sharp-edges, bonded onto a glass slide. The glass slide is actuated via a piezoelectric transducer to acoustically oscillate the sharp-edges. The full physical system is governed by the coupling of elastic, piezoelectric, and transport (convection and diffusion) effects, which makes numerical modeling of the full system challenging as well as expensive. Thus, in this work, we simplify the system considerably by investigating only the hydrodynamic effects inside the microchannel. This approach has been previously shown to yield good qualitative agreement with the experimental observations.27 Figure 1(b) shows the computational domain considered in this work along with the various boundary indicators identifying the specific regions of the boundary. The dimensions of the computational domain have been considered in accordance with the dimensions used in a typical sharp-edge-based micromixer.26 The region before and after the sharp-edges is chosen to be long enough to mitigate the effect of the acoustic streaming flow on the inlet concentration profile. The values of the relevant constitutive and operational parameters are listed in Table I. The boundary conditions employed at various boundaries will be discussed in Section IV B.
TABLE I.
Constitutive and operational parameters at .
| Fluid properties | ||
| Density44 | ρ0 | |
| Speed of sound44 | ||
| Shear viscosity44 | μ | |
| Diffusion coefficient (fluorescein) | D | |
| Bulk viscosity45 | ||
| Compressibilitya | ||
| Polystyrene | ||
| Density44 | ρp | |
| Speed of sound46 (at 20 ) | ||
| Poisson's ratio47 | σp | 0.35 |
| Compressibilityb | ||
| Acoustic actuation parameters | ||
| Forcing frequency | f | |
| Background flow velocity |
Calculated as .
Calculated as from Ref. 48.
B. Boundary conditions
As noted in Sec. IV A, a precise modeling of the sharp-edge-based micromixer requires the solution of a 3D problem considering the elastic, piezoelectric, and hydrodynamic effects. However, the purpose of this work is to investigate the mixing phenomenon inside the sharp-edge-based micromixer. Thus, we considerably simplify the problem at hand by solving a 2D problem with appropriate boundary conditions, obtained from experimental measurements.
For the zeroth-order problem, a non-zero inlet velocity is provided at inlet boundaries, and
| (13) |
At the outlet boundary, , we employ the zero traction or the so-called “do-nothing” boundary condition, while a zero velocity is assigned to the sidewalls including the sharp-edges,
| (14) |
For the first-order boundary conditions, we employ the “do-nothing” (or traction free) boundary condition at both the inlet, and , as well as outlet boundary, . For the first-order problem, we experimentally measure the vibration amplitude of the sharp-edges at various locations along the sharp-edge (see the supplementary material).49 The quadratic fit to the experimental data yields the following equation for the sharp-edge displacement:
| (15) |
where is the experimentally observed sharp-edge displacement and d0 is the displacement coefficient. For the set of the experimental data measured, we obtained . For the second-order problem, a “do-nothing” boundary condition was employed at both the inlet, and , as well as outlet boundary, , while the sidewalls (including the sharp-edges), , were assigned a zero velocity boundary condition, similar to those used by Muller et al.50
| (16) |
For the convection-diffusion equation, we prescribe a concentration value at the inlet boundaries and , respectively,
| (17) |
| (18) |
The sidewalls (including the sharp-edges), , were assigned a no-flux boundary condition
| (19) |
while the outlet was assigned an outlet boundary condition
| (20) |
where the appropriate velocity to be used for these boundary conditions will be identified in Section IV C.
C. Particle and mean flow trajectories
As discussed in our previous work,27 it is customary to use the trajectories of small polystyrene beads to visualize flow in microfluidic devices. The motion of the polystyrene beads is governed by the combination of acoustic streaming induced hydrodynamic drag as well as the acoustic radiation force. Thus, we implement a tracking strategy based on the determination of both the hydrodynamic drag as well as the radiation force acting on a bead of radius a, mass density ρp, and compressibility κp under the influence of an acoustic wave in the flow. The bead is modeled as a wave scatterer,51 and the radiation force is then found to be
| (21) |
where is the compressibility of the fluid, denotes the real part of quantity A, the asterisk denotes the complex conjugate of the quantity, and the coefficients f1 and f2 are given by
| (22) |
with
| (23) |
where the symbol “i” denotes the imaginary unit and δ is the thickness of the viscous boundary layer. In addition to the radiation force, a bead of radius a also experiences an acoustic streaming induced Stokes' drag force, . Thus, the motion of the bead can be predicted via the application of Newton's second law
| (24) |
where mp and are the mass and acceleration of the bead, respectively. In many acoustofluidics problems, the inertia of the bead can be neglected.52 Doing so, Eq. (24) can be solved for
| (25) |
To identify the appropriate velocity field governing the mixing inside the sharp-edge-based micromixer, we adopt the GLM theory described by Bühler.32 This theory is predicated on the notion that the material particles of the fluid in an acoustic field are subjected to a drift effect, generally referred as Stokes' drift53 and thus their mean trajectories are described by a velocity field different than the streaming velocity field. For a steady flow, the mean particle paths can be described via the streamlines of the mean Lagrangian velocity, given by
| (26) |
where the field is the first-order approximation of the lift field . Here, is defined as the difference of the true and the mean position of the fluid particle, such that represents the true position at time t of a particle with mean position at (also at time t). By asymptotic expansion, is such that
| (27) |
The above equation implies that, once the first-order problem velocity solution is computed, can be calculated via an elementary time integration. Thus, the steady particle motion, and hence the mixing phenomena inside the sharp-edge-based micromixer, is governed by the combination of the steady background flow velocity, and the mean Lagrangian velocity (which includes both the second-order velocity as well as the Stokes' drift). Noting this, we have replaced the field in Eqs. (4), (19), and (20) with the field
| (28) |
D. Numerical scheme
We assume a steady background flow profile and hence seek steady solution for the zeroth-order problem. For the first-order problem, we seek solutions of the following form:
| (29a) |
| (29b) |
where is a vector-valued function of space while is a scalar function of space. For the second-order problem and the convection-diffusion equation, we seek steady solutions. Combining information from the zeroth-, first-, and second-order solutions, it is then possible to estimate the velocity field governing the mixing inside the micromixer, as described in Section IV C. This velocity field is then used to solve for the steady-state concentration profile inside the micromixer. All the solutions presented in this work are for two-dimensional problems. The numerical solution was obtained via the finite element software COMSOL Multiphysics 5.054 using the Weak PDE interface. The zeroth-, first-, and second-order flow problems were each modeled using two different instances of this interface, resulting in six instances of the Weak PDE interfaces. The convection-diffusion equation was modeled using another instance of this interface, resulting in a total of seven instances of the Weak PDE interface to model the entire problem. For the zeroth-, first-, and second-order problems we used P2–P1 elements for velocity and pressure, respectively, while we used P2 elements for the concentration, where P1 and P2 denote triangular elements supporting Lagrange polynomials of order one and two, respectively.
V. RESULTS
A. Mesh convergence analysis
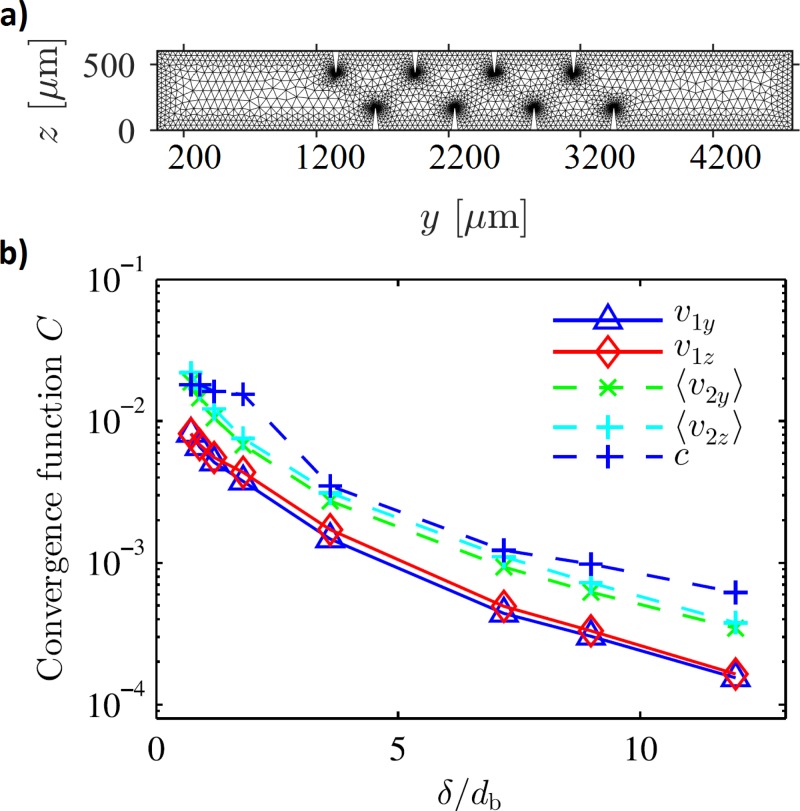
To mitigate the singularity at the sharp-edge tip concerning the second-order velocity,27 we assign the sharp-edge tips a slight curvature of radius 2 μm. To represent this curvature properly in the mesh, we refine the mesh heavily around the sharp-edge tips by employing the edge refinement feature in COMSOL Multiphysics 5.0.54 Since it is important to resolve the viscous boundary layers near the walls to capture the physics inside the boundary layers, we employ a computational mesh with a smaller value of maximum element size near the boundary, compared to the maximum element size in the bulk, . Fig. 2(a) shows an illustrative computational mesh where the maximum element size in the bulk, , is set to be 100 μm, with the maximum element size near the walls is chosen as .
FIG. 2.
Mesh convergence analysis. (a) An illustrative computational mesh obtained with maximum element size near the boundary, , while the maximum element size in the bulk of the domain was set to 100 μm. (b) Semi-logarithmic plot of the relative convergence parameter C, as given in Eq. (30), for decreasing mesh element size near the boundaries, , while keeping the maximum element size in the bulk, constant.
To perform a mesh convergence analysis, we study the behavior of the unknown variables over a series of meshes obtained by setting while progressively decreasing the value of db. Similar to the mesh convergence study reported in Refs. 36 and 50, we define a relative convergence function C(g) for a solution g with respect to a reference solution obtained on the finest mesh as
| (30) |
where we use a reference solution g obtained for with approximately elements. Fig. 2(b) shows the results of the mesh convergence analysis, where the variables can be seen to achieve reasonable convergence (), as the value of reaches 10. Noting the observations from the mesh convergence analysis, all the results presented in this work are obtained with a mesh with or lower.
B. Comparison with experiments
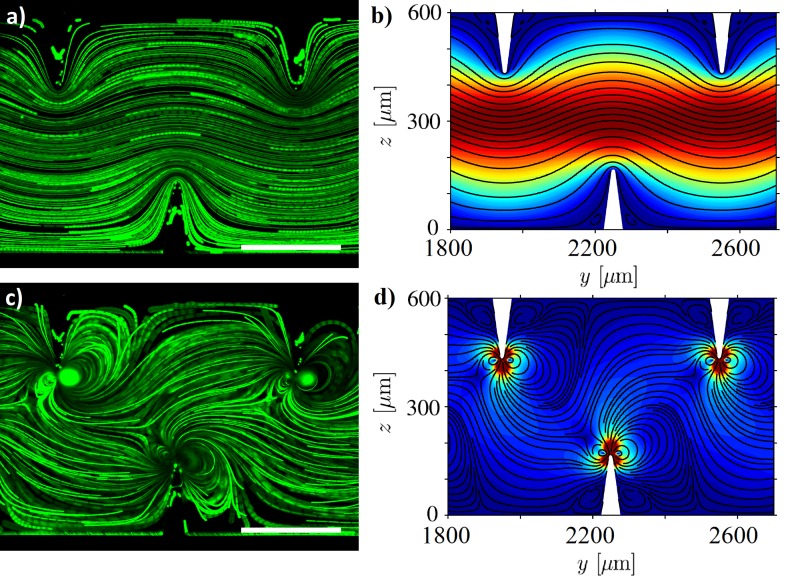
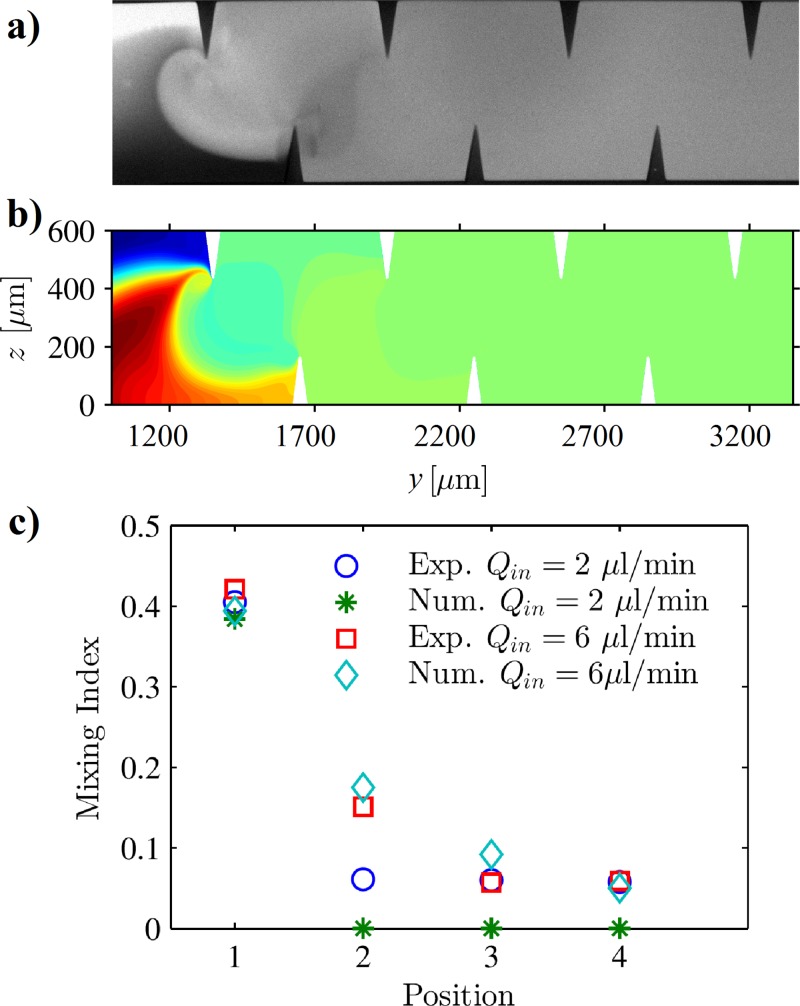
Having performed a mesh convergence analysis, we compare our numerical predictions against the experimentally observed trajectories of 1.9 μm diameter fluorescent beads. Fig. 3(a) shows the experimentally observed trajectories of 1.9 μm diameter fluorescent beads along a section of the channel in the absence of acoustic actuation. The trajectories exhibit an expected laminar flow profile, similar to the one predicted from the numerical results shown in Fig. 3(b). Upon acoustic actuation, an acoustic streaming flow is generated which, on interaction with the background flow, results in the typical flow profile shown in Fig. 3(c). As reported in our previous study,27 in the absence of a background flow, the acoustic streaming flow patterns are symmetric along the center of the channel and exhibit no net flow. However, the presence of a sufficiently strong background flow combines with the acoustic streaming patterns and drives the net flow from left to right. Fig. 3(d) shows the numerical prediction of the net flow field showing a good qualitative match with the experimentally observed trajectories. It must be noted that both the experimental as well as the numerical results show the presence of flow trajectories that move from a particular sharp edge towards the sharp edge on the opposite sidewall, indicating good mixing capabilities. Next, the numerically obtained flow profile was employed to obtain the appropriate velocity field governing the mixing phenomena given by Eq. (28) and solve the convection-diffusion equation, Eq. (4). Figs. 4(a) and 4(b) show a comparison of the experimentally observed normalized concentration profile and the numerically predicted concentration profile along a section of the microfluidic channel. To quantitatively characterize the mixing performance of the sharp-edge-based micromixer, we calculate the mixing index. Experimentally, the mixing index can be calculated as the standard deviation of the normalized gray-scale values which can be extracted from the experimental images.26 A mixing index value of 0.5 indicates completely unmixed fluids, while a zero value of mixing index indicates perfect mixing. Fig. 4(c) shows a comparison of the experimentally measured mixing index values and numerically obtained mixing index values for two different inlet flow rates at four different positions along the channel length. Owing to the difficulties associated with resolving small changes in gray-scale values, it is customary to consider a mixing index value of 0.1 or lower as sufficiently mixed fluids.23,26 As can be seen from Fig. 4(c), the simulation results are in good agreement with the experimental observation of sufficiently good mixing after the first pair of sharp-edges for both the flow rates considered. The minor discrepancies in the numerically predicted values and the experimentally calculated values of mixing index for the flow rate of can be attributed to the aforementioned difficulties associated with resolving small changes in gray-scale values in the experiments. An experimental video showing the perfect mixing for the flow rate of can be found in the supplementary material.49
FIG. 3.
(a) Experimentally and (b) numerically observed trajectories of 1.9 μm diameter fluorescent beads in a typical sharp-edge-based micromixer exhibiting a laminar flow profile in the absence of acoustic actuation. Upon acoustic actuation, the oscillating sharp-edges disturb the laminar flow, resulting in micro vortices near the sharp-edge tips, as observed (c) experimentally and (d) numerically from the trajectories of 1.9 μm diameter fluorescent beads. The scale bars in the experimental figures represent 250 μm.
FIG. 4.
(a) Experimentally observed concentration profile showing the mixing phenomenon inside a typical sharp-edge-based micromixer. (b) Numerically observed concentration profile showing a good match with the experimentally observed concentration profile. (c) Plot of experimentally and numerically calculated mixing index at four different positions along the length of the channel for two different values of input flow rate, where position 1 is before the first pair of sharp-edges at , position 2 is after the first pair of the sharp-edges at , position 3 is after the second pair of sharp-edges at , and position 4 is after the third pair of sharp-edges at .
C. Effect of power
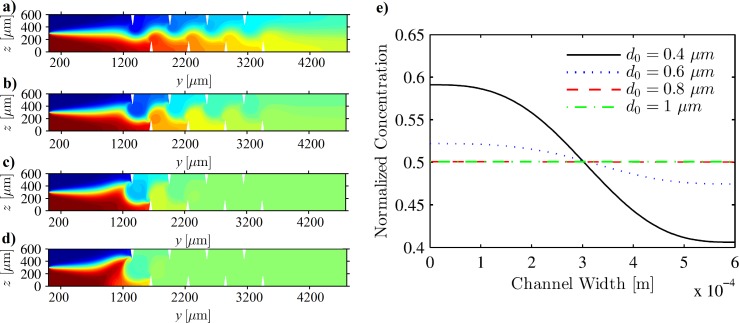
Next, we investigate the effect of applied power or the displacement amplitude on the mixing performance of the sharp-edge-based micromixer. In the absence of a background flow, the streaming velocity scales quadratically with the applied displacement amplitude.27,55–57 Also, for small values of the applied power, the amplitude of the acoustic wave is proportional to the square-root of the signal power. Thus, in the absence of a background flow, the streaming velocity is found to be linearly dependent on the applied power. However, in the presence of the background flow, the velocity governing the mixing inside the micromixer is also a function of the background flow velocity, . Fig. 5 shows the concentration profile inside the sharp-edge-based micromixer for different values of d0: (a) , (b) , (c) , and (d) , for a constant background flow inlet velocity, . It can be observed that at low amplitudes, is totally dominated by the background flow velocity and no appreciable mixing is observed. However, with increasing values of the applied power, the mean Lagrangian velocity, , becomes comparable to and hence is able to effectively perturb the background flow, resulting in significant mixing, albeit at larger mixing lengths. At even higher values of power, is completely dominated by and complete mixing is observed even after the first pair of sharp-edges. Fig. 5(e) shows the corresponding plot of normalized concentration along the channel width at for these cases. It can be seen that while results in incomplete mixing, the case with results in reasonable mixing after four sharp edges, and further increase in the value of d0 results in almost perfect mixing. The optimum applied power for a particular application depends on the desired throughput (i.e., the background flow rate) and the desired mixing length. For a constant mixing length, it is possible to achieve higher throughputs by applying higher input power. Conversely, for a constant desired throughput, the mixing length can be shortened by increasing the applied input power.
FIG. 5.
Concentration profile inside the sharp-edge-based micromixer for different values of d0: (a) , (b) , (c) , and (d) , for a constant background flow inlet velocity, . (e) Plot of normalized concentration along the width of the channel at , showing that mixing performance increases with an increase in d0.
D. Effect of background flow velocity
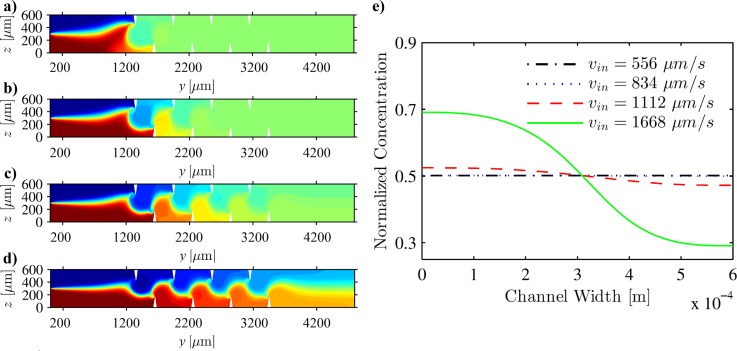
Next, we investigate the effect of the background flow velocity, , on the mixing performance of the micromixer. The effect of background flow velocity on the mixing performance is non-trivial, since the background flow is not a direct superposition over the streaming flow. As can be seen from the governing equations in Sec. III, both the first-and second-order equations contain zeroth-order terms. Therefore, a change in influences both as well as , the two conflicting components of the velocity field governing the mixing, . Fig. 6 shows the concentration profile inside the sharp-edge-based micromixer for different values of background flow inlet velocity: (a) , (b) , (c) , and (d) , for a constant value of . Fig. 6(e) shows the corresponding plot of normalized concentration along the channel width at for these cases. At low values of the background flow inlet velocity, nearly perfect mixing is observed, even after the first pair of sharp-edges. However, as the background flow velocity increases and becomes significant in comparison with , the mixing performance starts to deteriorate. At very high values of background flow rates, the mixing performance suffers and incomplete mixing is observed even after four pairs of sharp-edges, necessitating larger mixing lengths or higher input power to achieve complete mixing.
FIG. 6.
Concentration profile inside the sharp-edge-based micromixer for different values of background flow inlet velocity: (a) , (b) , (c) , and (d) , for a constant value of . (e) Plot of normalized concentration along the width of the channel at , showing that mixing performance deteriorates with an increase in the background flow inlet velocity, .
E. Alternative designs
Having studied the effects of operational parameters on the mixing performance of the micromixer, we turn our attention to the effects of geometrical parameters on the mixing performance of the micromixer. To this end, we investigate the mixing performance of two different designs of sharp-edge-based micromixer: (i) a sharp-edge-based micromixer where the sharp-edges on the opposite sidewalls have been placed directly opposite to each other and (ii) a sharp-edge-based micromixer with sharp-edge length greater than the half of the channel width such that the sharp-edge directly interacts with the incoming streams of both the fluids to be mixed.
1. Opposite edges
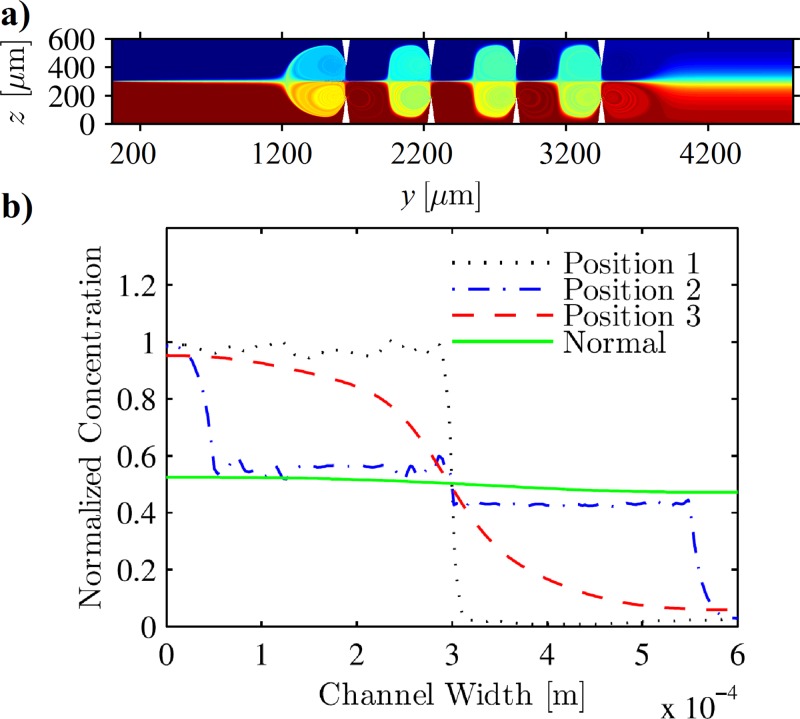
Here, we investigate the mixing performance of a sharp-edge-based micromixer with sharp-edges placed directly opposite to each other. The rationale behind choosing this design is that the successive diverging and converging character of the flow might improve the mixing performance similarly to what is observed in a passive micromixer such as that reported by Hsieh and Huang.58 Fig. 7(a) shows the concentration profile in the case of a sharp-edge-based micromixer with sharp-edges placed directly opposite to each other. Fig. 7(b) shows the plot of normalized concentration profile along the width of the channel at three different locations: position 1 at , position 2 at , and position 3 at along with the corresponding concentration profile at for the “normal design,” by which we mean that in Fig. 1(b). It can be seen that there is no significant mixing at position 1, but at position 2, where the fluid is trapped in the vortices, incomplete mixing is observed. Slightly better mixing is observed near the outlet of the channel. However, the mixing performance of the new design is much inferior compared to the normal design. This can be attributed to the fact that the two opposing sharp-edges suppress the acoustic streaming flow by each other, resulting in poorer mixing as compared to the usual design employed thus far. The incoming fluid that is trapped into the vortices near the sharp-edges is partially mixed, but a stream of the fluid is convected past the sharp-edge totally unmixed. Thus, it is advisable to have a non-zero lateral separation between the sharp-edges for better mixing performance.
FIG. 7.
(a) Concentration profile inside the sharp-edge-based micromixer with sharp-edges placed directly opposite to each other for a background flow inlet velocity of and . (b) Plot of normalized concentration along the width of the channel at position 1 at , position 2 at , and position 3 at along with the corresponding concentration profile at for the “normal design” (shown in Fig. 1(b)), indicating that the performance of “normal design” sharp-edge-based micromixer is significantly better than the sharp-edge-based micromixer with the sharp-edges placed opposite to each other.
2. Larger edges
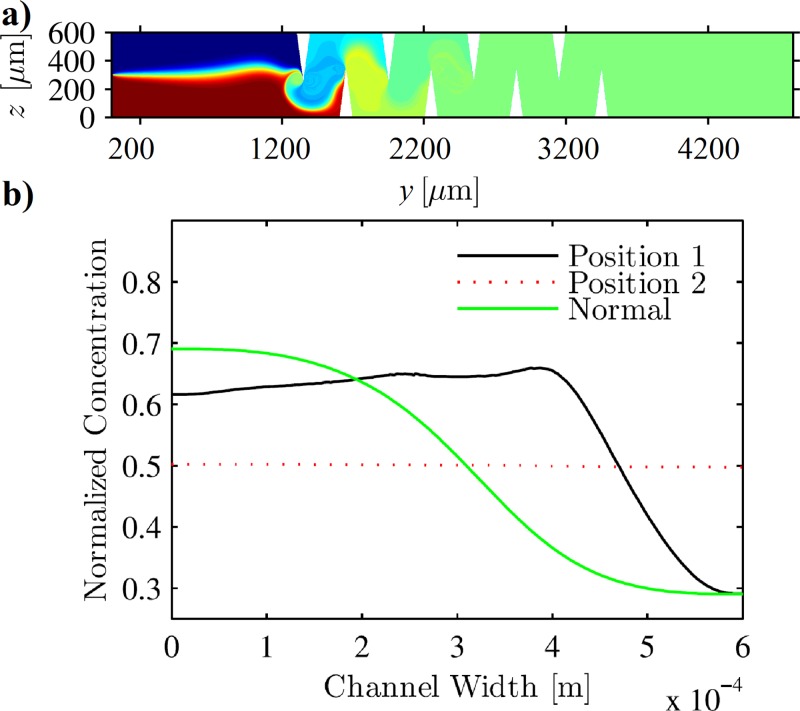
Next, we investigate the mixing performance of a sharp-edge based micromixer with larger sharp-edges such that both the incoming streams of the flow directly encounter the first sharp-edge. This design was chosen since it is expected to be capable of perturbing both the incoming streams more efficiently to enhance the mixing performance. Fig. 8(a) shows the concentration profile in the case of a sharp-edge-based micromixer with sharp-edges larger than the half-width of the channel. Fig. 8(b) shows the plot of normalized concentration profile along the width of the channel at two different locations: position 1 after the first pair of sharp-edges at , and position 2 at along with the corresponding concentration profile from the normal design (as shown in Fig. 1(b)) at . It can be seen that the fluid is almost completely mixed even after the first pair of sharp-edges and the final mixing performance at position 2 is significantly better than the mixing performance of the normal design (as shown in Fig. 1(b)) at . Thus, a sharp-edge-based micromixer with larger sharp-edges is expected to achieve better mixing. However, this statement must be qualified by the practical consideration that it might be difficult to oscillate a larger sharp-edge due to larger mass.
FIG. 8.
(a) Concentration profile inside the sharp-edge-based micromixer with larger sharp-edges for a background flow inlet velocity of and . (b) Plot of normalized concentration along the width of the channel at position 1 at , and position 2 at along with the corresponding concentration profile at for the “normal design” (shown in Fig. 1(b)), indicating that the performance of sharp-edge-based micromixer with larger sharp-edges is significantly better than the “normal design” of the sharp-edge-based micromixer.
F. Generation of concentration gradient
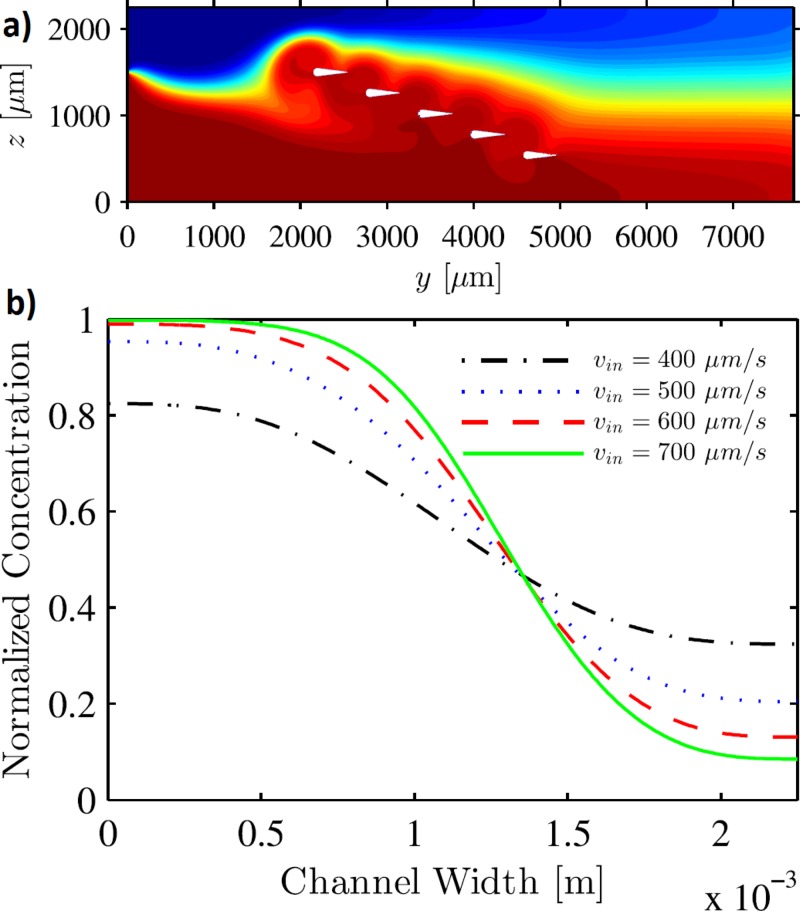
Next, as an application of our numerical model, we investigate the concentration profile inside a microfluidic channel where the sharp-edges are placed inside the channel in a linear fashion as shown in Fig. 9(a). The inlet of two fluids is chosen as non-symmetric such that the fluid is increasingly mixed upon encountering successive sharp-edges, resulting in a concentration gradient along the channel width. Fig. 9(a) shows the resulting concentration profile inside the microfluidic channel, while Fig. 9(b) shows the plot of the normalized concentration profile along the width of the channel at for different values of background flow inlet velocity: (a) , (b) , (c) , and (d) , for a constant value of d0. It can be seen that the slope of the concentration gradient can be tuned by tuning the background flow inlet velocity since a smaller background flow velocity results in a more homogeneous mixing of the fluid, thereby producing a concentration gradient with lower slope. Since the background flow velocity and the input power are the two conflicting parameters governing the mixing inside the channel, a similar tuning of the concentration profile can also be achieved by tuning the input power. In principle, different types of concentration gradients can be achieved by considering different spatial arrangements of the sharp-edges inside the microchannel. This concept has been recently utilized by Huang et al.29 to achieve a stable, spatiotemporally controllable gradient which can be useful in studying the dynamics of the cellular response to chemical microenvironments such as quantification of ovarian cancer markers.59
FIG. 9.
Concentration profile inside the sharp-edge based gradient device with an array of five sharp-edge structures placed inside the microfluidic channel. (b) Plot of normalized concentration along the width of the channel at , showing a gradient in concentration along the channel width for different values of background flow inlet velocity.
VI. CONCLUSION
In conclusion, we presented a numerical model to investigate acoustic mixing inside a sharp-edge-based micromixer using the GLM theory in conjunction with the convection-diffusion equation. As opposed to the existing models of sharp-edge devices which investigate only the flow patterns in these devices, our model offers the capability to investigate mixing phenomena. Moreover, our model offers significant improvements over the existing models in that it accounts for the presence of a background flow, while simultaneously investigating the full fluidic domain, thereby precluding the requirement of employing either periodic boundary conditions or the perfectly matched layers. The results from our numerical model are found to be in good agreement with the experimental results. We employed our model to study the effect of applied input power and the background flow velocity on the mixing performance of a sharp-edge-based micromixer. We also investigated different designs of sharp-edge-based micromixer, where larger sharp-edges were found to be helpful in improving the performance of the sharp-edge-based micromixer. Finally, as an application of our numerical model, we investigated the generation of a concentration gradient by considering a linear arrangement of the sharp-edges inside the microchannel. We believe that our upgraded numerical model, apart from being helpful in optimizing the design and the operation of the sharp-edge-based micromixer, can also be useful for the analysis of acoustic streaming in the case of a moving fluid.
ACKNOWLEDGMENTS
This work was supported by the National Institutes of Health (1R01 GM112048-01A1 and 1R33EB019785-01), the National Science Foundation (CBET-1438126 and IIP-1346440), and the Penn State Center for Nanoscale Science (MRSEC) under Grant No. DMR-0820404.
References
- 1. Han J., Fu J., Wang Y.-C., and Song Y.-A., Encyclopedia of Microfluidics and Nanofluidics ( Springer, 2008), pp. 96–106. [Google Scholar]
- 2. Zec H., Shin D. J., and Wang T.-H., Expert Rev. Mol. Diagn. 14, 787 (2014). 10.1586/14737159.2014.945437 [DOI] [PubMed] [Google Scholar]
- 3. Lee A., Lab Chip 13, 1660 (2013). 10.1039/c3lc90031b [DOI] [PubMed] [Google Scholar]
- 4. Coleman J. T. and Sinton D., Microfluid. Nanofluid. 1, 319 (2005). 10.1007/s10404-005-0034-y [DOI] [Google Scholar]
- 5. Wang S. S., Huang X. Y., and Yang C., Lab Chip 11, 2081 (2011). 10.1039/c0lc00695e [DOI] [PubMed] [Google Scholar]
- 6. Hashmi A. and Xu J., J. Lab. Autom. 19, 488 (2014). 10.1177/2211068214540156 [DOI] [PubMed] [Google Scholar]
- 7. Hsiung S.-K., Lee C.-H., Lin J.-L., and Lee G.-B., J. Micromech. Microeng. 17, 129 (2007). 10.1088/0960-1317/17/1/017 [DOI] [Google Scholar]
- 8. Zhang Y. and Wang T.-H., Microfluid. Nanofluid. 12, 787 (2012). 10.1007/s10404-011-0922-2 [DOI] [PMC free article] [PubMed] [Google Scholar]
- 9. Lee C.-Y., Chang C.-L., Wang Y.-N., and Fu L.-M., Int. J. Mol. Sci. 12, 3263 (2011). 10.3390/ijms12053263 [DOI] [PMC free article] [PubMed] [Google Scholar]
- 10. Hessel V., Löwe H., and Schönfeld F., Chem. Eng. Sci. 60, 2479 (2005). 10.1016/j.ces.2004.11.033 [DOI] [Google Scholar]
- 11. Lin S.-C. S., Mao X., and Huang T. J., Lab Chip 12, 2766 (2012). 10.1039/c2lc90076a [DOI] [PMC free article] [PubMed] [Google Scholar]
- 12. Shi J., Mao X., Ahmed D., Colletti A., and Huang T. J., Lab Chip 8, 221 (2008). 10.1039/B716321E [DOI] [PubMed] [Google Scholar]
- 13. Rezk A. R., Qi A., Friend J. R., Li W. H., and Yeo L. Y., Lab Chip 12, 773 (2012). 10.1039/C2LC21065G [DOI] [PubMed] [Google Scholar]
- 14. Tseng W.-K., Lin J.-L., Sung W.-C., Chen S.-H., and Lee G.-B., J. Micromech. Microeng. 16, 539 (2006). 10.1088/0960-1317/16/3/009 [DOI] [Google Scholar]
- 15. Luong T.-D., Phan V.-N., and Nguyen N.-T., Microfluid. Nanofluid. 10, 619 (2011). 10.1007/s10404-010-0694-0 [DOI] [Google Scholar]
- 16. Shilton R. J., Yeo L. Y., and Friend J. R., Sens. Actuators, B 160, 1565 (2011). 10.1016/j.snb.2011.09.007 [DOI] [Google Scholar]
- 17. Wixforth A., Strobl C., Gauer C., Toegl A., Scriba J., and von Guttenberg Z., Anal. Bioanal. Chem. 379, 982 (2004). 10.1007/s00216-004-2693-z [DOI] [PubMed] [Google Scholar]
- 18. Frommelt T., Kostur M., Wenzel-Schäfer M., Talkner P., Hänggi P., and Wixforth A., Phys. Rev. Lett. 100, 034502 (2008). 10.1103/PhysRevLett.100.034502 [DOI] [PubMed] [Google Scholar]
- 19. Sritharan K., Strobl C. J., Schneider M. F., Wixforth A., and Guttenberg Z., Appl. Phys. Lett. 88, 054102 (2006). 10.1063/1.2171482 [DOI] [Google Scholar]
- 20. Yu H., Kwon J. W., and Kim E. S., J. Microelectromech. Syst. 15, 1015 (2006). 10.1109/JMEMS.2006.878890 [DOI] [Google Scholar]
- 21. Yang Z., Matsumoto S., Goto H., Matsumoto M., and Maeda R., Sens. Actuators, A 93, 266 (2001). 10.1016/S0924-4247(01)00654-9 [DOI] [Google Scholar]
- 22. Oberti S., Neild A., and Ng T. W., Lab Chip 9, 1435 (2009). 10.1039/b819739c [DOI] [PubMed] [Google Scholar]
- 23. Ahmed D., Mao X., Juluri B. K., and Huang T. J., Microfluid. Nanofluid. 7, 727 (2009). 10.1007/s10404-009-0444-3 [DOI] [Google Scholar]
- 24. Liu R. H., Yang J. N., Pindera M. Z., Athavale M., and Grodzinski P., Lab Chip 2, 151 (2002). 10.1039/b201952c [DOI] [PubMed] [Google Scholar]
- 25. Hashmi A., Yu G., Reilly-Collette M., Heiman G., and Xu J., Lab Chip 12, 4216 (2012). 10.1039/c2lc40424a [DOI] [PubMed] [Google Scholar]
- 26. Huang P.-H., Xie Y., Ahmed D., Rufo J., Nama N., Chen Y., Chan C. Y., and Huang T. J., Lab Chip 13, 3847 (2013). 10.1039/c3lc50568e [DOI] [PMC free article] [PubMed] [Google Scholar]
- 27. Nama N., Huang P.-H., Huang T. J., and Costanzo F., Lab Chip 14, 2824 (2014). 10.1039/c4lc00191e [DOI] [PMC free article] [PubMed] [Google Scholar]
- 28. Ovchinnikov M., Zhou J., and Yalamanchili S., J. Acoust. Soc. Am. 136, 22 (2014). 10.1121/1.4881919 [DOI] [PubMed] [Google Scholar]
- 29. Huang P.-H., Chan C. Y., Li P., Nama N., Xie Y., Wei C.-H., Chen Y., Ahmed D., and Huang T. J., Lab Chip 15, 4166 (2015). 10.1039/C5LC00868A [DOI] [PMC free article] [PubMed] [Google Scholar]
- 30. Huang P.-H., Ren L., Nama N., Li S., Li P., Yao X., Cuento R. A., Wei C.-H., Chen Y., Xie Y. et al. , Lab Chip 15, 3125 (2015). 10.1039/C5LC00539F [DOI] [PMC free article] [PubMed] [Google Scholar]
- 31. Leibacher I., Hahn P., and Dual J., Microfluid. Nanofluid. 19, 923 (2015). 10.1007/s10404-015-1621-1 [DOI] [Google Scholar]
- 32. Bühler O., Waves and Mean Flows, Cambridge Monographs on Mechanics ( Cambridge University Press, Cambridge, UK, 2009). [Google Scholar]
- 33. Landau L. D. and Lifshitz E. M., Fluid Mechanics, Course of Theoretical Physics, 2nd ed. ( Pergamon Press, Oxford, 1993), Vol. 6. [Google Scholar]
- 34. Gurtin M. E., Fried E., and Anand L., The Mechanics and Thermodynamics of Continua ( Cambridge University Press, New York, 2010). [Google Scholar]
- 35. Köster D., SIAM J. Sci. Comput. 29, 2352 (2007). 10.1137/060676623 [DOI] [Google Scholar]
- 36. Nama N., Barnkob R., Mao Z., Kähler C. J., Costanzo F., and Huang T. J., Lab Chip 15, 2700 (2015). 10.1039/C5LC00231A [DOI] [PMC free article] [PubMed] [Google Scholar]
- 37. Ding X., Li P., Lin S.-C. S., Stratton Z. S., Nama N., Guo F., Slotcavage D., Mao X., Shi J., Costanzo F., and Huang T. J., Lab Chip 13, 3626 (2013). 10.1039/c3lc50361e [DOI] [PMC free article] [PubMed] [Google Scholar]
- 38. Bowen R. M., “ Theory of mixtures,” in Continuum Physics ( Academic Press, Waltham, 1976), Vol. III. [Google Scholar]
- 39. Frommelt T., Gogel D., Kostur M., Talkner P., Hanggi P., and Wixforth A., IEEE Trans. Ultrason., Ferroelectr. Freq. Control 55, 2298 (2008). 10.1109/TUFFC.928 [DOI] [PubMed] [Google Scholar]
- 40. Nyborg W. L., in Nonlinear Acoustics, edited by Hamilton M. F. and Blackstock D. T. ( Academic Press, San Diego, CA, 1998), pp. 207–231. [Google Scholar]
- 41. Bruus H., Theoretical Microfluidics ( Oxford University Press, Oxford, 2008). [Google Scholar]
- 42. Muller P. B., “ Acoustofluidics in microsystems: Investigation of acoustic streaming,” M.S. thesis, Technical University of Denmark, 2012. [Google Scholar]
- 43. Stuart J., J. Fluid Mech. 24, 673 (1966). 10.1017/S0022112066000910 [DOI] [Google Scholar]
- 44.CRCnetBASE Product, see www.hbcpnetbase.com/ for CRC Handbook of Chemistry and Physics, 92nd ed. ( Taylor and Francis Group, 2012). [Google Scholar]
- 45. Holmes M. J., Parker N. G., and Povey M. J. W., J. Phys.: Conf. Ser. 269, 012011 (2011). 10.1088/1742-6596/269/1/012011 [DOI] [Google Scholar]
- 46. Bergmann L., Der Ultraschall und seine Anwendung in Wissenschaft und Technik, 6th ed. ( S. Hirzel Verlag, Stuttgart, 1954). [Google Scholar]
- 47. Mott P. H., Dorgan J. R., and Roland C. M., J. Sound Vib. 312, 572 (2008). 10.1016/j.jsv.2008.01.026 [DOI] [Google Scholar]
- 48. Landau L. D. and Lifshitz E. M., Theory of Elasticity, Course of Theoretical Physics, 3rd ed. ( Pergamon Press, Oxford, 1986), Vol. 7. [Google Scholar]
- 49.See supplementary material at http://dx.doi.org/10.1063/1.4946875E-BIOMGB-10-037602 for an experimental video showing mixing inside the sharp-edge based micromixer.
- 50. Muller P. B., Barnkob R., Jensen M. J. H., and Bruus H., Lab Chip 12, 4617 (2012). 10.1039/c2lc40612h [DOI] [PubMed] [Google Scholar]
- 51. Settnes M. and Bruus H., Phys. Rev. E 85, 016327 (2012). 10.1103/PhysRevE.85.016327 [DOI] [PubMed] [Google Scholar]
- 52. Barnkob R., “ Physics of Microparticle Acoustophoresis—Bridging Theory and Experiments,” Ph.D. thesis, Danmarks Tekniske Universitet (DTU), Lyngby, Denmark, 2012. [Google Scholar]
- 53. Zarembo L. K., “ High-intensity ultrasonic fields,” in Ultrasonic Technology, edited by Rozenberg L. D. ( Springer, 1971), pp. 135–199. [Google Scholar]
- 54.See www.comsol.com for COMSOL Multiphysics 5.0, 2015.
- 55. Sankaranarayanan S. K., Cular S., Bhethanabotla V. R., and Joseph B., Phys. Rev. E 77, 066308 (2008). 10.1103/PhysRevE.77.066308 [DOI] [PubMed] [Google Scholar]
- 56. Nguyen N.-T., Meng A. H., Black J., and White R. M., Sens. Actuators, A 79, 115 (2000). 10.1016/S0924-4247(99)00279-4 [DOI] [Google Scholar]
- 57. Thompson M. W. and Atchley A. A., J. Acoust. Soc. Am. 117, 1828 (2005). 10.1121/1.1861233 [DOI] [PubMed] [Google Scholar]
- 58. Hsieh S.-S. and Huang Y.-C., J. Micromech. Microeng. 18, 065017 (2008). 10.1088/0960-1317/18/6/065017 [DOI] [Google Scholar]
- 59. Escobedo C., Chou Y.-W., Rahman M., Duan X., Gordon R., Sinton D., Brolo A. G., and Ferreira J., Analyst 138, 1450 (2013). 10.1039/c3an36616b [DOI] [PubMed] [Google Scholar]
Associated Data
This section collects any data citations, data availability statements, or supplementary materials included in this article.
Data Citations
- See supplementary material at http://dx.doi.org/10.1063/1.4946875E-BIOMGB-10-037602 for an experimental video showing mixing inside the sharp-edge based micromixer.


