

Abstract
Many biological processes depend on the sequential assembly of protein complexes. However, studying the kinetics of such processes by direct methods is often not feasible. As an important class of such protein complexes, pore-forming toxins start their journey as soluble monomeric proteins, and oligomerize into transmembrane complexes to eventually form pores in the target cell membrane. Here, we monitored pore formation kinetics for the well-characterized bacterial pore-forming toxin aerolysin in single cells in real time to determine the lag times leading to the formation of the first functional pores per cell. Probabilistic modeling of these lag times revealed that one slow and seven equally fast rate-limiting reactions best explain the overall pore formation kinetics. The model predicted that monomer activation is the rate-limiting step for the entire pore formation process. We hypothesized that this could be through release of a propeptide and indeed found that peptide removal abolished these steps. This study illustrates how stochasticity in the kinetics of a complex process can be exploited to identify rate-limiting mechanisms underlying multistep biomolecular assembly pathways.
Introduction
The proper assembly of macromolecular complexes such as ribosomes or multisubunit membrane channels is essential for biology. However, the mechanisms by which multimeric complexes form are still poorly understood. Systems such as cytoskeletal proteins, which allow in vitro assembly of homomeric soluble complexes, have been particularly attractive model systems (1, 2, 3). By contrast, studying the assembly of multisubunit membrane complexes has been notably difficult. A favorable situation is provided by pore-forming proteins, the best-characterized subclass of which is formed by bacterial pore-forming toxins (PFTs) (4). These proteins can generally be produced recombinantly and in a soluble monomeric form. At high concentrations, as encountered upon binding to target cells, they oligomerize into ringlike structures that insert into the plasma membrane.
Despite increasing knowledge about the mode of action of PFTs (4, 5), the mechanisms and the kinetics of self-assembly of these complexes remain largely enigmatic. In particular, it is not known whether oligomerization occurs through the sequential addition of monomers or through interaction of multimeric intermediates, whether oligomerization is a limiting step in the pore-formation process, and whether all PFTs assemble through similar mechanisms. This incomplete picture is mostly due to the fact that intermediates have generally not been visualized by biochemical or structural methods.
Here, we aimed at investigating whether the distribution of individual pore formation times measured at the single-cell level could provide mechanistic information on the assembly process. A similar approach has been successfully used to study membrane fusion events of single viruses (6). We chose the well-characterized PFT aerolysin produced by Aeromonas hydrophila. This toxin is produced by the bacterium as an inactive precursor called proaerolysin, which harbors a C-terminal peptide (CTP) (7). Proteolytic enzymes present in the gut or at the surface of target cells hydrolyze a peptide bond between the CTP and the mature toxin peptide, aerolysin, which can subsequently oligomerize into heptameric pores of ≈2 nm in diameter (8). We measured cell permeabilization times at the single-cell level using two independent live-cell imaging methods, in erythrocytes and in nucleated cells. Mathematical modeling of the stochasticity in the permeabilization times allowed us to determine the minimal number of steps required for pore formation. Our analysis suggests that the limiting steps for a functional aerolysin pore to form consist in the conversion of each monomer to an assembly competent state, plus an additional event that we hypothesis could be related to membrane insertion.
Materials and Methods
Toxin preparation and generation of CTP-free aerolysin
Aerolysin was prepared as described previously in Buckley (9) and Heuck et al. (10). The purity of aerolysin, WT, and Y221G, was checked by sodium dodecyl sulfate-polyacrylamide electrophoresis. The activity assessed by hemolysis as previously described in Iacovache et al. (11). The activity of Y221G was assessed by monitoring its ability to oligomerize (12). Synthetic custom CTP was generated by EZBiolab (Carmel, IN). The proaerolysin S453P mutant harboring a C-terminal histidine tag was produced in Escherichia coli and purified as described in Iacovache et al. (11). Proaerolysin S453P at 0.5 mg/mL in 20 mM Tris, 150 mM NaCl, pH 8 was subsequently processed with prewashed trypsin immobilized on agarose beads (Sigma-Aldrich, St. Louis, MO) on a rotary shaker for 2 h at 4°C (11). The trypsin agarose beads were removed by centrifugation at 7000 rpm in a tabletop Eppendorf centrifuge. The sample was subsequently incubated with Nickel agarose beads and CTP-free aerolysin was recovered in the unbound fraction (11).
Bulk hemolysis
Blood samples were obtained from human donors. Red blood cells (RBCs) were prepared by three rounds of centrifugation and washing with cold PBS (phosphate-buffered saline; 2.7 mM KCl, 150 mM NaCl 1.5 mM KH2PO4, 6.5 mM Na2HPO4) at 2500 rpm for 5 min at 4°C, and mixed 1:1 with anticoagulation buffer afterwards. Anti-coagulation buffer was prepared in the following way for 100 mL: 479 mg citric acid 1-H2O (MW 210.14), 1.5 g sodium citrate −2H2O (MW 294.1), 2.75 g glucose 1-H2O (MW 198.17). Before the experiments the RBCs were centrifuged and 0.2 mL from the pellet was diluted in 25 mL of cold PBS. Hemolytic activity of aerolysin was measured after activating the toxin as follows: Trypsin was taken from a 1 mg/mL stock solution and added to the proaerolysin sample at a concentration of 10 μg/mL for 10 min at room temperature. Bulk hemolysis was measured after serial dilution of the toxin in PBS in 96-well plates. RBCs were added in a 1:1 mix and the plate was immediately put in a 96-well plate reader (SpectraMax M2e; Molecular Devices, Eugene, OR) to measure the absorbance at 450 nm for 2 h with a time interval of 40 s.
Live-cell imaging
Erythrocytes were injected with the toxins into a microfluidic chamber ultraviolet imager (Ibidi, Martinsried, Germany) directly under an Axiovert 200M microscope (Carl Zeiss, Jena, Germany) and recorded with phase contrast with a 10 s time interval at 10× magnification. The Affi-Gel Blue Beads (Bio-Rad, Hercules, CA) were soaked in 100 μL of activated aerolysin (1000 ng/mL) for 30 min at room temperature before addition to an erythrocyte cell lawn (MatTek, Ashland, MA). HeLa cells were diluted to 500,000 cells/mL, plated inside the microchamber ultraviolet imager, and loaded for 30 min at 37°C with calcium-sensitive dye Fura-FF (6 μM). After washing and incubating for a further 20 min with full medium, the cells were directly incubated with a toxin (containing Hanks Salt buffer and 1 μM thapsigargin) under an epifluorescence microscope (Axiovert 200M, Carl Zeiss) equipped with the following setup: oil-immersion objective Neofluar 25× (Carl Zeiss), using 200 ms exposure times at 340 and 380 nm, respectively, with a time interval of 2 min between each acquisition. Binning was equal to 2. Filter sets were from Chroma Technology (Bellows Falls, VT).
Image and data analysis
Movies were analyzed using ImageJ (National Institutes of Health, http://rsbweb.nih.gov/ij/). Each movie was projected and converted to a black-and-white threshold image to use as a mask to define the regions of interest for each cell. The intensity traces of each movie were exported to MATLAB (The MathWorks, Natick, MA). A background region was extracted for normalization of the signal. For the calcium assay, the regions of interest were defined by hand and extracted for both excitation wavelengths. The portions of the traces before the lysis were fitted to a sigmoidal function to detect the times of first pore formation Tlag (Fig. 1 B).
Figure 1.

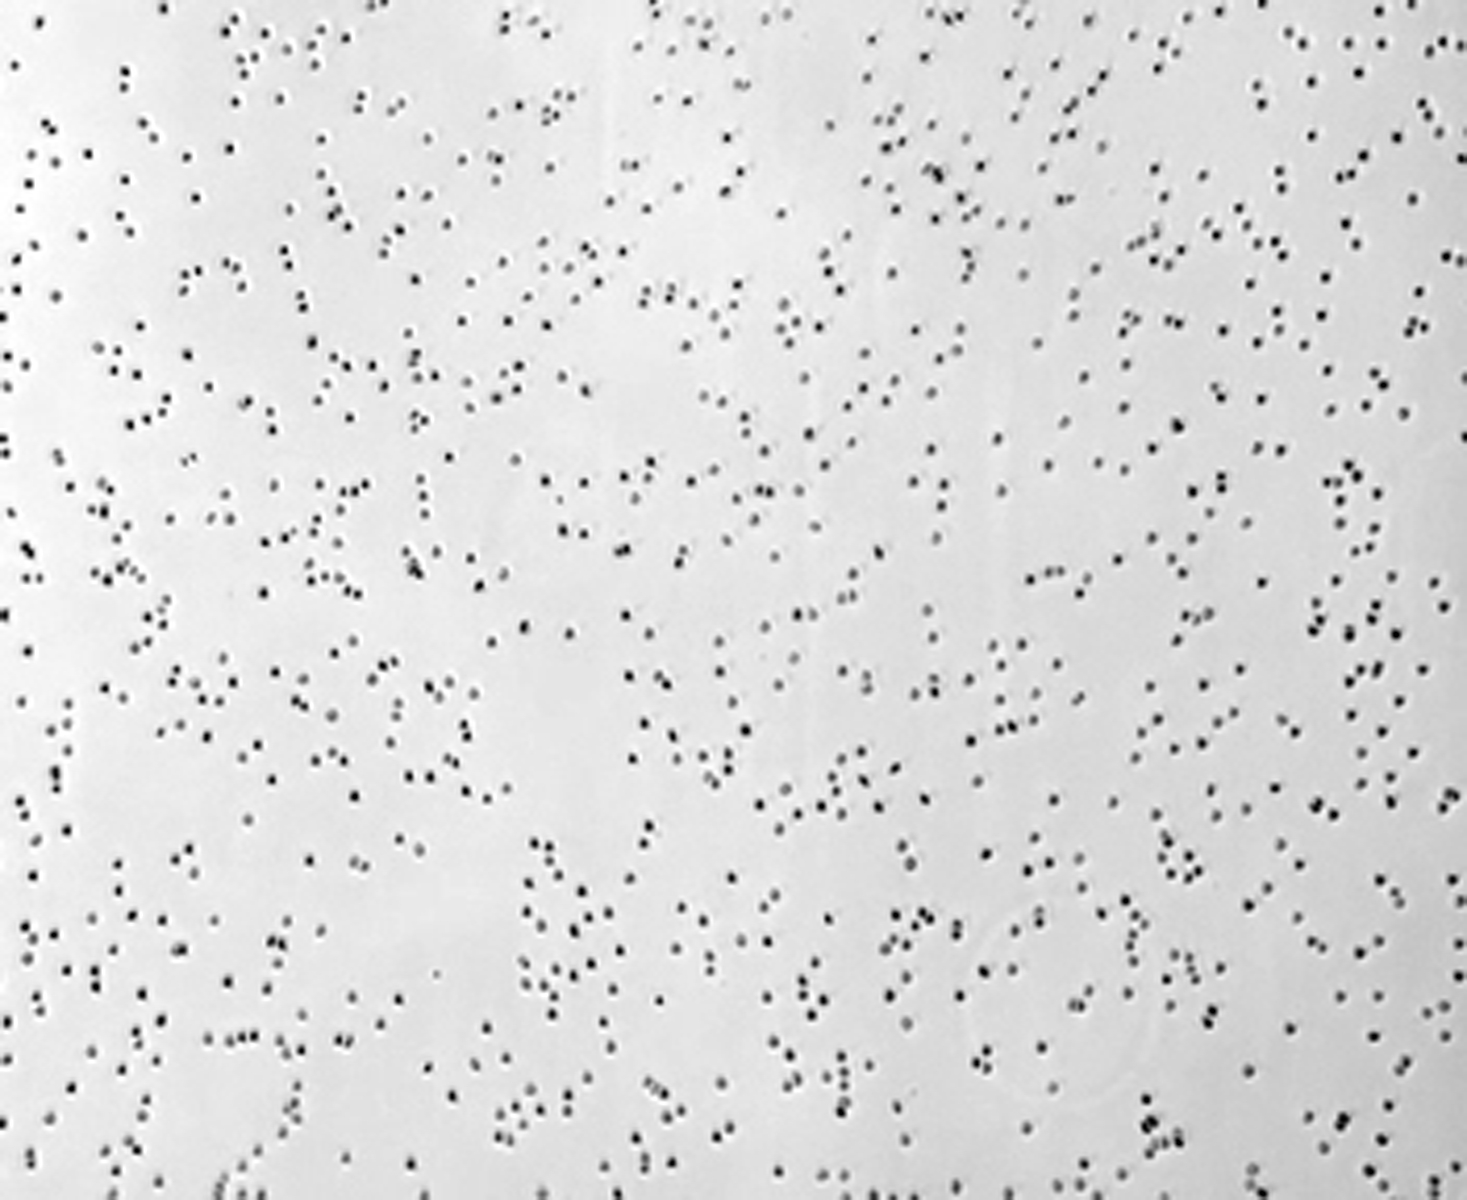
Single-cell hemolysis upon treatment with aerolysin. (A) Phase contrast images of single red blood cells subjected to 10 ng/mL of aerolysin. (Inset) Magnification of a single cell showing change in intensity upon pore formation. (B) Representative trace illustrating the typical morphological changes that occur upon toxin treatment. During the lag time, Tlag, the toxins bind, aggregate, and form the first pores (yellow). Then the cells osmotically swell (orange) and finally lyse when the pressure becomes too big (red). (C) Signal intensities of a selection of single-cell traces from the recording in (A) at 10 ng/mL aerolysin.
Digital holographic microscopy
Holographic microscopy was performed in Professor Magistretti’s laboratory at the École Polytechnique Fédérale de Lausanne (Lausanne, Switzerland). Measurements were made with a transmission DHM setup (DHM T1000; Lynceé Tec, Lausanne, Switzerland) (13). The setup is a Mach-Zehnder interferometer in which an object beam illuminates the specimen and interferes with the reference beam on the charge-coupled device camera. The measured interference pattern allows reconstructing the phase retardation induced by the biological specimen. This quantitative phase signal is related to cell parameters including cell volume, cell shape, and integral refractive index.
Mathematical modeling and data fitting
The lag times until pore formation Tlag measured in single cells were normalized by the average lag time 〈Tlag〉 for each monomer concentration. A stochastic model was used to describe these rescaled lag times. In particular, we considered a generic model in which a sequence of stochastic reactions with rates describing N limiting sequential steps is required to form a functional pore. A key aspect of the model is that N is not known and will be estimated from the data. In such models, for any set of reactions rates, the total time to form a pore follows a phase-type distribution,
where , , and S is the rate matrix, as:
The probability (likelihood) of observing a set of measured lag times given the model parameters is:
where we assumed that the lag times are identically and independently distributed. Applying Bayes rule and a scale-uniform prior over the rates , we obtained a posterior probability over the model parameters:
To estimate the posterior mean and the posterior standard deviation of the parameters, the posterior distribution was sampled using a standard Markov Chain Monte Carlo (MCMC) algorithm. Finally, we selected the optimal number of limiting reaction N using the Bayesian Information Criterion (BIC), which prescribes to select the model (in our case, N) that minimizes the following score:
where is the maximum of the likelihood function (obtained by numerical optimization using an interior-point algorithm), and D is the number of data points (number of analyzed cells). The second term in the above formula can be understood as a penalization factor for the complexity of the model, thus preventing overfitting. Note that, when comparing two models, the one with the lowest BIC score is preferred. A guideline is given in Kass and Raftery (14) to evaluate the strength of the evidence against the model with higher BIC score. In summary, a score difference between 2 and 6 represents positive evidence; between 6 and 10, strong evidence; and >10, very strong evidence.
Results and Discussion
Lag times until pore formation in single erythrocyte cells
The activity of PFTs is classically determined by monitoring the bulk release of hemoglobin after erythrocytes lysis (15, 16). The readout of this assay results in a typical sigmoidal curve, the slope of which varies with the toxin concentration as illustrated for aerolysin (Fig. S1 in the Supporting Material). However, this analysis at the population level masks all cell-to-cell variability. To assess this variability, we imaged toxin-exposed erythrocytes by phase contrast light microscopy. Conveniently, due to the light-absorbing nature of hemoglobin, erythrocytes appear as black spots when intact and become undetectable when lysed (see Movie S1). It is evident from this assay that not all cells lyse at the same time, even if subjected to the same toxin concentration. The stochastic nature of lysis was particularly striking when placing an aerolysin-soaked bead on a lawn of erythrocytes, to create a toxin concentration gradient emanating from the bead. As expected, the closer the cells were to the toxin source, the faster the lysis occurred (Fig. S2). At a given distance from the bead, the variability in lysis time across individual cells was, however, extremely high.
For a more detailed analysis of lysis at the single-cell level, we plotted the change in contrast of single erythrocytes as a function of time (Fig. 1 A; Movie S1). Three phases could be distinguished (Fig. 1 B): a lag phase with no change; a gradual decrease in contrast; and a final quasi-instantaneous increase. To unambiguously determine what these phases represent, aerolysin-treated erythrocytes were analyzed by digital holographic microscopy, a method that allows the direct monitoring of cell shape changes (13) (Fig. S3). Initially, cells had their typical biconcave shape (yellow phase in Fig. 1 B). During the following phase, cells underwent rounding, as expected upon osmotic swelling after formation of the first pores (Fig. S3 C and orange phase in Fig. 1 B). Finally, the cells lysed, leading to an abrupt change in phase contrast (red phase in Fig. 1 B). This third phase of hemoglobin release is monitored when bulk hemolysis is performed at the population level (Fig. S1 A). In contrast, microscopic analysis using single cells not only allows determining the lysis time, but also the lag time (Tlag) that precedes formation of the first pore. The value Tlag encompasses multiple events: diffusion of soluble monomers toward the erythrocyte membrane, binding to surface receptors, diffusion of the receptor-bound toxin in the two-dimensional membrane surface, possible conformational changes, oligomerization, membrane insertion, and, finally, membrane permeabilization.
Lag timescale with monomer concentration
To quantify the variability in the lag times leading to membrane permeabilization, we next recorded the triphasic light intensity curves for thousands of individual cells in microfluidics chambers (Fig. 1 C). Automatic analysis at different toxin concentrations allowed us to extract lag times Tlag for a large number of cells (n = 787 for aerolysin at 10 ng/mL ≈ 0.2 nM). The value Tlag showed asymmetric right-tailed distributions (skewness > 0.7) at all concentrations tested (Fig. 2). The distributions clearly showed that the rate-limiting step in aerolysin pore formation cannot be a single, one-step transition, because this would lead to exponentially distributed lag times.
Figure 2.

Distributions of pore formation lag times. Histograms of lag times Tlag for different initial concentrations of aerolysin. The distribution of lag times shifts to shorter times and gets narrowed with higher concentrations of aerolysin.
The distributions for Tlag showed a clear concentration-dependence, with a shift toward shorter times as the toxin concentration increased (Fig. 2). The mean 〈Tlag〉 scaled as a power law of the initial toxin concentration c: 〈Tlag〉 = const × c−x with x = 0.67 ± 0.07 (Fig. 3 A). Moreover, the standard deviation (SD) of Tlag scaled with a power law with the same exponent x, so that the SD varied linearly with respect to the mean, across all tested concentrations, with a slope b = 0.4 ± 0.01 (Fig. 3 B). This indicates that the coefficient of variation (CV = b = SD/〈Tlag〉), a measure of the stochasticity of the underlying biochemical process, is independent of initial monomer concentration. Most notably, the distributions for the different concentrations collapsed into a single curve after rescaling the times by the concentration-dependent means, indicating that not only the mean and SD scaled with concentration, but so did the full distributions (Fig. 3 C). Such a scaling strongly constrains the underlying pore formation process. Importantly, it indicates that the rates of all reactions underlying the pore formation process must follow the same dependence on the monomer concentration.
Figure 3.

Scaling properties of lag times with monomer concentration. (A) Scaling of the average pore formation time 〈Tlag〉 as a power law in function of the initial aerolysin concentration. (Inset) Double logarithmic plot. The fitted slope is a = 0.67 ± 0.07. (B) Linear scaling of the SD of Tlag in function of the average of 〈Tlag〉. The fitted slope b = 0.4 ± 0.01 represents the coefficient of variation (CV = SD/〈Tlag〉) of the lag times Tlag and is independent of the concentration. (C) Cumulative distributions for different aerolysin concentrations collapse after being rescaled with a concentration-dependent power law.
Kinetics of aerolysin pore formation
A simple yet quite general kinetic model that satisfies the scaling constraint is a sequential process of N independent and irreversible reactions that need to occur to produce a functional pore. When the rates of the individual reactions are taken as ki(c) = ai cx (the index i denotes the ith reaction), the corresponding reaction times for that step are distributed exponentially with mean 1/ki(c). Hence, given N reaction steps, the distribution of lag times Tlag represents the convolution of N exponential distributions, which is a particular case of the phase-type distribution (Materials and Methods).
To determine the minimal number of underlying reaction steps N that best explain the overall pore formation process, as well as their rate constants, we calculated a likelihood function as the probability that the measured and rescaled lag times, Tlag, were drawn from a phase-type distribution as introduced above (Materials and Methods). Because the number of reactions N is not known, we used the BIC, which explicitly penalizes the model complexity and hence controls for overfitting (Materials and Methods). The lowest BIC score, and thus most favorable model, was obtained for N = 8 (Fig. 4 A, blue line), which indicates that eight rate-limiting reactions are required to form a pore.
Figure 4.

(A) 7eq+1 reaction model is selected as the most parsimonious model. (A) BIC scores of models with reactions of different rates (blue) or with n reactions of equal rates plus an additional reaction (red dots). (B) Posterior mean reaction times (bars) and posterior standard deviation (error bars) of a model with N = 8 different reactions computed via MCMC sampling. (Dashed line) Fitted reaction times of a 7eq+1 reaction model. (C) Fit of a 7eq+1 reaction model (dashed line) to the rescaled pore formation lag times.
Next, to obtain estimates and errors for the eight reaction rate constants, we calculated the posterior distribution over the rates using the Bayes theorem and the likelihood function, which we then sampled using a MCMC algorithm. Remarkably, we found that one slow reaction represented 29 ± 2% of the average lag time 〈Tlag〉 while the other seven reactions represented ∼10% each (the largest and smallest values being 13 ± 3% and 8 ± 3%, respectively; see Fig. 4 B). The rate constants of these seven fast reactions were not significantly different (p-value = 0.12 between the largest and the smallest values according to a two-sample Z-test; Fig. 4 B), which suggests that the same reaction had to occur seven times to form a pore. To strengthen this hypothesis statistically, we computed the BIC score of a reduced model consisting of seven equal fast steps plus an additional slow step (this model is termed the “7eq+1” model), which was clearly favored over the model with N different reactions (red dot in Fig. 4 A). The corresponding fit to the 7eq+1 model gives a slow reaction that accounts for 30 ± 1% of 〈Tlag〉 and seven fast reactions that account for 10 ± 0.2% each (dashed line in Fig. 4 B). The result of the fitting is shown on the rescaled distributions in Fig. 4 C (dotted line). To gain further confidence that our inference procedure can identify the proper model, we tested it on simulated lag times (n = 5000) drawn from a 7eq+1 reaction model. The model was rightly inferred using the BIC score (see Fig. S4 A). Furthermore, the reaction rates were also correctly estimated (see Fig. S4, B and C).
Hence, only four parameters are sufficient to accurately capture the entire data set comprised of ∼5000 measurements of lag times (see Fig. S5). Two of these parameters describe the rescaled distribution of lag times, namely the number of reactions N = 8 and the partition of the mean lag time between the seven equal reactions and the additional slow reaction (70–30%). The two other parameters specify the mean lag time 〈Tlag〉 as a function of the initial concentration c, namely the constant a and the exponent x.
Pore formation times in nucleated cells
To test whether the distribution of Tlag described above is specific to erythrocytes or is independent of cell type, we analyzed aerolysin pore formation kinetics in nucleated HeLa cells. Because phase contrast microscopy could not be used for this cell type, we followed the influx of calcium, which has previously been shown to occur after pore formation by aerolysin (17, 18). HeLa cells were loaded with a calcium-sensitive fluorescent dye and changes in fluorescence were monitored by live microscopy as a function of time. The changes in fluorescence intensities at the single-cell level showed a lag time after toxin addition and then a steep increase in intracellular calcium (Figs. S6, A and B, and S7), which was not observed with the aerolysin mutant Y221G that is unable to form pores (Fig. S6 B) (12). We again performed experiments at different aerolysin concentrations allowing us to determine the lag times until pore formation Tlag for each cell (Fig. S6 C). As for erythrocytes, the SD in Tlag varied linearly with respect to the mean across all tested concentrations, with a slope b = 0.35 ± 0.02 (Fig. S6 D). Similar to the erythrocytes, the estimated number of limiting reactions was N = 8 (Fig. S6, E and F). This set of experiments shows that irrespective of the cell type used, the number of rate-limiting steps necessary to explain aerolysin pore formation was eight. We also compared the scaling of Tlag on erythrocytes and Hela cells and found exponents of x = 0.78 ± 0.1 for HeLa cells and x = 0.67 ± 0.07 for erythrocytes (Figs. 3 A and S6 C). Taken together, the number of reactions N and the exponent x for aerolysin are independent of the cell type or the method used to determine them (phase contrast microscopy or calcium imaging), suggesting that the mechanisms leading to pore formation are similar across cell types.
Role of the C-terminal peptide of aerolysin
The kinetic analysis of pore formation by aerolysin revealed that the process requires a minimum of seven limiting equal steps plus one additional slow step. Previous studies demonstrated that binding of proaerolysin or aerolysin to its receptor and diffusion of these lipid-anchored molecules at the cell surface are not limiting (19, 20). We have, however, shown that after proteolytic processing of proaerolysin, the CTP is not released as a consequence of proteolysis (11) as was previously thought (21). Importantly, we found that excess CTP inhibits oligomerization, indicating that CTP release is required for heptamerization (11) consistent with it being absent from the aerolysin heptamer (22). These observations led us to speculate that the release of the CTP, within each monomer, could be the limiting step. If the seven equal steps indeed correspond to CTP release at the monomer level, the prediction would be that the addition of excess synthetic CTP should lower the rate without markedly altering the number of reactions. In contrast, artificial removal of the CTP should bypass the seven limiting steps and revealing the next limiting steps in the overall pore formation process.
To test this hypothesis we repeated the single-cell hemolysis assay in the presence of excess synthetic CTP. Consistent with our hypothesis, the lag times were increased: the average Tlag for 10 ng/mL aerolysin increased from of 1026 ± 407 s under control conditions, to 1668 ± 607 s (p < 0.0001) in the presence of excess CTP (Fig. 5 A). Also, the minimum number of steps required to explain the process remained eight (seven equal steps plus one slow step; Fig. 5 C, red dot).
Figure 5.

Influence of the aerolysin CTP on Tlag distributions. (A) Box plots for single erythrocytes treated with 10 ng/mL of aerolysin in the absence (top), presence of 100× excess free CTP (middle), or with the CTP-free aerolysin mutant (bottom). (B–D) For the same conditions as in (A), BIC scores of models (left panels) with reactions of different rates (blue) or with n reactions of equal rates plus an additional reaction (red dots). Rescaled pore formation lag times Tlag (right panels) with fits to a 7eq+1 model or a model with N = 2 different reactions (dashed lines).
To generate aerolysin devoid of CTP, we made use of a proaerolysin mutant carrying a single point mutation in the CTP, S453P. We have previously shown that upon proteolytic cleavage, the CTP, which carries the mutation, is released from the mature protein (11). The single-cell assay was performed with thus-generated CTP-free toxin at different concentrations. Again consistent with our hypothesis, the rescaled Tlag distribution profile was significantly different from that obtained under control conditions (Fig. 5, B and D). The average Tlag for 10 ng/mL CTP-free aerolysin slightly but significantly (p < 0.001) decreased to 927 ± 351 s (Fig. 5 A). More importantly, the probabilistic analysis revealed that the number of limiting steps N dropped from eight to two (Fig. 5 D).
Identifying the two steps that become limiting once the CTP has been removed will require further investigation. However, we cannot exclude that some contaminating CTP remains present in the sample and could affect the observed kinetics. The low number of limiting steps, however, indicates that they no longer occur at the monomer level, but probably later. These steps could represent the completion of the heptamer and/or membrane insertion of the complex. In fact, this last step was found to be limiting for other PFTs, such as α-hemolysin from Staphylococcus aureus (23). Interestingly, a requirement for the conversion of monomers to oligomerization-competent protomers has also been proposed for other PFTs, such as S. aureus α-hemolysin (24), Clostridium perfringens PFO (25), and E. coli ClyA (26).
Conclusions
In summary, we developed a live microscopy assay using microfluidics to monitor pore formation on a large number of single erythrocytes over a broad range of toxin concentrations. Three distinct phases could be extracted from the single-cell light intensity curves. The most informative parameter was Tlag, the lag time separating toxin addition from the initiation of erythrocyte swelling, the distribution of which was analyzed using mathematical modeling. Using this approach, we found that Tlag could be accurately explained by seven independent reactions with equal rates plus an additional slow reaction. Using aerolysin devoid of its bound C-terminal peptide, we could reveal that the seven equal reactions correspond to the release of the CTP in each of the seven monomers, before heptamerization. Our approach thus enabled us to identify the limiting step in the aerolysin pore formation process. Many PFTs, however, are not produced as protoxin; for example, S. aureus α-hemolysin. In this case, diffusion of monomers was found to be the limiting step, as observed by single-molecule tracking and Monte Carlo simulations (24). Our study, however, has not addressed how the seven monomers assemble. Using single-molecule spectroscopy, it was recently observed that assembly of the dodecameric ClyA pores does not occur by sequential addition of monomers but through the combinatorial assembly of various oligomeric intermediates (26). Similarly, assembly of S. aureus γ-hemolysin hexamers was found to occur preferentially through the association of dimers or trimers (27). In contrast, assembly of α-hemolysin heptamers were proposed to assemble through the sequential addition of monomers (24). This proposed approach is highly dynamic and applicable to any PFT without labeling, and should prove useful to compare toxins of different structures and different pore stoichiometries.
Author Contributions
M.B., N.M., F.N., and F.G.v.d.G. designed the study, performed research, and wrote the article; and I.I. and D.B. contributed methods and experiments.
Acknowledgments
We thank Pierre Magistretti, Pierre Marquet, and Jonas Kühn for the DHM microscopy and Sylvia Ho for purifying aerolysin.
M.B. was funded by SystemsX.ch iPhD grant No. 2008/045 to F.G.v.d.G. and F.N.; F.G.v.d.G. was supported by the Swiss National Science Foundation; N.M. and F.N. were supported by the European Research Council grant No. ERC-2010-StG-260667; and N.M. was supported by the Chancellor’s Fellowships granted by the University of Edinburgh.
Editor: Hagan Bayley.
Footnotes
Seven figures and one movie are available at http://www.biophysj.org/biophysj/supplemental/S0006-3495(16)30036-4.
Contributor Information
F. Gisou van der Goot, Email: gisou.vandergoot@epfl.ch.
Nacho Molina, Email: nacho.molina@ed.ac.uk.
Supporting Material
References
- 1.Minton A.P. Implications of macromolecular crowding for protein assembly. Curr. Opin. Struct. Biol. 2000;10:34–39. doi: 10.1016/s0959-440x(99)00045-7. [DOI] [PubMed] [Google Scholar]
- 2.Morris A.M., Watzky M.A., Finke R.G. Protein aggregation kinetics, mechanism, and curve-fitting: a review of the literature. Biochim. Biophys. Acta. 2009;1794:375–397. doi: 10.1016/j.bbapap.2008.10.016. [DOI] [PubMed] [Google Scholar]
- 3.Karsenti E., Nédélec F., Surrey T. Modelling microtubule patterns. Nat. Cell Biol. 2006;8:1204–1211. doi: 10.1038/ncb1498. [DOI] [PubMed] [Google Scholar]
- 4.Bischofberger M., Gonzalez M.R., van der Goot F.G. Membrane injury by pore-forming proteins. Curr. Opin. Cell Biol. 2009;21:589–595. doi: 10.1016/j.ceb.2009.04.003. [DOI] [PubMed] [Google Scholar]
- 5.Iacovache I., van der Goot F.G., Pernot L. Pore formation: an ancient yet complex form of attack. Biochim. Biophys. Acta. 2008;1778:1611–1623. doi: 10.1016/j.bbamem.2008.01.026. [DOI] [PubMed] [Google Scholar]
- 6.Floyd D.L., Ragains J.R., van Oijen A.M. Single-particle kinetics of influenza virus membrane fusion. Proc. Natl. Acad. Sci. USA. 2008;105:15382–15387. doi: 10.1073/pnas.0807771105. [DOI] [PMC free article] [PubMed] [Google Scholar]
- 7.van der Goot F.G., Lakey J.H., Pattus F. The molten globule intermediate for protein insertion or translocation through membranes. Trends Cell Biol. 1992;2:343–348. [PubMed] [Google Scholar]
- 8.Abrami L., Fivaz M., van der Goot F.G. Adventures of a pore-forming toxin at the target cell surface. Trends Microbiol. 2000;8:168–172. doi: 10.1016/s0966-842x(00)01722-4. [DOI] [PubMed] [Google Scholar]
- 9.Buckley J.T. Purification of cloned proaerolysin released by a low protease mutant of Aeromonas salmonicida. Biochem. Cell Biol. 1990;68:221–224. doi: 10.1139/o90-029. [DOI] [PubMed] [Google Scholar]
- 10.Heuck A.P., Hotze E.M., Johnson A.E. Mechanism of membrane insertion of a multimeric β-barrel protein: perfringolysin O creates a pore using ordered and coupled conformational changes. Mol. Cell. 2000;6:1233–1242. doi: 10.1016/s1097-2765(00)00119-2. [DOI] [PubMed] [Google Scholar]
- 11.Iacovache I., Degiacomi M.T., van der Goot F.G. Dual chaperone role of the C-terminal propeptide in folding and oligomerization of the pore-forming toxin aerolysin. PLoS Pathog. 2011;7:e1002135. doi: 10.1371/journal.ppat.1002135. [DOI] [PMC free article] [PubMed] [Google Scholar]
- 12.Tsitrin Y., Morton C.J., van der Goot F.G. Conversion of a transmembrane to a water-soluble protein complex by a single point mutation. Nat. Struct. Biol. 2002;9:729–733. doi: 10.1038/nsb839. [DOI] [PubMed] [Google Scholar]
- 13.Marquet P., Rappaz B., Depeursinge C. Digital holographic microscopy: a noninvasive contrast imaging technique allowing quantitative visualization of living cells with subwavelength axial accuracy. Opt. Lett. 2005;30:468–470. doi: 10.1364/ol.30.000468. [DOI] [PubMed] [Google Scholar]
- 14.Kass R.E., Raftery A.E. Bayes factors. J. Am. Stat. Assoc. 1995;90:773–795. [Google Scholar]
- 15.van der Goot F. Springer; Berlin, Germany: 2001. Pore-Forming Toxins. [Google Scholar]
- 16.Buckley J.T., Wilmsen H.U., van der Goot F.G. Protonation of histidine-132 promotes oligomerization of the channel-forming toxin aerolysin. Biochemistry. 1995;34:16450–16455. doi: 10.1021/bi00050a028. [DOI] [PubMed] [Google Scholar]
- 17.Krause K.H., Fivaz M., van der Goot F.G. Aerolysin induces G-protein activation and Ca2+ release from intracellular stores in human granulocytes. J. Biol. Chem. 1998;273:18122–18129. doi: 10.1074/jbc.273.29.18122. [DOI] [PubMed] [Google Scholar]
- 18.Tschödrich-Rotter M., Kubitscheck U., Peters R. Optical single-channel analysis of the aerolysin pore in erythrocyte membranes. Biophys. J. 1996;70:723–732. doi: 10.1016/S0006-3495(96)79612-1. [DOI] [PMC free article] [PubMed] [Google Scholar]
- 19.MacKenzie C.R., Hirama T., Buckley J.T. Analysis of receptor binding by the channel-forming toxin aerolysin using surface plasmon resonance. J. Biol. Chem. 1999;274:22604–22609. doi: 10.1074/jbc.274.32.22604. [DOI] [PubMed] [Google Scholar]
- 20.Abrami L., van Der Goot F.G. Plasma membrane microdomains act as concentration platforms to facilitate intoxication by aerolysin. J. Cell Biol. 1999;147:175–184. doi: 10.1083/jcb.147.1.175. [DOI] [PMC free article] [PubMed] [Google Scholar]
- 21.van der Goot F.G., Hardie K.R., Buckley J.T. The C-terminal peptide produced upon proteolytic activation of the cytolytic toxin aerolysin is not involved in channel formation. J. Biol. Chem. 1994;269:30496–30501. [PubMed] [Google Scholar]
- 22.Degiacomi M.T., Iacovache I., Dal Peraro M. Molecular assembly of the aerolysin pore reveals a swirling membrane-insertion mechanism. Nat. Chem. Biol. 2013;9:623–629. doi: 10.1038/nchembio.1312. [DOI] [PubMed] [Google Scholar]
- 23.Walker B., Braha O., Bayley H. An intermediate in the assembly of a pore-forming protein trapped with a genetically engineered switch. Chem. Biol. 1995;2:99–105. doi: 10.1016/1074-5521(95)90282-1. [DOI] [PubMed] [Google Scholar]
- 24.Thompson J.R., Cronin B., Wallace M.I. Rapid assembly of a multimeric membrane protein pore. Biophys. J. 2011;101:2679–2683. doi: 10.1016/j.bpj.2011.09.054. [DOI] [PMC free article] [PubMed] [Google Scholar]
- 25.Sato T.K., Tweten R.K., Johnson A.E. Disulfide-bond scanning reveals assembly state and β-strand tilt angle of the PFO β-barrel. Nat. Chem. Biol. 2013;9:383–389. doi: 10.1038/nchembio.1228. [DOI] [PMC free article] [PubMed] [Google Scholar]
- 26.Benke S., Roderer D., Schuler B. The assembly dynamics of the cytolytic pore toxin ClyA. Nat. Commun. 2015;6:6198. doi: 10.1038/ncomms7198. [DOI] [PMC free article] [PubMed] [Google Scholar]
- 27.Nguyen V.T., Kamio Y., Higuchi H. Single-molecule imaging of cooperative assembly of γ-hemolysin on erythrocyte membranes. EMBO J. 2003;22:4968–4979. doi: 10.1093/emboj/cdg498. [DOI] [PMC free article] [PubMed] [Google Scholar]
Associated Data
This section collects any data citations, data availability statements, or supplementary materials included in this article.