

Abstract
Although Huntington's disease is caused by the expansion of a CAG triplet repeat within the context of the 3144-amino acid huntingtin protein (HTT), studies reveal that N-terminal fragments of HTT containing the expanded PolyQ region can be produced by proteolytic processing and/or aberrant splicing. N-terminal HTT fragments are also prevalent in postmortem tissue, and expression of some of these fragments in model organisms can cause pathology. This has led to the hypothesis that N-terminal peptides may be critical modulators of disease pathology, raising the possibility that targeting aberrant splicing or proteolytic processing may present attractive therapeutic targets. However, many factors can contribute to pathology, including genetic background and differential expression of transgenes, in addition to intrinsic differences between fragments and their cellular effects. We have used Drosophila as a model system to determine the relative toxicities of different naturally occurring huntingtin fragments in a system in which genetic background, transgene expression levels and post-translational proteolytic processing can be controlled. These studies reveal that among the naturally occurring N-terminal HTT peptides, the exon 1 peptide is exceptionally pathogenic and exhibits unique structural and biophysical behaviors that do not appear to be incremental changes compared with other fragments. If this proves correct, efforts to specifically reduce the levels of exon 1 peptides or to target toxicity-influencing post-translational modifications that occur with the exon 1 context are likely to have the greatest impact on pathology.
INTRODUCTION
Huntington's disease is caused by the expansion of a polyglutamine (polyQ) domain located after the 17th amino acid (aa) of the ∼3144-aa HTT protein. Several naturally occurring N-terminal fragments of HTT containing this expanded polyglutamine region have been described in both clinical settings and in disease models, including fragments generated by proteolytic processing of HTT, e.g. (1–5), and an exon 1 fragment arising from aberrant splicing of expanded-CAG-repeat HTT (6) (Fig. 1). Several of the proteolytic fragments have been specifically implicated in disease pathogenesis and others have been dismissed as relatively harmless (7), whereas the exon 1 fragment causes highly aggressive pathology in a number of model systems. This raises the possibility that observations made with full-length knock-in models or other long-fragment models in mammals may include contributions from proteolytic fragments or fragments arising from mis-splicing.
Figure 1.

Cartoon of the fragments studied. The top drawing represents full-length huntingtin, with the locations of the C-terminal aas of the various fragments indicated. Fragments terminating at double-underlined numbers have been reported as toxic, single-underlined numbers as nontoxic and non-underlined numbers as unknown. Below, fragment lengths, polyglutamine region (Q120) and proline-rich region (P) are drawn approximately to scale. Numbering scheme is based on huntingtin containing 23 Qs.
Although the behavior of the different fragments in various model systems has been described, a number of factors make comparisons between these studies difficult, including differences between mouse strains, cell lines, transgene copy numbers, chromosomal location, polyQ tract length and the propensity of longer HTT peptides to be naturally processed to smaller fragments. Drosophila, on the other hand, provides an excellent platform to compare the intrinsic toxicity of these fragments because genetic background can be controlled, transgenes can be inserted into a defined chromosomal location and transgenic peptides undergo minimal proteolytic processing.
In this report, we compare the toxicity of seven commonly studied N-terminal HTT fragments in Drosophila, revealing a number of intrinsic as well as extrinsic influences on polyQ pathology. We ask whether expanded polyQ is sufficient to cause cytotoxicity, whether it is sufficient to cause protein inclusions to form and how peptide context influences the pathogenic and biophysical behavior of mutant HTT proteins. We find that, among all of these fragments, the exon 1 peptide is particularly toxic and that it exhibits unique structural and biophysical properties.
RESULTS
Construction of targeted transgenic HTT lines
To compare the behavior and pathogenicity of the various N-terminal HTT fragments, we inserted a set of HTT peptide transgenes into the same chromosomal location and in the same orientation in a common inbred host Drosophila line using the phiC31-targeted insertion system (8) (Fig. 1). These fragments have been assigned numbers representing their C-terminal aa based on a huntingtin molecule containing 23 glutamines. Each of the fragments has been engineered to contain 120 or 25 Qs, such that the actual number of aas in the fragment can be determined by adding 97 to its index number for the expanded constructs (or 3 for the unexpanded constructs) [e.g. the 90ex1 120Q fragment has 187 aas (22.5 kDa)].
Fragment descriptions
The 90 fragment represents exon 1, which has been widely used in the R6/2 mouse (9), in Drosophila (10–12) and various cell lines (1,2,4,13). It has recently been shown that the exon 1 fragment arises because of aberrant splicing precipitated by the expanded CAG repeat (6) and exon-1-like fragments have been found in HD patient material (6,14,15).
Fragments arising from naturally occurring proteolytic events include the 108, 469, 513, 536, 552 and 586 fragments. The 108 ‘cp-A’ fragment represents the product of an endogenous aspartic endopeptidase that cleaves between aa 104 and 114 of HTT and has been observed in neuronal inclusions of HD patient material and in NG108 cells (2). The 469 and 536 fragments are produced by calpain cleavage in a polyQ-length-dependent manner in mouse brain and HEK 293T cells (1,16), and in human brain tissues (17), but the toxicity of these fragments has not been extensively described. The 513, 552 and 586 fragments are produced by caspase cleavage of a 1220-aa HTT fragment expressed in the brains of transgenic mice (7) and in cell lines including ST14A (4), HEK 293T (1,4), COS (18) and HN33 (4) cells, although production of these fragments was not observed in the HdhQ150 knock-in mouse model suggesting that this may not be a general effect (19).
Characterization of transgenic lines
To verify that the targeted inserts are expressed similarly, levels of mRNA were verified using quantitative RT-PCR and primers that are common to all fragments. The levels of expression of all transgenes fall within one PCR cycle and are statistically indistinguishable from one another (Supplementary Material, Fig. S1).
The proteolytic processing events of HTT seen in mammalian cells pose a challenge to isolating the effects of particular HTT fragments in mammalian systems, because it is difficult to prevent further processing of fragments without modifying the fragments themselves. To address this potential complication, we tested whether human HTT fragments are further processed in Drosophila by western blotting. Processing of longer fragments into shorter versions is not observed in Drosophila (Supplementary Material, Fig. S2) although we cannot exclude minor processing events undetectable by western blotting or that do not result in discrete smaller fragments. Similar observations have been reported by Weiss et al. (20).
Using the GAL4/UAS transgene system to express HTT fragments allows the level of expression to be controlled by raising flies at increasing temperatures (21) and the pattern of expression to be controlled by the GAL4 driver chosen (e.g. the elav>GAL4 driver expresses in all neurons and the da>GAL4 driver expresses ubiquitously).
In this study, we examine four measures of pathology and four measures of biochemical properties. For pathology, we measure survival to adulthood, degeneration of neurons, motor function and longevity. As extensively documented in the literature, we find that expanded polyQ is necessary for all of these pathogenic indicators. Unexpanded HTT peptides with 25 Qs exhibit no phenotypes in any of the assays used and behave the same as non-transgenic controls. For biophysical properties, we compared the fragments by PAGE electrophoresis, high-resolution microscopy, amyloid seeding and TR-FRET.
Comparative pathology when neurons are challenged with HTT fragments
We initially compared the pathogenic potential of the different fragments when expressed only in neurons at 22.5°C under the control of elav>GAL4. Under these conditions, the only expanded polyQ fragment capable of inhibiting eclosion is 90ex1 120Q (Fig. 2A). All other fragments show eclosion rates similar to the non-transgenic and unexpanded 90ex1 25Q controls. Thus, the expanded polyQ 90ex1 120Q fragment stands out under these conditions as the most toxic with respect to survival to adulthood.
Figure 2.

Comparative pathology of mHTT fragments when expressed in neurons only. HTT-expressing female CyO progeny of the cross of elav-GAL4/Y; Sp/CyO males with homozygous UAS-HTT fragment virgins raised at 22.5°C were compared with their non-expressing brothers for (A) eclosion (survival to adulthood). Under these conditions, the only statistical reduction in eclosion is seen with the 90ex1 120Q fragment. Eclosion rates are shown as the ratio of elav-driven females/non-driven sibling males. (B) Neurodegeneration in surviving HTT-expressing progeny of the crosses above was evaluated by counting the number of remaining photoreceptor cells (rhabdomeres) in each ommatidium (shown in E). Eyes were evaluated at 3 days post-eclosion because the 90-expressing flies die young (half-life of ∼6.5 days), making neurodegeneration difficult to evaluate at later time points. However, flies expressing other HTT fragments have been evaluated at 7 days and later time points up to 40 days and have never displayed an eye phenotype at any age. (C) Motor function was evaluated by measuring climbing speed at 10 days post-eclosion. The ratio of the climbing speed of expressing versus non-expressing flies is determined by taking the average distance traveled between seconds 2 and 3 after being tapped to the bottom of a vial. The climbing speeds of the 469–586 flies are not statistically different from one another but are different than the 108- and 90-expressing flies, and P < 0.001 for 90 versus all others. (D) Flies expressing elav-GAL4-driven 90ex1 25Q live as long as wild-type, whereas flies expressing 90ex1 120Q live less than 1/10 as long. The life spans of the 469–586-expressing flies are not different from one another but are reduced compared with non-transgenic and unexpanded 90ex1 25Q-expressing flies. This is the most robust display of pathology exhibited by the caspase and calpain fragments. The 108-expressing flies have a life span intermediate between the 90 and the caspase/calpain-fragment-expressing flies. (E) 90ex1 120Q-expressing flies show significant reduction in the number of rhabdomeres (a reflection of photoreceptor neurons) compared with the eyes of unexpanded 90ex1 25Q-expressing flies.
Another measure of pathology is overt degeneration of photoreceptor neurons. When HTT fragments are expressed in neurons using the elav>GAL4 driver at 25°, the 90ex1 120Q fragment produces clear degeneration of neurons as revealed by the reduced number of rhabdomeres in the ommatidia of the adult eye (Fig. 2B and E) (22,23). In contrast, none of the other fragments exhibit retinal degeneration even when the transgenes are expressed at high levels by rearing at 29° (not shown). Pathology is not merely delayed, as none of the other fragments give any evidence of photoreceptor degeneration even when examined many days past the time when the 90ex1 120Q-expressing flies have died, in some cases as late as 20 days and even 40 days after eclosion, or when examined right before their death. Thus, at this level of analysis, the 90ex1 120Q fragment exhibits a unique pathogenic potential. The failure of all other fragments to exhibit overt neurodegeneration compels the conclusion that expanded polyQ alone is not sufficient to elicit overt neuronal degeneration and that the toxicity of some polyQ-containing fragments is qualitatively distinct from that of the others.
Although overt neuronal loss is a hallmark of HD, deficits can also be due to compromised functioning of neurons. As a measure of neuronal function, we monitored loss of climbing ability when transgenes are expressed in neurons. At 10 days post-eclosion, surviving 90ex1 120Q-expressing flies are almost completely unable to climb, whereas 108-expressing flies exhibit ∼50% decline, and flies expressing other expanded fragments exhibit ∼10–20% decline in motor function compared with unexpanded-HTT-expressing controls (Fig. 2C).
A fourth hallmark of HTT pathology is reduced longevity. For example, when expressed in neurons, the t1/2 of control flies expressing 90ex1 25Q is ∼70 days whereas that of 90ex1 120Q-expressing flies is ∼7 days and 108-expressing flies is ∼19 days. The half-lives of flies expressing the caspase and calpain fragments (469–586), although reduced compared with controls (i.e. 27–32 versus 70 days), are significantly longer than either the 90 or 108 fragments, but not different from one another (Fig. 2D). Thus, the effects of the 90ex1 120Q and, to a lesser extent, the 108 fragments are notably the most severe.
Incremental versus qualitative differences in pathology
To assess whether the apparent difference between 90ex1 120Q and other fragments is due to incremental differences in level of toxicity or is due to qualitative differences in toxicity, we evaluated the pathology at different levels of transgene expression and at different times in the course of disease progression.
In man, HTT is expressed ubiquitously. When expressed ubiquitously in Drosophila by the da>GAL4 driver at 22.5°, no survival is seen with either the 90ex1 120Q or the 108 fragments, but flies expressing all other fragments survive to adulthood at a level between 60 and 90% of control (Fig. 3A). Similar results are observed with the actin>GAL4 driver at 25° (another commonly used ubiquitous driver), where the 90ex1 120Q and 108 fragments are completely lethal, whereas flies expressing all of the other fragments survive to adulthood at near normal levels (not shown). Pathology of 90ex1 120Q is the most severe, as indicated by the fact that animals expressing the 90 fragment die as larvae, whereas the 108-expressing larvae usually survive until pupariation. Although the caspase and calpain fragments (469, 513, 536, 552 and 586) can be driven to intermediate levels of toxicity as expression levels are increased (e.g. at 25°C), and to almost complete lethality at 29° (Fig. 3A), the 90ex1 120Q and 108 fragments stand out as not showing any survival even at the lowest levels of expression (e.g. both are lethal even at 18°—not shown) suggesting they are either incrementally much more toxic than any of the other fragments or that they are fundamentally different in their toxicity.
Figure 3.
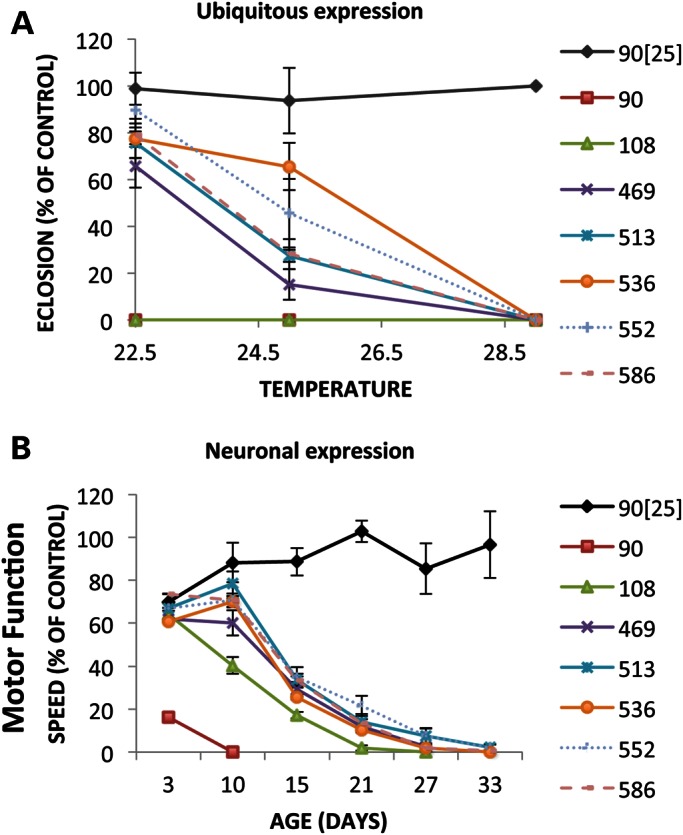
The effect of ubiquitous transgene expression level on pathology. (A) The impact on eclosion of increasing the levels of transgene expression on eclosion using a ubiquitously expressed driver (da-GAL4) was evaluated by rearing crosses at different temperatures and determining the fraction of flies eclosing. The parental cross in each case was w/Y; FRAGMENT/+ males X w; da-GAL4 homozygous virgins. Progeny bearing HTT fragment transgenes were identified by the presence of the mini w+ marker associated with the transgene vector. The eclosion of w; FRAGMENT/+; Da-GAL4/+ females compared with w; +; Da-GAL4/+ female control siblings is plotted. Experiments were performed in quadruplicate. Similar results were obtained with the male progeny (not shown). Levels of transgene expression vary with temperature with higher temperatures producing more expression than lower temperatures (∼2 fold between 22.5°C and 29°C (48). Regardless of the temperature, no impact on eclosion is observed with the unexpanded 90ex1 25Q controls. In contrast, the caspase/calpain fragments (469–586) are mostly viable at 22.5° but can be driven to lethality by increasing the temperature to 29°C. Flies expressing the 90 and 108 fragments, on the other hand, do not eclose at any temperature, including 18°C (not shown). (B) Progressive loss of motor function with neuronally expressed HTT fragments. The climbing speed of HTT fragment-expressing elav-GAL4/w; FRAGMENT/CyO females compared with control w/Y; UAS-FRAGMENT/CyO sibling males is plotted as a function of age. At 3 days post-eclosion, the climbing ability of all of the fragment-expressing flies is the same as unexpanded-90-expressing controls (90ex1 25Q) except flies expressing 90ex1 120Q, which already show a significant impairment. By 10 days, the 108-expressing flies have lost significant climbing ability compared with the rest (P < 0.01), and as time progresses even the caspase and calpain-fragment-expressing flies lose significant climbing ability compared with controls.
To titrate the impact of different fragments on loss of neuronal function, we monitored the progressive loss of climbing ability as animals expressing transgenes in their neurons age. By 3 days post-eclosion, 90ex1 120Q-expressing animals exhibit severe climbing impairment whereas all others are indistinguishable from unexpanded and non-transgenic controls (Fig. 3B). By 10 days, surviving 90ex1 120Q-expressing flies are almost completely unable to climb whereas the 108-expressing flies exhibit significant impairment (P < 0.05) compared with flies expressing the caspase and calpain fragments that have just begun to exhibit a decline in motor function (Fig. 3B). Only after 15 days does one begin to observe a clear decline in motor function in flies expressing the longer fragments. The caspase and calpain fragments are indistinguishable from each other, exhibiting a relatively delayed decline in climbing behavior (Fig. 3B). Thus, expanded polyQ is sufficient to cause an accelerated decline in motor neuron function, but the peptide context in which the 120 Qs are embedded significantly affects the severity of the polyQs impact.
The 90ex1 120Q fragment stands out as distinctly severe in its pathogenic effects compared with all of the other fragments. Although some reduction in motor function, survival and longevity can be achieved with other fragments at higher levels of expression, suggesting incremental, albeit large, differences in pathogenic potential, the failure of any other fragment to cause overt degeneration of neurons raises the possibility of distinct mechanisms of pathology, with 90ex1 120Q potentially having a unique ability to affect neuronal survival.
PHYSICAL PROPERTIES OF HTT FRAGMENTS
Differences in fragment behaviors are presumed to be due to different physical properties of the fragments, be they intrinsic differences to adopt particular conformations or extrinsic ability to interact with distinct cellular components. To evaluate the extrinsic effects of the fragments' interactions with the misfolded protein machinery, we compared the kinetics of their accumulation and clearance. To compare the intrinsic properties of the different fragments, we evaluated their propensity to form aggregates, the nature and location of aggregates formed and their ability to seed the formation of amyloid aggregates. Throughout this analysis, we consider three states of the HTT peptide: monomers, oligomers and microscopically visible inclusions.
Kinetics of accumulation and clearance
To determine whether different propensities to form inclusions and/or cause pathology are due to differences in rates of protein accumulation and/or clearance, we used quantitative western blotting to determine the steady-state levels and clearance rates of the different fragments. These studies employed a chromosome containing both da-GAL4 and the inhibitory transgene tub-GAL80ts. Tub-GAL80ts is a uniformly expressed temperature-sensitive GAL80 transgene, which suppresses transcription driven by the da-GAL4 driver at 18° but is inactive at 29° allowing expression of UAS>HTT transgenes [Fig. 4A, uninduced versus (4D) induced panel]. Animals were reared at 18°, and eclosed adults were shifted to 29° to induce HTT fragment expression. Samples were taken daily and analyzed by western blotting. Accumulation of soluble HTT is evident after 1 day, typically peaking at ∼3 days, and in most cases beginning to decline by the 4th day (Fig. 4B). At 4 days post-induction, robust levels of soluble monomeric species have accumulated in the caspase and calpain lanes, with lower levels of monomeric peptides evident in the 108 and 90 lanes (Fig. 4A). The lower levels of soluble 108 and 90 species correlate with the tendency to form microscopically visible inclusions, which deplete the levels of soluble monomeric species [e.g. see (24)]. Also notable are smears of insoluble material in the stacking gel for all lanes (Fig. 4A) that do not appear until HTT transgene expression has been induced [e.g. compare Fig. 4A uninduced with (4D) induced]. These presumably represent the presence of insoluble species. Although all fragments exhibit these smears, only the 90 and 108 fragments form microscopically visible inclusions and amyloids, suggesting that the smears in the 469–586 lanes represent intermediate insoluble oligomeric species as have been observed in other studies (24–26). If this is correct, it suggests that oligomerization potential alone may not be sufficient to generate inclusions. It is notable that total mHTT load is not the primary driver of toxicity as the caspase and calpain fragments accumulate to higher levels than 90ex1 120Q and yet are relatively nontoxic. It is also worth noting that the 90ex1 120Q fragment is unique in running at an aberrant molecular weight. All HTT fragments with expanded polyQ run more slowly than their computed MW, but smaller fragments still run faster than larger ones. The 90ex1 120Q fragment uniquely violates this trend and runs even more slowly than larger fragments (e.g. 108), suggesting that 90ex1 120Q forms a unique SDS-resistant structural conformation that retards its migration compared with other expanded-polyQ-containing fragments (Fig. 4A).
Figure 4.
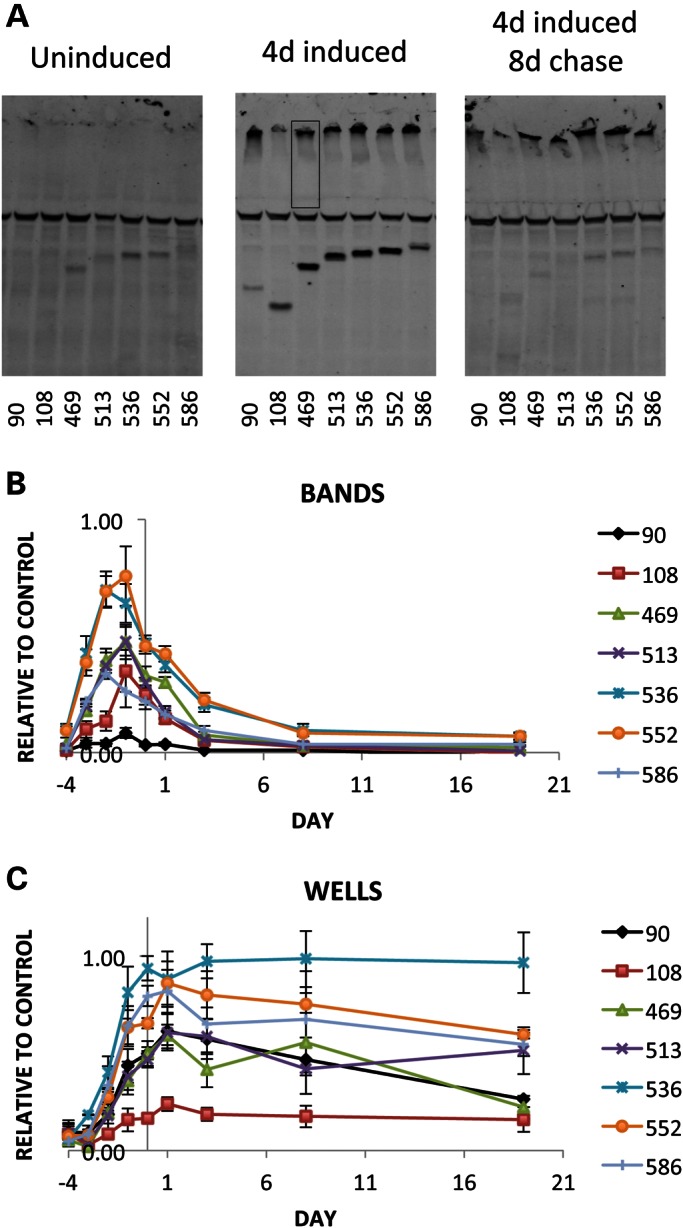
Measurement of fragment accumulation and degradation. Parental crosses were Y/w; UAS-FRAGMENT males X w; +; tub-GAL80ts da-GAL4 virgins. Ubiquitously expressed GAL80ts suppresses GAL4-driven expression until the temperature is raised. Levels of expression were determined by quantitative western blotting using a using a LiCor Odyssey scanner. The color image has been converted to black and white here. HTT fragments were detected by green fluorescence and beta-tubulin used as a loading control (the middle band in all lanes) fluoresced red. (A) Representative westerns of GAL80-suppressed adult males at 18°C before induction, after 4 days of induction at 29°C and 8 days post-induction (at 18°C). Note the appearance of discrete monomers followed by the loss of the monomeric signal but note also the persistence of the insoluble smear in and below the wells. (B) Quantification of the level of soluble HTT material in bands. Vertical line at Day 0 marks the end of induction (i.e. 4 days after shifting flies to 29°C). (C) Quantification of high-molecular-weight and insoluble species. The insoluble material that forms a smear in the wells and stacking gel was quantified (wells) by measuring all the signal in a region (indicated by the box in the middle panel). Vertical line at 0 marks the end of induction. Each data point represents the average and SEM of 3 to 5 biologically independent western blots. Values were normalized to a positive control signal from a homogenate of da-GAL4-driven 536-expressing larvae (not shown). The decay rate for soluble signal for all fragments is a t1/2 of ∼ 2 days. The insoluble material is remarkably stable, remaining virtually unchanged over 3 weeks or more.
To monitor clearance, we shifted animals to 18°C after 4 days to prevent further expression of HTT fragments and monitored the levels of protein over the next 20 days. The half-lives of the soluble species of all fragments are remarkably similar, with a t1/2 of ∼2 days (Fig. 4B). In stark contrast to the soluble material, the insoluble material in the stacking gel remains relatively unchanged over the course of ∼20 days (Fig. 4C). In some cases, there is a tendency for a small increase in the first 2 days that presumably reflects some of the remaining monomeric species being incorporated into insoluble species, but for at least the next 20 days, the levels of insoluble material remain relatively unchanged. This suggests that SDS-insoluble species from all fragments are not being well cleared and are relatively long-lived. Thus, different rates of clearance and different levels of steady-state accumulation do not readily explain the differences in pathology.
Is expanded polyQ sufficient for inclusion formation?
We next evaluated the intrinsic aggregation potential of the various fragments using immunohistochemistry in the eye imaginal disc, which provides a temporal gradient of neurons expressing HTT transgenes. In the eye disc, a wave of differentiation defined by the morphogenetic furrow (MF) passes over a field of ∼30 000 uncommitted cells from posterior (P) toward anterior (A) (arrow and MF in 5A). As the wave passes, cells begin to differentiate as neurons and elav expression begins (red stain in Fig. 5A), as does elav>GAL4 and HTT transgene expression (Fig. 5A and B, green). Each row of cells counting from the leading edge of the furrow toward posterior has been expressing the HTT transgene for ∼2 h longer than the one in front of it. As frequently reported, expression of unexpanded polyQ HTT exon 1 (e.g. 25 Qs) leads to diffuse staining whereas expression of HTT exon 1 with expanded polyQ (e.g. 120 Qs) leads to punctate aggregates (Fig. 5A and Supplementary Material, S3) (27–29). Thus, expanded polyQ is necessary for inclusion formation—but is it sufficient?
Figure 5.

Different patterns of protein aggregation and accumulation revealed in eye imaginal discs. (A) elav-GAL4-driven 90ex1 120Q forms aggregates in an eye disc. Eye discs dissected from elav-GAL4/(w or Y); UAS-90/+larvae, reared at 25°C were probed with anti-HTT antibody (S830) and anti-ELAV antibody (Elav-9F8A9) to reveal the onset of HTT fragment expression. Aggregates are clearly visible as bright, punctate spots. The MF and its direction of migration from posterior to anterior are indicated (MF and dotted line and arrow from P->A). Note the delay of a couple of rows where the green stain is diffuse as HTT levels build to the threshold level for aggregation followed by the bright punctate inclusions. (B) Image analysis of elav-GAL4-driven fragment expression in eye discs. Eye discs dissected from wandering third instar larvae (elav-GAL4/(w or Y); UAS-FRAGMENT/+, reared at 25°C) were probed with S830 anti-HTT antibody. Discs were also simultaneously probed with Elav-9F8A9 antibody, as in (A) (not shown). Confocal images were analyzed with ImageJ software to detect levels and distribution of HTT (black lines) and ELAV protein (gray lines). As expected, transgenes are only expressed where ELAV is also expressed. The 90 fragment has a much stronger and more highly fluctuating signal than the others. Note the level of signal compared with the ELAV control, which is relatively constant from disc to disc and the extent of fluctuation of the 90ex1 120Q signal versus some fragments with smooth signal (e.g. 469–586) (indicative of lack of bright punctate inclusions). This analysis reveals the level of aggregate formation and the degree of HTT accumulation in neuronal cells over time. (C) High-magnification images of elav-GAL4-driven 90 and 536 fragments in eye discs. Green = HTT, blue = DAPI. Eye discs dissected from larvae as above were probed with PW0595 anti-HTT antibody and mounted in Vectashield with DAPI. The 90ex1 120Q fragment (90, left panel) forms large punctate aggregates, whereas the 536 HTT fragment (536, right panel) remains diffuse. Under these conditions, the 90 fragment stands out as forming large, bright inclusions quite rapidly, whereas the caspase and calpain fragments (469–586) all behave like the 536 fragment in that they accumulate diffuse HTT peptides (see also Supplementary Material, Fig. S3). Note the depletion of diffuse signal in 90, as the fragment is rapidly absorbed into inclusions.
To compare the aggregation behavior of different fragments in neurons, we examined eye discs expressing different HTT120Q fragments. Visual inspection reveals clear punctate microscopically visible aggregates in the 90 and 108 fragment samples but more amorphous staining with all the other fragments under these conditions. We note that HTT inclusions in the dividing cells of the imaginal discs, such as the eye discs shown in Figure 5, are located in the cytoplasm and absent from the nucleus although there is a tendency to accumulate in nuclei of the photoreceptor cells as the adult eye is formed (28). The subcellular location of HTT is highly influenced by tissue type so that in these same animals, HTT is located in the nucleus of some tissues and the cytoplasm of other tissues. The cellular factors that affect where HTT will be located are under investigation. To quantify the results, images were analyzed by plotting the intensity level of HTT compared with the intensity of ELAV as a reference along a strip that runs perpendicular to the MF (see rectangles in Fig. 5B). At least five images for each genotype were taken for analysis. Examples of these are shown as graphs of intensity versus position in the disc below the confocal image for each construct in Fig. 5B. Two things worth noting are the HTT intensity (black) relative to the ELAV control (gray) and the degree of fluctuation in the black HTT signal. Spikes in the black signal are indicative of bright, discreet inclusions versus more diffuse HTT. As seen in Fig. 5B (90), the intensity of the HTT signal follows the ELAV signal closely and is relatively smooth for a very brief time (indicative of diffuse staining) before showing high levels of fluctuation. The region of fluctuation corresponds to the region with inclusions. Thus, expression of the 90 fragment leads to the rapid formation of large inclusions with diffuse cytoplasmic HTT observed for only ∼8–10 h before inclusions appear as very bright and punctate aggregates with sharp boundaries (Fig. 5A–C).
Adding 18 aas to give the 108 aspartic endopeptidase fragment results in similar-looking aggregates that form more slowly, with the first aggregates appearing at ∼12–14 h (Fig. 5B, 108). The intensity of the fluctuating signal is not as great at that seen with 90ex1 120Q, and the level of accumulation relative to ELAV is lower. The behavior of the calpain and caspase fragments, i.e. 469–586, is notably different. With all of these fragments, the signal is generally lower than the 90 (or 108) signal relative to elav and is typical of diffuse HTT (i.e. it is relatively smooth), indicating that they tend not to form bright, punctate, distinct aggregates. To quantify the tendency to form inclusions, we used NIH ImageJ with the ‘3D Object Counter’ plug-in (30). This analysis (Fig. 6A) reinforced the conclusion that the 90ex1 120Q fragment forms the most aggregates, followed by the 108 fragment (at roughly 60% of the 90 fragment). The caspase and calpain fragments yielded significantly fewer counts and for the most part were statistically indistinguishable from each other. The program is threshold-based, and it is possible that a local concentration of diffuse signal could exceed the cut-off for detection. To better understand the nature of the signal in the 469–586 samples, we examined the staining patterns using high-magnification microscopy (Fig. 5C and Supplementary Material, Fig. S3). This analysis was consistent with the fluctuation analysis above confirming that 90ex1 120Q shows large punctate aggregates [Fig. 5C (90ex1 120Q)] whereas 120Q-containing caspase and calpain fragments are primarily diffuse (e.g. 586 120Q shown in Fig. 5C and Supplementary Material, Fig. S3) with some areas of concentration of diffuse signal. Notably, whether in inclusions or diffuse, the bulk of the HTT signal is cytoplasmic (Fig. 5C). Thus, when expressed in neurons at similar levels, expanded polyQ alone is not sufficient to cause inclusions to form under these conditions. The 90ex1 120Q fragment stands out as the most aggregation- and accumulation-prone fragment of all, with the 108 fragment showing inclusions at lower levels, whereas the 469–586 fragments do not appear to form punctate inclusions.
Figure 6.

Comparisons of the aggregation potential of different fragments. The crosses for these experiments were w; Da-GAL4; + virgins X w/Y; FRAG; + males. Wandering third instar larvae (second instar in the case of 90) were analyzed (sex was not determined). In (A), the number of apparent aggregates was determined by analyzing 3D confocal stacks of at least five discs of each genotype using ImageJ (examples shown in Fig. 5B). Controls (CTL) were companion eye discs expressing a fragment terminating at aa 118, which generated no signal. The number of objects detected in the 469–586 specimens was notably less than the number in the 90 or the 108 samples. Inspection by high-resolution microscopy indicates that the objects counted in the 469–586 samples with the threshold software are not true discreet aggregates but rather concentrations of diffuse material (see Fig. 5C and Supplementary Material, Fig. S3). In (B), the potential of fragments to seed amyloid formation was evaluated as an increase in Thioflavin T fluorescence relative to unseeded controls. Three separate collections for each fragment were analyzed. Controls were expressing the 90ex1 25Q fragment. The signal from the 90 and the 108 fragments was significantly (P < 0.001) higher compared with the control at a concentration of one larvae equivalent per reaction. In contrast, the other fragments did not significantly seed. In (C), the degree of aggregation measured by TR-FRET assay is presented. Controls were w flies. The aggregation signal from the 90 fragment stands out with a P < 0.001 when compared with the aggregation signal from all other fragments. Except for the difference between 469 versus 552 or 586, the differences among all other samples are different at a level of at least P < 0.05 although all are much lower than the 90 fragment. In (D), the amount of material in the insoluble smears below the wells of the western blots is presented (see Fig. 4A). This material is likely to contain oligomers, but bona fide inclusions will likely not enter the gel. P-values for 552 versus 469 and 552 versus 513 are P < 0.01. There are no other significant differences. Controls were w flies.
Relative amyloid seeding potential
To further investigate the apparently different propensities to form inclusions, we turned to an amyloid seeding assay (ASAs) (31). Amyloid seeding assays (ASAs) provide a sensitive method to quantify the ability of misfolded proteins from tissue samples to act as seeds that accelerate the kinetics of amyloid formation, as measured by Thioflavin T fluorescence. Extracts of larvae expressing the different HTT fragments were evaluated for amyloid seeding potential after immunopurification with A11, a conformation-specific anti-oligomer antibody that binds to HTT oligomers (25). Extracts of larvae expressing unexpanded 90ex1 25Q continuously from embryogenesis show no increase in seeding ability compared with extracts from non-transgenic animals and serve as the negative control. However, animals expressing 90ex1 120Q show a very robust seeding behavior (Fig. 6B). The 108 fragment is significantly less effective at seeding whereas the caspase and calpain fragments did not significantly seed amyloid formation above background levels (Fig. 6B). Titration of the amyloid-forming samples followed by Spearman–Karber analysis indicates that the 90 fragment is ∼4 times as potent as the 108 fragment at seeding amyloids (Supplementary Material, Fig. S4) whereas none of the other fragments exhibit convincing seeding potential. Thus, this analysis again identifies the 90ex1 120Q fragments as having the strongest aggregation potential, consistent with the immunofluorescence studies. On the other hand, the samples 469–586 show no significant propensity to seed amyloids. These data underscore the conclusion that expanded polyQ alone is not sufficient to induce seeding of inclusions.
TR-FRET assay
Another means of measuring HTT aggregates versus monomers is the recently developed Time-Resolved Forster Resonance Energy Transfer protocol (TR-FRET) (32). Analysis of the same samples used for the western blots confirms a low ratio of soluble to aggregated species for the 90ex1 120Q and a much lower level of aggregate signal from the other peptides (Fig. 6C). The modest levels of aggregate signal from some of the proteolytic fragments are consistent with the ‘aggregate’ signal including oligomeric species. Similarly, the signal from the smear in the western blots (Fig. 6D) is consistent with oligomers forming in the longest proteolytic fragments. Thus, all assays identify the 90 fragment as the most aggregate-prone species. TR-FRET and western blots tend to reveal an intermediate level of presumed oligomers formed by the larger fragments whereas the ASA detects A11-positive oligomers that are capable of seeding inclusions in the 90- and 108-expressing extracts but not in extracts from flies expressing 469 and above. Visual inspection also scores the 469–586 fragments as not forming visible inclusions. Taken together, these observations suggest that multiple oligomeric forms exist but only some are capable of seeding amyloid inclusions.
DISCUSSION
Huntingtin is a very large (∼3144 aa), ubiquitously expressed protein of as yet unknown function(s). Expansion of a CAG repeat near the 5′ end of the gene leads to the incorporation of a polyQ expansion immediately following the first 17 aas. Extensive evidence demonstrates that small amino-terminal fragments of HTT are the predominant species found in post-mortem patient material and are able to cause pathology in experimental systems [e.g. (6,17,33,34)]. Indeed, inclusions in post-mortem brain tissue react only with N-terminal HTT antibodies (14,33) and not with antibodies that recognize epitopes beyond ∼115 aas (2,35). Thus, an understanding of the behavior and pathogenic potential of naturally occurring N-terminal fragments is critical to understanding HD. In order to identify proper targets for treatment, it is important to understand the extent to which differential pathogenesis in model systems is simply a matter of levels of transgene expression or other system-specific behavior versus a matter of distinct biophysical properties of particular peptides.
The pathogenic potential of different N-terminal fragments
Some studies report that larger HTT fragments are processed to smaller N-terminal fragments by caspases, calpains and possibly aspartyl endopeptidases and that mutations that prevent, e.g. the caspase 6 cleavage at 586, can render HTT nonpathogenic (1–5). However, these fragments have not been compared in a single system with a controlled background and controlled level of expression nor in a system that eliminates the potential of multiple or sequential cleavage products in an individual experiment. The challenge in comparing fragment behavior in diverse environments is illustrated by a recent study where mutagenesis of a putative cleavage site between HTT105–114 (generating the 108 fragment) blocked generation of the fragment in mammalian cells but did not block it in transgenic mice (36).
Caspase and calpain fragments
By treating brain extracts with recombinant caspases (7), it has been reported that caspase 3 cleaves at 513 and 552 and caspase 6 cleaves at 586. No apparent obligate order of cleavage is indicated, as demonstrated by the ability of 1220-aa fragments with specific caspase sites mutated to be cleaved at the remaining nearby caspase sites. Thus, by this assay, the sites appear to be independent. By sequence analysis, there are several other putative sites but they do not appear to be cleaved (7).
When monitored in cultured cells, mutation of all caspase cleavage sites reduced cellular toxicity (4). However, expressing a caspase-6-resistant HTT peptide in transgenic YAC mice derived from cDNA fragments terminating at nucleotide 3949 results in none of the phenotypes typical of mHTT-challenged mice (7). In contrast, transgenic YAC mice expressing caspase-3-resistant HTT exhibit the same degree of pathology as those expressing unmodified HTT. These data suggest that the 24-aa-longer 586 caspase 6 fragment is toxic in vivo (either because of length, end structure or content, e.g. NLS, NES sites, etc.) or that genetic background or other unrecognized effects contributed to the outcome. The observation that genetic ablation of caspase 6 does not alter the cleavage pattern of HTT in HdhQ150 knock-in mice (19) suggests that the formation of the 586 fragment, if it occurs in patients, may not depend on caspase 6 activity. In our studies, the intrinsic pathogenicities of the 513 and 552 putative caspase 3 fragments are not significantly different than the 586 fragment. The evidence presented suggests that seeds/inclusions are very rare or absent in the longer fragment lines relative to the shorter ones. Although it is possible that these longer fragments may form inclusions at levels near or below the limit of detection, they do not have a major impact on neurodegeneration or survival to adulthood, and they have a greatly reduced impact on motor function and longevity compared with 90ex1 120Q.
In addition to the caspase fragments, two fragments with molecular mass predicted from cleavage of calpain sites located at 469 and 536 have been observed in cultured cells (1), and deletion of the putative calpain sites reduced the appearance of these fragments. Fragments of similar molecular mass have been observed in western blots of patient material (17). Several reports indicate that mHTT affects Ca2+ homeostasis, and leads to increased activity of the Ca2+-dependent calpains in mHTT-challenged mice (1) thus producing these fragments. Sequential cleavage by caspases and calpains has also been observed (17). In transgenic Drosophila expressing these fragments, we find that the 469 and 536 calpain fragments are relatively nontoxic, do not form classical inclusions, do not exhibit amyloid seeding ability and behave similar to the caspase fragments.
The endopeptidase fragment
The putative 108 aspartic endopeptidase fragment (Cp-A, generated by cleavage between aa's 104 and 114) was identified by exploring the antigenic properties of nuclear and cytoplasmic inclusions formed in an engineered mouse–rat neuroblastoma-glioma cell line (NG108-15) (2). Inhibitor studies showed that its formation was blocked by pepstatin, an inhibitor of the aspartic endopeptidases (which include presenilin and cathepsins D & E), but not by other protease inhibitors. Other studies also implicate cathepsins and suggest the formation of other possible N-terminal HTT fragments in the cleavage-prone region around 104–114 (Kim 2006; Ratovitski 2009). As these fragments have not been tested for pathogenicity in an in vivo setting, we tested the toxicity of the 108-aa cp-A fragment. In our studies, the 108 fragment stands as the second most toxic fragment, but a distant second compared with the exceptionally toxic 90ex1 120Q. It tends to form classic inclusions, but the kinetics of formation are notably slower than those of the 90ex1 120Q fragment (Fig. 4B), it is ∼25% as potent in ability to seed amyloids, and despite being just 18 aas longer than the 90ex1 120Q fragment, it does not lead to overt neuronal degeneration under any of the biological conditions we were able to test (e.g. even when expressed at approximately twice the level at which 90ex1 120Q causes neuronal degeneration). Also, the 108 fragment is decidedly less toxic to motor function than 90ex1 120Q when expressed in neurons. Nevertheless, despite its reduced toxicity relative to 90ex1 120Q, fragments of this nature could potentially contribute to classic HD symptoms.
The exon 1 fragment
Extensive studies demonstrate that short fragments of mHTT (e.g. HTT exon 1, terminating at aa 90) can be highly pathogenic in a variety of model systems, including mouse, fly, worm and yeast (9,12,23,37–39). In particular, R6/2 mice that express 90ex1 120Q at ∼75% the level of normal HTT (9) have been found to faithfully replicate the gene expression disruptions seen in patient material (40–42). In our studies, the exon 1 fragment stands out as uniquely pathogenic and as uniquely prone to forming large microscopically visible inclusions. It is the only fragment that produces overt neurodegeneration at any level of expression, it exhibits unique biophysical properties based on its aberrant migration in SDS gels compared with other fragments containing the same number of polyQ repeats and it is particularly effective at seeding amyloid formation. It forms bona fide, classic inclusions, which the longer caspase and calpain fragments do not, and it is generally more toxic in every assay performed. Thus, when compared in a common genetic background and in a common chromosomal location, 90ex1 120Q stands apart in its pathogenicity from all other N-terminal mHTT fragments that have been reported.
Is it possible that exon 1 fragments are the primary contributors to pathology? First, recent studies show that an exon 1 protein is a natural product produced by an abnormal splicing event, triggered by the presence of an expanded CAG repeat, that results in failure to remove the first intron and the subsequent termination of translation at a cryptic stop codon immediately following aa 90 (6). Similarly, mouse models where the first intron remains (e.g. knock-ins) will be subject to aberrant splicing and thus production of exon 1 fragments. The finding of these aberrantly spliced transcripts in HD patient tissues provides a mechanism for production of exon 1 fragments in HD patients from the earliest stages onward.
Secondly, studies of postmortem tissues find that HTT inclusions are comprised primarily of very N-terminal HTT fragments, based on the observation that inclusions fail to stain with antibodies recognizing epitopes in aa 116–129 (1H6) (2,34,35,43), 214–229 (ab214), 414–503 (2,44) and 585–725 (14) whereas clearly reacting with antibodies raised against the first 17 aas and other epitopes upstream of ∼aa 111. These observations are consistent with inclusions being comprised primarily of exon 1 and perhaps Cp-A-like fragments. Although it is a formal possibility that pathology is caused by short-lived longer intermediate proteolytic fragments that do not accumulate in patients, the failure of the calpain and the caspase fragments (i.e. 469–586) to promote pathology in our studies even when they have accumulated to high levels coupled with the fact that they do not represent a major portion of the HTT-positive material present in diseased brains of patients tends to lower enthusiasm for this possibility. Additionally, in studies with mammalian systems where longer fragments have been implicated in pathology, it is difficult to rule out the possibility that further processing of the original fragments may have contributed to the pathology. For example, studies that involve enriching HTT by immunoisolation are able to detect caspase and calpain fragments on western blots (17), but these fragments do not appear to be major components of inclusions in brain tissue (2,14,34,35,43–45) These considerations suggest that even if the mHTT burden were confined to the proteolytic fragments, disease progression would be dramatically slower than when exon 1 is present. Taken together, these data suggest that efforts to reduce or remove the exon 1 fragment are likely to have the greatest impact on ameliorating HD pathology.
MATERIALS AND METHODS
Constructs
To construct transgenes with 120 Qs that do not contain extraneous sequences remaining from cloning steps, we made use of paired class IIS restriction enzymes and iterative cloning steps to produce a set of ‘clean’ transgenes. Class-IIS restriction enzymes recognize a 4- to 7-bp non-palindromic sequence but cleave to generate a staggered end at a defined distance and direction from the recognition site (46,47). This allows one to engineer cleavage/ligation sites at any location and sequence desired. A cassette of 120 mixed-codon Qs was first constructed in a pBSK II vector modified by exchanging the region between the SacI and KpnI sites with unique SpeI and SphI sites flanking three unique sites between them (or as many as the number of iterative steps one needs to employ) – in this case EcoRI, HindIII and BamHI. A synthetic oligonucleotide encoding an SpeI site followed by a mixture of CAG/CAA codons encoding 31 Q residues followed by a BseRI site directed toward the Qs and an EcoRI site was cloned into the Spe1 EcoRI sites of the modified vector (Supplementary Material, Fig. S6). A second fragment consisting of EcoRI, BseRI directed right, 29 Qs, a BspMI site directed left and HindIII was cloned into the EcoRI/HindIII site. Cutting with BseRI and ligating produced a 60Q clone without any trace of the BseRI or EcoRI sites. A fragment consisting of HindIII, BspMI facing right, 29 Qs, a BseRI site facing left and BamHI was cloned into the 60Q plasmid cut with HindIII and BamHI. Cutting with BspMI and ligating produces an 89 Q plasmid, which was cut with BamHI and SphI and a fragment inserted consisting of BamHI, BseRI facing right, 31 Qs and SphI. Cutting and ligating produced a plasmid with 120 mixed-codon Qs flanked by SpeI and SphI sites.
Using a similar strategy, this 120 Q cassette was inserted into the HTT gene. To this end, a second pBSK vector was modified by replacing the multiple cloning site with an oligonucleotide containing EcoRI, NotI, PstI and XhoI sites (Supplementary Material, Fig. S7). The vector was further modified by cloning a synthetic oligonucleotide containing NotI, BseRI facing left, BseRI facing right, SpeI, SphI, BspMI facing left, BspMI facing right and PstI sites into the NotI and PstI sites. The SpeI-Q120-SphI fragment from above was cloned into this plasmid. The HTT coding sequences 5′ and 3′ from the site of the polyQs were PCR amplified from a full-length human HTT cDNA clone with 23Qs (a kind gift from P. J. Muchowski, UCSF) using primers that generated unique restriction sites (EcoRI-5′-NotI and PstI-3′-XhoI, respectively). The 5′ part of the target gene is sealed to the left side of the Q-repeat coding sequence by deleting the spacer with BseRI digestion followed by ligation and then repeating with BspMI digestion/ligation. This results in an HTT gene with an EcoRI site just before the start codon, 120 Qs ending at aa 171 and a XhoI site at the end. Shorter ones were made by PCR from this clone.
Different fragments were then cloned into the pUASTattB vector for transformation (8) by insertion of the EcoRI/XhoI fragment (or PCR products with those sites in the primers) followed by insertion of the C-termini using XhoI and another convenient restriction site for cloning.
Flies
yw M{eGFP;RFP.vas-int.Dm}ZH-2A; M{RFP.attP}ZH-51D flies [a kind gift from K. Basler, University of Zurich, (8)] were injected with pUASTattB vectors harboring the different HTT fragments, and transformed flies were recovered based on eye color and crossed with stocks containing CyO in a w[1118] background to generate flies homozygous for the transgene on the second chromosome. Elav-GAL4-containing X chromosomes were derived from Bloomington stock number 458 (P{w[+mW.hs] = GawB}elav[C155]). Da-GAL4-containing third chromosomes were derived from Bloomington stock number 8641 (w[1118]; P{da-GAL4.w[-]}3), and these were recombined with Bloomington stock number 7017 (w[*]; P{w[+mC] = tubP-GAL80[ts]}2/TM2) to create the tub-GAL80ts da-GAL4 chromosome. All flies were maintained on standard media and kept on a 12-h light cycle.
qPCR
Following freezing at −80° C, mRNA was extracted by grinding samples with a motorized plastic pestle in TRIzol (GibcoBRL 15596) for 1 min, and then processing following the manufacturer's recommendations. cDNA was generated using Fermentas Maxima Universal First Strand cDNA Synthesis Kit #K1661. Reaction products were diluted with water, and qPCR was performed using SYBR Green on a DNA Engine Continuous Fluorescence Detection System (MJ Research, Reno, NV, USA). Primers for amplification were located in the 3′ UTR of the transgene vector that is common to all fragments being studied, thus avoiding any differences in primer efficiency.
Eclosion assays
Two to five males were placed in a vial with 2–5 virgins. Flies were allowed to mate for ∼3 days and then passed daily into new vials for 4–5 days. Eclosed adults were removed from vials daily and scored.
Neurodegeneration assays
Adult flies were decapitated, and heads mounted on a glass slide with clear nail polish. To measure neuronal degeneration, the number of rhabdomeres/ommatidium was scored as a reflection of the number of intact photoreceptor neurons by focusing on the surface of the eye with light coming from below using a Nikon Optiphot microscope as described (48).
Motor function tests
Neuronal function was measured by testing flies ability to climb when HTT was expressed in neurons. Three vials of 15 female (expressing) flies were placed side-by-side in a rack with vials of sibling males (non-expressing). Video recordings were made of the flies being tapped down and climbing up every 6 s or so for ∼2 min. The video was analyzed using the Flytracker program (B. Barbaro, UCI—available upon request) with some manual curation. Average climbing speed was determined for each vial by taking the average position of the flies after 3 s and subtracting the average position of the flies at 2 s, and the results are presented as the ratio of climbing speed of HTT-challenged females to non-HTT-expressing sibling males.
Longevity assays
Vials were kept at 22.5°C until eclosion. After eclosion, progeny were stored at 18°C for 4–6 days until enough flies had been collected to establish vials containing 10–15 flies for each cross (in the case of 90, two crosses were combined in three of five cases because there were not enough flies eclosing), at which point they were moved to 25°C. Vials were passed and dead flies counted every 2–3 days.
Antibodies
Primary antibodies: S830 sheep anti-HTT (used at 1 : 1000 dilution for immunohistochemistry) [a kind gift from G. Bates, King's College (34)]; Elav-9F8A9 mouse anti-Dmel elav (used at 1 : 200 dilution for immunohistochemistry) and E7 mouse anti-beta-tubulin (used at 1 : 1000 dilution for western blots) (Developmental Studies Hybridoma Bank); PW0595 rabbit anti-HTT (used at 1 : 1000 dilution for western blots and immunohistochemistry) (Enzo Life Sciences); 4C9 mouse anti-HTT (used at 1 : 10 000 dilution for western blots and immunohistochemistry) (32); 1C2 mouse anti-polyQ (used at 1 : 1000 dilution for western blots) (a kind gift of L. Thompson UCI); Neo536(c3980) rabbit anti-HTT (epitope near aa 536) (used at 1 : 100 dilution for western blots) (kind gift from L. Ellerby). Secondary antibodies: fluorescein isothiocyanate-conjugated donkey anti-sheep (used at 1 : 250 dilution for immunohistochemistry, Jackson ImmunoResearch, Inc.); IRDye 680 goat anti-rabbit and 800CW goat anti-mouse (both used at 1 : 10,000 dilution for western blots, LI-COR Biosciences); Alexa Fluor 488 goat anti-rabbit and 488 goat anti-mouse (both used at 1 : 4000 dilution for immunohistochemistry, Life Technologies).
Western blotting
Tissues were processed as follows: for larval tissues, single wandering third instar larvae were ground for 1 min with an electric pestle in 30 µl PBS and combined with 30 µl 2× loading buffer. For production/degradation assays, single adult males were ground directly in 30 µl 2× loading buffer. Homogenates were immediately heated for 5 min at 95°C. Samples were run on 8–10% polyacrylamide or 7.5% Bio-Rad TGX gels and then transferred to Immobilon-FL PVDF membrane using a Bio-Rad Mini Protean II apparatus. Membranes were blocked with 50% Odyssey Blocking Buffer (LI-COR) in PBS and then probed with primary and secondary antibodies. Detection and quantification were performed with an LI-COR Odyssey Infrared Imaging System.
Immunofluorescence
Wandering third instar larvae were bisected, and the anterior half turned inside out and placed in PBST (PBS + 0.1% Tween or PBS + 0.2% Triton X-100) on ice. Within an hour, these halves were fixed by rocking for 20–30 min at room temperature in PBST with 4% formaldehyde. Halves were then washed with PBST and blocked with 5–10% BSA in PBST for 1 h at room temp, probed overnight at 4°C with primary antibody (4C9 1 : 10 000 or S830 1 : 200 in BSA/PBST), washed, blocked again and probed at 4°C overnight with secondary antibody (AlexaFluor 488 anti-mouse at 1 : 4000 in BSA/PBST or FITC-conjugated donkey anti-sheep 1 : 250) and washed again. Organs of interest were then dissected out and mounted in Vectashield with DAPI. Tissues were imaged on a Zeiss LSM 510 META or LSM 780 laser scanning microscope. Image analysis was performed with ImageJ.
Aggregate counting
Optical sections of eye discs described earlier were processed with ImageJ software, using the ‘3D Object Counter’ plug-in (49) Threshold levels were set to 1500, and all other settings were left on default values. These settings clearly identified most of the aggregates as determined by visual inspection and were applied consistently to all images.
TR-FRET assay
The recently developed Time-Resolved Forster Resonance Energy Transfer protocol (TR-FRET) is designed to measure soluble and insoluble HTT (32). Soluble species are detected by the FRET signal generated from two differently labeled antibodies binding one at the N-terminus (2B7) and one within the polyQ domain (MW1). Aggregated HTT is detected by the FRET signal generated from a single monoclonal antibody directed against an epitope between 42 and 54 (4C9) but labeled with two dyes, which only fluoresces when HTT is aggregated whereas the fluorescence of the 2B7/MW1 pair is blocked when the polyQs are aggregated.
Seeding assays
Extracts of Drosophila expressing different N-terminal HTT peptides were tested for their ability to seed the formation of thioflavinT-positive amyloid using an ASA (31) with modifications. Briefly, 20 Drosophila L3 larvae were ground in 600 µl PBS supplemented with 1 mm PMSF, 1 mm EDTA, 1 mm DTT and 0.1 mm protease inhibitor cocktail (Sigma P8340) and then further homogenized by the addition of 1-mm glass beads and vortexing at a high speed for 5 min. The homogenate was removed, and the glass beads were washed with 600 μl of PBS for 5 min. The two solutions were combined for a final homogenate solution of 20 larvae equivalent in 1200 μl of PBS. 100 μg of magnetic beads (S1432S NEB, binding capacity 10 μg) conjugated to anti-rabbit IgG secondary antibody were washed with PBS buffer and incubated with a solution of 10 μg of A11 antibody (AB9234, Millipore) in 1 ml of 0.1% BSA in PBS buffer at RT with continuous shaking at low speed. After a 2-h incubation, magnetic beads were removed and washed three times with PBST buffer (1 ml) and resuspended in 1 ml of PBS. Magnetic beads were divided into 20 aliquots (0.2-μg bead equivalent), and each was incubated separately with 200 μl of fruit fly homogenate shaking at low speed. After 2-h incubation, samples were washed four times with PBST buffer (1 ml) and then eluted with 50 μl of 6 m GndHCl for 2 h at RT shaking at low speed.
Disaggregated monomeric K2Q44K2 (polyQ) (Keck Biotechnology Center at Yale University, >90% purity by HPLC) was mixed with 50 μl of eluted misfolded HTT purified from larval extracts to a final volume of 600 μl of 0.2 mg/ml of peptide, 50 μm ThT (T3516, Sigma) and 0.5 m GdnHCl in TBS buffer pH 8. This solution was transferred to three wells (200 µl each) of a black 96-well flat bottom plate (353945, BD biosciences) containing a single 3-mm glass bead (z143928, Sigma) for mixing. Each well contained 200 μl. The plate was sealed with a sealing tape (235207, Fisher) and incubated in a Spectramax M2 plate reader at 37°C, with shaking for 5 s every 5 min. Fluorescence intensity was recorded every 5 min with excitation at 444 nm and emission at 484 nm. ThT values were compared at 1.2× the time of the average lag phase of the control sample. To calculate the lag phase, the first of three consecutive time points that were significantly (P < 10−3) above the background and after which the signal did not fall below background were identified. Background fluorescence recorded from solution in the absence of peptide was subtracted from each data set.
Statistical and analytic procedures
Throughout this paper, error bars show standard error of the mean (SEM = standard deviation/square root of n). Significance was established using Student's t test (N.S. = not significant, * = P < 0.05, ** = P < 0.01, *** = P < 0.001). Spearman–Kärber analysis (50) was used to determine the seeding dose of the larvae samples at which 50% of reactions seeded with the purified extracts were positive seeders compared with the 90ex1 25Q control sample.
SUPPLEMENTARY MATERIAL
FUNDING
The authors acknowledge the support of the Optical Biology Core facility and the Cancer Center Support grant of the University of California, Irvine (CC grant #CA62203). This research was supported by the CHDI foundation (HQ-44670) and the National Institute of Health (NS-45283 to J.L.M. and NS064173 to D.W.C.).
Supplementary Material
ACKNOWLEDGEMENTS
This work was submitted in partial fulfilment for the PhD degree by B. Barbaro.
Conflict of Interest statement. None declared.
References
- 1.Gafni J., Hermel E., Young J., Wellington C., Hayden M., Ellerby L. Inhibition of calpain cleavage of huntingtin reduces toxicity: accumulation of calpain/caspase fragments in the nucleus. J. Biol. Chem. 2004;279:20211–20220. doi: 10.1074/jbc.M401267200. [DOI] [PubMed] [Google Scholar]
- 2.Lunkes A., Lindenberg K.S., Ben-Haiem L., Weber C., Devys D., Landwehrmeyer G.B., Mandel J.L., Trottier Y. Proteases acting on mutant huntingtin generate cleaved products that differentially build up cytoplasmic and nuclear inclusions. Mol. Cell. 2002;10:259–269. doi: 10.1016/s1097-2765(02)00602-0. [DOI] [PubMed] [Google Scholar]
- 3.Ratovitski T., Nakamura M., D'Ambola J., Chighladze E., Liang Y., Wang W., Graham R., Hayden M., Borchelt D., Hirschhorn R., et al. N-terminal proteolysis of full-length mutant huntingtin in an inducible PC12 cell model of Huntington's disease. Cell Cycle. 2007;6:2970–2981. doi: 10.4161/cc.6.23.4992. [DOI] [PubMed] [Google Scholar]
- 4.Wellington C., Singaraja R., Ellerby L., Savill J., Roy S., Leavitt B., Cattaneo E., Hackam A., Sharp A., Thornberry N., et al. Inhibiting caspase cleavage of huntingtin reduces toxicity and aggregate formation in neuronal and nonneuronal cells. J. Biol. Chem. 2000;275:19831–19838. doi: 10.1074/jbc.M001475200. [DOI] [PubMed] [Google Scholar]
- 5.Wellington C.L., Hayden M.R. Caspases and neurodegeneration: on the cutting edge of new therapeutic approaches. Clin. Genetics. 2000;57:1–10. doi: 10.1034/j.1399-0004.2000.570101.x. [DOI] [PubMed] [Google Scholar]
- 6.Sathasivam K., Neueder A., Gipson T.A., Landles C., Benjamin A.C., Bondulich M.K., Smith D.L., Faull R.L., Roos R.A., Howland D., et al. Aberrant splicing of HTT generates the pathogenic exon 1 protein in Huntington disease. Proc. Natl Acad. Sci. USA. 2013;110:2366–2370. doi: 10.1073/pnas.1221891110. [DOI] [PMC free article] [PubMed] [Google Scholar]
- 7.Graham R., Deng Y., Slow E., Haigh B., Bissada N., Lu G., Pearson J., Shehadeh J., Bertram L., Murphy Z., et al. Cleavage at the caspase-6 site is required for neuronal dysfunction and degeneration due to mutant huntingtin. Cell. 2006;125:1179–1191. doi: 10.1016/j.cell.2006.04.026. [DOI] [PubMed] [Google Scholar]
- 8.Bischof J., Maeda R.K., Hediger M., Karch F., Basler K. An optimized transgenesis system for Drosophila using germ-line-specific phiC31 integrases. Proc. Natl Acad. Sci. USA. 2007;104:3312–3317. doi: 10.1073/pnas.0611511104. [DOI] [PMC free article] [PubMed] [Google Scholar]
- 9.Mangiarini L., Sathasivam K., Seller M., Cozens B., Harper A., Hetherington C., Lawton M., Trottier Y., Lehrach H., Davies S.W., et al. Exon 1 of the HD gene with an expanded CAG repeat is sufficient to cause a progressive neurological phenotype in transgenic mice. Cell. 1996;87:493–506. doi: 10.1016/s0092-8674(00)81369-0. [DOI] [PubMed] [Google Scholar]
- 10.Agrawal N. Identification of combinatorial drug regimens for treatment of Huntington's disease using Drosophila. Proc. Natl. Acad. Sci. USA. 2005;102:3777–3781. doi: 10.1073/pnas.0500055102. [DOI] [PMC free article] [PubMed] [Google Scholar]
- 11.Steffan J.S., Agrawal N., Pallos J., Rockabrand E., Trotman L.C., Slepko N., Illes K., Lukacsovich T., Zhu Y.-Z., Cattaneo E., et al. SUMO modification of huntingtin and Huntington's disease pathology. Science. 2004;304:100–104. doi: 10.1126/science.1092194. [DOI] [PubMed] [Google Scholar]
- 12.Steffan J.S., Bodai L., Pallos J., Poelman M., McCampbell A., Apostol B.L., Kazantsev A., Schmidt E., Zhu Y.Z., Greenwald M., et al. Histone deacetylase inhibitors arrest polyglutamine-dependent neurodegeneration in Drosophila. Nature. 2001;413:739–743. doi: 10.1038/35099568. [DOI] [PubMed] [Google Scholar]
- 13.Bennett E.J., Shaler T.A., Woodman B., Ryu K.-Y., Zaitseva T.S., Becker C.H., Bates G.P., Schulman H., Kopito R.R. Global changes to the ubiquitin system in Huntington's disease. Nature. 2007;448:704–708. doi: 10.1038/nature06022. [DOI] [PubMed] [Google Scholar]
- 14.DiFiglia M., Sapp E., Chase K.O., Davies S.W., Bates G.P., Vonsattel J.P., Aronin N. Aggregation of huntingtin in neuronal intranuclear inclusions and dystrophic neurites in brain. Science. 1997;277:1990–1993. doi: 10.1126/science.277.5334.1990. [DOI] [PubMed] [Google Scholar]
- 15.Mende-Mueller L.M., Toneff T., Hwang S.R., Chesselet M.F., Hook V.Y. Tissue-specific proteolysis of Huntingtin (htt) in human brain: evidence of enhanced levels of N- and C-terminal HTT fragments in Huntington's disease striatum. J. Neurosci. 2001;21:1830–1837. doi: 10.1523/JNEUROSCI.21-06-01830.2001. [DOI] [PMC free article] [PubMed] [Google Scholar]
- 16.Gafni J., Ellerby L.M. Calpain activation in Huntington's disease. J. Neurosci. 2002;22:4842–4849. doi: 10.1523/JNEUROSCI.22-12-04842.2002. [DOI] [PMC free article] [PubMed] [Google Scholar]
- 17.Kim Y.J., Yi Y., Sapp E., Wang Y., Cuiffo B., Kegel K.B., Qin Z.H., Aronin N., DiFiglia M. Caspase 3-cleaved N-terminal fragments of wild-type and mutant huntingtin are present in normal and Huntington's disease brains, associate with membranes, and undergo calpain-dependent proteolysis. Proc. Natl. Acad. Sci. USA. 2001;98:12784–12789. doi: 10.1073/pnas.221451398. [DOI] [PMC free article] [PubMed] [Google Scholar]
- 18.Goldberg Y.P., Nicholson D.W., Rasper D.M., Kalchman M.A., Koide H.B., Graham R.K., Bromm M., Kazemi-Esfarjani P., Thornberry N.A., Vaillancourt J.P., et al. Cleavage of huntingtin by apopain, a proapoptotic cysteine protease, is modulated by the polyglutamine tract. Nat. Genetics. 1996;13:442–449. doi: 10.1038/ng0896-442. [DOI] [PubMed] [Google Scholar]
- 19.Landles C., Weiss A., Franklin S., Howland D., Bates G. Caspase-6 does not contribute to the proteolysis of mutant huntingtin in the HdhQ150 knock-in mouse model of Huntington's disease. PLoS Curr. 2012;4:e4fd085bfc9973. doi: 10.1371/4fd085bfc9973. [DOI] [PMC free article] [PubMed] [Google Scholar]
- 20.Weiss K.R., Kimura Y., Lee W.-C.M., Littleton J.T. Huntingtin aggregation kinetics and their pathological role in a Drosophila Huntington's disease model. Genetics. 2012;190:581–600. doi: 10.1534/genetics.111.133710. [DOI] [PMC free article] [PubMed] [Google Scholar]
- 21.Phelps C.B., Brand A.H. Ectopic gene expression in Drosophila using GAL4 system. Methods. 1998;14:367–379. doi: 10.1006/meth.1998.0592. [DOI] [PubMed] [Google Scholar]
- 22.Marsh J.L., Thompson L.M. Can flies help humans treat neurodegenerative diseases? BioEssays. 2004;26:485–496. doi: 10.1002/bies.20029. [DOI] [PubMed] [Google Scholar]
- 23.Marsh J., Walker H., Theisen H., Zhu Y.-Z., Fielder T., Purcell J., Thompson L. Expanded polyglutamine peptides alone are intrinsically cytotoxic and cause neurodegeneration in Drosophila. Hum. Mol. Gen. 2000;9:13–25. doi: 10.1093/hmg/9.1.13. [DOI] [PubMed] [Google Scholar]
- 24.Ossato G., Digman M.A., Aiken C., Lukacsovich T., Marsh J.L., Gratton E. A two-step path to inclusion formation of huntingtin peptides revealed by number and brightness analysis. Biophys. J. 2010;98:3078–3085. doi: 10.1016/j.bpj.2010.02.058. [DOI] [PMC free article] [PubMed] [Google Scholar]
- 25.Kayed R., Head E., Thompson J.L., McIntire T.M., Milton S.C., Cotman C.W., Glabe C.G. Common structure of soluble amyloid oligomers implies common mechanism of pathogenesis. Science. 2003;300:486–489. doi: 10.1126/science.1079469. [DOI] [PubMed] [Google Scholar]
- 26.Sanchez I., Mahlke C., Yuan J. Pivotal role of oligomerization in expanded polyglutamine neurodegenerative disorders. Nature. 2003;421:373–379. doi: 10.1038/nature01301. [DOI] [PubMed] [Google Scholar]
- 27.Kazantsev A.G., Hersch S.M. Drug targeting of dysregulated transcription in Huntington's disease. Prog. Neurobiol. 2007;83:249–259. doi: 10.1016/j.pneurobio.2007.02.005. [DOI] [PMC free article] [PubMed] [Google Scholar]
- 28.Slepko N., Bhattacharyya A.M., Jackson G.R., Steffan J.S., Marsh J.L., Thompson L.M., Wetzel R. Normal-repeat-length polyglutamine peptides accelerate aggregation nucleation and cytotoxicity of expanded polyglutamine proteins. Proc. Natl Acad. Sci. USA. 2006;103:14367–14372. doi: 10.1073/pnas.0602348103. [DOI] [PMC free article] [PubMed] [Google Scholar]
- 29.Sinadinos C., Burbidge-King T., Soh D., Thompson L.M., Marsh J.L., Wyttenbach A., Mudher A.K. Live axonal transport disruption by mutant huntingtin fragments in Drosophila motor neuron axons. Neurobiol. Dis. 2009;34:389–395. doi: 10.1016/j.nbd.2009.02.012. [DOI] [PubMed] [Google Scholar]
- 30.Bolte S., Cordelieres F.P. A guided tour into subcellular colocalization analysis in light microscopy. J. Microscopy. 2006;224:213–232. doi: 10.1111/j.1365-2818.2006.01706.x. [DOI] [PubMed] [Google Scholar]
- 31.Gupta S., Jie S., Colby D.W. Protein misfolding detected early in pathogenesis of transgenic mouse model of Huntington disease using amyloid seeding assay. J. Biol. Chem. 2012;287:9982–9989. doi: 10.1074/jbc.M111.305417. [DOI] [PMC free article] [PubMed] [Google Scholar]
- 32.Baldo B., Paganetti P., Grueninger S., Marcellin D., Kaltenbach L.S., Lo D.C., Semmelroth M., Zivanovic A., Abramowski D., Smith D., et al. TR-FRET-based duplex immunoassay reveals an inverse correlation of soluble and aggregated mutant huntingtin in Huntington's disease. Chem. Biol. 2012;19:264–275. doi: 10.1016/j.chembiol.2011.12.020. [DOI] [PubMed] [Google Scholar]
- 33.Gutekunst C.A., Li S.H., Yi H., Mulroy J.S., Kuemmerle S., Jones R., Rye D., Ferrante R.J., Hersch S.M., Li X.J. Nuclear and neuropil aggregates in Huntington's disease: relationship to neuropathology. J. Neurosci. 1999;19:2522–2534. doi: 10.1523/JNEUROSCI.19-07-02522.1999. [DOI] [PMC free article] [PubMed] [Google Scholar]
- 34.Landles C., Sathasivam K., Weiss A., Woodman B., Moffitt H., Finkbeiner S., Sun B., Gafni J., Ellerby L.M., Trottier Y., et al. Proteolysis of mutant Huntingtin produces an exon 1 fragment that accumulates as an aggregated protein in neuronal nuclei in Huntington disease. J. Biol. Chem. 2010;285:8808–8823. doi: 10.1074/jbc.M109.075028. [DOI] [PMC free article] [PubMed] [Google Scholar]
- 35.Schilling G., Becher M., Sharp A., Jinnah H., Duan K., Kotzuk J., Slunt H., Ratovitski T., Cooper J., Jenkins N., et al. Intranuclear inclusions and neuritic aggregates in transgenic mice expressing a mutant N-terminal fragment of huntingtin. Hum. Mol. Genetics. 1999;8:397–407. doi: 10.1093/hmg/8.3.397. [DOI] [PubMed] [Google Scholar]
- 36.Tebbenkamp A.T., Xu G., Siemienski Z.B., Janus C., Fromholt S.E., Brown H.H., Swing D., Tessarollo L., Borchelt D.R. Experimental mutagenesis of huntingtin to map cleavage sites: different outcomes in cell and mouse models. J. Huntingtons Dis. 2014;3:73–86. doi: 10.3233/JHD-130087. [DOI] [PubMed] [Google Scholar]
- 37.Hughes R., Lo R., Davis C., Strand A., Neal C., Olson J., Fields S. Altered transcription in yeast expressing expanded polyglutamine. Proc. Natl Acad. Sci. USA. 2001;98:13201–13206. doi: 10.1073/pnas.191498198. [DOI] [PMC free article] [PubMed] [Google Scholar]
- 38.Morley J., Brignull H., Weyers J., Morimoto R. The threshold for polyglutamine-expansion protein aggregation and cellular toxicity is dynamic and influenced by aging in Caenorhabditis elegans. Proc. Natl Acad. Sci. USA. 2002;99:10417–10422. doi: 10.1073/pnas.152161099. [DOI] [PMC free article] [PubMed] [Google Scholar]
- 39.Satyal S., Schmidt E., Kitagawa K., Sondheimer N., Lindquist S., Kramer J., Morimoto R. Polyglutamine aggregates alter protein folding homeostasis in Caenorhabditis elegans. Proc. Natl Acad. Sci. USA. 2000;97:5750–5755. doi: 10.1073/pnas.100107297. [DOI] [PMC free article] [PubMed] [Google Scholar]
- 40.Seredenina T., Luthi-Carter R. What have we learned from gene expression profiles in Huntington's disease? Neurobiol. Dis. 2012;45:83–98. doi: 10.1016/j.nbd.2011.07.001. [DOI] [PubMed] [Google Scholar]
- 41.Kuhn A., Goldstein D.R., Hodges A., Strand A.D., Sengstag T., Kooperberg C., Becanovic K., Pouladi M.A., Sathasivam K., Cha J.-H.J., et al. Mutant Huntingtin's effects on striatal gene expression in mice recapitulate changes observed in human Huntington's disease brain and do not differ with mutant huntingtin length or wild-type huntingtin dosage. Hum. Mol. Genet. 2007;16:1845–1861. doi: 10.1093/hmg/ddm133. [DOI] [PubMed] [Google Scholar]
- 42.Ross C.A., Tabrizi S.J. Huntington's disease: from molecular pathogenesis to clinical treatment. Lancet Neurol. 2011;10:83–98. doi: 10.1016/S1474-4422(10)70245-3. [DOI] [PubMed] [Google Scholar]
- 43.Schilling G., Klevytska A., Tebbenkamp A.T.N., Juenemann K., Cooper J., Gonzales V., Slunt H., Poirer M., Ross C.A., Borchelt D.R. Characterization of huntingtin pathologic fragments in human Huntington disease, transgenic mice, and cell models. J. Neuropathol. Exp. Neurol. 2007;66:313–320. doi: 10.1097/nen.0b013e318040b2c8. [DOI] [PubMed] [Google Scholar]
- 44.Trottier Y., Devys D., Imbert G., Saudou F., An I., Lutz Y., Weber C., Agid Y., Hirsch E.C., Mandel J.L. Cellular localization of the Huntington's disease protein and discrimination of the normal and mutated form. Nat. Genet. 1995;10:104–110. doi: 10.1038/ng0595-104. [DOI] [PubMed] [Google Scholar]
- 45.Lunkes A.A., Mandel J.L.J. A cellular model that recapitulates major pathogenic steps of Huntington's disease. Hum. Mol. Genet. 1998;7:1355–1361. doi: 10.1093/hmg/7.9.1355. [DOI] [PubMed] [Google Scholar]
- 46.Pingoud A. Structure and function of type II restriction endonucleases. Nucl. Acids Res. 2001;29:3705–3727. doi: 10.1093/nar/29.18.3705. [DOI] [PMC free article] [PubMed] [Google Scholar]
- 47.Szybalski W., Kim S.C., Hasan N., Podhajska A.J. Class-IIS restriction enzymes – a review. Gene. 1991;100:13–26. doi: 10.1016/0378-1119(91)90345-c. [DOI] [PubMed] [Google Scholar]
- 48.Song W., Smith M.R., Syed A., Lukacsovich T., Barbaro B.A., Purcell J., Bornemann D.J., Burke J., Marsh J.L. Morphometric analysis of Huntington's disease neurodegeneration in Drosophila. Methods Mol. Biol. 2013;1017:41–57. doi: 10.1007/978-1-62703-438-8_3. [DOI] [PubMed] [Google Scholar]
- 49.Bolte S., Cordelières F.P. A guided tour into subcellular colocalization analysis in light microscopy. J. Microsc. 2006;224:213–232. doi: 10.1111/j.1365-2818.2006.01706.x. [DOI] [PubMed] [Google Scholar]
- 50.Hamilton M.A., Russo R.C., Thurston R.V. Trimmed Spearman–Karber method for estimating median lethal concentrations in toxicity bioassays. Environ. Sci. Technol. 1977;11:714–719. [Google Scholar]
Associated Data
This section collects any data citations, data availability statements, or supplementary materials included in this article.