Abstract
Recent studies of brain activities show that cross-frequency coupling (CFC) play an important role in memory and learning. Many measures have been proposed to investigate the CFC phenomenon, including the correlation between the amplitude envelopes of two brain waves at different frequencies — cross-frequency amplitude-amplitude coupling (AAC). In this short communication, we describe how nonstationary, nonlinear oscillatory signals may produce spurious cross-frequency AAC. Utilizing the empirical mode decomposition, we also propose a new method for assessment of AAC that can potentially reduce the effects of nonlinearity and nonstatonarity and, thus, help to avoid the detection of artificial AACs. We compare the performances of this new method and the traditional Fourier-based AAC method. We also discuss the strategies to identify potential spurious AACs.
Keywords: cross-frequency coupling, amplitude-amplitude coupling, empirical mode decomposition, phase-amplitude coupling, modulation index
1. Introduction
Various physical and physiological systems generate seemingly irregular outputs such as heart rate, motor activity, and brain activity that display complex oscillations/fluctuations over a range of frequencies [1-2]. These fluctuations are not simply caused by random external influences but possess intrinsic dynamic patterns that are of relevance to health [3-8]. Many recent studies have revealed cross-frequency coupling (CFC) in these complex fluctuations in which interactions occur between rhythms at different frequencies either within the same signals or in different signals [9]. CFC is of particular interest in the studies of brain activities because they are indicative of information propagation across different brain regions for specific neurophysiological functions [10-14]. There are three types of CFCs: phase synchronization (phase-phase CFC), phase-amplitude coupling (PAC), and amplitude-amplitude coupling (AAC). Most CFC studies have been mainly focused on the development and application of phase/frequency synchronization [15-18] and PAC [19-21]. However, few studies were conducted to validate/test the analytical tools for assessment of AAC despite the evidence for the physiological importance of AAC [22].
In this brief communication, we show that signals with nonstationary, nonlinear oscillations can lead to spurious AAC. The difficulties in identifying AAC while avoiding artifacts lie within the two required steps in assessing AAC: (1) extracting oscillatory components with varying amplitude, and (2) quantifying the coupling between the amplitudes of a pair of oscillatory components. To illustrate the difficulties, we test a previously used AAC method that is based on spectral analysis or Fourier transform [22]. In addition, we propose a new analytical tool for the assessment of AAC that is based on the empirical mode decomposition (EMD) — a decomposition that can better extract nonlinear and nonstationary oscillatory components from noisy signals [23-30]. We examine and compare the performances of the two methods using synthetic signals without AAC that are nonstationary and nonlinear as often observed in EEG recordings. The goal of this study is to illustrate certain pitfalls in AAC measures and to provide certain simulation results that can guild for appropriate result interpretation in AAC studies of real physiological data.
2. Methods
2.1. Assessment of AAC
2.1.1. Spectral cross-frequency comodulation analysis (SCFCA)
To assess AAC in local field potentials, the SCFCA was previously proposed and used to calculate the correlations [31] between the spectral power time series for all pairs of frequencies [22]. Briefly, for a signal, the method involves two steps (Diag. 1A): (1) multitaper spectral analysis is performed to obtain spectrum in sliding windows (window size = 3s; step size = 0.1s; taper number = 9) and to construct time × frequency spectrograms (frequency resolution = 2Hz); and (2) cross-correlation is calculated for each pair of two power density time series at two frequencies to obtain an amplitude–amplitude power comodulogram. We note that the time and frequency resolutions of the SCFCA are determined by the selected parameters of the Fourier transform and filtering. For instance, with 3 s for the window size of each spectrum, it is not possible to identify the coupling between the amplitudes of two oscillatory components that only occurs at frequencies much greater than > 1/3Hz (Supplemental Figure 1).
Diag. 1.
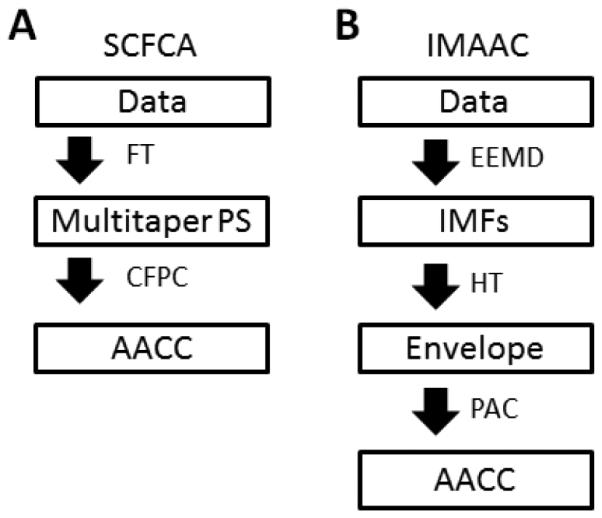
The procedures of the two methods for the assessment of cross-frequency amplitude-amplitude coupling. (A) The spectral cross-frequency comodulation analysis (SCFCA). (B) The intrinsic mode amplitude-amplitude coupling (IMAAC). FT: Fourier transform; PS: power spectrum; CFPC: cross-frequency power correlation; AACC: amplitude-amplitude coupling comodulogram; EEMD: ensemble empirical mode decomposition method; IMF: intrinsic mode function; HT: Hilbert transform; PAC: phase-amplitude coupling;
2.1.2. Intrinsic mode amplitude-amplitude coupling (IMAAC)
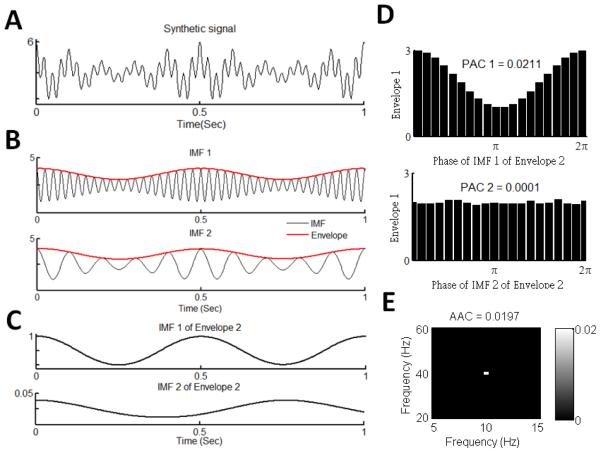
Strong evidence indicates that, as compared to the Fourier transform, the empirical mode decomposition (EMD) can better extract nonlinear and nonstationary oscillations [32]. Thus, we introduce a new EMD-based method for the assessment of AAC. This method, namely, intrinsic mode amplitude-amplitude coupling (IMAAC), involves the following steps (Diag. 1B; Fig. 1). (1) The EMD is used to extract oscillatory components of a signal at different frequencies with each component (intrinsic mode function: IMF) representing true fluctuations in the raw data over a narrow band of frequencies. To avoid the mixed mode (i.e., specific signal may not be separated into the same IMFs every time) [33], we propose to use noised-enhance ensemble EMD (EEMD) with the noise level of 20% (where noise level 20% represents a standard deviation of 20%) and 400 realizations [34]. In addition, we use the updated version of the EMD algorithm that is proposed by Wang et al. and can be <1000 times less time consuming than the original EMD [35]. To avoid potential mode splitting (i.e., an oscillatory component is divided into different IMFs) [36], an orthogonal checking is performed and split modes are combined [32]. Briefly, each sequentially pairing IMFs are combined recursively if their inner product is larger than 0.3 (Fig. 1A-C). (2) The instantaneous amplitudes (or envelope) and frequencies of all IMFs are obtained using the Hilbert transform (Fig. 1B). (3) The interaction between the envelopes of each pair of IMFs is quantified (see details below) and used as the modulation index (MI) of the two IMFs (Fig. 1D) that will be assigned to a frequency-frequency plane at the frequency coordinates based on the cycle-by-cycle frequencies of the two IMFs. Finally, the AAC comodulogram is obtained by averaging all MIs (i.e., from all pairs of IMFs) in the frequency-frequency plan in each 2Hz × 2Hz region that indicates the AAC level (Fig. 1E).
Fig. 1.
Demonstration of the intrinsic mode amplitude-amplitude coupling (IMAAC) analysis. (A) A synthetic signal with 10-Hz and 40-Hz oscillations whose amplitudes are simultaneously modulated by a 2-Hz sinusoidal wave. (B) Two intrinsic mode functions (IMFs) of the signal in A and their instantaneous amplitudes (envelopes). IMFs are obtained using EEMD. IMF1 and IMF2 are the 40-Hz and 10-Hz oscillatory components in the raw data, respectively. The envelope of each IMF is obtained using the Hilbert transform, i.e., Envelope 1 for IMF 1 and Envelope 2 for IMF 2. (C) Two IMFs of Envelope 2 in B. The first IMF corresponds to the 2-Hz oscillation. (D) The phase-amplitude distribution (PA distribution) between the first IMF (2Hz) and second IMF of Envelope 2 (phase) and Envelope 1 (amplitude). (E) The modulation indices (MIs) is calculated based on the PA distributions in D, and the MI between the IMF 1 and IMF 2 is weight-averaged according to the standard deviations (SD) of Envelope 2`s IMFs (see C). The MI will be assigned to a frequency-frequency plane at the coordinate 10 Hz x 40 Hz because the frequencies of IMF 1 and IMF 2 in all cycles are 40 Hz and 10 Hz, respectively.
To assess the ACC interaction or MI between two IMFs (e.g., IMF 1 and IMF2 in Fig. 1B), the simple way would be to calculate the cross-correlation coefficient of their envelopes (e.g., Envelope 1 for IMF 1 and Envelope 2 for IMF 2 in Fig. 1B). However, one of the drawbacks in this approach (as well as in the SCFCA) is that the cross correlation analysis assumes stationary signals (note that IMF envelopes are not necessarily stationary) [37-41]. To address the concerns, we propose an alternative way to calculate the MI by investigating the couplings between the two envelopes at different frequencies. Specifically, the EEMD is used to decompose the envelope of the IMF at a lower frequency (e.g., Envelope 2 for IMF 2 in Fig. 1B). For each resultant envelope’s IMF at a frequency lower than that of the IMF (e.g., 10 Hz for IMF 2 in Figure 1C), its phase modulation on the envelope of the other IMF (i.e., Envelope 1) is assessed to yield a phase-amplitude coupling (PAC) index (Fig. 1D). All PAC indices (e.g., for different IMFs of Envelope 2 in Fig. 1C) are then weight-averaged (i.e., weighted based on the standard deviations of the envelope’s IMFs) to obtain the MI between the two IMFs.
To determine the statistical significance of each MI, we apply a shuffling procedure in which individual cycles of the two IMFs are permuted randomly [42]. The process is repeated 100 times and MI is calculated for each realization. The mean and standard deviation of the 100 MIs of the surrogate data are used to z-score the original MI. Those measurements which did not exceed a significance level of p = 0.05 were eliminated.
The proposed new AAC method is implemented using Matlab and the code is available upon request (http://in.ncu.edu.tw/mzlo/drLo.html or https://sleep.med.harvard.edu/research/labs/112/Medical+Biodynamics+Program+MBP).
2.2. Synthetic signals
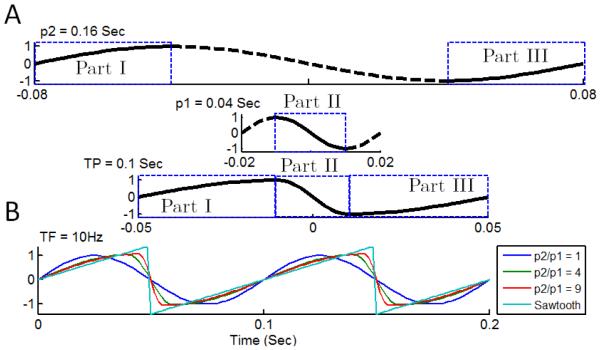
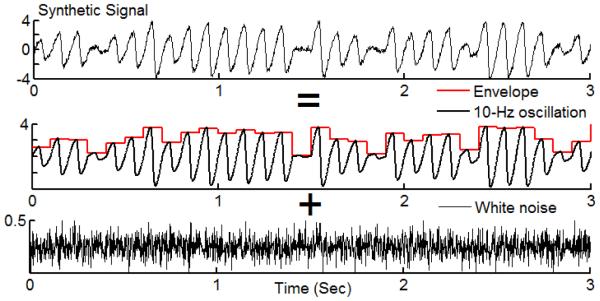
To test the performances of the SCFCA and IMAAC, we apply the two methods to a series of simulated nonstationary oscillatory signals with different degrees of nonlinearity. To generate nonlinear waveforms, we construct each cycle by stitching the half-cycle waveforms of two sinusoidal functions with the same amplitudes but not necessarily same periods (Fig. 2A). The degree of nonlinearity/asymmetry is determined by the ratio of the periods of the two sinusoids (p2/p1). We also use the sawtooth waves as an extreme case for asymmetric/nonlinear oscillations (Fig. 2B). In this study, all oscillatory cycles by default have the same frequency (f1 = 10 Hz). To introduce nonstationarities, we assign a random value between 0 and 4 to the amplitude of each cycle for Type 1 signals (Fig. 3). For each synthetic signal, the sampling frequency is 600 Hz, data length is 100 s, and there is a white-noise component with the noise level of 10% (i.e., SD of the white noise is 10% of that of the oscillatory component).
Fig.2.
Construction of nonlinear waveforms with different degrees of asymmetry. (A) An example of asymmetric wave (target period (TP) = 0.1 sec) is created using two sinusoidal waves. We use Part I (from [-π/2 0]) and Part ? (from [-π -π/2]) for the one with period 2 (p2) = 0.16 sec, and Part ? in the other one with period 1 (p1) = 0.04 sec. (B) We fix TP as 0.1 sec (or target frequency (TF) = 10 Hz) and change the period ratio (p2/p1) to control the degree of asymmetry. The sawtooth wave is the extreme case of asymmetric wave.
Fig.3.
A synthetic signal with nonstationary, nonlinear oscillations. Nonlinear waveforms are created based on the prototype in Fig. 2 with p2/p1 = 4. The amplitude of each cycle is a random number in the range of 0-4. The frequency of all cycles is 10 Hz. The synthetic signal also has a component of Gaussian white noise with the standard deviation equal to 10% of the oscillatory component.
3. Results
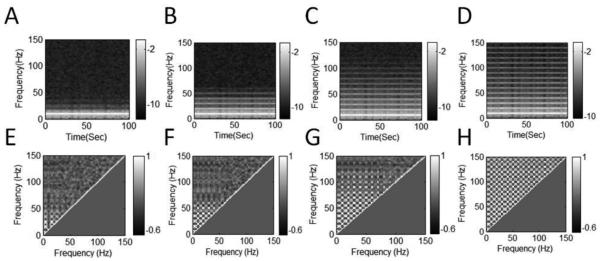
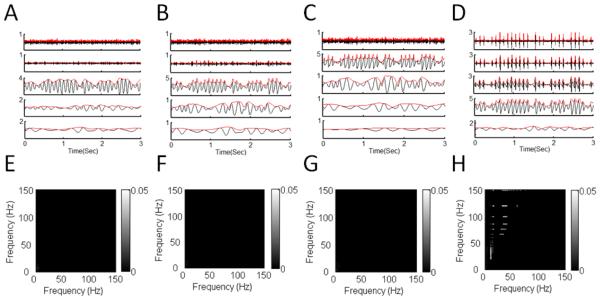
We study and compare the SCFCA and IMAAC results by applying them to nonstationary oscillatory signals without AAC. For the signals with linear oscillations (period ratio p1/p2 = 1), SCFCA results show certain artificial AACs between components at frequencies close to f1 = 10 Hz (Fig. 4B). These artifacts in the SCFCA results are due to the blurred peak in the spectral densities that is induced by the nonstationary oscillation (i.e., unstable amplitude) (Fig. 4A). When the waveforms become nonlinear (p2/p1 >1), more significant spurious AACs appear between f1 (10Hz) and its harmonic frequencies (e.g., 20Hz, 30Hz, and 40Hz) as well as between those harmonic frequencies (Fig. 4D). These artifacts are clearly caused by the nonlinearity in the waveforms that leads to power densities at harmonic frequencies (Fig. 4C). As the degree of nonlinearity or asymmetry (characterized by p2/p1) increases, the power densities spread to higher harmonic frequencies, resulting in more strong artificial AACs between the harmonics over a wider range of frequencies (Fig. 4E-G). When the asymmetric waveform is sawtooth with the shape edge, spurious AACs become so strong and appear between all pairs of fundamental and harmonic frequencies (Fig. 4H).
Fig.4.
SCFCA results of synthetic signals with asymmetric 10-Hz oscillation and nonstationary envelope. (A-D) Multitaper power spectra (PS) and (E-H) AAC comodulograms (AACCs) for signals with different degrees of asymmetry: (A, E) p2/p1 = 1, (B, F) p2/p1 = 4, (C, G) p2/p1 = 9, and (D, H) sawtooth. AACCs are obtained from cross-frequency correlation of PS in (A-D). For all signals, the nonstationary envelope is the same as shown in Fig. 3. The nonlinearity associated with the asymmetrical waveform leads to powers at harmonics, the nonstationarity causes the smearing of power densities at the fundamental and harmonic frequencies.
As compared to the SCFCA, nonstationarity and nonlinearity have less impact on the IMAAC. For all simulated symmetric or asymmetric oscillations with p2/p1 between 1 and 9, the IMAAC avoids detection of spurious AAC because the EMD allows a reliable extraction of the 10-Hz oscillations with unstable amplitude (Fig. 5A-C, 5E-G). Only for sawtooth, artificial AACs appear in the IMACC results (Fig. 5H). These spurious AACs occur because the sharp edges in the sawtooth waveforms induce artificial oscillations in all high-frequency components (higher than f1) at the same time locations (Fig. 5D).
Fig.5.
IMACC results of the synthetic signals with asymmetric oscillation and nonstationary envelope. (A-D) IMFs (black lines) and their instantaneous amplitudes or envelops (red lines), and (E-H) AACC of the same signals used in Fig. 4. (A, E) p2/p1 = 1, (B, F) p2/p1 = 4, (C, G) p2/p1 = 9, and (D, H) sawtooth.
4. Discussions
In this short communication we demonstrate that nonlinear oscillations with nonstationary amplitude may produce spurious cross-frequency amplitude-amplitude coupling. By applying a previously proposed AAC measure (i.e., derived from the SCFCA based on the correlations between spectral powers) to a series of nonlinear oscillatory signals at a fixed frequency (i.e., frequency is constant), we find that nonstationarity alone can induce artificial AACs at frequencies close to the fixed frequency. Nonlinearity has more impacts on the AAC measure. Even a slight nonlinearity in the waveform can induce strong spurious AACs over a wide range of frequencies. The reason for the failure of the method is that the Fourier transform assumes sinusoidal oscillations with constant amplitudes. Even for oscillations at a fixed frequency, the spectral power will spread into a region close to the frequency. Moreover, the Fourier transform constructs a nonlinear waveform using sinusoids not only at the fundamental frequency but also at harmonic frequencies. Thus, although there are no high-frequency oscillations in the original data, the spectrum can have significant powers at high (harmonic) frequencies that are proportional to the power density at the fundamental frequency [43]. As a consequence, when the amplitude of nonlinear oscillations varies (i.e., nonstationary oscillations), spurious AACs appear. We note that the similar Fourier-related limitations can also lead to spurious phase synchronization [44,45].
To overcome the limitations of the Fourier transform, we propose the IMAAC that is based on the empirical mode decomposition (EMD). The new method has a much better performance than the Fourier-based method in terms of avoiding spurious AACs. The advantage comes from the ability of the EMD in extracting/separating oscillations from a noisy signal without losing the amplitude information. The IMAAC is also suitable for nonlinear oscillations to certain degree, e.g., no spurious AACs even when the ascending segment is nine times long of the descending segment in an asymmetric cycle.
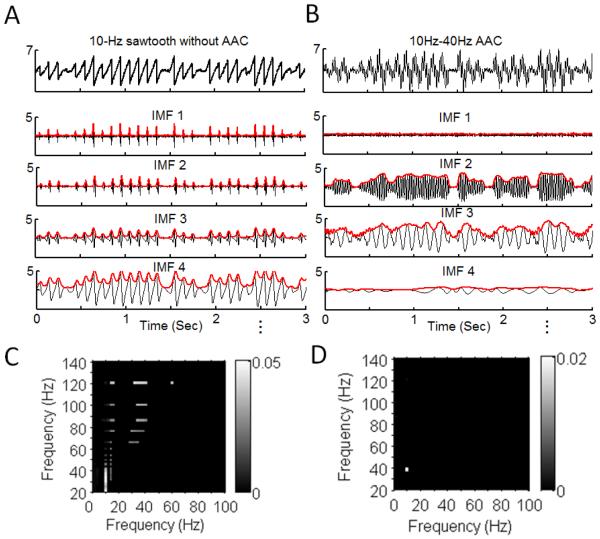
It is important to note that the IMACC eventually fails when nonlinearity becomes too strong, i.e., as occurred to sawtooth waveforms with sharp edges [46,47]. This is expected because EMD cannot preserve spikes or shape edges in IMFs despite its tolerance to nonlinearity. A previous study has demonstrate that sharp edges also affect the detection of another type of CFC, leading to spurious PACs [48]. Currently, there is still no reliable AAC methods that can handle data with spikes or shape edges. Though the co-existence of AACs at harmonics of a certain frequency in the AAC comodulogram can be a ‘warning’ sign for spurious AACs, the most reliable approach to identify the effects of sharp edge is still checking the raw data [22]. However, it may be time consuming if sharp edges are not present in all cycles and all cycles must be visually examined one by one. Our simulations indicate that checking the EMD-derived IMFs of raw data and their instantaneous amplitudes (or envelopes) may be an easier way to identify shape edges. Specifically, sharp edges (or spikes) will lead to peaks in the amplitude envelope of the IMF at the frequency of the oscillation with the shape edges, i.e., the envelope oscillates at the same frequency (intra-wave variations); and the same sharp edges (or spikes) will generate high-amplitude oscillations at the relatively same time location in all IMFs at higher frequencies (Fig. 6A). Such intra-wave variations with simultaneous appearances of high-amplitude oscillations in multiple IMFs are normally absent in signals with real AACs (Fig. 6B, 6D) and can be easily visualized, thus providing a great hint for spurious AACs (Fig. 6C).
Fig.6.
Comparison of IMAAC results for signals with spurious and true AACs. (A, B) IMFs and(C, D) AACC of (A) a sawtooth wave (10 Hz) without AAC and (B) a synthetic signal with AAC between two sinusoids (10 Hz and 40 Hz). In both signals, the amplitudes of oscillations are modulated by the same arbitrary nonstationary amplitude.
The main purpose of this short communication is to demonstrate the difficulties in avoiding the detection of spurious AAC in nonstationary, nonlinear oscillatory signals. The proposed IMACC appears more resilient to effects of nonstationarity and nonlinearity as compared to the Fourier-based AAC measure. Note that our results are based on the examinations using one type of nonstationarites (i.e.., random amplitude) and one type of nonlinearities (i.e., asymmetry). It is important for the follow-up studies to test and compare the new and traditional AAC measures using different types of nonstationarities such as unstable frequency and different types of nonlinearities such as logistic map and duffing oscillator. Moreover, in addition to cross-frequency coupling between certain frequencies, other types of couplings that do not depend on specific frequency oscillations may be present in physical and physiological systems [49,50]. Checking how nonlinearity and nonstationary affect different coupling measures is warranted in future studies.
Supplementary Material
Highlights.
Nonstationary oscillations can induce spurious amplitude-amplitude coupling (AAC).
Nonlinear waveform can induce spurious AAC.
The EMD-based AAC method performs better than the Fourier-based AAC method.
Acknowledgments
This research was sponsored by the Ministry of Science and Technology (Taiwan, R.O.C.; Grants NSC 104-3115-E-008-001, 103-2321-B-008-003, 103-2221-E-008-006-MY3), joint foundation of Cathay General Hospital and National Central University (Grants CNJRF-101CGH-NCU-A4 and VGHUST105-G7-4-2), and grants from NIH (R00HL102241, P01AG009975, and R01 AG048108-01A1).
Footnotes
Publisher's Disclaimer: This is a PDF file of an unedited manuscript that has been accepted for publication. As a service to our customers we are providing this early version of the manuscript. The manuscript will undergo copyediting, typesetting, and review of the resulting proof before it is published in its final citable form. Please note that during the production process errors may be discovered which could affect the content, and all legal disclaimers that apply to the journal pertain.
Reference
- [1].Buchman TG. The community of the self. Nature. 2002;420:246–251. doi: 10.1038/nature01260. [DOI] [PubMed] [Google Scholar]
- [2].Goldberger AL, Amaral LAN, Hausdorff JM, Ivanov PC, Peng CK, Stanley HE. Fractal dynamics in physiology: Alterations with disease and aging. Proc. Natl. Acad. Sci. 2002;99:2466–2472. doi: 10.1073/pnas.012579499. [DOI] [PMC free article] [PubMed] [Google Scholar]
- [3].Hu K, Someren EJWV, Shea SA, Scheer FAJL. Reduction of scale invariance of activity fluctuations with aging and Alzheimer’s disease: Involvement of the circadian pacemaker. Proc. Natl. Acad. Sci. 2009;106:2490–2494. doi: 10.1073/pnas.0806087106. [DOI] [PMC free article] [PubMed] [Google Scholar]
- [4].Hu K, Harper DG, Shea SA, Stopa EG, Scheer FAJL. Noninvasive fractal biomarker of clock neurotransmitter disturbance in humans with dementia. Sci. Rep. 2013;3:2229. doi: 10.1038/srep02229. [DOI] [PMC free article] [PubMed] [Google Scholar]
- [5].Lin LY, Lo MT, Ko PCI, Lin C, Chiang WC, Liu YB, Hu K, Lin JL, Chen WJ, Ma MHM. Detrended fluctuation analysis predicts successful defibrillation for out-of-hospital ventricular fibrillation cardiac arrest. Resuscitation. 2010;81:297–301. doi: 10.1016/j.resuscitation.2009.12.003. [DOI] [PubMed] [Google Scholar]
- [6].Gu C, Coomans CP, Hu K, Scheer FAJL, Stanley HE, Meijer JH. Lack of exercise leads to significant and reversible loss of scale invariance in both aged and young mice. Proc. Natl. Acad. Sci. 2015;112:2320–2324. doi: 10.1073/pnas.1424706112. [DOI] [PMC free article] [PubMed] [Google Scholar]
- [7].Lo MT, Chang YC, Lin C, Young HWV, Lin YH, Ho YL, Peng CK, Hu K. Outlier-resilient complexity analysis of heartbeat dynamics. Sci. Rep. 2015;5:8836. doi: 10.1038/srep08836. [DOI] [PMC free article] [PubMed] [Google Scholar]
- [8].Yeh JR, Peng CK, Lo MT, Yeh CH, Chen SC, Wang CY, Lee PL, Kang JH. Investigating the interaction between heart rate variability and sleep EEG using nonlinear algorithms. J. Neurosci. Methods. 2013;219:233–239. doi: 10.1016/j.jneumeth.2013.08.008. [DOI] [PubMed] [Google Scholar]
- [9].Canolty RT, Knight RT. The functional role of cross-frequency coupling. Trends Cogn. Sci. 2010;14:506–515. doi: 10.1016/j.tics.2010.09.001. [DOI] [PMC free article] [PubMed] [Google Scholar]
- [10].Schnitzler A, Gross J. Normal and pathological oscillatory communication in the brain. Nat. Rev. Neurosci. 2005;6:285–296. doi: 10.1038/nrn1650. [DOI] [PubMed] [Google Scholar]
- [11].Canolty RT, Edwards E, Dalal SS, Soltani M, Nagarajan SS, Kirsch HE, Berger MS, Barbaro NM, Knight RT. High gamma power is phase-locked to theta oscillations in human neocortex. Science. 2006;313:1626–1628. doi: 10.1126/science.1128115. [DOI] [PMC free article] [PubMed] [Google Scholar]
- [12].Axmacher N, Henseler MM, Jensen O, Weinreich I, Elger CE, Fell J. Cross-frequency coupling supports multi-item working memory in the human hippocampus. Proc. Natl. Acad. Sci. 2010;107:3228–3233. doi: 10.1073/pnas.0911531107. [DOI] [PMC free article] [PubMed] [Google Scholar]
- [13].Scheffzük C, Kukushka VI, Vyssotski AL, Draguhn A, Tort ABL, Brankačk J. Selective coupling between theta phase and neocortical fast gamma oscillations during REM-sleep in mice. PloS One. 2011;6:e28489. doi: 10.1371/journal.pone.0028489. [DOI] [PMC free article] [PubMed] [Google Scholar]
- [14].Szczepanski SM, Crone NE, Kuperman RA, Auguste KI, Parvizi J, Knight RT. Dynamic changes in phase-amplitude coupling facilitate spatial attention control in fronto-parietal cortex. PLoS Biol. 2014;12:e1001936. doi: 10.1371/journal.pbio.1001936. [DOI] [PMC free article] [PubMed] [Google Scholar]
- [15].Siegel M, Warden MR, Miller EK. Phase-dependent neuronal coding of objects in short-term memory. Proc. Natl. Acad. Sci. 2009;106:21341–21346. doi: 10.1073/pnas.0908193106. [DOI] [PMC free article] [PubMed] [Google Scholar]
- [16].Müller M, Baier G, Galka A, Stephani U, Muhle H. Detection and characterization of changes of the correlation structure in multivariate time series. Phys. Rev. E Stat. Nonlin. Soft Matter Phys. 2005;71:046116. doi: 10.1103/PhysRevE.71.046116. [DOI] [PubMed] [Google Scholar]
- [17].Gans F, Schumann AY, Kantelhardt JW, Penzel T, Fietze I. Cross-modulated amplitudes and frequencies characterize interacting components in complex systems. Phys. Rev. Lett. 2009;102:098701. doi: 10.1103/PhysRevLett.102.098701. [DOI] [PubMed] [Google Scholar]
- [18].Chen Z, Hu K, Stanley HE, Novak V, Ivanov PC. Cross-correlation of instantaneous phase increments in pressure-flow fluctuations: Applications to cerebral autoregulation. Phys. Rev. E. 2006;73:031915. doi: 10.1103/PhysRevE.73.031915. [DOI] [PMC free article] [PubMed] [Google Scholar]
- [19].Tort ABL, Komorowski R, Eichenbaum H, Kopell N. Measuring Phase-Amplitude Coupling Between Neuronal Oscillations of Different Frequencies. J. Neurophysiol. 2010;104:1195–1210. doi: 10.1152/jn.00106.2010. [DOI] [PMC free article] [PubMed] [Google Scholar]
- [20].Pittman-Polletta B, Hsieh WH, Kaur S, Lo MT, Hu K. Detecting phase-amplitude coupling with high frequency resolution using adaptive decompositions. J. Neurosci. Methods. 2014;226:15–32. doi: 10.1016/j.jneumeth.2014.01.006. [DOI] [PMC free article] [PubMed] [Google Scholar]
- [21].Yeh CH, Young HWV, Wang CY, Wang YH, Lee PL, Kang JH, Lo MT. Quantifying Spasticity with Limited Swinging Cycles using Pendulum Test Based on Phase Amplitude Coupling. IEEE Trans. Neural Syst. Rehabil. Eng. 2016 doi: 10.1109/TNSRE.2016.2521612. [DOI] [PubMed] [Google Scholar]
- [22].Shirvalkar PR, Rapp PR, Shapiro ML. Bidirectional changes to hippocampal theta-gamma comodulation predict memory for recent spatial episodes. Proc. Natl. Acad. Sci. 2010;107:7054–7059. doi: 10.1073/pnas.0911184107. [DOI] [PMC free article] [PubMed] [Google Scholar]
- [23].Hu K, Peng CK, Huang NE, Wu Z, Lipsitz LA, Cavallerano J, Novak V. Altered phase interactions between spontaneous blood pressure and flow fluctuations in type 2 diabetes mellitus: Nonlinear assessment of cerebral autoregulation. Phys. Stat. Mech. Its Appl. 2008;387:2279–2292. doi: 10.1016/j.physa.2007.11.052. [DOI] [PMC free article] [PubMed] [Google Scholar]
- [24].Hu K, Peng CK, Czosnyka M, Zhao P, Novak V. Nonlinear Assessment of Cerebral Autoregulation from Spontaneous Blood Pressure and Cerebral Blood Flow Fluctuations. Cardiovasc. Eng. 2007;8:60–71. doi: 10.1007/s10558-007-9045-5. [DOI] [PMC free article] [PubMed] [Google Scholar]
- [25].Hu K, Lo MT, Peng C. k., Novak V, Schmidt EA, Kumar A, Czosnyka M. Nonlinear Pressure-Flow Relationship Is Able to Detect Asymmetry of Brain Blood Circulation Associated with Midline Shift. J. Neurotrauma. 2009;26:227–233. doi: 10.1089/neu.2008.0643. [DOI] [PMC free article] [PubMed] [Google Scholar]
- [26].Manor BD, Hu K, Peng CK, Lipsitz LA, Novak V. Posturo-respiratory synchronization: Effects of aging and stroke. Gait Posture. 2012;36:254–259. doi: 10.1016/j.gaitpost.2012.03.002. [DOI] [PMC free article] [PubMed] [Google Scholar]
- [27].Hu K, Lo MT, Peng CK, Liu Y, Novak V. A Nonlinear Dynamic Approach Reveals a Long-Term Stroke Effect on Cerebral Blood Flow Regulation at Multiple Time Scales. PLoS Comput Biol. 2012;8:e1002601. doi: 10.1371/journal.pcbi.1002601. [DOI] [PMC free article] [PubMed] [Google Scholar]
- [28].Wang JL, Lim AS, Chiang WY, Hsieh WH, Lo MT, Schneider JA, Buchman AS, Bennett DA, Hu K, Saper CB. Suprachiasmatic neuron numbers and rest–activity circadian rhythms in older humans. Ann. Neurol. 2015;78:317–322. doi: 10.1002/ana.24432. [DOI] [PMC free article] [PubMed] [Google Scholar]
- [29].Lo MT, Novak V, Peng CK, Liu Y, Hu K. Nonlinear phase interaction between nonstationary signals: a comparison study of methods based on Hilbert-Huang and Fourier transforms. Phys. Rev. E Stat. Nonlin. Soft Matter Phys. 2009;79:061924. doi: 10.1103/PhysRevE.79.061924. [DOI] [PMC free article] [PubMed] [Google Scholar]
- [30].Huang NE, Chen X, Lo MT, Wu Z. On hilbert spectral representation: a true time-frequency representation for nonlinear and nonstationary data. Adv. Adapt. Data Anal. 2011;03:63–93. [Google Scholar]
- [31].Yeh CH, Hung CY, Wang YH, Hsu WT, Chang YC, Yeh JR, Lee PL, Hu K, Kang JH, Lo MT. Novel application of a Wii remote to measure spasticity with the pendulum test: Proof of concept. Gait Posture. 2016;43:70–75. doi: 10.1016/j.gaitpost.2015.10.025. [DOI] [PMC free article] [PubMed] [Google Scholar]
- [32].Huang NE, Shen Z, Long SR, Wu MC, Shih HH, Zheng Q, Yen NC, Tung CC, Liu HH. The empirical mode decomposition and the Hilbert spectrum for nonlinear and non-stationary time series analysis. Proc. R. Soc. Lond. Math. Phys. Eng. Sci. 1998;454:903–995. [Google Scholar]
- [33].Lo MT, Hu K, Liu Y, Peng CK, Novak V. Multimodal Pressure Flow Analysis: Application of Hilbert Huang Transform in Cerebral Blood Flow Regulation. EURASIP J. Adv. Signal Process. 2008;2008:785243. doi: 10.1155/2008/785243. [DOI] [PMC free article] [PubMed] [Google Scholar]
- [34].Wu Z, Huang NE. Ensemble empirical mode decomposition: a noise-assisted data analysis method. Adv. Adapt. Data Anal. 2009;01:1–41. [Google Scholar]
- [35].Wang YH, Yeh CH, Young HWV, Hu K, Lo MT. On the computational complexity of the empirical mode decomposition algorithm. Phys. Stat. Mech. Its Appl. 2014;400:159–167. [Google Scholar]
- [36].Wang G, Chen XY, Qiao FL, Wu Z, Huang NE. On intrinsic mode function. Adv. Adapt. Data Anal. 2010;02:277–293. [Google Scholar]
- [37].Horvatic D, Stanley HE, Podobnik B. Detrended cross-correlation analysis for non-stationary time series with periodic trends. EPL Europhys. Lett. 2011;94:18007. [Google Scholar]
- [38].Stratonovich RL. Topics in the Theory of Random Noise. CRC Press; 1967. [Google Scholar]
- [39].Hurst H. Long-term storage capacity of reservoirs. Trans Amer Soc Civ. Eng. 1951;116:770–808. [Google Scholar]
- [40].Podobnik B, Horvatic D, Lam Ng A, Eugene Stanley H, Ivanov PC. Modeling long-range cross-correlations in two-component ARFIMA and FIARCH processes. Phys. Stat. Mech. Its Appl. 2008;387:3954–3959. [Google Scholar]
- [41].Podobnik B, Grosse I, Horvatić D, Ilic S, Ivanov PC, Stanley HE. Quantifying cross-correlations using local and global detrending approaches. Eur. Phys. J. B. 2009;71:243–250. [Google Scholar]
- [42].He BJ, Zempel JM, Snyder AZ, Raichle ME. The temporal structures and functional significance of scale-free brain activity. Neuron. 2010;66:353–369. doi: 10.1016/j.neuron.2010.04.020. [DOI] [PMC free article] [PubMed] [Google Scholar]
- [43].Schiff SJ, Colella D, Jacyna GM, Hughes E, Creekmore JW, Marshall A, Bozek-Kuzmicki M, Benke G, Gaillard WD, Conry J, Weinstein SR. Brain chirps: spectrographic signatures of epileptic seizures. Clin. Neurophysiol. Off. J. Int. Fed. Clin. Neurophysiol. 2000;111:953–958. doi: 10.1016/s1388-2457(00)00259-5. [DOI] [PubMed] [Google Scholar]
- [44].Xu L, Chen Z, Hu K, Stanley HE, Ivanov PC. Spurious detection of phase synchronization in coupled nonlinear oscillators. Phys. Rev. E. 2006;73:065201. doi: 10.1103/PhysRevE.73.065201. [DOI] [PubMed] [Google Scholar]
- [45].Bartsch RP, Schumann AY, Kantelhardt JW, Penzel T, Ivanov PC. Phase transitions in physiologic coupling. Proc. Natl. Acad. Sci. 2012;109:10181–10186. doi: 10.1073/pnas.1204568109. [DOI] [PMC free article] [PubMed] [Google Scholar]
- [46].Tort ABL, Scheffer-Teixeira R, Souza BC, Draguhn A, Brankačk J. Theta-associated high-frequency oscillations (110-160Hz) in the hippocampus and neocortex. Prog. Neurobiol. 2013;100:1–14. doi: 10.1016/j.pneurobio.2012.09.002. [DOI] [PubMed] [Google Scholar]
- [47].Skaggs WE, McNaughton BL, Permenter M, Archibeque M, Vogt J, Amaral DG, Barnes CA. EEG sharp waves and sparse ensemble unit activity in the macaque hippocampus. J. Neurophysiol. 2007;98:898–910. doi: 10.1152/jn.00401.2007. [DOI] [PubMed] [Google Scholar]
- [48].Kramer MA, L. Tort AB, Kopell NJ. Sharp edge artifacts and spurious coupling in EEG frequency comodulation measures. J. Neurosci. Methods. 2008;170:352–357. doi: 10.1016/j.jneumeth.2008.01.020. [DOI] [PubMed] [Google Scholar]
- [49].Bashan A, Bartsch RP, Kantelhardt JW, Havlin S, Ivanov PC. Network physiology reveals relations between network topology and physiological function. Nat. Commun. 2012;3:702. doi: 10.1038/ncomms1705. [DOI] [PMC free article] [PubMed] [Google Scholar]
- [50].Bartsch RP, Liu KKL, Bashan A, Ivanov PC. Network Physiology: How Organ Systems Dynamically Interact. PLoS One. 2015;10:e0142143. doi: 10.1371/journal.pone.0142143. [DOI] [PMC free article] [PubMed] [Google Scholar]
Associated Data
This section collects any data citations, data availability statements, or supplementary materials included in this article.


