

Abstract
Rationale
Circulating glycoprotein N-acetyl glucosamine residues have recently been associated with incident cardiovascular disease (CVD) and diabetes mellitus.
Objective
Using a plasma glycan biosignature (GlycA) to identify circulating N-acetyl glycan groups, we examined the longitudinal association between GlycA and mortality among initially-healthy individuals.
Methods and Results
We quantified GlycA by 400 MHz 1H nuclear magnetic resonance (NMR) spectroscopy in 27,524 participants in the Women's Health Study (WHS; NCT00000479). The primary outcome was all-cause mortality. We replicated the findings in an independent cohort of 12,527 individuals in the JUPITER trial (NCT00239681). We also undertook secondary examination of CVD and cancer mortality in WHS. In WHS, during 524,515 person-years of follow-up (median 20.5 years) there were 3,523 deaths. Risk-factor adjusted multivariable Cox proportional hazard ratio (95% confidence interval) per standard deviation increment in GlycA for all-cause mortality was significantly increased at 5-years (1.21 [1.06, 1.40]) and during maximal follow-up (1.14 [1.09, 1.16]). Similar risk for all-cause mortality was observed in the replication cohort (1.33 [1.21, 1.45]). In WHS, risk of CVD mortality was increased at 5-years (1.43 [1.05, 1.95]) and during maximal follow-up (1.15 [1.04, 1.26]); and of cancer mortality at 5-years (1.23 [1.02, 1.47]) and during maximal follow-up (1.08 [1.01, 1.16]). Examination of correlations and mortality associations adjusted for hsCRP, fibrinogen, and ICAM-1, suggested that GlycA reflects summative risk related to multiple pathways of systemic inflammation.
Conclusions
Among initially-healthy individuals, elevated baseline circulating glycoprotein N-acetyl methyl groups were associated with longitudinal risk of all-cause, cardiovascular, and cancer mortality.
Keywords: Cancer, cardiovascular disease risk factors, glycoprotein acetyls, metabolomics, mortality, NMR spectroscopy
Introduction
Post-translational modification of secreted proteins via enzymatic glycosylation – the regulated enzymatic attachment of oligosaccharide (sugar) moieties – is important for regulating protein trafficking, function, folding and stability, and biosynthetic control,1, 2 particularly of secreted inflammatory proteins and immune mediators.3 Quantifying and delineating the human glycome in health and disease has received increasing interest as a novel tool to identify markers of disease and potential mechanistic mediators of disease pathogenesis.4-7 Recently, we identified an association between a glycoprotein N-acetyl methyl group signature measured by proton nuclear magnetic resonance spectroscopy (1H NMR), termed GlycA, and incident cardiovascular disease (CVD) and diabetes.8, 9 GlycA identifies the concentration of circulating protein-bound N-acetyl methyl groups of N-acetylglucosmine (GlcNAc) and N-acetylgalatosamine glycan moieties based on an 1H NMR signal arising at 2.00 (±0.01) ppm in the lipoprotein profile spectrum (Supplemental Figure I).10-12 In the current study, we sought to determine the potential divergence between health and disease associated with GlycA over an extended follow-up. To identify potentially common pathways of disease across several disease states, we looked at common causes of death, including all-cause mortality, CVD mortality, as well as cancer mortalities.
Since GlycA identifies aggregates of glycan residues on circulating glycoproteins, and given that the majority of circulating glycoproteins are acute phase reactants (APRs) and immunologic proteins, we hypothesized that a large proportion of the potential risk associated with elevated GlycA would be due to activation of systemic inflammatory pathways. To investigate what potential risk was predicted beyond known inflammatory pathways, we compared the mortality risks associated with GlycA to those of targeted circulating APRs. We also looked at risk associated with GlycA under conditions where other circulating APRs were not elevated. Finally, to adjust the risks associated with GlycA for the extent of systemic inflammation, we performed multivariable adjustment for high-sensitivity C-reactive protein (hsCRP). Overall, we hypothesized that GlycA would identify mortality risks which overlapped with those predicted by biomarkers of inflammation, but also potentially attributable to additional pathways of risk, relating perhaps to alternate inflammatory pathways or protein glycosylation itself.
Methods
Study population
The study population was derived from participants in the Women's Health Study (WHS), a completed randomized controlled trial of aspirin, β-carotene, or vitamin E versus placebo in the prevention of CVD and cancer.13-15 The study enrolled 39,876 women aged 45 years or older and free of self-reported CVD or cancer at study entry (1993-1996). Within the trial timeframe (ending in 2004), there was no significant effect of aspirin, β-carotene, nor vitamin E on primary endpoints, although some secondary endpoints were significant during the trial and/or extended follow-up.16 Baseline GlycA level was measured in 27,524 consenting WHS participants who agreed to non-compulsory blood sample collection. After trial completion, extended post-trial follow-up of participants remains on-going (though mailings, questionnaires, phone interviews, and national death index [NDI] surveillance), with follow-up reported herein through 2014. Women could opt-out of post-trial follow-up at the first post-trial follow-up questionnaire collected in 2005-2006, although 33,682 of the initial 39,876 participants (84.5%) agreed to participate in post-trial follow-up.
GlycA measurement
The identification and characterization of GlycA was recently described,10 building on previous 1H NMR observations.12 Briefly, the plasma 400 MHz 1H NMR signal at 2.00 ppm has been previously attributed to an amalgamation of resonances from a subset of mobile GlcNAc residues on the bi-, tri-, and tetra-antennary glycan branches of circulating glycoproteins (Supplemental Figure I). This signal only arises from the GlcNAc units with β1→2 and β1→6 linkages on preceding mannose sugars.
This signal quantifies one of the more common glycosylation residues, and hence multiple N-GlcNAc labeled proteins contribute to this resonance signal. The most abundant circulating glycoproteins are APRs and immunologic proteins (e.g. immunoglobulins), and comparison of GlycA to the resonance spectra of targeted proteins identified the predominant contributors to the GlycA signal as α1-acid glycoprotein, haptoglobin, α1-antitrypsin, α1-antichymotrypsin, and transferrin.10, 12 IgG and fibrinogen, although common in plasma, contain only structurally immobilized glycan chains which will not give rise to narrow detectable NMR signals and hence do not contribute to the GlycA resonance spectrum, and nor does α2-macroglobulin.10 Although other glycoproteins may contribute to a small extent, the detection sensitivity of 1H NMR under the conditions of measurement is approximately 20 μmol/L, and hence circulating glycoproteins below this concentration (including hsCRP) are not detected by 1H NMR. Importantly, the balance and distribution of proteins contributing N-acetyl methyl resonances to GlycA is dynamic and reflects underlying physiologic conditions – changes in GlycA composition and quantity depend on multiple protein regulatory mechanisms.
NMR LipoProfile spectra were acquired on EDTA plasma samples obtained during the trial and stored in vapor-phase liquid nitrogen (−170°C). The GlycA deconvolution algorithm was then applied to the stored NMR LipoProfile spectra to obtain GlycA concentrations for this study. At the time of initial NMR, a 90° pulse was used with a 1.0 sec acquisition time and 3.0 sec relaxation delay during which water presaturation was applied. The pulse repetition rate of 4.0 sec was slightly less than 5T1; however, the T1 values of GlycA in different serum samples are very similar, and thus this translates to minimal differential attenuation of the GlycA signal, and hence has a negligible effect on quantification. Separation of the GlycA signal from the neighboring lipoprotein shoulder (prominently reflecting the triglyceride concentration in very-low-density lipoprotein) was done through deconvolution. Cox models were also adjusted for triglyceride concentration to assure that we accounted for any potential signal overlap. The NMR analysis and deconvolution were performed by LipoScience (now LabCorp; Raleigh, NC), as an adjunct to the LipoProfile-3 assay. The data were provided to the investigators at no additional cost.
Other laboratory measurements
Measurement of hsCRP was performed by high-sensitivity immunoturbidimetric assay on the Hitachi 917 autoanalyzer (Roche Diagnostics), with reagents and calibrators from Denka Seiken, as described previously.17 Lipid measurements were performed in a laboratory certified by the Lipid Standardization Program of the National Heart, Lung, and Blood Institute (NHLBI)/Centers for Disease Control and Prevention. Low-density lipoprotein cholesterol (LDLc) was measured by a homogenous direct method (Roche Diagnostics; Indianapolis, IN).18 High density lipoprotein cholesterol (HDLc) was measured by direct enzymatic colorimetric assays. Triglycerides were measured enzymatically with correction for endogenous glycerol. Soluble intracellular adhesion molecule 1 (ICAM-1) was measured using an enzyme-linked immunosorbent assay (R&D Systems, Minneapolis, MN) and fibrinogen was measured using an immunoturbidimetric assay (Kamiya Biomedical, Seattle, WA).19 Lp-PLA2 mass was measured by a latex particle–enhanced turbidimetric immunoassay run on the Roche P-modular analyzer (PLACTM test, diaDexus, San Francisco, CA).20
Mortality outcomes
All-cause mortality in WHS was the primary outcome. All-cause mortality was ascertained through a combination of endpoints committee adjudication (53%), death certificate (16.4%), National Death Index (4.4%), and “other” (communication with family, employers, acquaintances; 26%). Cause-specific mortality in WHS was examined, including CVD and cancer (including subtypes) deaths, which were ascertained based on only endpoints committee adjudication and death certificate to limit potential for misclassification. Previous studies in similar cohorts have found a sensitivity of nosologists at accurately determining cause of death at 90%, with specificity >95%,21 hence death certificate-determined causes of death as classified were felt to be reliable. There no appreciable demographic differences among those with and without a known cause of mortality. CVD mortality was defined as death due to myocardial infarction, stroke, peripheral vascular disease, valvular heart disease, or other CVD. Cancer mortality was further sub-divided into mortality due to colon cancer, breast cancer, pancreatic cancer, and lung cancer, as determined at the time of endpoints committee adjudication.
Replication cohort
We replicated the all-cause mortality associations in an independent cohort derived from an RCT of rosuvastatin versus placebo (Justification for the Use of statins in Prevention: an Intervention Trial Evaluating Rosuvastatin, JUPITER; NCT00239681) that enrolled 17,802 asymptomatic individuals (women ≥ 60 years, men ≥ 50 years) without prior history of coronary disease, stroke, or diabetes (2003-2006).22 The study allocated participants with low or normal LDL-c (<130 mg/dL) but elevated levels of hsCRP (≥2.0 mg/L) to rosuvastatin versus placebo. There was a 44% relative risk reduction in the primary endpoint and a 20% relative risk reduction in all-cause mortality with rosuvastatin vs. placebo. GlycA was measured with the same assay used in WHS in 12,527 JUPITER participants at baseline, of whom 10,060 also had 1-year measurements. Mortality was ascertained during the trial by endpoints committee adjudication through March 30, 2008.
Statistical analyses
Testing for interactions between GlycA and randomization arms demonstrated no evidence of significant effect modification, nor did stratified analysis of mortality rates by randomization arm. Therefore, the treatment and placebo groups were pooled, and study drug adjusted as a covariable in regression models. Baseline descriptive clinical and biochemical characteristics were analyzed across quartiles of GlycA as medians (25th - 75th percentiles) for quantitative variables and as percentages for qualitative variables. Comparisons across quartiles were assessed with the Kruskal-Wallis test for quantitative variables and with the χ2 test for qualitative variables. All P-values were two-tailed using α=0.05 experiment-wise error. Analyses were done using SAS version 9.3 (Cary, NC), except the all-cause mortality meta-analysis which was done with STATA version 14 (College Station, TX).
The exposure time was calculated as the time from randomization to death or censoring. Cox proportional hazard models were used to calculate hazard ratios (HRs) and 95% confidence intervals (CIs). Regression analyses were presented in crude and adjusted form, based on GlycA standard deviation (SD) increment or quartiles. Adjustment for potential confounders – selected based on prior clinical knowledge – was done sequentially by first including age, race, smoking (current or former), alcohol use (≥1 drink per day), history of hypertension, family history of myocardial infarction (in WHS) or coronary heart disease (in JUPITER), body-mass index, LDLc, HDLc, glycated hemoglobin (HbA1c) in a model, and a subsequent model which additionally included natural log-transformed hsCRP. Risk of all-cause mortality in the replication cohort (JUPITER) was modeled with the same regression models as in WHS. (Inclusion of sex in the JUPITER models did not appreciably alter the primary results and therefore this was not included for consistency.) P for non-linear trend was calculated across quartiles. Risk over time was visually examined with Kaplan Meier survival curves, and the Cox proportional hazard assumption was tested for by including a cross product term for GlycA and time as well as Schoenfeld residuals. Although longitudinal all-cause and cancer mortality risks associated with GlycA in WHS did not violate the proportional hazards assumptions (p=0.08 and p=0.16, respectively, for time interaction), there was evidence that the proportional hazard assumption was not met for CVD mortality over maximum follow-up (p=0.02 by time interaction), although not by Schoenfeld residuals (p=0.09). Based on these observations, and to mirror the 5-year maximum follow-up in the replication cohort (JUPITER), we performed a stratified mortality analysis looking at the 5-year mortality risks associated with GlycA in WHS, as well as over the entire duration of follow-up. Following replication in JUPITER, to analyze the data in aggregate, relative risks of adjusted mortality were compared per SD increment in GlycA with summary HRs (95% CIs) and visually using Forest plots, pooled using inverse variance weighting and random effects meta-analysis models to create summary estimates. Although there was minimal evidence of between-study heterogeneity comparing outcomes during maximum follow-up (heterogeneity χ2 p=0.083; I2=66.6%) and during 5 year follow-up (heterogeneity χ2 p=0.937; I2=0.0%), random effects models were employed to better account for potential inter-study heterogeneity.
To understand what risk remained associated with GlycA beyond known inflammatory biomarkers, we performed several post hoc sensitivity analyses in addition to adjusting risk models for hsCRP. First, given that statins have anti-inflammatory effects,23 we compared all-cause mortality risks once on-treatment in JUPITER between GlycA and hsCRP in the rosuvastatin-allocated group. Second, we adjusted risk models for hsCRP, as well as the all-cause model for fibrinogen and ICAM-1. Additionally, we examined mortality risk in WHS associated with GlycA when hsCRP was <25th percentile, and conversely examined mortality risk associated with hsCRP when GlycA was <25th percentile. Finally, Spearman correlations were used to examine correlations of GlycA with hsCRP, fibrinogen, IL6, TNF-αR2, ICAM-1, sPLA2, and LpPLA2 mass.
Role of the funding source
WHS was funded by the National Heart Lung and Blood Institute (NHLBI) and the National Cancer Institute (NCI). The JUPITER trial was funded by AstraZeneca. These agencies had no role in the design and execution of the current study. LipoScience (now LabCorp; Raleigh, NC) performed the analysis of GlycA based on LipoProfile-3 at no additional cost to the studies. All analyses herein were specified a priori by the investigators through a written detailed analysis plan, with the exception of several exploratory analyses which were performed in response to the study findings (the on-statin risk comparisons in JUPITER and the hsCRP-GlycA discordance analysis in WHS).
Results
Study Population (WHS)
WHS study participants included in the current study had a median [IQR] age of 53 [49, 59] years at baseline. Stratification by GlycA quartile suggested that several co-morbid conditions were more prevalent among those with higher levels of GlycA (Table 1). Similarly, levels of hsCRP were incrementally higher in higher quartiles of GlycA. Conversely, alcohol consumption (≥1 drink per day) showed an inverse relationship with GlycA levels.
Table 1.
Baseline clinical and biochemical variables by GlycA quartile in WHS.
| Quartiles of GlycA, umol/L | ||||
|---|---|---|---|---|
| ≤326 (n=6,996) | 326-369 (n=6,802) | 369-416 (n=6,875) | >416 (n=6,851) | |
| Age, years | 51 (48, 57) | 53 (49, 59) | 54 (50, 60) | 54 (50, 60) |
|
| ||||
| Race/ethnicity, % | ||||
|
| ||||
| White | 95 | 96 | 96 | 95 |
|
| ||||
| Black | 1.7 | 1.7 | 1.6 | 2.5 |
|
| ||||
| Asian | 2.5 | 1.3 | 1.1 | 0.6 |
|
| ||||
| Hispanic | 1.0 | 1.2 | 1.1 | 1.0 |
|
| ||||
| Other/unknown | 0.3 | 0.3 | 0.5 | 0.5 |
|
| ||||
| BMI, kg/m2 | 23 (21, 25) | 24 (22, 27) | 26 (23, 29) | 28 (25, 32) |
|
| ||||
| Hypertension, % | 14 | 21 | 27 | 39 |
|
| ||||
| Diabetes, % | 1.1 | 1.7 | 2.4 | 5.5 |
|
| ||||
| HbA1c, % | 4.9 (4.8, 5.1) | 5.0 (4.8, 5.2) | 5.0 (4.9, 5.2) | 5.1 (4.9, 5.3) |
|
| ||||
| hsCRP, mg/L | 0.7 (0.4, 1.5) | 1.5 (0.7, 2.9) | 2.6 (1.4, 4.6) | 5.1 (2.8, 8.3) |
|
| ||||
| Family history MI, % | 13 | 14 | 14 | 16 |
|
| ||||
| LDL-c, mg/dL | 113 (94, 133) | 121 (101, 144) | 126 (104, 148) | 129 (106, 152) |
|
| ||||
| HDL-c, mg/dL | 57 (48, 68) | 53 (45, 64) | 50 (42, 60) | 47 (39, 56) |
|
| ||||
| Triglycerides, mg/dL | 86 (65, 116) | 111 (82, 154) | 133 (97, 186) | 168 (120, 236) |
|
| ||||
| Fibrinogen, mg/dL | 314 (279, 350) | 341 (304, 384) | 362 (321, 409) | 402 (353, 457) |
|
| ||||
| ICAM-1, ng/ml | 317 (281, 360) | 337 (297, 383) | 350 (308, 400) | 373 (328, 429) |
|
| ||||
| Smoker*, % | 44 | 48 | 50 | 51 |
|
| ||||
| Alcohol†, % | 12 | 12 | 10 | 7 |
Abbreviations: BMI = body-mass index, HbA1c = hemoglobin A1c, HDL-c = high density lipoprotein cholesterol, hsCRP = high sensitivity C-reactive protein, ICAM-1 = intercellular adhesion molecule 1, LDL-c = low density lipoprotein cholesterol, MI = myocardial infarction. Data presented as median (25th, 75th percentile) otherwise as percent where indicated.
Current or former.
Alcohol consumption ≥1 drink/day.
All variables were p≤0.0001 across quartiles.
All-cause mortality
Among the 27,524 WHS participants, 3,523 deaths occurred over a median (maximum) 20.5 (21.7) years, representing 524,515 person-years of follow-up. The adjusted (for clinical risk factors) HR (95% CI) per SD (68.4 μmol/L) increment in GlycA for all-cause mortality was significantly increased, at 5-years (1.21 [1.06, 1.40]; 255 events) and during maximal follow-up (1.14 [1.09, 1.18]; Table 2; Figure 1). This risk remained significant after incrementally adjusting for hsCRP. Risk of all-cause mortality increased progressively at higher quartiles of GlycA (Figure 2a).
Table 2.
Association of baseline GlycA with subsequent mortality among 27,524 participants in the WHS.
| Hazard Ratio per Standard Deviation∞ (95% Confidence Interval) | ||||
|---|---|---|---|---|
| Mortality | Events | Unadjusted | Adjusted for Clinical Variables‡ | Adjusted for Clinical Variables and hsCRP§ |
| 5-Year Follow-Up | ||||
|
| ||||
| All-Cause | 255 | 1.38 (1.23, 1.55)* | 1.21 (1.06, 1.40)† | 1.23 (1.04, 1.44)† |
|
| ||||
| Cardiovascular | 46 | 1.80 (1.40, 2.31)* | 1.43 (1.05, 1.95)† | 1.41 (0.99, 2.01) |
|
| ||||
| Cancer | ||||
|
| ||||
| All | 149 | 1.31 (1.12, 1.52)† | 1.23 (1.02, 1.47)† | 1.23 (1.00, 1.52)† |
|
| ||||
| Breast | 11 | 1.07 (0.60, 1.92) | 0.94 (0.46, 1.91) | 0.77 (0.35, 1.72) |
|
| ||||
| Lung | 40 | 1.48 (1.11, 1.96)† | 1.34 (0.95, 1.89) | 1.10 (0.74, 1.64) |
|
| ||||
| Colorectal | 20 | 1.56 (1.05, 2.32† | 1.93 (1.21, 3.06)† | 2.64 (1.55, 4.52)† |
|
| ||||
| Pancreatic | 20 | 1.18 (0.77, 1.80) | 0.79 (0.47, 1.32) | 0.87 (0.49, 1.53) |
|
| ||||
| Complete Follow-Up¦ | ||||
|
| ||||
| All-Cause | 3,523 | 1.29 (1.25, 1.33)* | 1.14 (1.09, 1.18)* | 1.11 (1.06, 1.16)* |
|
| ||||
| Cardiovascular | 557 | 1.39 (1.29, 1.51)* | 1.15 (1.04, 1.26)† | 1.12 (1.00, 1.25)† |
|
| ||||
| Cancer | ||||
|
| ||||
| All | 1,119 | 1.16 (1.10, 1.23)* | 1.08 (1.01, 1.16)† | 1.02 (0.94, 1.10) |
|
| ||||
| Breast | 136 | 1.13 (0.96, 1.34) | 1.16 (0.95, 1.42) | 1.05 (0.83, 1.32) |
|
| ||||
| Lung | 273 | 1.33 (1.18, 1.48)* | 1.28 (1.12, 1.46)† | 1.11 (0.95, 1.29) |
|
| ||||
| Colorectal | 101 | 1.36 (1.13, 1.63)† | 1.23 (0.98, 1.54) | 1.27 (0.98, 1.64) |
|
| ||||
| Pancreatic | 79 | 1.21 (0.98, 1.50) | 1.08 (0.84, 1.40) | 1.04 (0.78, 1.40) |
Abbreviations: N=number of study participants.
Natural log of hsCRP.
Significance of associations:
P<0.0001,
P≤0.05, otherwise P=non-significant.
SD GlycA in WHS = 68.4 μmol/L.
Median [maximum] follow-up = 20.5 (21.7) years.
Clinical variables include age, race, family history of myocardial infarction, hypertension, smoking, alcohol use, body mass index, HbA1c, LDLc, HDLc, log-transformed triglycerides, and randomization arm.
Figure 1.

Hazard ratio (95% confidence interval) for all-cause mortality (log scale) in the Women's Health Study per-SD increment higher GlycA at 5-years (red) and during maximum available follow-up (blue; median [maximum] follow-up = 20.5 [21.7] years), in unadjusted, clinically-adjusted*, and clinically-adjusted plus hsCRP models. Abbreviation: hsCRP = high sensitivity C-reactive protein. *Adjusted for age, race, family history of myocardial infarction, hypertension, smoking, alcohol use, body mass index, HbA1c, LDLc, HDLc, log-transformed triglycerides, and randomization arm.
Figure 2.
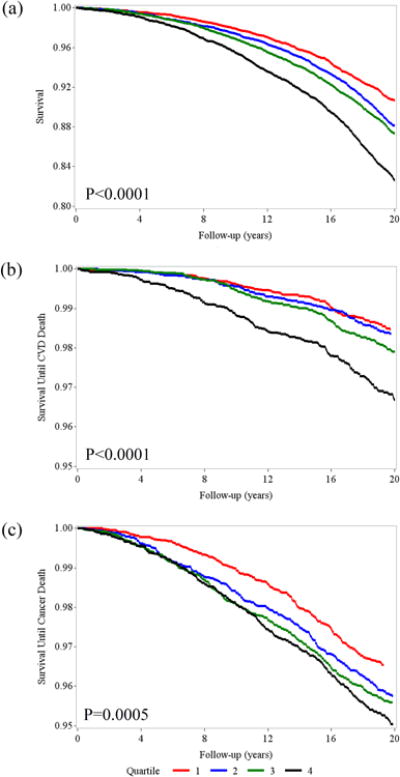
Unadjusted Kaplan-Meier survival curves demonstrating total survival time (a), and survival free of cardiovascular (b) and cancer (c) mortality, by lowest (1) through highest (4) quartile of GlycA in the Women's Health Study. (Note that the survival scale axis ends at 0.95 in [b] and [c].)
CVD mortality
CVD mortality was associated with GlycA levels in WHS (Table 2; Figure 2b). Unadjusted 5-year CVD mortality risk in WHS (n = 46 deaths) was increased per SD increment in GlycA (1.80 [1.40, 2.31]), and this remained statistically significant after adjusting for clinical variables (1.43 [1.05, 1.95]). With incremental adjustment for hsCRP the HR (95% CI) was 1.41 [0.99, 2.01]). Risk during maximum follow-up in WHS (n = 557 deaths) was attenuated but remained significant in all models, including unadjusted (1.39 [1.29, 1.51]), clinically-adjusted (1.15 [1.04, 1.26]), and clinically-adjusted plus hsCRP (1.12 [1.00, 1.25]) models.
Cancer mortality
Cancer mortality was associated with GlycA at 5-years (n = 149 events; HR [95% CI]) in unadjusted (1.31 [1.12, 1.52]), clinically-adjusted (1.23 [1.02, 1.47]), and clinically-adjusted plus hsCRP (1.23 [1.00, 1.52]) models (Table 2; Figure 2c). The results were similar but attenuated at maximal follow-up in WHS (1,119 events; Table 2). Cancer mortality appeared to be related to increases in mortality associated with colorectal cancer (clinically-adjusted model HR [95% CI] per SD increment: 1.93 [1.21, 3.06] at 5-years and 1.23 [0.98, 1.54] during maximal follow-up) and lung cancer (1.34 [0.95, 1.89] at 5-years and 1.28 [1.12, 1.46] during maximal follow-up). There was no association of GlycA with breast or pancreatic cancer mortality.
All-cause mortality replication
Among 12,527 included JUPITER participants (Supplemental Table I), 278 deaths occurred over a median (maximum) 2.0 (4.9) years, representing 28,903 person-years of follow-up. Participants had a median [IQR] age of 66 [60, 71] years, and were 64% male. All-cause mortality risk in JUPITER was increased per SD (70.3 μmol/L) increment in GlycA in all models, with an HR adjusted for clinical variables of 1.33 (1.21, 1.45), and an HR adjusted for clinical variables and hsCRP of 1.24 (1.10, 1.39). This risk resembled the associations observed in WHS.
Meta-analysis
From random effects meta-analysis of the all-cause mortality risks in the WHS and JUPITER cohorts, the pooled adjusted (for clinical variables and hsCRP) HR for all-cause mortality per SD increment in GlycA up to 5-years was 1.24 (95% CI = 1.12, 1.36; Figure 3a), and during maximum available follow-up was 1.16 (1.04, 1.29 Figure 3b).
Figure 3.
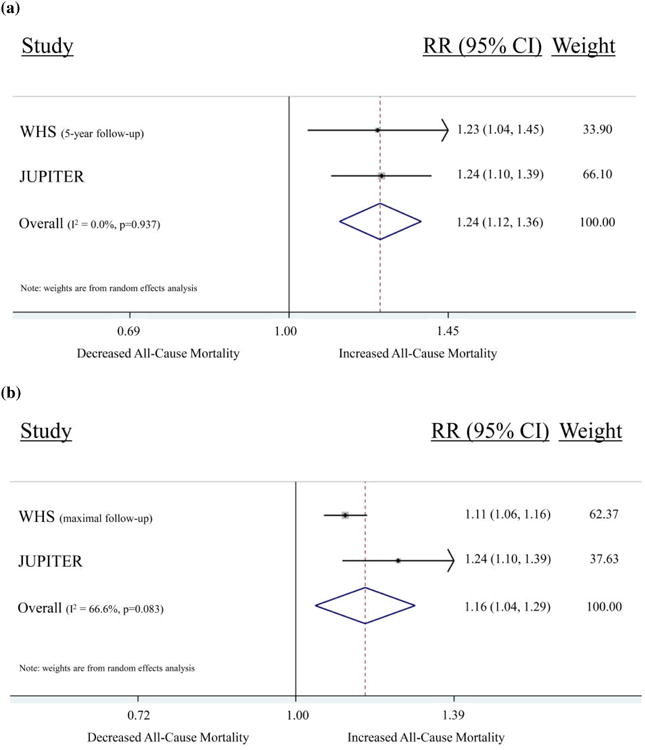
Forrest plots demonstrating the individual and pooled associations (adjusted [for clinical variables and hsCRP] hazard ratio [95% confidence interval]) between GlycA and all-cause mortality in WHS (N=26,634) – at 5-years (a) and during maximum available follow-up (median 20.5 years; [b]) – and JUPITER (N = 12,249), per standard deviation increment in GlycA. Data were pooled using inverse variance random effects meta-analysis models.
Evidence of risk beyond markers of systemic inflammation
We performed several sensitivity analyses to investigate the potential risk associated with GlycA beyond known markers of systemic inflammation. First, we observed correlations that ranged from weak to moderate for GlycA with various inflammatory biomarkers, with the strongest correlation (r=0.61) being with hsCRP (Table 3). Second, given that rosuvastatin 20 mg daily differentially reduced hsCRP (which was 37.1% lower at 1 year in the rosuvastatin arm compared with placebo in the overall JUPITER trial) compared with no appreciable change in GlycA (Supplemental Figure II), we examined on-treatment mortality risk among those in the rosuvastatin-treated arm of JUPITER (N=4,386 individuals) associated with GlycA versus hsCRP. Despite on-statin reductions in hsCRP, GlycA remained strongly associated with all-cause mortality (Supplemental Table II). In models adjusting this GlycA-mortality association for hsCRP level, this risk remained largely unchanged, whereas adjusting the on-treatment mortality risk associated with hsCRP for GlycA level nullified the association between hsCRP and mortality. Third, we compared the all-cause mortality risk associated with GlycA directly to those associated with hsCRP, fibrinogen, and soluble ICAM-1. The magnitude of risk predicted by GlycA for those in the highest quartile was similar to that of hsCRP, although it was stronger for fibrinogen and for ICAM-1 (Table 4). All-cause mortality risk during maximal available remained associated with GlycA after adjustment for clinical variables plus hsCRP or fibrinogen or ICAM-1, but was no longer significant in a model adjusting for clinical variables and all of these three inflammatory biomarkers, for those in the highest (relative to lowest) quartile (1.05 [0.92, 1.19]). In JUPITER, adjustment of the GlycA risk for hsCRP only modestly attenuated risk (and this remained significant), whereas adjusting the hsCRP risk for GlycA had a larger attenuating effect. Finally, we compared mortality risk between GlycA and hsCRP among women with discordant biomarker levels (Supplemental Table III). Specifically, we examined the mortality risk associated with GlycA in WHS when hsCRP was low (≤25th percentile), and compared this with risk associated with hsCRP when GlycA was low (≤25th percentile). Although the pattern of risk was similar, the magnitude of unadjusted risk was higher in the highest quartile for GlycA for all-cause mortality (HR [95% CI] = 2.76 [2.05, 3.73]), CVD mortality (2.89 [1.48, 5.66]), and cancer mortality (1.87 [1.03, 3.40]) than for hsCRP (1.81 [1.28, 2.54], 1.79 [0.82, 3.93], and 0.83 [0.36, 1.88], respectively). In this smaller subgroup analysis the adjusted risk ratios were no longer significant, except for the association between GlycA and all-cause mortality (p=0.013).
Table 3.
Spearman correlations between GlycA and serum inflammatory cytokines and acute phase reactants in WHS and JUPITER.*
| GlycA, μmol/L | ||||
|---|---|---|---|---|
| WHS | JUPITER | |||
| Biomarker | r | N | r | N |
| hsCRP | 0.61 | 27,490 | 0.46† | 12,527 |
| Fibrinogen | 0.47 | 27,336 | - | - |
| ICAM-1 | 0.30 | 27,325 | - | - |
| IL6 | 0.25 | 355 | - | - |
| TNF-αR2 | 0.04 | 358 | - | - |
| sPLA2 | - | - | 0.31 | 10,380 |
| LpPLA2 mass | - | - | -0.13 | 10,505 |
Abbreviations: hsCRP = high-sensitivity C-reactive protein, ICAM-1 = soluble intracellular adhesion molecule 1, IL6 = interleukin 6, JUPITER = Justification for the Use of statins in Prevention: an Intervention Trial Evaluating Rosuvastatin, LpPLA2 = lipoprotein-associated phospholipase A2 mass, N = number of individuals, r = correlation, sPLA2 = secreted phospholipase A2, TNF-αR2 = tumor necrosis factor-α-receptor II, and WHS = Women's Health Study.
All correlations p<0.0001 except TNF-αR2 where p=0.426.
Baseline correlation, in JUPITER; after 12 months rosuvastatin 20 mg daily, correlation between GlycA and hsCRP was r=0.50 for N=5,473 individuals (p<0.0001).
Table 4.
Comparison of the association of GlycA and hsCRP with all-cause mortality in JUPITER and WHS, and associations between GlycA, hsCRP, fibrinogen, and ICAM-1, and all-cause mortality in WHS,† and association between GlycA and hsCRP with all-cause mortality in the replication cohort.
| Hazard Ratio (95% Confidence Interval) All-Cause Mortality | |||||
|---|---|---|---|---|---|
| Q1 | Q2 | Q3 | Q4 | P for trend | |
| Women's Health Study – Maximum follow-up (No. deaths 3,459/27,284) | |||||
| GlycA | |||||
| Unadjusted | Ref. | 1.28 (1.15, 1.41) | 1.37 (1.24, 1.52) | 1.90 (1.73, 2.10) | <0.0001 |
| Adjusted* | Ref. | 1.03 (0.93, 1.15) | 0.99 (0.89, 1.11) | 1.28 (1.14, 1.43) | <0.0001 |
| Adj.* + hsCRP | Ref. | 1.01 (0.90, 1.12) | 0.94 (0.84, 1.05) | 1.17 (1.04, 1.32) | 0.018 |
| Adj.* + fibrinogen | Ref | 1.00 (0.90, 1.12) | 0.93 (0.84, 1.05) | 1.14 (1.01, 1.28) | 0.055 |
| Adj.* + ICAM-1 | Ref | 1.00 (0.89, 1.11) | 0.95 (0.86, 1.06) | 1.16 (1.04, 1.30) | 0.011 |
| Adj.* + hsCRP + fibrinogen + ICAM-1 | Ref | 0.97 (0.87, 1.08) | 0.90 (0.81, 1.01) | 1.05 (0.92, 1.19) | 0.598 |
| hsCRP | |||||
| Unadjusted | Ref. | 1.33 (1.19, 1.47) | 1.59 (1.44, 1.76) | 1.84 (1.67, 2.03) | <0.0001 |
| Adjusted* | Ref. | 1.04 (0.93, 1.16) | 1.11 (0.99, 1.24) | 1.25 (1.11, 1.40) | <0.0001 |
| Adj.* + GlycA | Ref. | 1.01 (0.90, 1.13) | 1.04 (0.93, 1.16) | 1.11 (0.98, 1.26) | 0.092 |
| Fibrinogen | |||||
| Unadjusted | Ref. | 1.23 (1.10, 1.37) | 1.63 (1.47, 1.81) | 2.44 (2.21, 2.69) | <0.0001 |
| Adjusted* | Ref. | 1.03 (0.92, 1.15) | 1.10 (0.99, 1.23) | 1.34 (1.20, 1.49) | <0.0001 |
| Adj.* + GlycA | Ref. | 1.01 (0.90, 1.13) | 1.06 (0.95, 1.18) | 1.23 (1.09, 1.38) | 0.0001 |
| ICAM-1 | |||||
| Unadjusted | Ref. | 1.25 (1.11, 1.40) | 1.69 (1.52, 1.88) | 2.98 (2.70, 3.30) | <0.0001 |
| Adjusted* | Ref. | 0.97 (0.87, 1.10) | 1.18 (1.06, 1.33) | 1.73 (1.55, 1.92) | <0.0001 |
| Adj.* + GlycA | Ref. | 0.96 (0.85, 1.08) | 1.16 (1.04, 1.30) | 1.67 (1.50, 1.86) | <0.0001 |
| JUPITER (No. deaths 278/12,527) | |||||
| GlycA | |||||
| Unadjusted | Ref. | 1.03 (0.69, 1.53) | 1.26 (0.86, 1.83) | 2.77 (1.99, 3.86) | <0.0001 |
| Adjusted* | Ref. | 1.15 (0.77, 1.73) | 1.39 (0.94, 2.04) | 2.42 (1.71, 3.44) | <0.0001 |
| Adj.* + hsCRP | Ref. | 1.10 (0.74, 1.65) | 1.26 (0.85, 1.87) | 1.97 (1.33, 2.91) | 0.0004 |
| hsCRP | |||||
| Unadjusted | Ref. | 1.23 (0.84, 1.79) | 1.28 (0.87, 1.87) | 2.28 (1.62, 3.23) | <0.0001 |
| Adjusted* | Ref. | 1.29 (0.88, 1.89) | 1.30 (0.89, 1.91) | 2.02 (1.42, 2.87) | <0.0001 |
| Adj.* + GlycA | Ref. | 1.21 (0.83, 1.78) | 1.14 (0.78, 1.69) | 1.45 (0.99, 2.14) | 0.0813 |
Abbreviations: Adj. = adjusted, hsCRP = high-sensitivity C-reactive protein, ICAM-1 = intercellular adhesion molecule 1, JUPITER = Justification for the Use of statins in Prevention: an Intervention Trial Evaluating Rosuvastatin.
Model adjusted for age, race, family history of myocardial infarction (in WHS) or coronary heart disease (in JUPITER), hypertension, smoking, alcohol use, body mass index, HbA1c, LDLc, HDLc, log-transformed triglycerides, and randomization arm.
Among the 27,284 WHS participants in whom all (GlycA, hsCRP, ICAM-1, and fibrinogen) markers were measured.
Discussion
Our study was designed to investigate the longitudinal association between a biomarker of circulating N-acetyl glucosamine residues and total and cause-specific mortality among initially-healthy individuals. Among 27,524 initially healthy individuals with over half a million years of cumulative patient follow-up, we found that GlycA, an 1H NMR-measured aggregate of circulating N-acetyl groups of N-acetylglucosmine and N-acetylgalatosamine glycan moieties, was significantly associated with mortality. Although individuals with elevated GlycA were more likely to have comorbid conditions, most associations remained significant after adjusting for clinical covariates. CVD and cancer mortality were both significantly associated with elevated levels of GlycA. Increased risks of colorectal and lung cancer mortality contributed to the elevated risk of cancer mortality. The 5-year risks in WHS declined but in most cases remained significant in the extended (>20-year) follow-up. The all-cause mortality associations were replicated in an independent cohort of 12,527 individuals. GlycA was at-most moderately associated with established inflammatory biomarkers, but remained an important predictor of mortality even after adjustment for inflammatory biomarkers, as well as in situations where these inflammatory biomarkers were low. Overall, these results identify a robust association with a measure of circulating N-linked glycoprotein acetyls (predominantly linked to APRs) and mortality among initially healthy individuals.
Co- and post-translational modification of secreted proteins via enzymatic glycosylation regulates protein trafficking, protein folding and stability, biosynthetic control, and function.1, 2 The importance of glycosylation in immune regulation has also been clearly demonstrated,2, 3, 7 and an increasing number of studies have highlighted the importance of protein glycosylation in the pathogenesis of atherosclerosis24, 25 and cancer4, 26. The commonality of inflammation and immune function to the pathogenesis of diverse diseases including CVD and some cancers has also been demonstrated.27, 28 Since 1H NMR has previously been shown to identify N-acetyl glycan moieties on circulating blood glycoproteins,10, 12 commonly APRs such as α1-acid glycoprotein, haptoglobin, α1-antitrypsin, α1-antichymotrypsin, and transferrin, we hypothesized that quantification of this glycan biosignature could facilitate identification of risk across a spectrum of diseases including CVD and cancer, to some extent relating to risks associated with systemic inflammation.
The magnitude and distribution of risk associated with GlycA was similar to that observed with established biomarkers of inflammation. Notably, the distribution of cancer mortality risk identified in our study (increased risk of mortality due to colorectal and lung cancer) mirrors previous findings of cancer risk associated with inflammation in other populations.27, 29 Based on these observations and knowledge of the chemical characteristics of GlycA, it appeared that a large component of the risk associated with GlycA related to systemic inflammation. However, correlations between GlycA and inflammatory cytokines and immune modulators (TNF-αR2, IL6, ICAM-1, sPLA2) were weak, and were at most moderate with APRs (hsCRP, fibrinogen). These findings suggest incomplete overlap with the GlycA signal and these markers of systemic inflammation when assessed individually. Furthermore, GlycA remained associated with risk when hsCRP was low, and after statin-induced reductions in hsCRP (but not GlycA), risk remained significantly associated with GlycA and not hsCRP. Differential changes in GlycA and hsCRP in response to statin therapy could relate to the summative nature of GlycA, which could be less prone to alteration in the setting of multiple parallel pathways contributing to its signal. Along these lines, the all-cause mortality risk during maximal available follow-up remained associated with GlycA after adjustment for clinical variables plus hsCRP or fibrinogen or soluble ICAM-1 individually, but no longer in a model adjusting for clinical variables plus all of these three inflammatory biomarkers. Taken together, these findings suggest that GlycA could reflect risk associated with a summation of multiple pathways of systemic inflammation. However, also as evidence by these weak-to-moderate individual correlations, persistence of risk associated with other inflammatory biomarkers – particularly ICAM-1 – after adjustment for GlycA suggests that mortality risks associated with GlycA overlap, but does not fully encompass, those of the inflammatory biomarkers that it reflects. It remains uncertain whether alterations in other biologic pathways could contribute to the GlycA signal.
Few other studies have characterized the clinical risk associated with GlycA. Our group recently described an association with GlycA and incident CVD9 and type II diabetes.8 The association with CVD mortality we observed corroborates these observations, and broadens the potential spectrum of risk. Another recent study examined the association between 1H NMR-measured α-1-acid glycoprotein – one contributor to GlycA under most conditions – and mortality (cardiovascular and non-cardiovascular) in a cohort of healthy Finish individuals.30 Similar to our study, these investigators identified increased mortality risk associated with α-1-acid glycoprotein; our results support and extend these findings.
Our results must be viewed in the context of the study design. First, due to evidence that the mortality risks associated with GlycA in WHS were in some cases not constant over time, and given the shorter follow-up in the replication cohort (JUPITER), we examined the associations at 5-years in WHS, in addition to during maximal follow-up. Second, our glycosylation signal did not identify individual glycoproteins, but rather an aggregate, and this marker is not able to capture the complexities of the dynamic human glycome. However, that GlycA does measure an aggregate is also a strength, as this amalgam would be expected to be less sensitive to day-to-day variation in an individual's glycoprotein milieu. Indeed, GlycA appears to have lower coefficients of variation than traditional biomarkers of inflammation,10 and among the placebo-allocated patients in JUPITER, baseline and 1-year levels of GlycA were more correlated than hsCRP (r=0.66 and 0.47, respectively). Third, we utilized multiple mechanisms of mortality ascertainment, which could potentially lead to misclassification bias. However, all CVD and cancer mortality events were either adjudicated by the WHS endpoint committee or ascertained through death certificates, a practice which has been shown to have high sensitivity and specificity in similar studies,21 and thus was felt to be unlikely to lead to misclassification bias.
In conclusion, among initially-healthy individuals with over 20 years of follow-up, elevated baseline levels of GlycA, a novel biomarker of circulating N-linked glycoprotein acetyls, predicted future total mortality, CVD mortality, and cancer mortality. A large proportion of this risk was attributable to systemic inflammation. It is possible that GlycA could provide broader profiling of systemic inflammation owing to the summative characteristics of this signal; future research is needed along these lines. Additional prospective studies will be valuable in further assessing the relationship between GlycA and clinical outcomes.
Supplementary Material
Novelty and Significance.
What Is Known?
Proton nuclear magnetic resonance (1H NMR) spectroscopy can quantify metabolites circulating in the blood. Recently, a specific NMR signal (GlycA) quantifies the N-acetyl methyls of GlcNAc residues on the antennary branches of circulating glycoproteins, primarily from the acute phase reactants α1-acid glycoprotein, haptoglobin, α1-antitrypsin, α1-antichemotrypsin and transferrin.
Profiling this GlycA signal in relation to diverse disease states could provide insight into a marker and potential mediator of disease risk and it has been recently associated with cardiovascular disease and diabetes mellitus.
What New Information Does This Article Contribute?
Our study demonstrated robust associations with all-cause mortality, including both cardiovascular and cancer mortality.
Furthermore, the risks related to this NMR glycan signal overlapped with those associated with several pathways of systemic inflammation, highlighting a common pathophysiologic link across diverse disease states.
Increased circulating circulating glycoprotein acetyls – part of the oligosaccharide chains post-translationally attached to glycosylated proteins – have been suggested to represent early markers of disease risk, including cardiovascular disease and diabetes mellitus. Using observations from over 524,515 person-years of follow-up (median 20.5 years), this study sought to understand the longitudinal relationship between a measure of circulating glycoprotein N-acetyl glucosamine residues and diverse disease processes by examining the association between an 1H NMR-measured plasma glycan biosignature and mortality among initially-healthy individuals. Identifying a potentially common pathway of disease across several disease states, we demonstrated robust associations with mortality due to cardiovascular disease and cancer. The overall mortality findings were replicated in an independent cohort. There was evidence that the risks captured by this NMR glycan signal overlapped with those associated with multiple pathways of systemic inflammation. Overall, these results provide important insight into a potential molecular beacon of longitudinal risk that can be easily and rapidly quantified using NMR spectroscopy on plasma obtained from healthy individuals.
Acknowledgments
Disclosures: P.R. Lawler: None; A.O. Akinkoulie: None; S. Mora: Research grant support from Atherotech Diagnostics, consultant to Lilly, Pfizer, Cerenis Therapeutics. P. M. Ridker: Research grant support from AstraZeneca, Novartis, Amgen, Pfizer, and NHLBI, and is listed as a co-inventor on patents held by the Brigham and Women's Hospital related to the use of inflammatory biomarkers in CVD (licensed to AstraZeneca and Siemens).
Sources of Funding: P.R. Lawler receives support from NIH T32 (HL007575), NIH LRP, and Brigham and Women's Hospital. A.O. Akinkoulie receives support from NIH T32 (HL007575). WHS was funded by grants CA047988, HL043851, HL080467, HL099355, and UM1 CA182913. The research for this article was supported by the National Heart, Lung, And Blood Institute of the National Institutes of Health under Award Number R01HL117861 to S. Mora. The content is solely the responsibility of the authors and does not necessarily represent the official views of the National Institutes of Health.
Nonstandard Abbreviations and Acronyms
- CVD
cardiovascular disease
- hsCRP
high sensitivity C-reactive protein
- ICAM-1
intercellular adhesion molecule 1
- JUPITER
Justification for the Use of statins in Prevention an Intervention Trial Evaluating Rosuvastatin trial
- NMR
nuclear magnetic resonance spectroscopy
- WHS
Women's Health Study
References
- 1.Hebert DN, Lamriben L, Powers ET, Kelly JW. The intrinsic and extrinsic effects of n-linked glycans on glycoproteostasis. Nat Chem Biol. 2014;10:902–910. doi: 10.1038/nchembio.1651. [DOI] [PMC free article] [PubMed] [Google Scholar]
- 2.Shrimal S, Cherepanova NA, Gilmore R. Cotranslational and posttranslocational n-glycosylation of proteins in the endoplasmic reticulum. Semin Cell Dev Biol. 2015;41:71–78. doi: 10.1016/j.semcdb.2014.11.005. [DOI] [PMC free article] [PubMed] [Google Scholar]
- 3.Sperandio M, Gleissner CA, Ley K. Glycosylation in immune cell trafficking. Immunol Rev. 2009;230:97–113. doi: 10.1111/j.1600-065X.2009.00795.x. [DOI] [PMC free article] [PubMed] [Google Scholar]
- 4.Arnold JN, Saldova R, Hamid UM, Rudd PM. Evaluation of the serum n-linked glycome for the diagnosis of cancer and chronic inflammation. Proteomics. 2008;8:3284–3293. doi: 10.1002/pmic.200800163. [DOI] [PubMed] [Google Scholar]
- 5.Ohtsubo K, Marth JD. Glycosylation in cellular mechanisms of health and disease. Cell. 2006;126:855–867. doi: 10.1016/j.cell.2006.08.019. [DOI] [PubMed] [Google Scholar]
- 6.Hart GW, Copeland RJ. Glycomics hits the big time. Cell. 2010;143:672–676. doi: 10.1016/j.cell.2010.11.008. [DOI] [PMC free article] [PubMed] [Google Scholar]
- 7.Gornik O, Lauc G. Glycosylation of serum proteins in inflammatory diseases. Disease markers. 2008;25:267–278. doi: 10.1155/2008/493289. [DOI] [PMC free article] [PubMed] [Google Scholar]
- 8.Akinkuolie AO, Pradhan AD, Buring JE, Ridker PM, Mora S. Novel protein glycan side-chain biomarker and risk of incident type 2 diabetes mellitus. Arteriosclerosis, thrombosis, and vascular biology. 2015;35:1544–1550. doi: 10.1161/ATVBAHA.115.305635. [DOI] [PMC free article] [PubMed] [Google Scholar]
- 9.Akinkuolie AO, Buring JE, Ridker PM, Mora S. A novel protein glycan biomarker and future cardiovascular disease events. Journal of the American Heart Association. 2014;3:e001221. doi: 10.1161/JAHA.114.001221. [DOI] [PMC free article] [PubMed] [Google Scholar]
- 10.Otvos JD, Shalaurova I, Wolak-Dinsmore J, Connelly MA, Mackey RH, Stein JH, Tracy RP. Glyca: A composite nuclear magnetic resonance biomarker of systemic inflammation. Clinical chemistry. 2015;61:714–723. doi: 10.1373/clinchem.2014.232918. [DOI] [PubMed] [Google Scholar]
- 11.Ala-Korpela M. Serum nuclear magnetic resonance spectroscopy: One more step toward clinical utility. Clinical chemistry. 2015;61:681–683. doi: 10.1373/clinchem.2015.238279. [DOI] [PubMed] [Google Scholar]
- 12.Bell JD, Brown JC, Nicholson JK, Sadler PJ. Assignment of resonances for ‘acute-phase’ glycoproteins in high resolution proton nmr spectra of human blood plasma. FEBS Lett. 1987;215:311–315. doi: 10.1016/0014-5793(87)80168-0. [DOI] [PubMed] [Google Scholar]
- 13.Ridker PM, Cook NR, Lee IM, Gordon D, Gaziano JM, Manson JE, Hennekens CH, Buring JE. A randomized trial of low-dose aspirin in the primary prevention of cardiovascular disease in women. The New England journal of medicine. 2005;352:1293–1304. doi: 10.1056/NEJMoa050613. [DOI] [PubMed] [Google Scholar]
- 14.Cook NR, Lee IM, Gaziano JM, Gordon D, Ridker PM, Manson JE, Hennekens CH, Buring JE. Low-dose aspirin in the primary prevention of cancer: The women's health study: A randomized controlled trial. Jama. 2005;294:47–55. doi: 10.1001/jama.294.1.47. [DOI] [PubMed] [Google Scholar]
- 15.Lee IM, Cook NR, Gaziano JM, Gordon D, Ridker PM, Manson JE, Hennekens CH, Buring JE. Vitamin e in the primary prevention of cardiovascular disease and cancer: The women's health study: A randomized controlled trial. Jama. 2005;294:56–65. doi: 10.1001/jama.294.1.56. [DOI] [PubMed] [Google Scholar]
- 16.Cook NR, Lee IM, Zhang SM, Moorthy MV, Buring JE. Alternate-day, low-dose aspirin and cancer risk: Long-term observational follow-up of a randomized trial. Annals of internal medicine. 2013;159:77–85. doi: 10.7326/0003-4819-159-2-201307160-00002. [DOI] [PMC free article] [PubMed] [Google Scholar]
- 17.Ridker PM, Rifai N, Rose L, Buring JE, Cook NR. Comparison of c-reactive protein and low-density lipoprotein cholesterol levels in the prediction of first cardiovascular events. The New England journal of medicine. 2002;347:1557–1565. doi: 10.1056/NEJMoa021993. [DOI] [PubMed] [Google Scholar]
- 18.Mora S, Rifai N, Buring JE, Ridker PM. Comparison of ldl cholesterol concentrations by friedewald calculation and direct measurement in relation to cardiovascular events in 27,331 women. Clinical chemistry. 2009;55:888–894. doi: 10.1373/clinchem.2008.117929. [DOI] [PMC free article] [PubMed] [Google Scholar]
- 19.Mora S, Lee IM, Buring JE, Ridker PM. Association of physical activity and body mass index with novel and traditional cardiovascular biomarkers in women. Jama. 2006;295:1412–1419. doi: 10.1001/jama.295.12.1412. [DOI] [PubMed] [Google Scholar]
- 20.Ridker PM, MacFadyen JG, Wolfert RL, Koenig W. Relationship of lipoprotein-associated phospholipase a(2) mass and activity with incident vascular events among primary prevention patients allocated to placebo or to statin therapy: An analysis from the jupiter trial. Clinical chemistry. 2012;58:877–886. doi: 10.1373/clinchem.2011.180281. [DOI] [PubMed] [Google Scholar]
- 21.Sesso HD, Gaziano JM, Glynn RJ, Buring JE. Value of an endpoints committee versus the use of nosologists for validating cause of death. Contemporary clinical trials. 2006;27:333–339. doi: 10.1016/j.cct.2005.11.007. [DOI] [PubMed] [Google Scholar]
- 22.Ridker PM, Danielson E, Fonseca FA, Genest J, Gotto AM, Jr, Kastelein JJ, Koenig W, Libby P, Lorenzatti AJ, MacFadyen JG, Nordestgaard BG, Shepherd J, Willerson JT, Glynn RJ, Group JS. Rosuvastatin to prevent vascular events in men and women with elevated c-reactive protein. The New England journal of medicine. 2008;359:2195–2207. doi: 10.1056/NEJMoa0807646. [DOI] [PubMed] [Google Scholar]
- 23.Tousoulis D, Psarros C, Demosthenous M, Patel R, Antoniades C, Stefanadis C. Innate and adaptive inflammation as a therapeutic target in vascular disease: The emerging role of statins. Journal of the American College of Cardiology. 2014;63:2491–2502. doi: 10.1016/j.jacc.2014.01.054. [DOI] [PubMed] [Google Scholar]
- 24.Ngoh GA, Facundo HT, Zafir A, Jones SP. O-glcnac signaling in the cardiovascular system. Circulation research. 2010;107:171–185. doi: 10.1161/CIRCRESAHA.110.224675. [DOI] [PMC free article] [PubMed] [Google Scholar]
- 25.Pu Q, Yu C. Glycosyltransferases, glycosylation and atherosclerosis. Glycoconjugate journal. 2014;31:605–611. doi: 10.1007/s10719-014-9560-8. [DOI] [PubMed] [Google Scholar]
- 26.An HJ, Lebrilla CB. A glycomics approach to the discovery of potential cancer biomarkers. Methods in molecular biology. 2010;600:199–213. doi: 10.1007/978-1-60761-454-8_14. [DOI] [PubMed] [Google Scholar]
- 27.Brenner DR, Scherer D, Muir K, Schildkraut J, Boffetta P, Spitz MR, Le Marchand L, Chan AT, Goode EL, Ulrich CM, Hung RJ. A review of the application of inflammatory biomarkers in epidemiologic cancer research. Cancer epidemiology, biomarkers & prevention : a publication of the American Association for Cancer Research, cosponsored by the American Society of Preventive Oncology. 2014;23:1729–1751. doi: 10.1158/1055-9965.EPI-14-0064. [DOI] [PMC free article] [PubMed] [Google Scholar]
- 28.Emerging Risk Factors C, Kaptoge S, Di Angelantonio E, Lowe G, Pepys MB, Thompson SG, Collins R, Danesh J. C-reactive protein concentration and risk of coronary heart disease, stroke, and mortality: An individual participant meta-analysis. Lancet. 2010;375:132–140. doi: 10.1016/S0140-6736(09)61717-7. [DOI] [PMC free article] [PubMed] [Google Scholar]
- 29.Ramos-Nino ME. The role of chronic inflammation in obesity-associated cancers. ISRN oncology. 2013;2013:697521. doi: 10.1155/2013/697521. [DOI] [PMC free article] [PubMed] [Google Scholar]
- 30.Fischer K, Kettunen J, Wurtz P, Haller T, Havulinna AS, Kangas AJ, Soininen P, Esko T, Tammesoo ML, Magi R, Smit S, Palotie A, Ripatti S, Salomaa V, Ala-Korpela M, Perola M, Metspalu A. Biomarker profiling by nuclear magnetic resonance spectroscopy for the prediction of all-cause mortality: An observational study of 17,345 persons. PLoS medicine. 2014;11:e1001606. doi: 10.1371/journal.pmed.1001606. [DOI] [PMC free article] [PubMed] [Google Scholar]
Associated Data
This section collects any data citations, data availability statements, or supplementary materials included in this article.