The development of human cancer is a multistep process characterized by the accumulation of genetic and epigenetic alterations that drive or reflect tumour progression. These changes distinguish cancer cells from their normal counterparts, allowing tumours to be recognized as foreign by the immune system1–4. However, tumours are rarely rejected spontaneously, reflecting their ability to maintain an immunosuppressive microenvironment5. Programmed death-ligand 1 (PD-L1; also called B7-H1 or CD274), which is expressed on many cancer and immune cells, plays an important part in blocking the ‘cancer immunity cycle’ by binding programmed death-1 (PD-1) and B7.1 (CD80), both of which are negative regulators of T-lymphocyte activation. Binding of PD-L1 to its receptors suppresses T-cell migration, proliferation and secretion of cytotoxic mediators, and restricts tumour cell killing6–10. The PD-L1–PD-1 axis protects the host from overactive T-effector cells not only in cancer but also during microbial infections11. Blocking PD-L1 should therefore enhance anti-cancer immunity, but little is known about predictive factors of efficacy. This study was designed to evaluate the safety, activity and biomarkers of PD-L1 inhibition using the engineered humanized antibody MPDL3280A. Here we show that across multiple cancer types, responses (as evaluated by Response Evaluation Criteria in Solid Tumours, version 1.1) were observed in patients with tumours expressing high levels of PD-L1, especially when PD-L1 was expressed by tumour-infiltrating immune cells. Furthermore, responses were associated with T-helper type 1 (TH1) gene expression, CTLA4 expression and the absence of fractalkine (CX3CL1) in baseline tumour specimens. Together, these data suggest that MPDL3280A is most effective in patients in which pre-existing immunity is suppressed by PD-L1, and is re-invigorated on antibody treatment.
Pre-clinical studies demonstrated that anti-PD-L1 treatment of mice bearing implanted syngeneic tumours could lead to tumour regression and the induction of protective immune memory in the setting of rechallenge with tumour cells (Genentech, unpublished data). However, most mouse models constitutively express PD-L1 (ref. 12), which is not consistent with human tumours. Additionally, only a few syngeneic models (notably the MC38 colon carcinoma model) were responsive to anti-PD-L1 as a single agent (Genentech, unpublished data). Therefore, a detailed analysis of PD-L1 expression in human tumours and its association with clinical benefit was required.
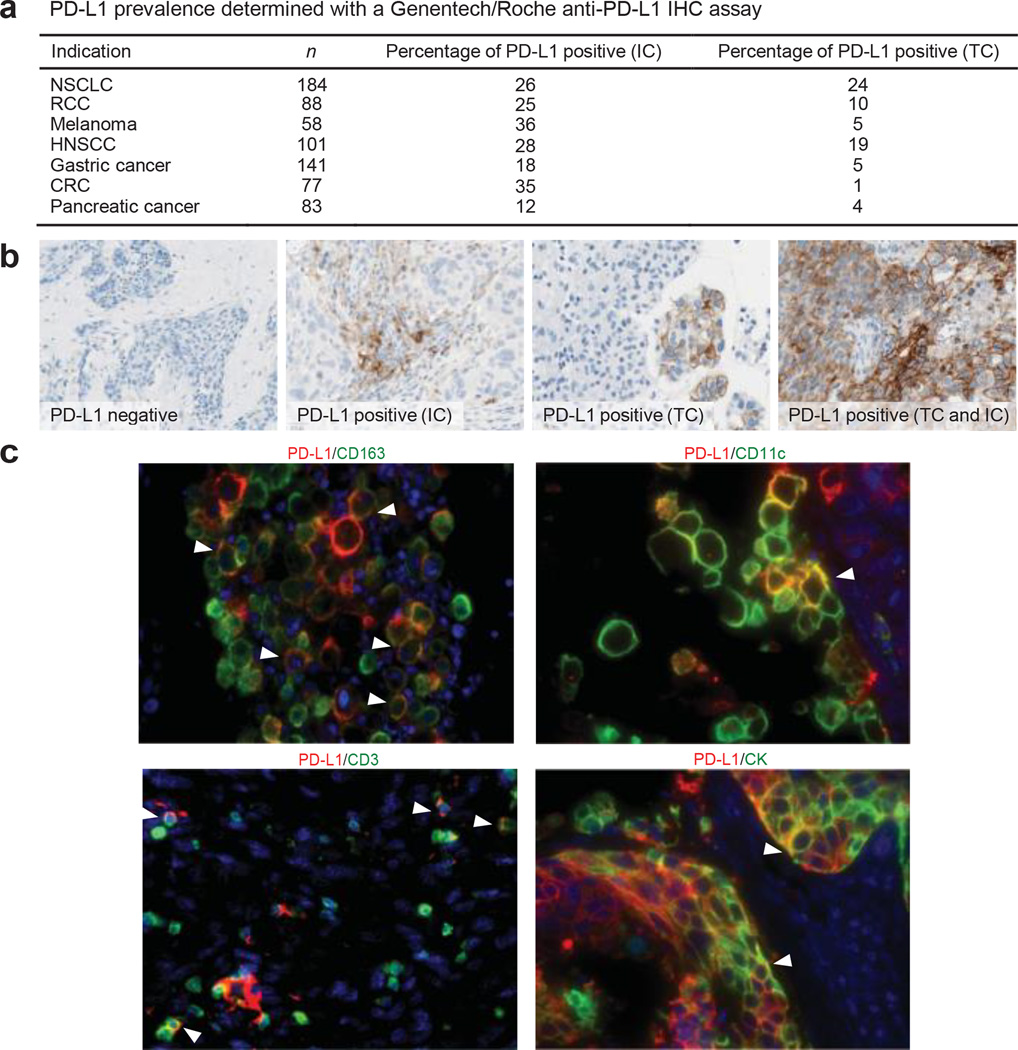
PD-L1 in human cancers was investigated using an anti-PD-L1 immunohistochemistry (IHC) antibody optimized for staining of formalin-fixed paraffin-embedded tissue samples. Staining of pre-treatment specimens submitted for our clinical study demonstrated expression across a range of cancers (Fig. 1a). PD-L1 staining was observed on tumour cells, as well as on tumour-infiltrating immune cells (Fig. 1b), with PD-L1-positive tumour-infiltrating immune cells being more common than PD-L1-positive tumour cells. PD-L1-positive tumour-infiltrating immune cells included myeloid cells (macrophages, dendritic cells) and T cells; B cells were negative for PD-L1 (Fig. 1c).
Figure 1. Programmed death-ligand 1 (PD-L1) prevalence and expression.
a, PD-L1 prevalence by immunohistochemistry (IHC) in samples collected for PCD4989g. PD-L1 positivity was defined as $5% of tumour-infiltrating immune cells (ICs) or tumour cells (TCs) staining for PD-L1 by IHC. b, Representative images of PD-L1 by IHC (brown) in tumours from patients with non-small cell lung cancer (NSCLC). The PD-L1-negative image is at 203 magnification, other images at 403 magnification. c, Co-localization of PD-L1 with selected tumour-infiltrating immune cell and tumour cell markers by immunofluorescence in NSCLC and melanoma tumours. PD-L1 staining in red; markers of tumour-infiltrating immune cells and tumour cells in green; and DAPI staining in blue. Areas of overlap are indicated with white arrowheads. All four images are at 403 resolution. Markers of tumour-infiltrating immune cells: CD163 (macrophages), CD11c (dendritic cells) and CD3 (T cells). Marker of tumour cells: cytokeratin (CK). CRC, colorectal cancer; HNSCC, head and neck squamous cell carcinoma; NSCLC, non-small cell lung cancer; RCC, renal cell carcinoma.
We developed a high-affinity human monoclonal immunoglobulin-G1 (IgG1) antibody for clinical use that specifically binds to PD-L1 (MPDL-3280A; binding affinity Kd (dissociation constant) = 0.4 nM) and prevents its interaction with PD-1 and B7.1. However, the antibody would leave intact the interaction of PD-1 with its alternative ligand PD-L2 (also called B7-DC or CD273), which is thought to have a key role in maintaining peripheral tolerance, particularly in the lung13,14. MPDL3280A was engineered with a crystallizable fragment (Fc) domain modification eliminating antibody-dependent cellular cytotoxicity at clinically relevant doses, preventing depletion of activated T cells15,16 (see Methods).
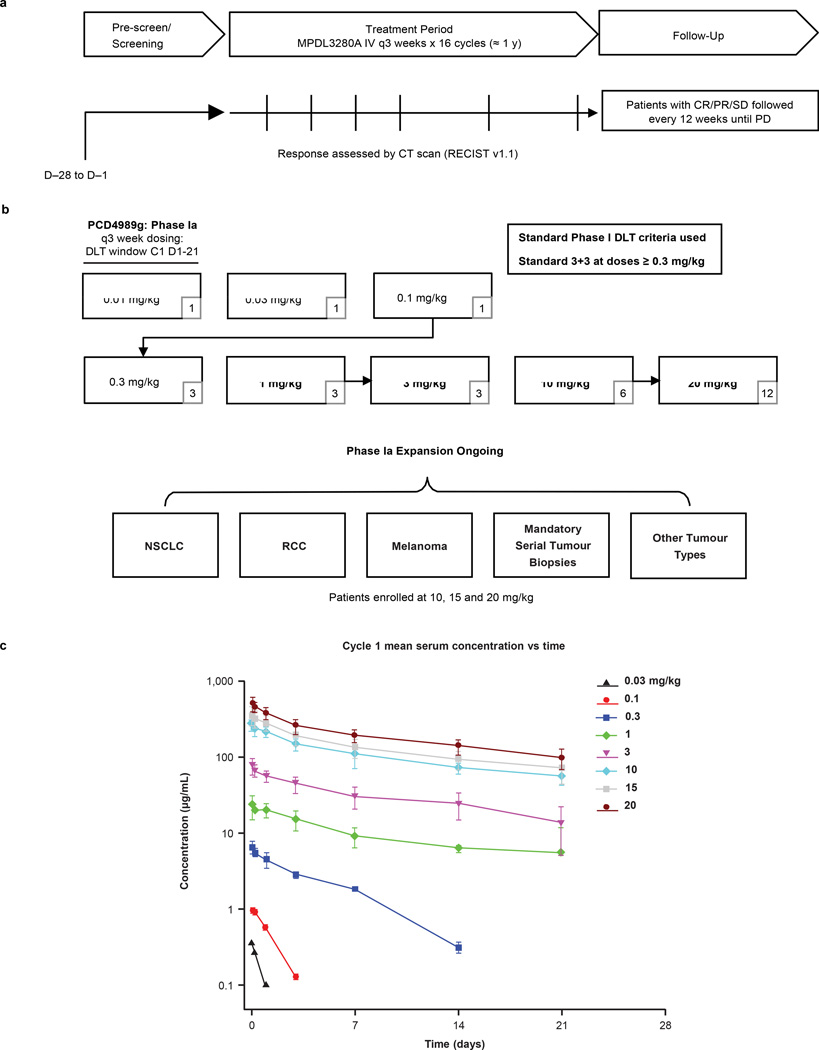
Patients were treated with MPDL3280A, and pre-treatment and on-treatment tumour specimens were characterized from available samples. A total of 277 patients with advanced incurable cancer received MPDL-3280A intravenously every 3 weeks (q3w; Extended Data Fig. 1a, b and Extended Data Table 1; see Methods). Mean single-dose MPDL3280A pharmacokinetics were consistent with a typical IgG1 at doses $1 mg kg21, with a mean terminal serum half-life of, 3 weeks (Extended Data Fig. 1c). Overall, treatment was well tolerated up to the maximum administered dose of 20 mg kg21 q3w (Table 1).
Table 1.
Adverse events
| Treatment-related AEs (n = 277) |
AEs regardless of attribution (n = 277) |
||||
|---|---|---|---|---|---|
| Events ($4% of patients) | Any grade (n (%)) | Grade 3–4 (n (%)) | Events ($5% of patients) | Any grade (n (%)) | Grade 3–4 (n (%)) |
| Any AE | 194 (70.0) | 35 (12.6) | Any AE | 263 (94.9) | 108 (39.0) |
| Fatigue | 67 (24.2) | 5 (1.8) | Fatigue | 100 (36.1) | 9 (3.2) |
| Decreased appetite | 33 (11.9) | – | Nausea | 69 (24.9) | 2 (0.7) |
| Nausea | 32 (11.6) | 1 (0.4) | Dyspnoea | 66 (23.8) | 11 (4.0) |
| Pyrexia | 32 (11.6) | - | Decreased appetite | 64 (23.1) | – |
| Diarrhoea | 29 (10.5) | - | Cough | 60 (21.7) | – |
| Rash | 29 (10.5) | - | Diarrhoea | 60 (21.7) | – |
| Pruritus | 23 (8.3) | - | Pyrexia | 57 (20.6) | – |
| Arthralgia | 22 (7.9) | - | Constipation | 55 (19.9) | – |
| Headache | 21 (7.6) | 1 (0.4) | Headache | 49 (17.7) | – |
| Chills | 19 (6.9) | - | Vomiting | 46 (16.6) | – |
| Influenza-like illness | 16 (5.8) | 1 (0.4) | Anaemia | 44 (15.9) | 10 (3.6) |
| Asthenia | 15 (5.4) | 2 (0.7) | Insomnia | 43 (15.5) | – |
| Dyspnea | 15 (5.4) | 2 (0.7) | Back pain | 42 (15.2) | 4 (1.4) |
| Pain | 15 (5.4) | 1 (0.4) | Arthralgia | 41 (14.8) | – |
| Myalgia | 13 (4.7) | - | Rash | 40 (14.4) | – |
| Anaemia | 12 (4.3) | 2 (0.7) | Asthenia | 34 (12.3) | 4 (1.4) |
| Dry skin | 12 (4.3) | - | Pruritus | 33 (11.9) | – |
| Night sweats | 12 (4.3) | - | Chills | 31 (11.2) | – |
| Vomiting | 11 (4.0) | 1 (0.4) | Upper respiratory tract infection | 30 (10.8) | – |
| Other grade 3–4 AEs, $2 patients | Anxiety | 20 (7.2) | – | ||
| ALT increased | 6 (2.2) | 3 (1.1) | Influenza-like illness | 20 (7.2) | – |
| AST increased | 4 (1.4) | 3 (1.1) | Nasal congestion | 20 (7.2) | – |
| Hypoxia | 4 (1.4) | 3 (1.1) | Urinary tract infection | 20 (7.2) | 3 (1.1) |
| Hyperglycaemia | 4 (1.4) | 2 (0.7) | Dehydration | 19 (6.9) | 4 (1.4) |
| Hyponatraemia | 4 (1.4) | 2 (0.7) | Hyperglycaemia | 19 (6.9) | 7 (2.5) |
| Cardiac tamponade | 2 (0.7) | 2 (0.7) | Myalgia | 19 (6.9) | – |
| Hypophosphataemia | 2 (0.7) | 2 (0.7) | Night sweats | 19 (6.9) | – |
| Tumour lysis syndrome | 2 (0.7) | 2 (0.7) | Productive cough | 19 (6.9) | – |
| Dry skin | 16 (5.8) | – | |||
| Dry mouth | 14 (5.1) | – | |||
| Hypoxia | 14 (5.1) | 6 (2.2) | |||
| Weight decreased | 14 (5.1) | – | |||
AE, adverse event; ALT, alanine aminotransferase; AST, aspartate aminotransferase.
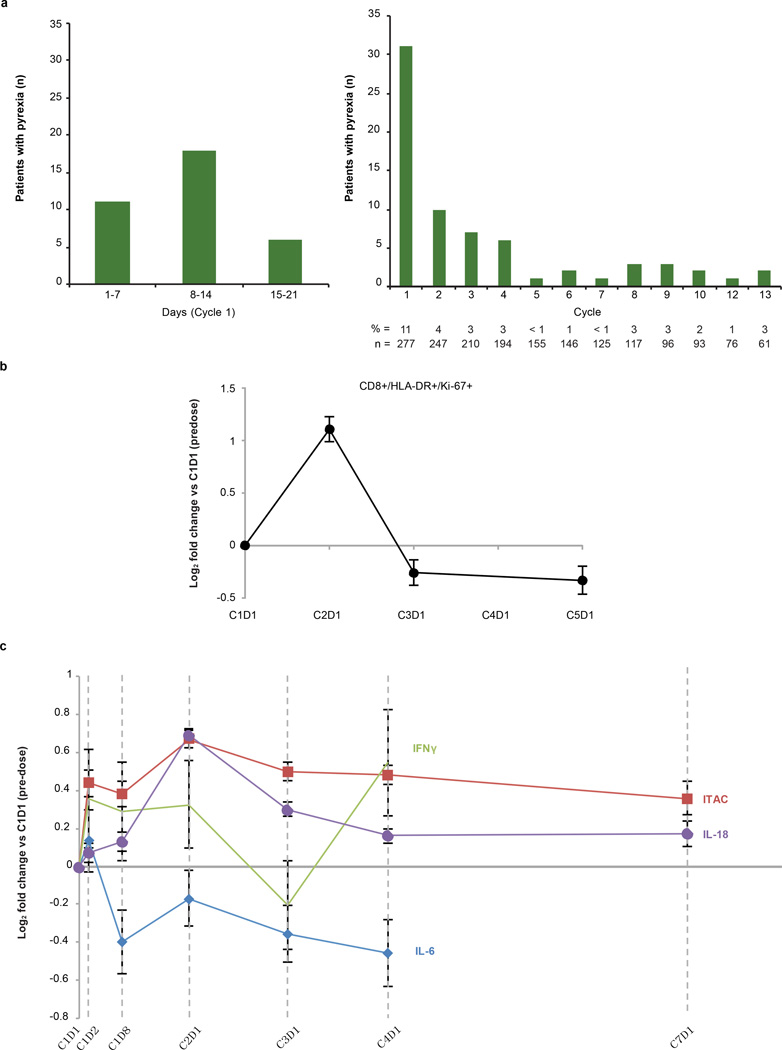
Most adverse events (AEs) did not require medical treatment. The most common treatment-related AE was fatigue (Table 1), which often occurred with low-grade fever during the first treatment cycle. Pyrexia was reported in, 21% of patients; it most commonly occurred during cycle 1 and was uncommon during subsequent cycles (Extended Data Fig. 2a). Additionally, an, 2-fold increase in activated proliferating CD81 T cells (CD81HLA-DR1Ki-671) and a trend of increased circulating interferon (IFN)-c were observed by the end of the first cycle (Extended Data Fig. 2b, c).
Treatment-related grade 3–4 AEs were observed in 35 patients (13%) and immune-related grade 3–4 AEs were observed in 3 patients (1%) (see Methods for further information regarding AE grades). No cases of grades 3–5 pneumonitis were seen.
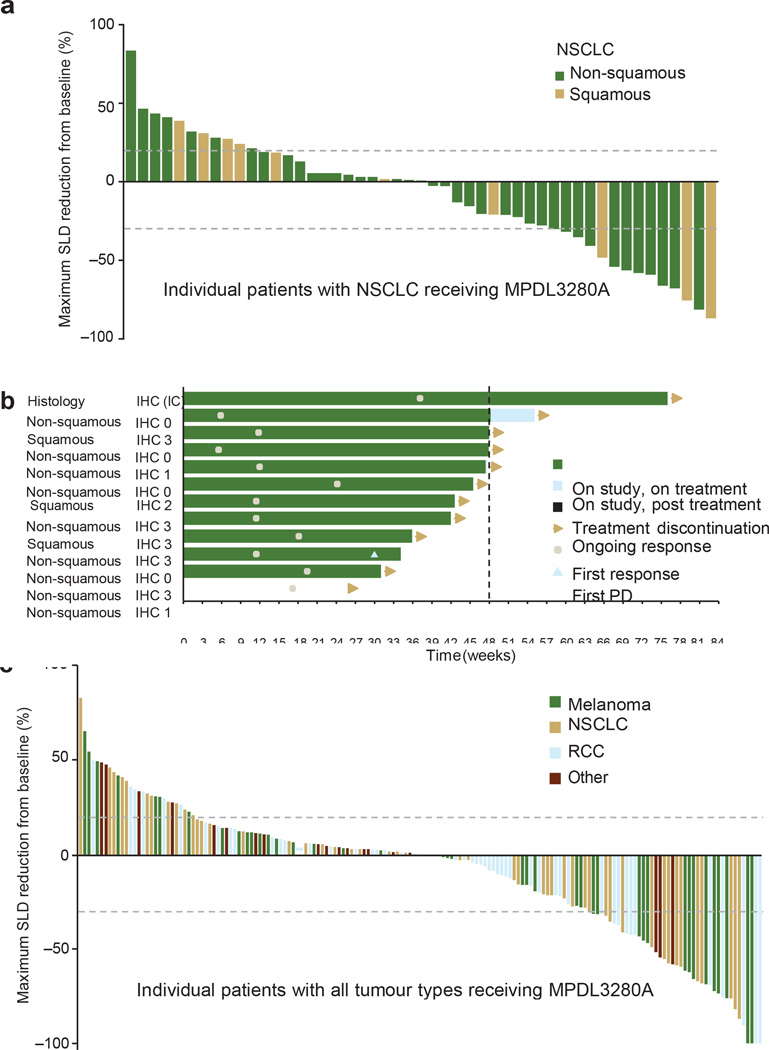
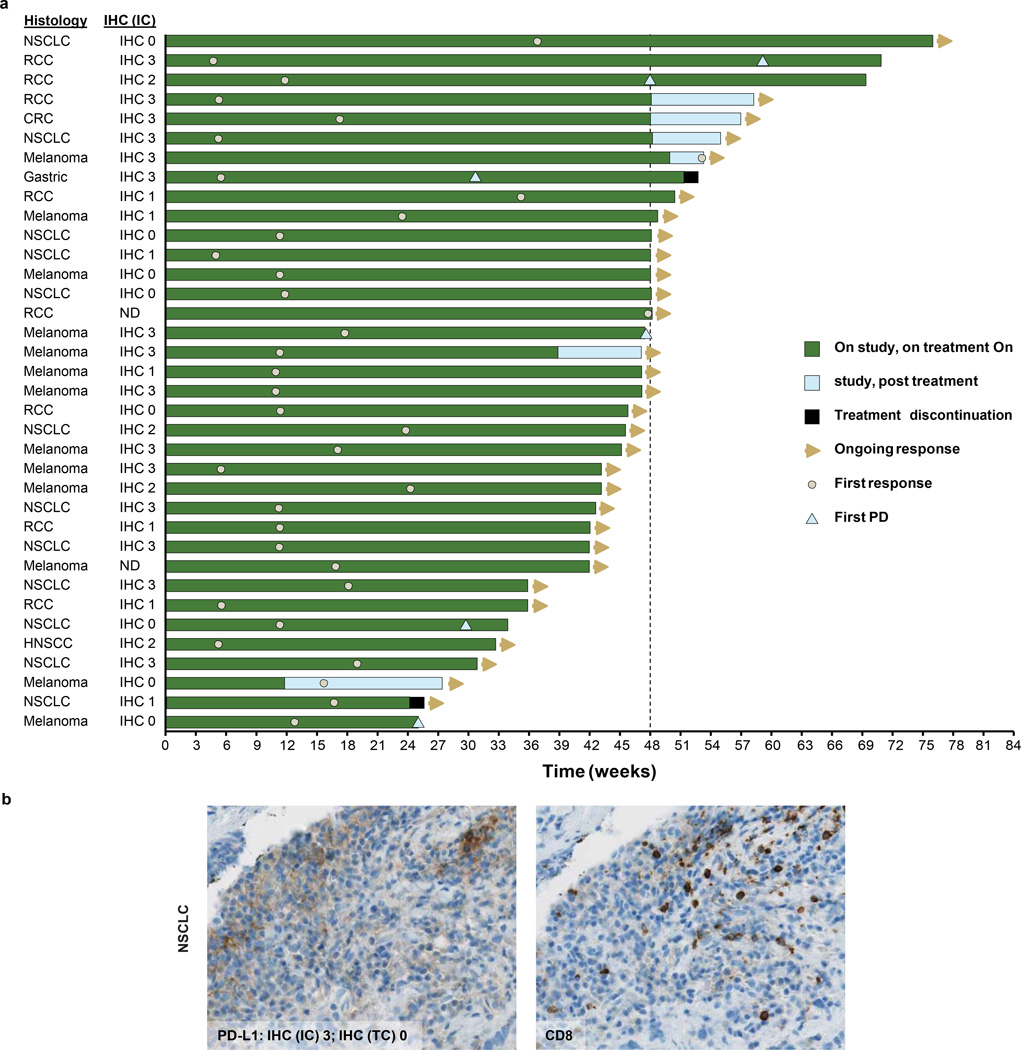
The impact of PD-L1 inhibition on metastatic lesions was evaluated per Response Evaluation Criteria in Solid Tumours, version 1.1 (RECIST v1.1). In the 175 efficacy-evaluable patients (with demographic and base-line characteristics similar to those in all patients), confirmed responses (complete and partial responses) were observed in 32 of 175 (18%), 11 of 53 (21%), 11 of 43 (26%), 7 of 56 (13%) and 3 of 23 (13%) of patients with all tumour types, non-small cell lung cancer (NSCLC), melanoma, renal cell carcinoma and other tumours (including colorectal cancer, gastric cancer, and head and neck squamous cell carcinoma), respectively. Four more patients had unconfirmed responses (Table 2, Fig. 2 and Extended Data Fig. 3a). Responses could also be rapid and durable (Fig. 2b and Extended Data Fig. 3a), with shrinking or resolving palpable lesions detected within days in some responders and nearly all responders (especially patients with NSCLC) continuing to respond and staying on study. In addition, RECIST may not accurately describe the full spectrum of responses observed because some patients who had a best response of progressive disease per RECIST went on to develop durable tumour shrinkage or prolonged stable disease (pseudoprogression)17. The median progression-free survival of all patients was 18 weeks. We also performed an exploratory analysis of patients with NSCLC and detected a potential trend of former/current smokers responding better to MPDL-3280A versus never smokers (11 of 26 (42%) versus 1 of 10 (10%), respectively; P = 0.4229 using a Fisher exact test; see the accompanying paper (ref. 18) for further discussion).
Table 2.
Efficacy of MPDL3280A across tumour types
| Tumour types | ORR* (n (%)) (95% CI) |
SD (best response) (n (%)) |
PD (best response) (n (%)) |
SD $24 weeks (n (%)) |
24-week PFS (%) |
|---|---|---|---|---|---|
| Overall (n = 175) | 36 (21) (15–27) |
68 (39) | 65 (37) | 33 (19) | 42 |
| NSCLC (n = 53) | 12 (23) (12–35) |
18 (34) | 21 (40) | 9 (17) | 45 |
| Non-squamous (n = 42) |
9 (21) (11–36) |
16 (38) | 16 (38) | 7 (17) | 44 |
| Squamous (n = 11) | 3 (27) (8–61) |
2 (18) | 5 (46) | 2 (18) | 46 |
| Melanoma (n = 43) | 13 (30) (18–45) |
11 (26) 41 | 18 (42) | 4 (9) | 51 |
| Cutaneous (n = 33) | 12 (36) (21–55) |
9 (27) | 11 (33) | 4 (12) | |
| Mucosal (n = 5) | 1 (20) (1–66) |
0 | 4 (80) | 0 | 20 |
| Ocular (n = 4) | 0 (0–53) |
1 (25) | 3 (75) | 0 | 0 |
| RCC (n = 56) | 8 (14) (6–25) |
30 (54) | 17 (30) | 18 (32) | 48 |
| Clear cell (n = 49) | 7 (14) (7–27) |
28 (57) | 14 (29) | 18(37) | 52 |
| Non-clear cell (n = 7) |
1 ( 1 4) (1–5 5) |
2 (29) | 3 (43) | 0 | 17 |
| Other (for example, CRC, GC and HNSCC; n = 23)† |
3 ( 13) (4–3 2) |
9 (39) | 9 (39) | 2 (9) | 24 |
Patients dosed by 1 October 1 2012, with $1mg kg21 with a baseline tumour assessment. Data cutoff was 30 April 2013. CI, confidence interval; CRC, colorectal cancer; GC, gastric cancer; HNSCC, head and neck squamous cell carcinoma; NSCLC, non-small cell lung cancer; ORR, objective response rate; PD, progressive disease; PFS, progression-free survival; RCC, renal cell carcinoma; SD, stable disease.
Per RECIST v1.1. All responses were confirmed except for in one patient with NSCLC, one patient with RCC and two patients with melanoma.
Sarcoma (n = 2), ovarian (n = 1), head and neck (n = 6), breast (n = 3), colorectal (n = 6), pancreatic (n = 1), gastric (n = 1), oesophageal (n = 1), uterine (n = 1) and pancreatoduodenal (n = 1).
Figure 2. Antitumour activity of MPDL3280A.
a, A waterfall plot of patients with non-small cell lung cancer (NSCLC) measuring the maximum reduction from baseline in the sum of the longest diameter (SLD) for target lesions; 120% and 230% are marked by dashed lines. b, The time to response (Response Evaluation Criteria in Solid Tumours version 1.1) and the duration of study treatment for patients with NSCLC. The patient with progressive disease (PD) experienced ongoing clinical benefit as judged by the investigator. All but one response was confirmed. c, A waterfall plot of patients with all tumour types measuring the maximum reduction from baseline in the SLD for target lesions; 120% and 230% are marked by dashed lines. IC, tumour-infiltrating immune cells; IHC, immunohistochemistry; RCC, renal cell carcinoma.
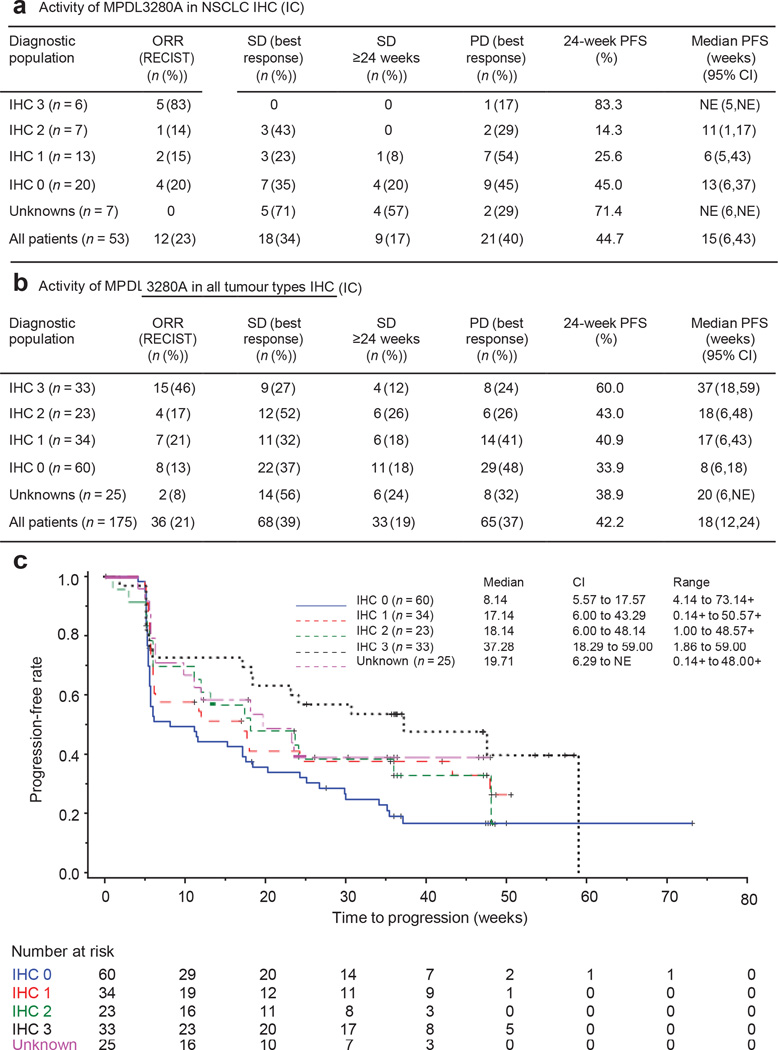
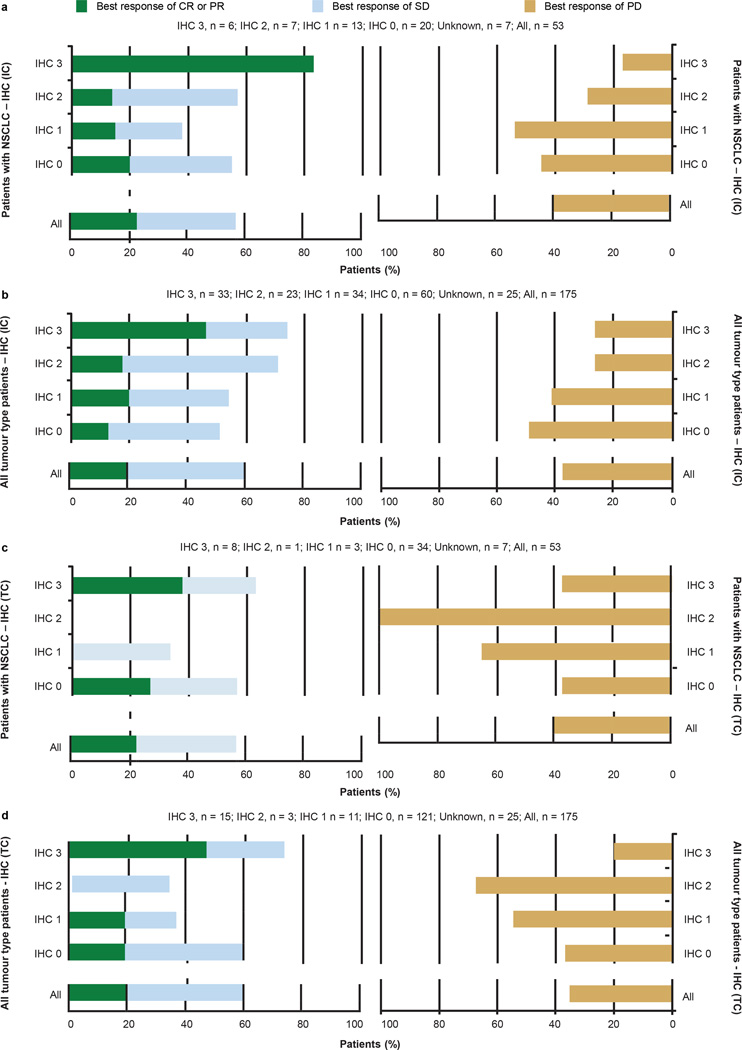
There appears to be an association between response and the expression of PD-L1 in pre-treatment samples (Fig. 3 and Extended Data Figs 3 and 4). The association of response to MPDL3280A treatment and tumour-infiltrating immune cell PD-L1 expression reached statistical significance (NSCLC, P = 0.015 (Fig. 3a and Extended Data Fig. 4a); all tumours, P = 0.007 (Fig. 3b, c and Extended Data Fig. 4b)), while the association with tumour cell PD-L1 expression did not (NSCLC, P = 0.920 (Extended Data Fig. 4c); all tumours, P = 0.079 (Extended Data Fig. 4d)). For example, 83% of patients with IHC score 3 (tumour-infiltrating immune cell) NSCLC responded to treatments with only 17% progressing, whereas 43% of patients with IHC 2 (tumour-infiltrating immune cell) NSCLC were limited to disease stabilization (Fig. 3a and Extended Data Fig. 4a; see Methods for the IHC score definitions). Of the patients with IHC 3 (tumour cell) NSCLC, only 38% (3 of 8) responded while 38% (3 of 8) progressed (Extended Data Fig. 4c). There was also a trend between tumour IHC status and median progression-free survival (Fig. 3c).
Figure 3. Antitumour activity of MPDL3280A by immunohistochemistry (IHC) tumour-infiltrating immune cell (IC) and biomarker status.
a, Table of antitumour activity in patients with NSCLC by PD-L1 IHC (IC) status. Patients with no post-first dose assessment were not estimable (NE; 1 with IHC 1 and 1 with IHC 2), but were included in the denominator for calculating objective response rate (ORR). b, Table of antitumour activity in patients with all tumour types by PD-L1 IHC (IC) status. Patients with no post-first dose assessment were not estimable and not included in the table (1 with IHC 0, 2 with IHC 1, 1 with IHC 2 and 1 with IHC 3), but were included in the denominator for calculating ORR. c, Kaplan–Meier curve showing the phase I percentage of progression-free survival by patient IHC (IC) status. Censored data are indicated by vertical tick marks. CI, confidence interval; NSCLC, non-small cell lung cancer; ORR, objective response rate; PD, progressive disease; PFS, progression free survival; PR, partial response; RECIST, Response Evaluation Criteria in Solid Tumours; SD, stable disease.
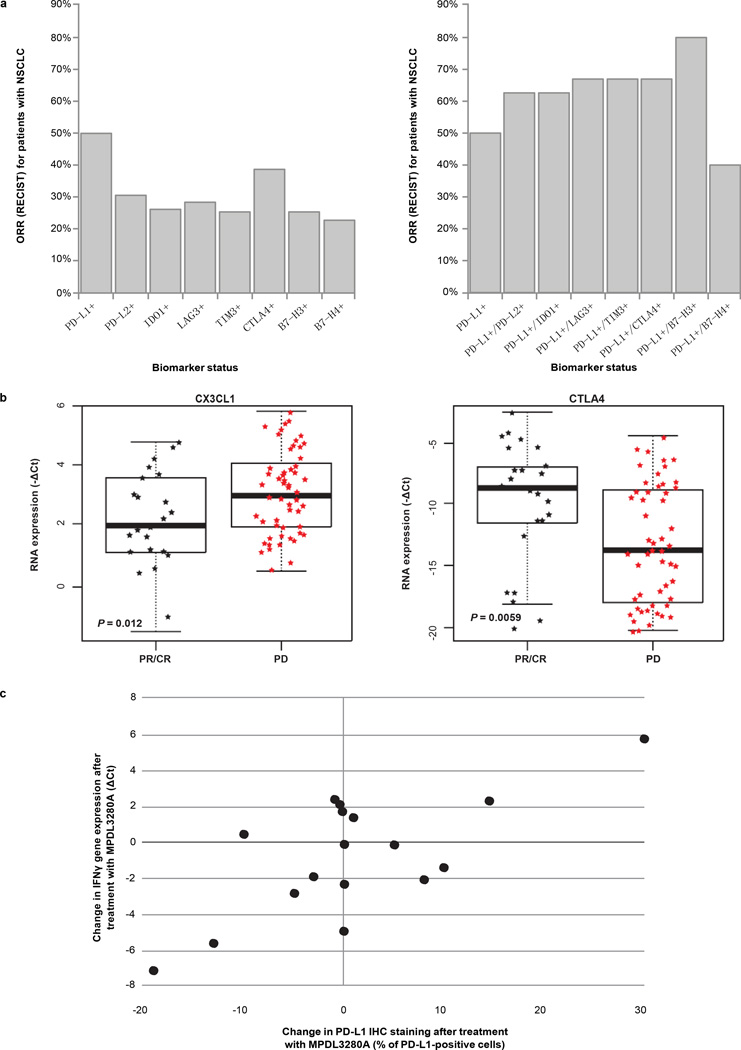
When tumour samples were examined for the expression of different immune inhibitory factors (see Methods), the expected correlation with lack of response to MPDL3280A was not seen (Extended Data Fig. 5a, left panel). Instead there was a trend towards increased response in PD-L1-positive patients expressing a second negative regulator (Extended Data Fig. 5a, right panel). High PD-L2 expression did not appear to be associated with resistance to MPDL3280A, and some patients whose pre-treatment tumour biopsies showed the highest levels of PD-L2 expression experienced strong responses to MPDL3280A (for example, maximum sum of the longest diameter (SLD) decreases of 57%, 41% and 49%). Finally, the expression of CTLA4 and fractalkine in pre-treatment tumours appeared to correlate strongly with either response (CTLA4) or progression (fractalkine) after MPDL3280A (Extended Data Fig. 5b).
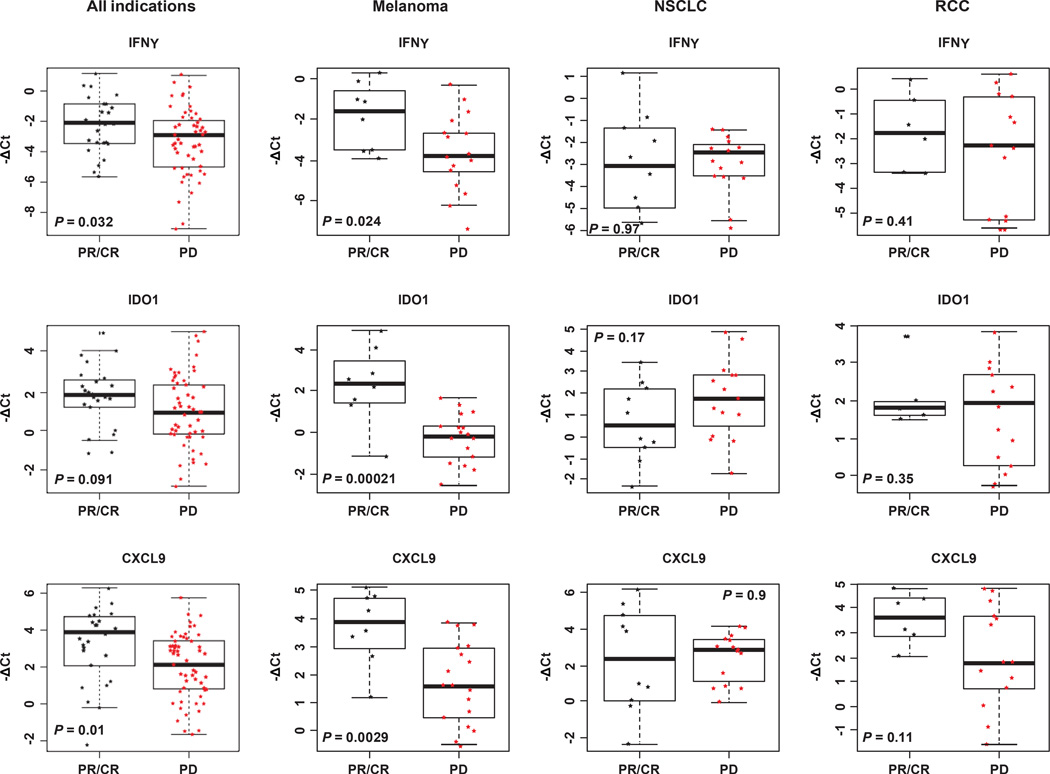
We compared results obtained for pre-treatment NSCLC tumours with those for renal cell carcinoma and melanoma (Extended Data Fig. 6). Although the expression of PD-L1 in MPDL3280A-responsive patients was a common feature, other aspects of the immune microenvironment appeared different. In melanoma, pre-treatment tumours in responding patients demonstrated elevated expression of IFN-c as well as IFN-c-inducible genes (for example, IDO1 and CXCL9). These associations were weaker in patients with NSCLC or renal cell carcinoma.
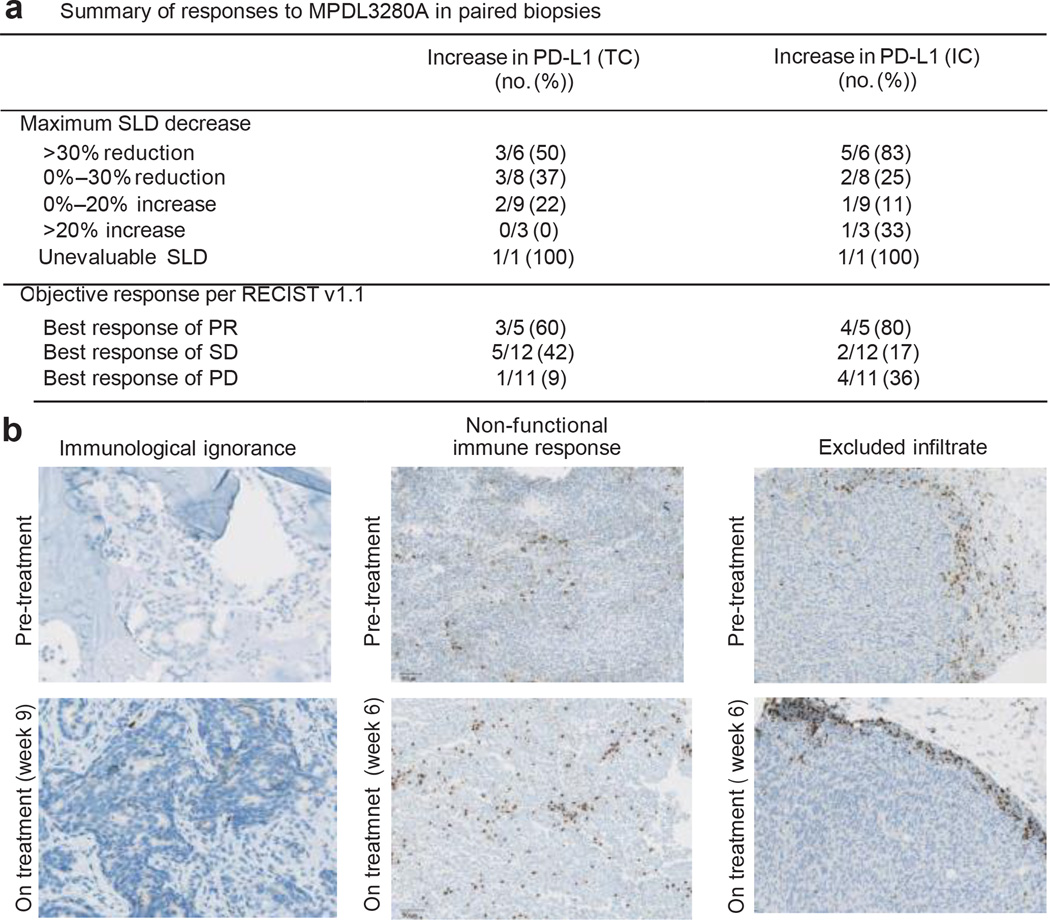
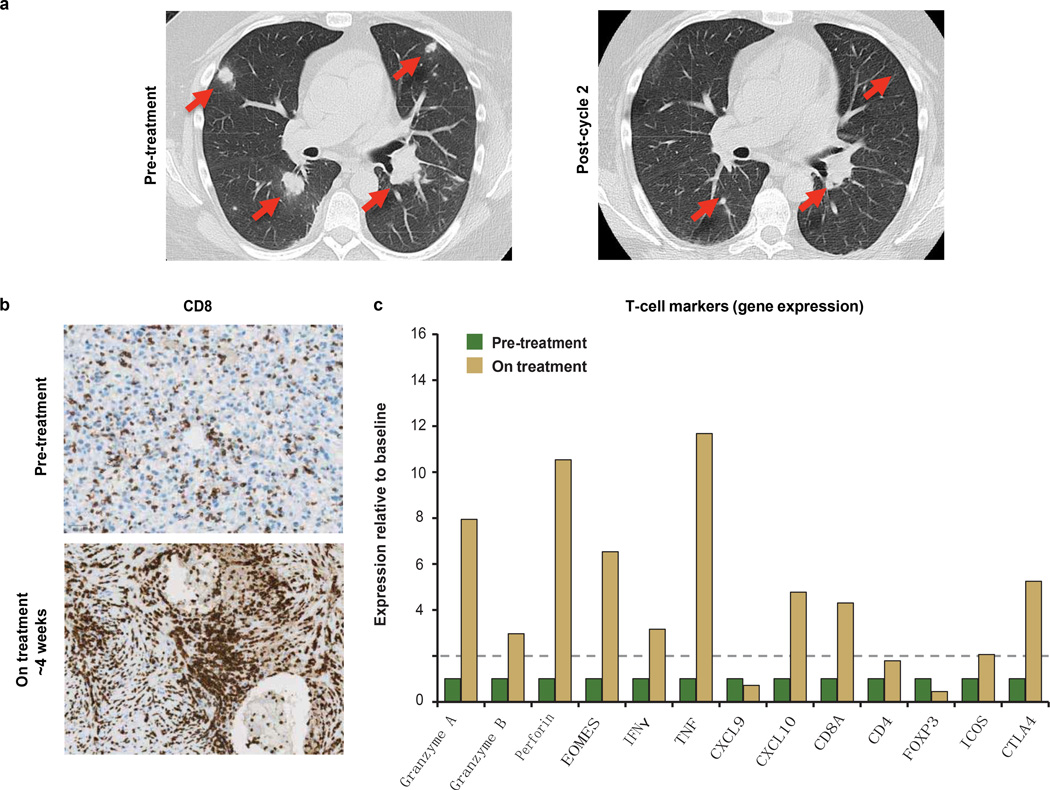
To characterize the immunological events associated with tumour response or progression, serial on-treatment tumour biopsies were performed in 28 patients (Fig. 4a). After treatment, regressing lesions displayed a dense immune infiltrate and extensive tumour cell necrosis accompanied by the apparent sterilization of cancer cells in some cases (Extended Data Fig. 7a, b). A decrease in tumour SLD appeared to be accompanied by an increase in PD-L1 expression on tumour-infiltrating immune cells and tumour cells (Fig. 4a). The increase in PD-L1 expression with treatment correlated with changes in tumour IFN-c expression (Pearson correlation coefficient = 0.70; Extended Data Fig. 5c). In addition, RNA isolated from regressing lesions was analysed for the presence of transcripts of immunological importance using a Fluidigm-based ‘immunochip’ (iChip, see Methods), and displayed expression patterns indicative of a generalized activation of CD8 and TH1 T-cell responses (Extended Data Fig. 7c).
Figure 4. Biomarker status and response to MPDL3280A.
a, Table summarizing the frequency of patients with an increase in PD-L1-ositive tumour-infiltrating immune cells (ICs) and tumour cells (TCs) by change in the sum of the longest diameter (SLD) and by response to MPDL3280A in patients with paired serial biopsies. There were 28 paired serial biopsies. Of these, 16 tumours were melanoma, 4 were renal cell carcinoma, 4 were non-small cell lung cancer, 2 were head and neck carcinoma, and 2 were colorectal cancer. Patients with an increase of $5% in PDL1-expressing tumour cells and tumour-infiltrating immune cells were identified as having increased PD-L1 expression by IHC after treatment with MPDL3280A. The patient who was unevaluable for SLD had the responding tumour excised for biomarker analysis. This table also includes one patient with progressive disease (PD) by RECIST version 1.1 but without post-dose SLD measures. b, Left: ‘immunological ignorance’ visualized by CD8 IHC. See Extended Data Fig. 8a for additional information. Middle: ‘non-functional immune response’ visualized by CD8 IHC. See Extended Data Fig. 8b for additional information. Right: ‘excluded infiltrate’ visualized by CD8 IHC. See Extended Data Fig. 9 for additional information. All images are at 103 magnification. PR, partial response; RECIST, Response Evaluation Criteria in Solid Tumours; SD, stable disease.
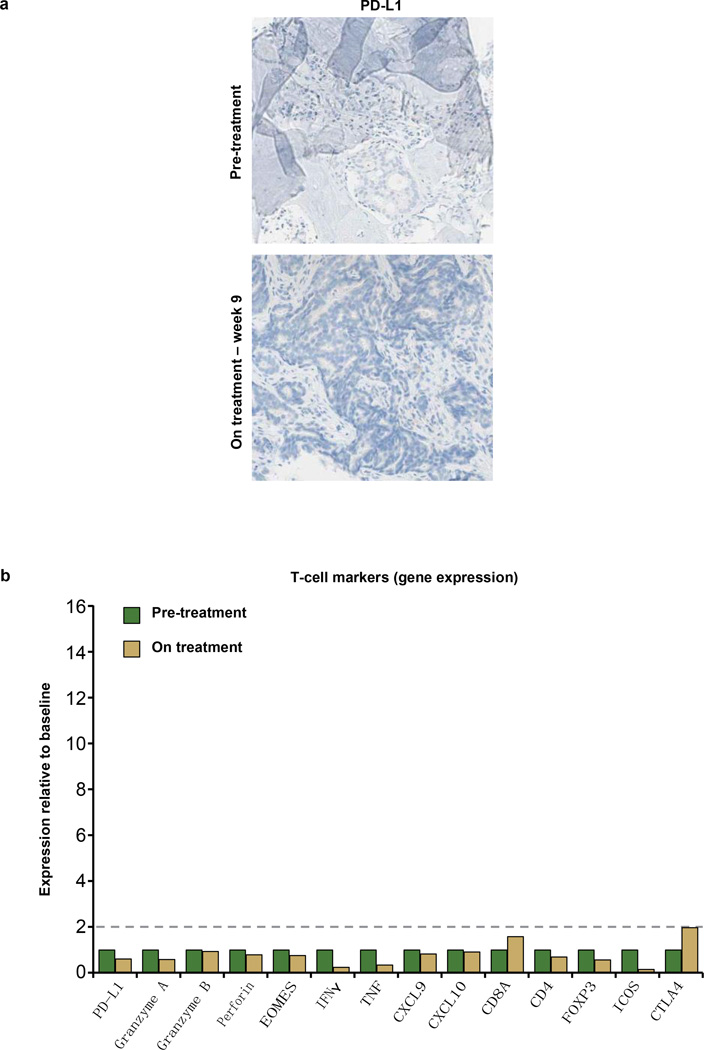
In contrast, most progressing patients with on-treatment biopsies showed a lack of PD-L1 upregulation by either tumour cells or tumour-infiltrating immune cells. These growing tumours displayed one of three patterns: (1) little or no tumour-infiltrating immune cell infiltration (‘immunological ignorance’; Fig. 4b and Extended Data Fig. 8a); (2) presence of an intra-tumoral immune infiltrate with minimal to no expression of PD-L1 (‘non-functional immune response’; Fig. 4b and Extended Data Fig. 8b); or (3) presence of an immune infiltrate that resided solely around the outer edge of the tumour cell mass (‘excluded infiltrate’; Fig. 4b and Extended Data Fig. 9). Chip analysis of samples from these non-responders failed to provide evidence of activated T cells (Extended Data Figs 8b and 9). In cases where an excluded infiltrate of CD81 T cells was observed before treatment, PD-L1 inhibition did not induce infiltration, although both proliferation and PD-L1 expression were detected in tumour-infiltrating immune cells at the tumour margin (Fig. 4b). Non-functional immune responses may explain why the presence of pre-treatment CD81 T cells in tumours (as opposed to the presence of PD-L1-positive infiltrates) failed to predict responses to MPDL3280A (Fig. 4b and Extended Data Fig. 8b).
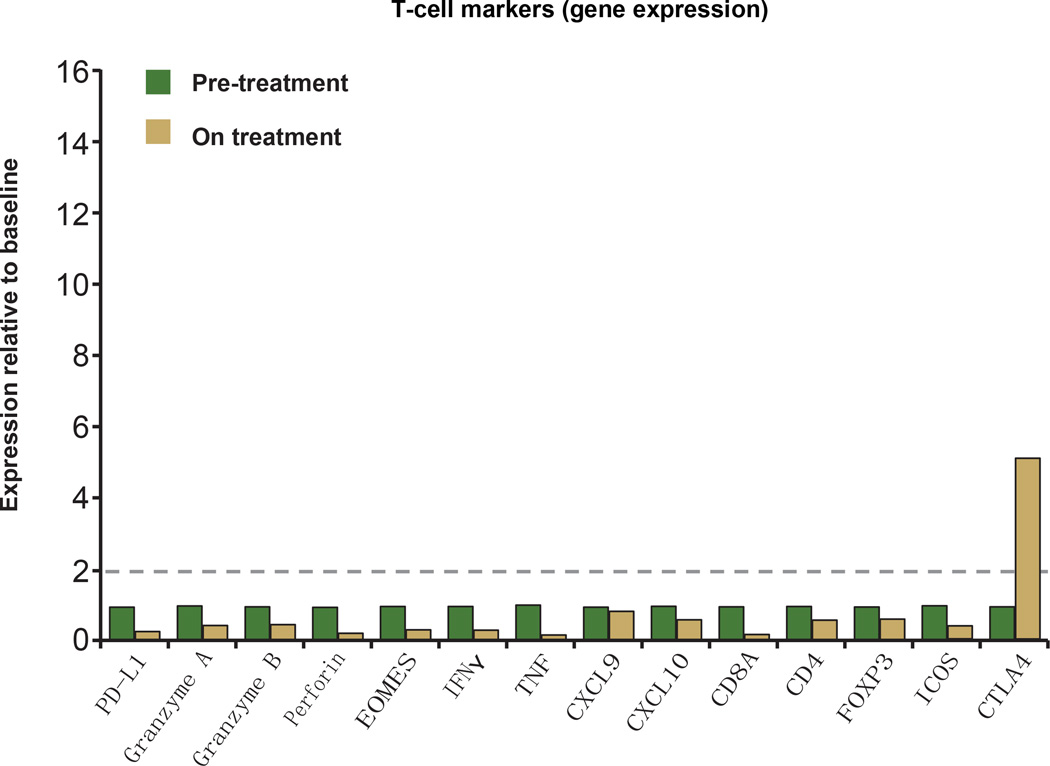
Tumours that were non-responsive to MPDL3280A also did not exhibit an upregulation of genes associated with enhanced T-effector-cell activity in contrast to MPDL3280A–responsive tumours. Additionally, the expression of FOXP3 neither increased nor decreased in responding lesions, suggesting that T-regulatory cells may not have a major role in anti-PD-L1-responsive tumours.
Blood-based immune biomarkers were also examined. Several changes were observed, but these did not track significantly with response or progression following MPDL3280A administration. Increases in IL-18, ITAC (also called CXCL11 or IP-9) and CD81HLA-DR1Ki-671 T cells, as well as a modest increase in IFN-c, were observed during the first cycle of treatment (Extended Data Fig. 2b, c), whereas the average IL-6 expression levels exhibited a downward trend by cycle 2, day 1.
In recent years it has become clear that modulation of a patient’s immune system can be an effective cancer therapy19–22; however, our understanding of human cancer immunology is incomplete. Therefore, as part of our phase Ia dose escalation and expansion study with MPDL3280A, we focused on understanding the biomarkers relating to the PD-L1– PD-1 pathway.
This MPDL3280A study did not follow the design of a traditional phase I clinical trial, but instead enrolled large numbers of patients with defined characteristics into expansion phases. MPDL3280A doses ranged from 0.01 to 20 mg kg21 q3w and clinical activity was seen from 1 to 20 mg kg21. The maximum tolerated dose of MPDL3280A was not reached, and no dose-limiting toxicities were observed (ref. 18). Because 15 mg kg21 q3w was sufficient to maintain target drug levels (based on clinical and non-clinical information), the equivalent fixed dose of 1,200 mg q3w is being moved forward in clinical development as monotherapy. The accompanying report (ref. 18) additionally describes the activity of MPDL3280A in bladder cancer.
In addition to observing clinical responses greater than the historic averages in these refractory patient populations, our most important finding was the association of PD-L1 expression with clinical response to MPDL3280A. It was unexpected that the association of tumour-infiltrating immune cell PD-L1 expression with treatment response appeared stronger than that with tumour cell PD-L1 expression. This finding appears inconsistent with a simple ‘adaptive response’ hypothesis where T-cell-derived IFN-c induces protective expression of PD-L1 by the tumour cells12,23. While upregulation of PD-L1 by tumour cells occurred post-treatment in responders, our results instead suggest that tumour-infiltrating immune cells may be more sensitive to IFN-c expression and may act preferentially to suppress pre-existing T-cell responses before therapy. These data indicate that, although additional immune regulatory pathways may be involved, PD-L1 appears to have a dominant role in direct T-cell immunosuppression. Furthermore, intratumoral expression of PD-L2 did not affect the response to anti-PD-L1, and the expression of other T-cell negative regulators also failed to correlate with poor response. Although we cannot exclude the possibility that inhibiting these receptors might enhance responses to PD-L1 blockade, it was striking that MPDL3280A was effective despite their presence24,25.
Higher pre-treatment expression of CTLA4 was observed to correlate with response to MPDL3280A. These results suggest that CTLA4, although an important regulator during T-cell expansion, is also a marker of the presence of activated T cells whose functional role as a negative regulator of intra-tumoral T cells appears to be less important than that of PD-L1 (refs 19, 22). Another correlation was that of elevated pre-treatment fractalkine expression with disease progression. This result was unexpected because this chemokine is generally associated with T-cell infiltration.
We also examined blood-based biomarkers. The observed rise in ITAC—an IFN-c inducible chemokine that is chemotactic for activated T cells26 and IL-18, a pro-inflammatory cytokine whose presence generally induces, rather than reflects, IFN-c release—suggests the rapid expansion of a pre-existing primed immune state, perhaps even extratumorally. The increases in activated cytotoxic T lymphocytes during this same time frame and the clinical reports of fever during cycle 1 further support this notion27,28 and indicate that PD-L1 blockade may also contribute to an overall expansion of the T-cell compartment at the level of antigen-presenting cells. The decrease in IL-6 may be indicative of the opposing role of effector T cells and suppressive myeloid cells. Given that these changes do not clearly segregate responding patients, they may reflect a systemic re-priming and expansion of both pre-existing antitumour T-cell and non-tumour-directed T-cell populations.
In summary, this study analysed the mechanisms associated with clinical response and lack of response to MPDL3280A, providing evidence the ‘inflamed tumour’ hypothesis12,29. However, larger studies will be needed to study the relationship between PD-L1 expression and patient survival. Pre-existing immunity is probably necessary for most responses, and is further amplified during treatment. While important to further characterize the immune profile of responders, understanding the profile of non-responders will probably provide even more valuable information, possibly revealing the diversity of mechanisms controlling antitumour immunity and suggesting new strategies to promote the cancer immunity cycle5.
METHODS
Study oversight
This study was sponsored by Genentech Inc., a member of the Roche Group, which provided the study drug. The protocol and its amendments were approved by the relevant institutional review boards or ethics committees, and all participants provided written informed consent. This study was conducted in accordance with the Declaration of Helsinki and International Conference on Harmonization Guidelines for Good Clinical Practice. ClinicalTrials.gov: NCT01375842 (http://www.clinicaltrials.gov/ct2/show/NCT01375842?term5NCT01375842&rank51).
Study design
The goal of this study was to evaluate the single-agent safety and tolerability of MPDL3280A, a human, monoclonal, engineered anti-PD-L1 antibody administered by intravenous infusion every 3 weeks (q3w) to patients with locally advanced or metastatic solid tumours or haematological malignancies. Treatment was continued for 16 cycles or 1 year unless a patient experienced: (1) disease progression as assessed by Response Evaluation Criteria in Solid Tumours version 1.1 (RECIST v1.1) by physical examination and radiographic assessment, primarily computed tomography scan30 and immune-related response criteria17; and/or (2) loss of clinical benefit as assessed by the investigator; and/or (3) unacceptable toxicity as assessed by the investigator. Patients were allowed to continue to receive study treatment at the discretion of the investigator if pseudoprogression was suspected or if there was evidence of a mixed response.
The primary objectives of this study were to evaluate the safety and tolerability of MPDL3280A q3w, to determine the maximum tolerated dose (MTD) and to evaluate dose-limiting toxicities (DLTs) of MPDL3280A when administered as a single agent and to identify a recommended phase 2 dose of single-agent MPDL3280A. The secondary objectives of this study were to evaluate the pharmacokinetics of MPDL3280A when administered as a single agent, to characterize the immunogenic potential of MPDL3280A, and to make a preliminary assessment of the antitumour activity of MPDL3280A as a single agent.
This phase I study followed an adaptive design to allow for tumour-specific cohorts and biomarker (PD-L1 positive) enriched cohorts. Within each indication of the expansion cohort, the following futility type rule was applied: if no responders (CR or PR) were observed from the first 14 patients (who may have been selected based on the presence of biomarkers potentially predictive of antitumour activity), enrolment would be suspended for that indication. With the assumption of a true response rate of 20% or higher, there was at most a 4.4% chance of not observing any response in 14 patients. Numbers were increased to include adequate biomarker positive and negative patients per protocol.
Safety evaluations (clinical and laboratory) were performed at screening and throughout the trial. A final evaluation occurred by 30 days after the last dose. The incidence, nature and severity of adverse events (AEs) were graded according to National Cancer Institute Common Terminology Criteria for Adverse Events, version 4.0, http://ctep.cancer.gov/protocolDevelopment/electronic_applications/ctc.htm (2013).
Any evaluable or measurable disease was documented at screening and reassessed at each tumour evaluation. Tumour evaluations were performed at the ends of cycles 2, 4, 6, 8, 12 and 16 or as clinically indicated. Assessments were performed during the last week of the drug-administration cycle and before the start of treatment in the next cycle. Patients who discontinued study treatment for reasons other than disease progression continued to have tumour assessments every 12 weeks until the patient experienced disease progression, initiated further systemic cancer therapy, or died.
DLTs were defined as neutropenia grade $4; febrile neutropenia grade $3; thrombocytopenia grade $4 that lasted $48 h; any grade 3 non-haematological or non-hepatic major organ AE, with the exception of nausea, vomiting, or diarrhoea, that resolved without treatment before the next infusion; and any hepatic toxicity grade −3, except for in patients with grade 2 aspartate aminotransferase, alanine aminotransferase, and/or alkaline phosphatase abnormality at baseline; an increase in the baseline abnormality to >10 times the upper limit of normal was considered a DLT.
Dose escalation
Single-patient dose escalation was used for the 0.01, 0.03 and 0.1 mg kg21 cohorts (a minimum of one patient was enrolled into these cohorts). A traditional 3 1 3 dose-escalation scheme was used for the 0.3, 1, 3, 10 and 20 mg kg21 cohorts (a minimum of three patients was enrolled into these cohorts). The DLT window was 21 days following the first dose of MPDL3280A. Intra-patient dose escalation was not allowed. An MTD was not reached.
Cohort expansion
Five expansion cohorts were opened, including one each for patients with NSCLC, RCC and melanoma. Two additional expansion cohorts were opened, one for patients with other tumour types and one for patients who received mandatory serial tumour biopsies. Patients enrolled in these cohorts received MPDL-3280A at 10, 15 or 20 mg kg21. Intra-patient dose escalation was allowed.
Patients
As established in the study protocol, patients were eligible to participate in the study if they were $18 years old; had a documented, incurable, or metastatic solid tumour or haematological malignancy; had adequate haematological and end-organ function; and had an Eastern Cooperative Oncology Group performance status of 0 or 1. For patients with solid tumours, disease had to be measurable per RECIST. Disease-specific criteria were used for patients with haematological malignancies. Patients with known primary central nervous system (CNS) malignancy or symptomatic CNS metastases, history or risk of autoimmune disease, or history of human immunodeficiency virus, hepatitis B, or hepatitis C infection were excluded. Also excluded were patients who received prior treatment with anti-CTLA-4, anti-PD-1, or anti-PD-L1 therapeutic antibodies or pathway-targeting agents as well as patients who were treated with systemic immunostimulatory agents or systemic immunosuppressive medications within a specified period before study start. Patients with ocular or mucosal melanoma were not excluded from this study.
Patients on this study were offered the opportunity to participate in the serial biopsy portion of the study. Patients who agreed to participate completed a separate informed consent form for serial biopsies.
Pharmacokinetic analysis
Blood samples were obtained at various time points before and after MPDL3280A administration for pharmacokinetic testing.
Isolation of MPDL3280A
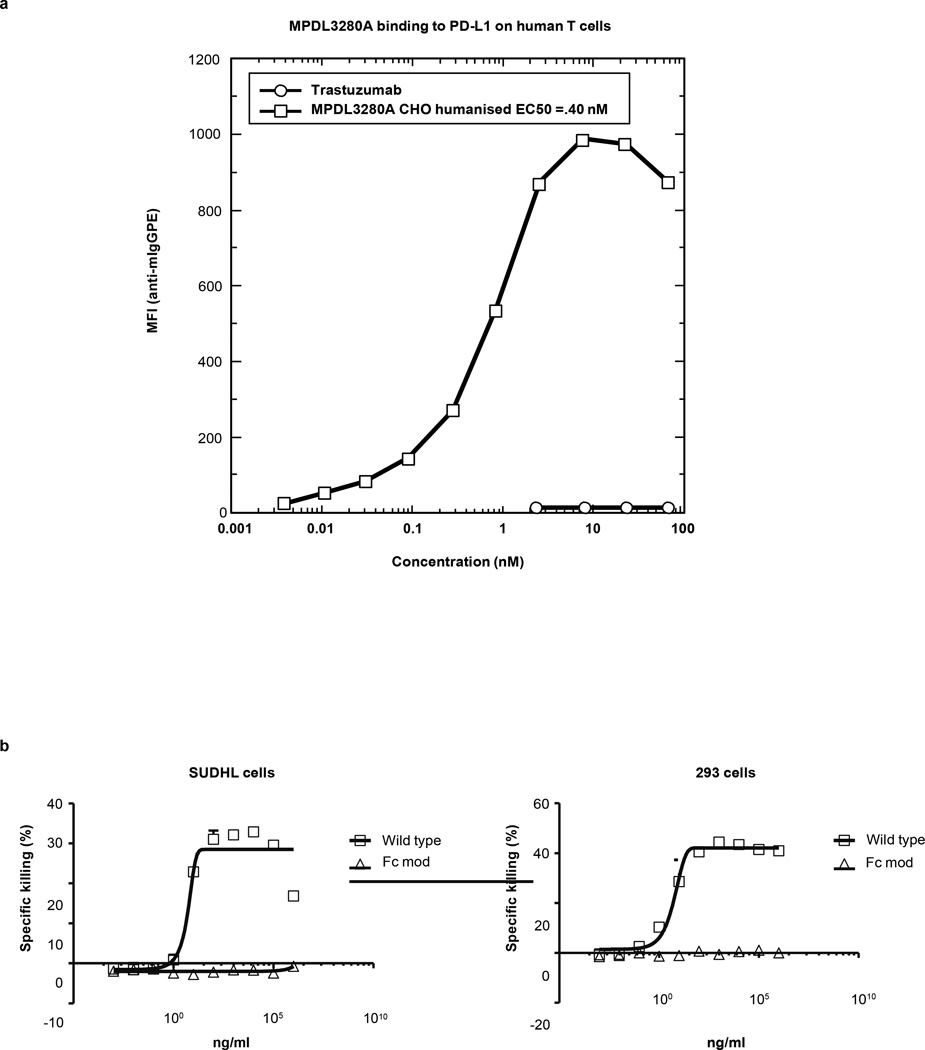
Although the details will be described elsewhere, the anti-PD-L1 antibody MPDL3280A was isolated by screening a human phage display library (Genentech) against a recombinant extracellular domain (ECD)–Fc fusion of human PD-L1 (see US Patent US 8,217,149B2). A high-affinity antibody was selected from a single phage clone (YW243.55.S70) on a human IgG1 backbone. Affinity measurements were conducted by surface plasmon resonance (Biacore) and binding to PD-L1-expressing human T cells (Extended Data Fig. 10a). Binding of MPDL3280A was strictly dependent on the expression of human PD-L1, while other monoclonal antibodies (for example, trastuzumab) did not bind to the same cells.
The selected antibody was also judged to compete with soluble PD-L1–ECD for binding to PD-1 and B7.1, either by blocking PD-L1–ECD-Fc binding to PD-1-or B7.1-expressing cells and PD-1–ECD or B7.1–ECD. The Fcdomainof MPDL3280A was engineered to render it effector-less by introducing an Asp to Ala change at position 298 in the CH2 domain of each heavy chain, which resulted in an anti-body devoid of N-linked oligosaccharides that was incapable of binding to human Fcc receptors (see US Patent US 8,214,149B2). In an in vitro assay for antibody-dependent cellular cytotoxicity (using human PBLs as effectors), the engineered anti-body was unable to mediate the killing of two cell lines transfected with human PD-L1, while efficient killing was observed using the unmodified ‘wild-type’ antibody (Extended Data Fig. 10b).
Immunohistochemical analysis for PD-L1 and CD8
Formalin-fixed, paraffin-embedded (FFPE) tissue sections of 4-mm thickness were stained for PD-L1 with an anti-human PD-L1 rabbit monoclonal antibody (clone SP142; Ventana, Tucson, AZ) on an automated staining platform (Benchmark; Ventana) using a concentration of 4.3 mg ml21, with signal visualization by diaminobenzidine; sections were counter-stained with haematoxylin. PD-L1 expression was evaluated on tumour cells and tumour-infiltrating immune cells. For tumour cells the proportion of PD-L1-positive cells was estimated as the percentage of total tumour cells; tumour cells typically showed membranous staining with avariably strong component of cytoplasmic staining. The distribution of PD-L1-positive tumour cells within a given tumour sample was typically very focal; in tumours growing as solid aggregates positive tumour cells were more commonly observed at the interface between malignant cells and stroma containing tumour-infiltrating immune cells. For tumour-infiltrating immune cells, the percentage of PD-L1-positive tumour-infiltrating immune cells occupying the tumour was recorded; tumour-infiltrating immune cells with clearly discernible cytoplasm, such as macrophages and dendritic cells, showed a membranous staining pattern for PD-L1—this was more difficult to determine for cells of small lymphoid morphology with scant amounts of cytoplasm. PD-L1-positive tumour-infiltrating immune cells were typically seen as variably-sized aggregates towards the periphery of the tumour mass or in stromal bands dissecting the tumour mass or as single cells scattered in stroma or within tumour-infiltrating immune cell aggregates. Specimens were scored as IHC 0, 1, 2, or 3 if, 1%, $1% but, 5%, $5% but, 10%, or $10% of cells per area were PD-L1 positive, respectively. PD-L1 scores in patients with multiple specimens were based on the highest score. Based on the complexity of our scoring algorithm, we determined concordance between individual reads by different pathologists; in a cohort of >200 NSCLC samples, concordance between two pathologists was >90%. CD8 (clone SP16 (Epitomics)) IHC was performed on a Discovery XT autostainer (Ventana) using CC1 antigen retrieval and OmniMap (Ventana) detection technology.
Dual-colour immunofluorescence
Sections of FFPE tumour tissues were incubated with primary antibodies for PD-L1 and CD3 (clone SP34-2; Pharmingen), CD163 (clone 10D6; Novus Biologicals), CD11c (clone EP1347Y; Novus Biologics), or cytokeratin (CK; clone 5D3/LP34, Abcam) at room temperature. Detection was performed using Novocastra PowerVision Poly-HRP IHC Detection Systems (Leica) followed by Alexa Fluor 594 Tyramide Signal Amplification (TSA) Kit 25 or Alexa Fluor 488 TSA Kit 22 (Life Technologies) according to the manufacturers’ instructions. Slides were mounted in ProLong Gold Antifade Reagent with DAPI (Life Technologies).
DNA and RNA isolation from FFPE tumour tissue
DNA and RNA isolation was performed as described previously31. Briefly, tumour FFPE sections were macro-dissected to enrich for neoplastic tissue, and tissue was lysed using tumour lysis buffer and Proteinase K to allow for complete digestion and release of nucleic acids. RNA was isolated using the High Pure FFPE RNA Micro Kit (Roche Applied Sciences, Indianapolis, IN) according to the manufacturer’s protocol. DNA was isolated using the QIAamp DNA FFPE Tissue Kit (Qiagen, Hilden, Germany) according to the manufacturer’s protocol. RNA and DNA were stored at 280 °C until the analyses were performed.
Fluidigm expression analysis
Gene-expression analysis was performed using the BioMark HD real-time PCR Platform (Fluidigm) as described previously31. All Taqman assays in the expression panel were FAM-MGB and ordered through Life Technologies either made-to-order or custom-designed, including four reference genes: SP2, GUSB, TMEM55B and VPS33B. A geometric median of the Ct values for the four reference genes (SP2, GUSB, TMEM55B and VPS33B) was calculated for each sample, and expression levels were determined using the delta Ct (DCt) method as follows: Ct (target Gene) 2 GeoMedian Ct (reference genes). Median mRNA expression levels (as measured by immunochip (iChip)) across patients on study were used as cutoffs to derive high-versus low-expression categorization. P values were determined by t test.
The genespresent on the iChip are as follows: ARG1, B7-H3, B7-H4, BTLA, CCL2, CCL22, CCL28, CCL5, CCR5, CCR7, CD1C, CD244, CD27, CD28, CD3E, CD4, CD40, CD40LG, CD45, CD45RO, CD48, CD69, CD70, CD80, CD86, CD8A, CLEC4C, CSF2, CTLA4, CX3CL1, CXCL10, CXCL9, CXCR3, EOMES, EPCAM, FOXP3, granzyme-A, granzyme-B, GUSB, HLA-A, HLA-B, HLA-C, HLA-E, ICAM1, ICOS, IDO1, IFNc, IL10, IL12A, IL13, IL17A, IL17F, IL1B, IL2, IL2RA, IL4, IL6, IL7, IL7R, IL8, ITGAM, ITGAX, KLRK1, LAG3, LGALS9, MAP4K1, MICA, MICB, MS4A1, NCAM1, PD-L1, PD-L2, PD-1, perforin, PTGER2, PTGER4, PTGS2, RORC, SDHA, SP2, TBX21, TFRC, TGFB1, TIM3, TMEM55B, TNF, TNFRSF14, TNFRSF4, TNFRSF9, TNFSF4, TNFSF9, VCAM1, VEGFA, VPS33B.
The association between expression of IFN-c, TH1 phenotypes, CTLA4 and fractalkine with response to MPDL3280A was identified by t-test (P < 0.05). CD27, CXCR3, CD45RO, GZMB and CD8A are other individual genes with a P value of, 0.05 for this association. Because these genes are all part of the TH1 phenotype, all genes with a P value of, 0.05 for the association of expression and response to MPDL3280A are discussed here.
FACS analysis
Blood was collected in a 5-ml NaHep tube using standard venipuncture techniques and inverted 10 times to ensure that the blood mixed with the additive. Subsequently, the blood was analysed for CD3, CD8, HLA-DR and Ki-67 expression by FACS at the central laboratory (LabCorp) according to the laboratory protocol.
Plasma cytokine analysis
Blood was collected in a 6-ml NaHep tube using standard venipuncture techniques and inverted 10 times to ensure that the blood mixed with the additive. Within 30 min of collection, blood was centrifuged in a refriger-atedcentrifuge at a minimum of 1,500 to 2,000g for 15 min. Plasma was collected and stored at 220 °C. Subsequently, plasma was analysed for IFN-c, interleukin 6, inter-leukin 18, or ITAC measurement using enzyme-linked absorbent assay or by Rules Based Medicine (Myriad RBM), according to the manufacturers’ recommendations.
Statistical analysis
Data from all 277 patients with advanced incurable cancer who received $1 dose of MPDL3280A intravenously every 21 days by the clinical cutoff date of 30 April 2013 were used to determine baseline characteristics and rates of adverse events. The efficacy analysis included 175 patients with a baseline tumour assessment who received $1 mg kg21 of MPDL3280A by 1 October 2012. Efficacy was assessed according to RECIST30. The best overall response is the best response recorded from the start of treatment until disease progression/recurrence (taking as reference for progressive disease the smallest measurements taken since the treatment started). The best overall objective response rate (confirmed except for one patient with NSCLC, one patient with RCC and two patients with melanoma) was derived from investigator-reported assessments. Objective response rate (ORR) was defined as the number of patients with a best overall objective response of complete or partial response divided by the total number of patients with a baseline tumour assessment who received $1 mg kg21 of MPDL3280A. The analysis of response by smoking status was exploratory. The P value was determined using a Fisher exact test. Study design considerations (in terms of sample size) were not made with regard to explicit power and control of type I error considerations but were made to obtain preliminary safety, pharmacokinetic and pharmacodynamic information.
An association of response with both PD-L1 tumour-infiltrating immune cell IHC and PD-L1 tumour cell IHC was evaluated using a logistic regression model in the all-tumours and NSCLC subsets. The dependent variable was defined as response (yes versus no), and IHC categories (four levels) were included in the model as independent variables. In the case of zero counts of responders in any of the IHC categories (such as in the IHC 1 category for tumour cells in the all-tumours subset), the category was combined with an adjacent one into one category in the logistic regression model. The P values to test the null hypothesis that the odds ratios of the IHC categories are equal were obtained from the likelihood ratio test.
Progression-free survival was defined as the time between the date of first dose and the date of first documented disease progression or death. Disease progression was determined on the basis of investigator assessment using RECIST. Patients who were alive and did not experience disease progression at the cutoff date of 30 April 2013 were censored at the time of last tumour assessment. Patients with no post-baseline tumour assessment were censored at the first dose date plus 1 day.
Summaries of all AEs, AEs related to treatment, and grade 3–4 AEs are provided from all 277 patients. AEs of special interest included conditions suggestive of an autoimmune disorder, including, but not limited to, colitis and diabetes. Additionally, grade $3 acute infections or events suggestive of hypersensitivity, cytokine release, systemic inflammatory response, or infusion-reaction syndrome were considered AEs of special interest.
Pharmacodynamic changes of each marker were evaluated in the framework of linear mixed-effects models. For each marker, the model was fit to the log2-transformed data with patient as the random effect and time points as the fixed effect. The mean changes from C1D1 and their associated standard errors at each time point were derived from the model. P values were adjusted using the Bonferroni correction, taking into account the multiplicity of number of time points.
Extended Data
Extended Data Figure 1. Study design and pharmacokinetics.
a, Summary of PCD4989g design, including screening, treatment period and follow-up. b, Summary of the dose-escalation (patient numbers are given in the lower right corners) and dose-expansion cohorts. c, Pharmacokinetics for MPDL3280A. Error bars indicate standard deviation. C, cycle; CR, complete response; CT, computed tomography; DLT, dose-limiting toxicity; IV, intravenous; NSCLC, non-small cell lung cancer; PD, progressive disease; PR, partial response; RCC, renal cell carcinoma; RECIST, Response Evaluation Criteria in Solid Tumours; SD, stable disease.
Extended Data Figure 2. Pyrexia and biomarkers over time.
a, The graph on the left shows patients who developed pyrexia during the first cycle of MPDL3280A treatment by day. The graph on the right shows patients who developed pyrexia during all cycles of treatment with MPDL3280A. The percentage of patients with pyrexia and the number of patients available for analysis at each time point is indicated below the graph. b, Changes in CD81HLA-DR1Ki-671 cells over the first 5 cycles of treatment with MPDL3280A. The y axis represents the log2 fold-change versus C1D1 pre-dose level. Error bars are standard error of the mean. Samples from 164 patients were examined at cycle (C) 1 day (D) 1 (C1D1) and 145 patients at C2D1. The P value for the difference in fold change between C2D1 versus C1D1 was, 0.00001. c, Changes in IFN-c, ITAC, IL-18 and IL-6 levels shown over the first seven 21-day cycles of treatment with MPDL3280A. To measure fold changes in IFN-c and IL-6 levels, 112 and 109 patient samples were examined for C1D1 and C2D1, respectively. To measure fold changes in IL-18, 260 and 253 patient samples were examined for C1D1 and C2D1, respectively; to measure ITAC, 262 and 256 patient samples were examined for C1D1 and C2D1, respectively. The adjusted P values comparing C2D1 versus C1D1 were 0.94 for IFN-c, 1 for IL-6, 0.00001 for IL-18 and, 0.00001 for ITAC. Error bars are standard error of the mean.
Extended Data Figure 3. Antitumour activity of MPDL3280A in patients with all tumour types.
a, Time to response and the duration of study treatment by tumour type and IHC (tumour-infiltrating immune cell) status. b, Representative images (103 magnification) of PD-L1 and CD8 immunohistochemistry (IHC) staining from a pre-treatment tumour biopsy sample from a patient with NSCLC. The patient’s best response to MPDL3280A was a partial response. CRC, colorectal cancer; IC, tumour-infiltrating immune cells; ND, not determined; NSCLC, non-small cell lung cancer; PD, progressive disease; RCC, renal cell carcinoma; TC, tumour cells.
Extended Data Figure 4. Antitumour activity of MPDL3280A by PD-L1 immunohistochemistry (IHC) status.
a, The overall objective response rate (ORR; best response of complete response (CR) and partial response (PR)), stable disease (SD) as the best response rate and progressive disease (PD) as the best response rate for patients with non-small cell lung cancer (NSCLC) who received MPDL3280A by PD-L1 IHC (tumour-infiltrating immune cell (IC)) status. Overall, 53 patients with NSCLC were evaluated: 6 patients had an IHC (IC) score of 3; 7 patients had a score of 2; 13 patients had a score of 1; and 20 patients had a score of 0. Seven patients had an unknown IHC status (data not shown). Patients with no post-first dose assessment were not estimable and not plotted (1 in IHC 1 and 1 in IHC 2), but were included in the denominator for purposes of calculating ORR. Using a logistic regression model, PD-L1 by IHC (IC) was significantly associated with response to MPDL3280A (P = 0.015). b, The ORR, SD as best response rate, and PD as best response rate for patients with all tumour types who received MPDL3280A by PD-L1 IHC (IC) status. Patients with no post-first dose assessment were not estimable (NE) and not plotted (1 in IHC 0, 2 in IHC 1, 1 in IHC 2 and 1 in IHC 3), but were included in the denominator for purposes of calculating ORR. Using a logistic regression model, PD-L1 by IHC (IC) was significantly associated with response to MPDL3280A (P = 0.007). c, The ORR, SD as best response rate, and PD as best response rate for patients with NSCLC who received MPDL3280A by PD-L1 IHC (TC) status. Overall, 53 patients with NSCLC were evaluated: 8 patients had an IHC score of 3; 1 patient had a score of 2; 3 patients had a score of 1; and 34 patients had a score of 0. Seven patients had an unknown IHC status (data not shown). Patients with no post-first dose assessment were not estimable and not plotted (2 in IHC 0), but were included in the denominator for purposes of calculating ORR. All responses were confirmed except for in 1 patient. Using a logistic regression model, PD-L1 by IHC (TC) did not meet statistical significance for association with response (P = 0.920). d, The ORR and SD and PD best response rates for patients with all tumour types who received MPDL3280A by PD-L1 IHC (TC) status. Overall, 175 patients with all tumour types were evaluated: 15 patients had an IHC score of 3; 3 patients had a score of 2; 11 patients had a score of 1; and 121 patients had a score of 0; 25 patients had an unknown IHC status (data not shown). Patients with no post-first dose assessment were not estimable and not plotted (3 in IHC 0, 1 in IHC 1 and 1 in IHC 3), but were included in the denominator for purposes of calculating ORR. All responses were confirmed except for in 1 patient with NSCLC, 1 patient with RCC and 2 patients with melanoma. Using a logistic regression model, PD-L1 by IHC (TC) did not meet statistical significance for the association with response (P = 0.079).
Extended Data Figure 5. Biomarkers and antitumour activity of MPDL3280A.
a, Objective response rates (ORRs) were plotted by the biomarker status of tumour samples from patients who had tumour available for both immunohistochemistry (IHC) staining and immunochip (n = 37). Left: ORRs for patient sub-populations defined by positivity in a single biomarker as indicated. Right: ORRs for patients positive for PD-L1 and one other marker as indicated. PD-L1 positivity was defined as $5% of tumour-infiltrating immune cells (ICs) staining for PD-L1 by IHC. For PD-L2, IDO1, LAG3, TIM3, CTLA4, B7-H3 and B7-H4 positivity was determined by gene expression $ the median. b, Baseline CX3CL1 and CTLA4 gene expression levels are binned according to patient response to treatment with MPDL3280A. Includes patients with all tumour types. P values were determined by t-test. c, Changes in PD-L1 (IHC) versus interferon (IFN)-c (qPCR) expression after treatment with MPDL3280A in patients with paired serial biopsies. Pearson correlation coefficient = 0.70. CR, complete response; PD, progressive disease; PR, partial response; RECIST, Response Evaluation Criteria in Solid Tumours.
Extended Data Figure 6. Gene expression levels according to patient response and tumour type.
Baseline IFNc, IDO1 and CXCL9 gene expression levels are binned according to patient response to treatment with MPDL3280A. Patients are grouped according to tumour type. P values were determined by t-test. CR, complete response; NSCLC, non-small cell lung cancer; PD, progressive disease; PR, partial response; RCC, renal cell carcinoma.
Extended Data Figure 7. Biomarker analyses for a responding patient receiving MPDL3280A.
A patient with PD-L1-positive (IHC (IC) 3) renal cell carcinoma who responded to treatment with MPDL3280A. a, Representative computed tomography scans taken at pre-treatment and at post-cycle. Red arrows indicate the location of tumours or where tumours used to be. b, Top panel: representative image of CD8 IHC staining from a pre-treatment tumour biopsy (403 magnification). Bottom panel: representative image of CD8 IHC staining from a tumour biopsy of a shrinking lesion during week 4 of treatment with MPDL3280A that demonstrates an increase in CD81 T-cell infiltration (203 magnification). c, Gene-expression analysis of T-cell markers pre-treatment (set to 1) and on treatment at week 4. Data were normalized to the baseline. Twofold was the cutoff for a gene to be considered induced (indicated by the dashed line).
Extended Data Figure 8. Biomarker analyses of patients with immunological ignorance and a non-functional immune response.
a, A patient with PD-L1-negative (IHC (IC) 0) breast cancer whose best response to MPDL3280A was progressive disease with immunological ignorance. Top: representative image of PD-L1 IHC staining from a pre-treatment tumour biopsy. Bottom: representative image of PD-L1 IHC staining from a tumour biopsy during week 9 of treatment with MPDL3280A. Both images are at 103 magnification. b, A patient with PD-L1 IHC 1 melanoma whose best response to MPDL3280A was progressive disease with a non-functional immune response. Gene-expression analysis of T-cell markers at pre-treatment (set to 1) and on treatment at week 6. Data were normalized to baseline. Twofold was the cutoff for a gene to be considered induced (indicated by the dashed line).
Extended Data Figure 9. Biomarker analyses of a patient with an excluded infiltrate.
A patient with PD-L1-negative (IHC (IC) 1) melanoma whose best response to MPDL3280A was progressive disease with an ‘excluded infiltrate’. Gene expression analysis of T-cell markers at pre-treatment (set to 1) and on treatment at week 6. Data were normalized to baseline. Twofold was the cutoff for a gene to be considered induced (indicated by the dashed line).
Extended Data Figure 10. Characterization of MPDL3280A.
a, Affinity measurements conducted by surface plasmon resonance and binding to PD-L1-expressing human cells using MPDL3280A and trastuzumab. Data from a representative experiment (1 of 4) is shown here. b, In vitro assays for antibody-dependent cellular cytotoxicity. The wild-type antibody is unmodified and the Fc modified MPDL3280A antibody has an engineered Fc domain. GPE, glycophorin E; MFI, mean of fluorescence intensity.
Extended Data Table 1.
Patient demographics and disease characteristics (safety population)
| Characteristics (NSCLC) | N = 85 |
|---|---|
| Median age (range), y | 60 (24–84) |
| Sex, male/female, n (%) | 48 (56)/37 (44) |
| ECOG PS, 0 / 1, n (%) | 27 (32)/58 (68) |
| Histology | |
| Squamous, n (%) | 20 (24) |
| Non-squamous, n (%) | 65 (76) |
| Prior systemic regimens* | |
| 1 | 13 (15) |
| 2 | 23 (27) |
| ≥ 3 | 47 (55) |
| CNS metastasis, yes/no, n (%) | 4 (5)/81 (95) |
| Smoking status | |
| Current/previous | 68 (80) |
| Never | 17 (20) |
| EGFR status, n (%) | |
| Wild type | 51 (60) |
| Mutant | 11 (13) |
| Unknown | 23 (27) |
| Characteristics (all patients) | N = 277 |
|---|---|
| Median age (range), y | 61 (21 – 88) |
| Sex, male/female, n (%) | 174 (62.8)/103 (37.2) |
| Tumor type, n (%) | |
| Melanoma | 45 (16) |
| Renal cell carcinoma | 68 (25) |
| Non-small cell lung cancer | 85 (31) |
| Other† | 79 (29) |
| ECOG PS, n (%) | |
| 0 | 140 (50) |
| 1 | 137 (50) |
| Prior surgery, n (%) | 245 (88) |
| Prior radiotherapy, n (%) | 129 (47) |
| Prior number of systemic regimens, wn (%) ‡ | |
| 0 | 33 (12) |
| 1 | 57 (21) |
| 2 | 61 (22) |
| 3 | 34 (12) |
| ≥ 4 | 92 (33) |
CNS, central nervous system; ECOG, Eastern Cooperative Oncology Group; EGFR, epidermal growth factor receptor; PS, perfor mance status.
Systemic regimens administered in the metastatic, adjuvant or neoadjuvant setting. 2% of patients had no prior systemic regimens.
Sarcoma (n = 4), ovarian (n = 4), head and neck (n = 10), cervical (n = 1), breast (n = 10), colorectal (n = 14), bladder (n = 7), malignant lymphoma (n = 7), multiple myeloma (n = 4), pancreatic (n = 5), small cell lung (n = 3), gastric (n = 6), oesophageal (n = 1), uterine (n = 1), neuroendocrine (n = 1) and pancreatoduodenal (n = 1).
Systemic regimens administered in the metastatic, adjuvant or neoadjuvant setting.
Acknowledgements
We thank the patients and their families. We also thank all of the investigators and their staff, including A. Balmanoukian and P. Boasberg from The Angeles Clinic and Research Institute; T. Powles from Barts Cancer Institute, QMUL, Barts Health NHS Trust; D. Cho from NYU Langone Medical Center; P. Cassier from Centre Le´on-Be´rard; F. Braiteh from USON Research Network, Comprehensive Cancer Centers of Nevada; N. Vogelzang from USON Research Network, Comprehensive Cancer Centers of Nevada and University of Nevada; T. Choueiri, L. Gandhi, N. Ibrahim and P. Ott from Dana-Farber Cancer Institute; J.-P. Delord and C. Gomez-Rocca from Institut Claudius Regaud; A. Hollebecque and R. Bahleda from Gustave Roussy; L. Emens from Johns Hopkins Medicine, The Sidney Kimmel Comprehensive Cancer Center; K. Flaherty and R. Sullivan from Massachusetts General Hospital; S. Antonia from Moffitt Cancer Center; H. Burris, J. Infante and D. Spigel from Sarah Cannon Research Institute; G. Fisher from Stanford Medicine, Cancer Institute; P. Conkling and Garbo from US Oncology Research, Inc.; C. Cruz and J. Tabenero from Vall d’Hebron Institute of Oncology and Vall d’Hebron University Hospital; W. Pao and I. Puzanov from Vanderbilt-Ingram Cancer Center; P. Eder, H. Kluger and M. Sznol from Yale Cancer Center. From Genentech, we thank M. Anderson, M. Boe, Z. Boyd, C. Chappey, Denker, R. Desai, L. Fu, B. Irving, D. Jin, W. Kadel, R. Nakamura, I. Rhee, X. Shen, M. Stroh, T. Sumiyoshi, J. Wu, Y. Xin and J. Yi. Support for third-party writing assistance for this manuscript was provided by F. Hoffmann-La Roche Ltd. NCI grants 1R01CA155196 (Battle-2) and P30 CA 016359 (CCSG) to R.S.H. helped support the infrastructure for this trial and program.
Footnotes
Online Content Methods, along with any additional Extended Data display items and Source Data, are available in the online version of the paper; references unique to these sections appear only in the online paper.
Author Contributions R.S.H., J.-C.S., D.S.C., F.S.H. and J.A.S. contributed to the overall study design. M.K., S.R., Y.X., H.K. and P.S.H. provided the biomarker studies. M.L. performed the pharmacokinetic analysis. I.M. provided the pre-clinical analysis. A.M. performed the statistical analysis. All authors analysed the data. All authors contributed to writing the paper.
Author Information The authors declare competing financial interests: details are available in the online version of the paper. Readers are welcome to comment on the online version of the paper.
References
- 1.Mellman I, Coukos G, Dranoff G. Cancer immunotherapy comes of age. Nature. 2011;480:480–489. doi: 10.1038/nature10673. [DOI] [PMC free article] [PubMed] [Google Scholar]
- 2.Chen DS, Irving BA, Hodi FS. Molecular pathways: next-generation immunotherapy-inhibiting programmed death-ligand 1 and programmed death-1. Clin. Cancer Res. 2012;18:6580–6587. doi: 10.1158/1078-0432.CCR-12-1362. [DOI] [PubMed] [Google Scholar]
- 3.van Rooij N, et al. Tumor exome analysis reveals neoantigen-specific T-cell reactivity inan ipilimumab-responsivemelanoma. J. Clin. Oncol. 2013;31:e439–e442. doi: 10.1200/JCO.2012.47.7521. [DOI] [PMC free article] [PubMed] [Google Scholar]
- 4.Gros A, et al. PD-1 identifies the patient-specific CD81 tumor-reactive repertoire infiltrating human tumors. J. Clin. Invest. 2014;124:2246–2259. doi: 10.1172/JCI73639. [DOI] [PMC free article] [PubMed] [Google Scholar]
- 5.Chen DS, Mellman I. Oncology meets immunology: the cancer-immunity cycle. Immunity. 2013;39:1–10. doi: 10.1016/j.immuni.2013.07.012. [DOI] [PubMed] [Google Scholar]
- 6.Park JJ, et al. B7-H1/CD80 interaction is required for the induction and maintenance of peripheral T-cell tolerance. Blood. 2010;116:1291–1298. doi: 10.1182/blood-2010-01-265975. [DOI] [PMC free article] [PubMed] [Google Scholar]
- 7.Yang J, et al. The novel costimulatory programmed death ligand 1/B7.1 pathway is functional in inhibiting alloimmune responses in vivo . J. Immunol. 2011;187:1113–1119. doi: 10.4049/jimmunol.1100056. [DOI] [PMC free article] [PubMed] [Google Scholar]
- 8.Paterson AM, et al. The programmed death-1 ligand 1:B7-1 pathway restrains diabetogenic effector T cells in vivo . J. Immunol. 2011;187:1097–1105. doi: 10.4049/jimmunol.1003496. [DOI] [PMC free article] [PubMed] [Google Scholar]
- 9.Butte MJ, Keir ME, Phamduy TB, Sharpe AH, Freeman GJ. Programmed death-1 ligand 1 interacts specifically with the B7-1 costimulatory molecule to inhibit T cell responses. Immunity. 2007;27:111–122. doi: 10.1016/j.immuni.2007.05.016. [DOI] [PMC free article] [PubMed] [Google Scholar]
- 10.Dong H, Zhu G, Tamada K, Chen L. B7-H1, a third member of the B7 family, co-stimulates T-cell proliferation and interleukin-10 secretion. Nature Med. 1999;5:1365–1369. doi: 10.1038/70932. [DOI] [PubMed] [Google Scholar]
- 11.Day CL, et al. PD-1 expression on HIV-specific T cells is associated with T-cell exhaustion and disease progression. Nature. 2006;443:350–354. doi: 10.1038/nature05115. [DOI] [PubMed] [Google Scholar]
- 12.Taube JM, et al. Colocalization of inflammatory response with B7-h1 expression in human melanocytic lesions supports an adaptive resistance mechanism of immune escape. Sci. Transl. Med. 2012;4 doi: 10.1126/scitranslmed.3003689. 127ra37. [DOI] [PMC free article] [PubMed] [Google Scholar]
- 13.Matsumoto K, et al. B7-DC induced by IL-13 works as a feedback regulator in the effector phase of allergic asthma. Biochem. Biophys. Res. Commun. 2008;365:170–175. doi: 10.1016/j.bbrc.2007.10.156. [DOI] [PubMed] [Google Scholar]
- 14.Akbari O, et al. PD-L1 and PD-L2 modulate airway inflammation and iNKT-cell-dependent airway hyperreactivity in opposing directions. Mucosal Immunol. 2010;3:81–91. doi: 10.1038/mi.2009.112. [DOI] [PMC free article] [PubMed] [Google Scholar]
- 15.Isaacs JD, et al. A therapeutic human IgG4 monoclonal antibody that depletes target cells in humans. Clin. Exp. Immunol. 1996;106:427–433. doi: 10.1046/j.1365-2249.1996.d01-876.x. [DOI] [PMC free article] [PubMed] [Google Scholar]
- 16.Warncke M, et al. Different adaptations of IgG effector function in human and nonhuman primates and implications for therapeutic antibody treatment. J. Immunol. 2012;188:4405–4411. doi: 10.4049/jimmunol.1200090. [DOI] [PubMed] [Google Scholar]
- 17.Wolchok JD, et al. Guidelines for the evaluation of immune therapy activity in solid tumors: immune-related response criteria. Clin. Cancer Res. 2009;15:7412–7420. doi: 10.1158/1078-0432.CCR-09-1624. [DOI] [PubMed] [Google Scholar]
- 18.Powles T, et al. MPDL3280A treatment leads to clinical activity in metastatic bladder cancer. Nature. 2014 doi: 10.1038/nature13904. http://dx.doi.org/10.1038/nature13904. [DOI] [PubMed]
- 19.Hodi FS, et al. Improved survival with ipilimumab in patients with metastatic melanoma. N. Engl. J. Med. 2010;363:711–723. doi: 10.1056/NEJMoa1003466. [DOI] [PMC free article] [PubMed] [Google Scholar]
- 20.Brahmer JR, et al. Safety and activity of anti-PD-L1 antibody in patients with advanced cancer. N. Engl. J. Med. 2012;366:2455–2465. doi: 10.1056/NEJMoa1200694. [DOI] [PMC free article] [PubMed] [Google Scholar]
- 21.Topalian SL, et al. Safety, activity, and immune correlates of anti-PD-1 antibody in cancer. N. Engl. J. Med. 2012;366:2443–2454. doi: 10.1056/NEJMoa1200690. [DOI] [PMC free article] [PubMed] [Google Scholar]
- 22.Hamid O, et al. Safety and tumor responses with lambrolizumab (anti-PD-1) in melanoma. N. Engl. J. Med. 2013;369:134–144. doi: 10.1056/NEJMoa1305133. [DOI] [PMC free article] [PubMed] [Google Scholar]
- 23.Dong H, et al. Tumor-associated B7-H1 promotes T-cell apoptosis: a potential mechanism of immune evasion. Nature Med. 2002;8:793–800. doi: 10.1038/nm730. [DOI] [PubMed] [Google Scholar]
- 24.Park HJ, et al. Tumor-infiltrating regulatory T cells delineated by upregulation of PD-1 and inhibitory receptors. Cell. Immunol. 2012;278:76–83. doi: 10.1016/j.cellimm.2012.07.001. [DOI] [PubMed] [Google Scholar]
- 25.Spranger S, et al. Up-regulation of PD-L1, IDO, and Tregs in the melanoma tumor microenvironment is driven by CD81 T cells. Sci. Transl. Med. 2013;5 doi: 10.1126/scitranslmed.3006504. 200ra116. [DOI] [PMC free article] [PubMed] [Google Scholar]
- 26.Cole KE, et al. Interferon-inducible T cell alpha chemoattractant (I-TAC): a novel non-ELR CXC chemokine with potent activity on activated T cells through selective high affinity binding to CXCR3. J. Exp. Med. 1998;187:2009–2021. doi: 10.1084/jem.187.12.2009. [DOI] [PMC free article] [PubMed] [Google Scholar]
- 27.Wrammert J, et al. Rapid cloning of high-affinity human monoclonal antibodies against influenza virus. Nature. 2008;453:667–671. doi: 10.1038/nature06890. [DOI] [PMC free article] [PubMed] [Google Scholar]
- 28.Han A, et al. Dietary gluten triggers concomitant activation of CD41 cells and cd T cells in celiac disease. Proc. Natl Acad. Sci. USA. 2013;110:13073–13078. doi: 10.1073/pnas.1311861110. [DOI] [PMC free article] [PubMed] [Google Scholar]
- 29.Gajewski TF, Schreiber H, Fu YX. Innate and adaptive immune cells in the tumor microenvironment. Nature Immunol. 2013;14:1014–1022. [Google Scholar]
- 30.Eisenhauer EA, et al. New response evaluation criteria in solid tumours: revised RECIST guideline (version 1.1) Eur. J. Cancer. 2009;45:228–247. doi: 10.1016/j.ejca.2008.10.026. [DOI] [PubMed] [Google Scholar]
- 31.Schleifman EB, et al. Targeted biomarker profiling of matched primary and metastatic estrogen receptor positive breast cancers. PLoS ONE. 2014;9:e88401. doi: 10.1371/journal.pone.0088401. [DOI] [PMC free article] [PubMed] [Google Scholar]


