Summary
SHRSP5/Dmcr is a newly established substrain of stroke‐prone spontaneously hypertensive rat (SHRSP). Recently, high‐fat and high‐cholesterol (HFC) diet‐fed SHRSP5/Dmcr has been reported as a novel rat model of developing hepatic lesions similar to human non‐alcoholic steatohepatitis (NASH). The aim of this study was to investigate the detailed pathological conditions induced by HFC diet in SHRSP5/Dmcr rats using molecular biological methods and morphometric analysis. SHRSP5/Dmcr rats at 6 weeks of age were fed on either HFC diet or stroke‐prone (SP) diet for 2, 4, 6, 8 and 16 weeks and histopathological changes in the liver, blood chemistry and mRNA expression levels in the liver were investigated. As evidenced by the histopathological examination of the liver of the SHRSP5/Dmcr rats, hepatic steatosis and lobular inflammation were present, with gradual increasing severity from 2 weeks after the introduction of the HFC diet. Partial hepatic fibrosis was detected at 6 weeks and spread over the entire region of the liver with more severe bridging formation by 16 weeks. The degrees of NASH‐like hepatic lesions such as steatosis (the size distribution of lipid droplets), inflammation and fibrosis were quantified by morphometric analysis. Eosinophilic inclusion bodies encountered in the hepatocytes had immunoreactivity with Cox‐4 and double‐membrane walls, identified as mega‐mitochondria. Serum ALT and bilirubins, and the mRNA expression levels related to fibrosis were closely correlated with hepatic histopathological changes. The clear feeding time‐dependent progression of NASH‐like hepatic lesion in HFC diet‐fed SHRSP5/Dmcr rats reinforced the conclusion that this strain might be a useful model of NASH and of inflammatory fibrotic liver disease.
Keywords: fibrosis, high‐fat and high‐cholesterol (HFC) diet, morphometry, non‐alcoholic steatohepatitis (NASH), SHRSP5/Dmcr
Western diet, inadequate exercise and genetic background may accelerate obesity, contributing to insulin resistance, a metabolic abnormality linked to the development of type 2 diabetes mellitus. In consequence of the current increase in obese population, non‐alcoholic fatty liver disease (NAFLD), which is associated with obesity, has attracted increasing attention as the most frequently observed hepatic disorder. NAFLD develops into more serious disease such as non‐alcoholic steatohepatitis (NASH) and cirrhosis. The number of NASH patients is considered to be about 1–2% of patients with NAFLD. However, the precise number cannot be identified because liver biopsy is indispensable to NASH diagnosis, and liver biopsy is subject to various kinds of error, including in particular sampling problems where there may be differences in distribution of disease (Ratziu et al. 2005). The prevalence rate of NAFLD/NASH in the United States is believed to be higher than estimated (Williams et al. 2011).
NASH is defined by the Matteoni classification, which requires that histopathological examination of the liver reveal hepatocyte ballooning, Mallory‐Denk bodies or fibrosis in addition to steatosis and lobular inflammation (Matteoni et al. 1996). Animal models of NASH are required to provide information to elucidate the pathogenesis of the diseases.
One of the representative models of NASH is established using methionine–choline‐deficient (MCD) diet in rodents (Anstee & Goldin 2006; Fan & Qiao 2009; Takahashi et al. 2012), but the MCD diet‐induced model does not show obesity or peripheral insulin resistance (Fan & Qiao 2009; Takahashi et al. 2012). High‐fat (HF) diet is widely used to induce hepatic steatosis and inflammation. In addition, long‐term HF‐based diet can induce obesity, insulin resistance, NASH‐like hepatic lesions, and liver tumorigenesis in mice (Xu et al. 2009; Clapper et al. 2013; Fujii et al. 2013; Matsumoto et al. 2013). Although these diets easily induced hepatic steatosis and inflammation, they failed to induce all the typical human NASH features, such as hepatocyte ballooning and severe bridging fibrosis.
Recently, SHRSP5/Dmcr, a substrain of stroke‐prone spontaneously hypertensive rat (SHRSP), was introduced as a novel model of NASH (Kitamori et al. 2011). SHRSP5/Dmcr was reported to show a human NASH‐like phenotype with severe fibrosis in a short period of 8 weeks by feeding HF and high‐cholesterol‐containing diet (HFC diet).
The pathological severity of NASH has been assessed conventionally using either the classification proposed by Brunt et al. (Brunt et al. 1999), the NAFLD activity score (NAS) (Kleiner et al. 2005), or fibrosis stage score. In addition to these semiquantitative scoring, quantitative analysis of the degree of the histopathological severity is necessary to investigate therapeutic effects of various agents targeting on NASH.
In the past, the histopathological severity of fibrosis was often quantified by measuring the area stained with Azan, Sirius red or Masson's trichrome, while that of steatosis was quantified by various methods (Kumar et al. 2002; Zubair et al. 2009; Li et al. 2011). It is well known that the preponderance of the characterization of steatosis in NAFLD and NASH, namely macrovesicular steatosis, correlates with the progression of the pathological condition. However, the criteria identifying macrovesicular steatosis are vague, so that the evaluation and characterization of steatosis cannot avoid being different between observers (Lee et al. 2013; Liang et al. 2014).
In this study, histopathological and biochemical examinations were conducted to characterize the NASH‐like condition in HFC diet‐fed SHRSP5/Dmcr. Furthermore, we analysed morphometrically the changes in the area of fibrosis and inflammation, and the size of the lipid droplets in order to elucidate the progression of the NASH‐like condition during the course of HFC diet feeding.
Materials and methods
Animals and feeding diets
Six‐week‐old male rats of the strain SHRSP5/Dmcr were supplied from the Disease Model Cooperative Research Association (Kyoto, Japan). Animals were maintained in a temperature‐controlled (24 ± 2°C) and humidity‐controlled (55 ± 5%) facility with a 12‐h light/dark cycle and allowed to consume water and diet ad libitum. Experimental feeding to all animals, blood pressure measurement and tissue sampling were entrusted to Japan SLC, Inc. (Shizuoka, Japan). Stroke‐prone (SP) diet or HFC diet (Kitamori et al. 2011) (Funabashi Farm, Chiba, Japan) was given to SHRSP5/Dmcr for 2, 4, 6, 8 and 16 weeks.
Systolic blood pressure of SHRSP5/Dmcr was measured by the tail‐cuff method on the day before sacrifice. All rats were weighted and fasted 18–20 h before harvesting blood and liver tissue under anaesthesia by isoflurane. The liver tissues were weighed, and immersed in RNA extraction buffer (Ambion, Tokyo, Japan) for total RNA isolation. Other samples were either fixed in 10% neutralized buffered formalin for histopathology, or in 2.5 vol% glutaraldehyde in phosphate buffer for electron microscopic observation.
Ethical approval
All animal experiments were in accordance with the institutional guidelines and were approved in advance by the Committee of Animal Experiments in the Research Division of Mitsubishi Tanabe Pharma Corporation (Approval No. AT13‐0133) and Japan SLC, Inc (Approval No. 13176).
Histopathological examination
Formalin‐fixed liver tissues were embedded in paraffin and sliced into 4‐μm sections. Tissue sections were stained with haematoxylin & eosin (HE) or Azan and stained immunohistochemically with antibody against α‐smooth muscle actin (α‐SMA) (Sigma‐Aldrich, Tokyo, Japan), CD68 (AbD Serotec, Kidlington, UK), Cox‐4 (Cell Signaling, Danvers, MA, USA) and ubiquitin (Dako, Tokyo, Japan). By observing HE‐ and Azan‐stained sections, steatosis, lobular inflammation, hepatocyte ballooning and the fibrosis stage score were evaluated, and the NAFLD activity score was calculated according to previous reports (Kleiner et al. 2005).
Glutaraldehyde‐fixed liver tissues were embedded in epoxy resin by standard procedure. Electron microscopic observation with a transmission electron microscopy (HT7700, Hitachi High‐Technologies, Tokyo, Japan) was performed for HFC diet‐fed SHRSP5/Dmcr for 6 weeks.
Morphometric analysis
Whole digital slide images of the liver sections stained with HE, Azan, anti‐α‐SMA and anti‐CD68 were obtained using a virtual microscopy (Aperio AT2, Leica Microsystems, Wetzlar, Germany). The whole images of Joint Photographic Experts Group (JPEG) of the liver sections were extracted using image processing software (ImageScope, ver.12.0.0.5039, Leica Microsystems). The areas stained with Azan, anti‐α‐SMA and anti‐CD68 were measured using image analysis software (Image‐Pro Plus, ver.9.0.1, Media Cybernectics, Washington, USA), and the ratio of each stained area to whole area of the liver sections (% area) was calculated.
Five images each of 4‐mm2 area were extracted from the whole slide image of HE‐stained slides with ImageScope and analysed with Image‐Pro Plus. Each image was converted by the process of binarization. The lipid droplets in hepatocytes were regarded as unstained regions, and after connected lipid droplets were separated using the software's algorithm (Filters‐Morphological‐Open; 5 × 5, circle), the size of lipid droplets was measured, complying with two criteria: area 0.1–1500 μm2, roundness: 0–5 units. This was designed to exclude the non‐lipid ‘droplet’ objects such as large vessels, bile duct and sinusoidal spaces. The total area of lipid droplets which were segmented per the size of 20 μm2 in the range 0–200 μm2 and >200 μm2 was calculated.
Blood chemistry
The collected blood samples were partly mixed anti‐coagulated. Platelet count (PLT) was measured with an autoanalyser (ADVIA212, Siemens Healthcare Japan, Tokyo, Japan). Serum aspartate aminotransferase (AST), alanine aminotransferase (ALT), γ‐glutamyltransferase (γ‐GT), glucose (GLU), total cholesterol (TCHO), triglycerides (TG), total bilirubin (TBil), direct bilirubin (DBil) and total bile acid (TBA) were measured with an automated analyser (7180 clinical analyser, Hitachi, Tokyo, Japan). ELISA kits were served to determine serum insulin (INS) (kit Morinaga Institute of Biological Science, Kanagawa, Japan), serum ferritin (FER) (rat ferritin kit LSI Medience, Tokyo, Japan), serum cytokeratin 18‐M30 (CK18‐M30) and tissue inhibitor of metalloproteinase (TIMP‐1) (kit CUSABIO Biotech, Hubei, China). Serum collagen type IV (COL4) and procollagen III N‐terminal propeptide (PIIINP) were also measured by ELISA (kit Cloud‐Clone Corp, Houston, TX, USA). Serum hyaluronic acid (HA) was measured using ELISA kit from Biotech Trading Partners, Encinitas, Japan.
mRNA expression analysis
Total RNA was extracted from the liver tissue samples using Maxwell® 16 instrument and Maxwell® 16 LEV simplyRNA purification kit (Promega, Tokyo, Japan). The cDNA was synthesized from total RNA with SuperScript III first‐strand synthesis SuperMix for qRT‐PCR (Invitrogen, Tokyo, Japan). The real‐time PCR was performed on the BioMark®HD (Fluidigm, South San Francisco, CA, USA).
Statistical analysis
Data are shown as means, and bars indicate SEM (n = 6). *P < 0.05; **P < 0.01 versus SP diet group (Student's t‐test).
Results
Food intake, body weight and liver weight
Food intake was less in HFC diet‐fed SHRSP5/Dmcr than in SP diet‐fed rats throughout all feeding periods (Figure 1). Body weight increased in SHRSP5/Dmcr after feeding of both SP diet and HFC diet; however, the weight increased more slowly in HFC diet‐fed than in SP diet‐fed rats.
Figure 1.
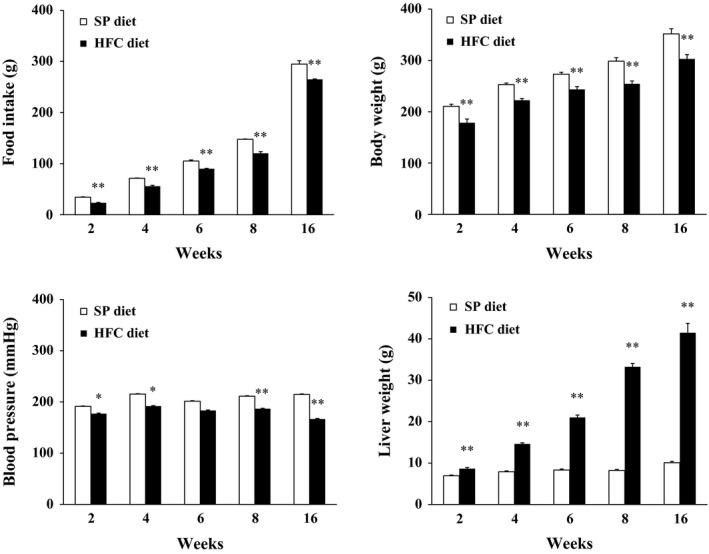
Food intake, body weight, systolic blood pressure and liver weight in SHRSP5/Dmcr fed on HFC diet or SP diet for 2, 4, 6, 8 and 16 weeks. Food intake is cumulative during feeding with either SP or HFC diet. Body weight and blood pressure were measured at the day before sacrifice. Data are shown as means, and bars indicate SEM (n = 6). *P < 0.05; **P < 0.01 versus SP diet group (Student's t‐test).
Systolic blood pressure was lower in HFC diet‐fed SHRSP5/Dmcr than in SP diet‐fed rats throughout all feeding periods. The liver weight was increased in time dependent fashion in HFC diet‐fed SHRSP5/Dmcr as compared to SP diet‐fed rats.
Macroscopic and microscopic examination in the liver
Macroscopically, the liver of SP diet‐fed SHRSP5/Dmcr showed no particular change in shape throughout all feeding periods, while the liver of HFC diet‐fed SHRSP5/Dmcr gradually expressed marked hypertrophy and discoloration due to fat accumulation (data not shown).
Microscopically, no change was observed throughout all feeding periods in the liver of SP diet‐fed SHRSP5/Dmcr. On the other hand, in the liver of HFC diet‐fed SHRSP5/Dmcr, microvesicular steatosis and focal infiltration of leucocyte were observed already at 2 weeks after HFC diet feeding (data not shown). Furthermore, the focal infiltration of leucocyte continued to develop diffusely throughout 16 weeks of HFC diet feeding (Figure 2a, b). After 4 weeks of HFC diet feeding, degeneration/necrosis of hepatocytes was observed, and the finding became more severe as feeding continued. At 6 weeks after HFC diet feeding, macrovesicular steatosis, ballooned hepatocytes, eosinophilic inclusion bodies and fibrosis were observed mainly in the visceral surface of the liver (Figure 2b, c). After 8 weeks of HFC diet feeding, macrovesicular steatosis became predominant over microvesicular steatosis, and fibrosis had spread over the entire region of the liver with bridging formation. At 16 weeks of HFC diet feeding, the fibrosis formed thicker bridges, just like in cirrhosis. Areas immunostained for α‐SMA and CD68, indicating activated fibroblasts and macrophages, were observed to start at 2 weeks of HFC diet feeding (data not shown). These lesions were aggregated at the visceral surface of the liver at 6 weeks of HFC diet feeding and then gradually spread over the entire region of the liver with ongoing weeks of HFC diet feeding (Figure 2d, e).
Figure 2.
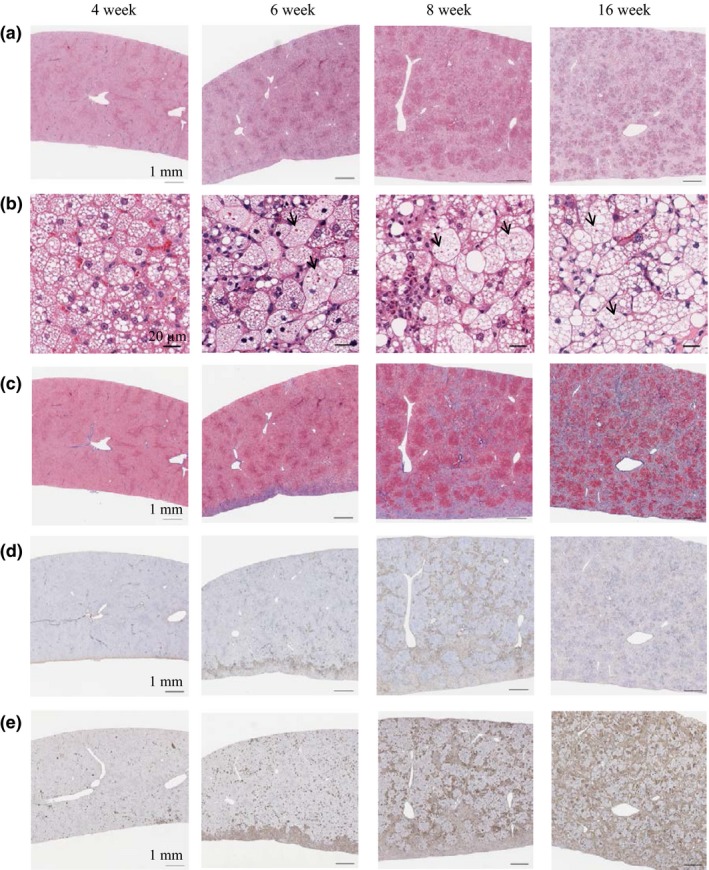
Time‐dependent histopathological changes in the livers in SHRSP5/Dmcr fed on HFC diet for 4, 6, 8, 16 weeks. (a, b) HE staining of the liver (scale bars indicate 1 mm (a) and 20 μm (b)). Lipid droplets and inflammatory cell infiltration were observed after 4 weeks of HFC diet feeding, with macrovesicular steatosis becoming predominant over microvesicular steatosis. Eosinophilic inclusion bodies (arrows) and ballooned hepatocyte were observed as of 6 weeks of HFC diet feeding. (c) Azan staining of the liver (scale bars indicate 1 mm). Fibrosis developed at the visceral surface (lower side) of the liver after 6 weeks of HFC diet feeding and had spread over the entire region with formation of bridging by 8 weeks. (d) α‐SMA immunostaining of the liver (scale bars indicate 1 mm). (e) CD68 immunostaining of the liver (scale bars indicate 1 mm). Immunoreactivity of both α‐SMA and CD68 was increased after 2 weeks of HFC diet feeding as compared to the SP diet group and continued to increase feeding time dependently.
The eosinophilic inclusion bodies observed in HE staining were investigated precisely with immunohistochemical and electron microscopical techniques. The eosinophilic inclusion bodies did not show immunoreactivity with ubiquitin as the indicator of Mallory‐Denk body (data not shown), but had immunoreactivity with Cox‐4, a marker of mitochondria (Figure 3a). Furthermore, the eosinophilic inclusion bodies were found to have a double‐membrane structure by electron microscopy (Figure 3b). Accordingly, they were considered to be mitochondria. Additionally, the size of each such mitochondrion was more than twice the size of a normal one. These results suggest that the eosinophilic inclusion bodies are not Mallory‐Denk bodies, but rather mega‐mitochondria.
Figure 3.
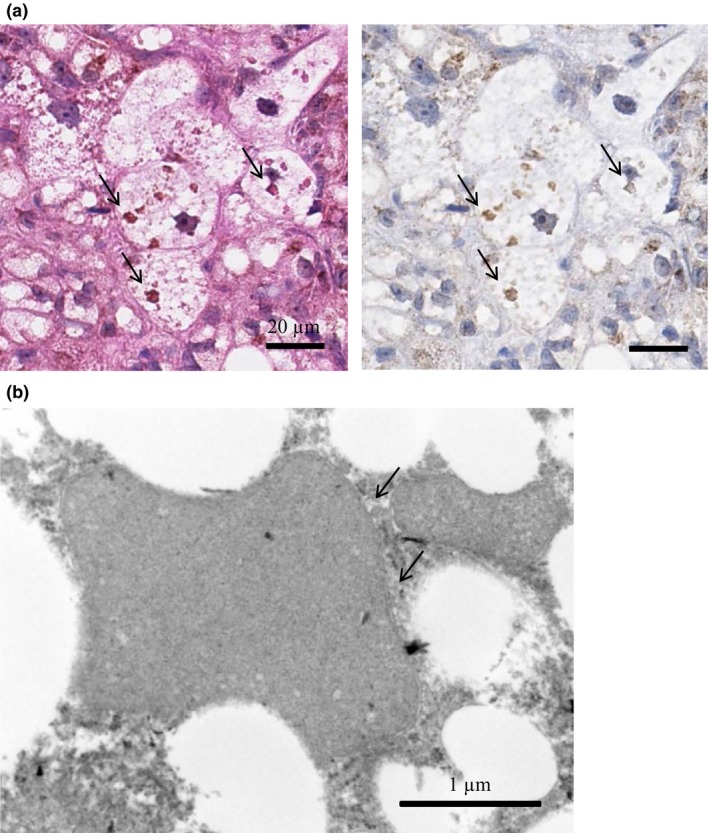
Detailed examination of eosinophilic inclusion bodies. (a) Representative image of immunohistochemical staining with Cox‐4 as marker of mitochondria. Left: HE staining of eosinophilic inclusion bodies (arrows) in HFC diet‐fed SHRSP5/Dmcr for 8 weeks (scale bars indicate 20 μm). Right: Cox‐4 immunostaining. (b) Electron microscopic examination of eosinophilic inclusion bodies. The eosinophilic inclusion bodies were observed in SHRSP5/Dmcr since 6 weeks onward of HFC diet feeding. They were found to have a double‐membrane structure (arrows), indicating them to be mega‐mitochondria (scale bar indicate 1 μm).
Evaluation of the NAS and fibrosis stage score
As a score indicating the progress of NASH, we evaluated the NAS and fibrosis stage score according to the method of NASH Clinical Research Network (Kleiner et al. 2005). As steatosis had been already observed in almost the entire liver after 2 weeks of HFC diet feeding, the steatosis score was designated as 3. The lobular inflammation score was either 1 or 2 after 2 weeks of HFC diet feeding and reached 3 after 4 weeks on the diet. The hepatocyte ballooning score was 2 from 6 weeks of HFC diet feeding onwards. NAS as the sum of these scores gradually increased and reached a maximum value of 8 after HFC diet feeding for 6 weeks and longer (Figure 4a). The fibrosis stage score was 1 at 6 weeks and increased continually to almost 4 by 16 weeks. In contrast, both the NAS and fibrosis stage score in SP diet‐fed SHRSP5/Dmcr were zero throughout all feeding periods.
Figure 4.
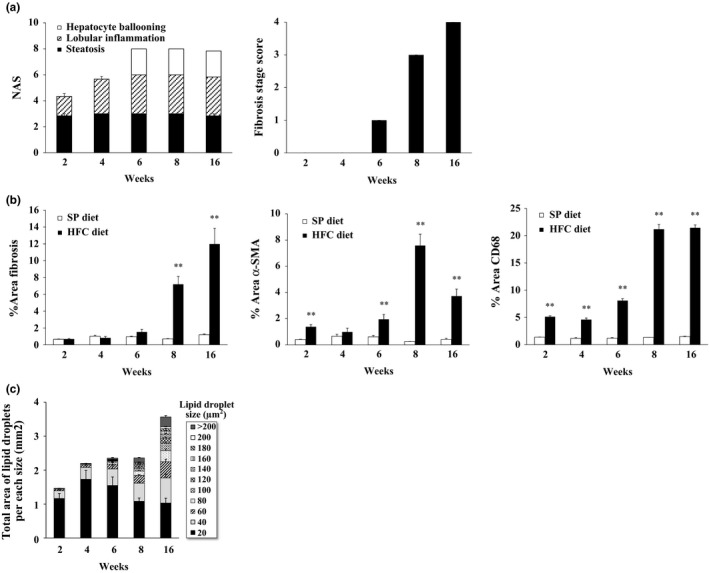
Histopathological findings for NASH‐like hepatic lesions in SHRSP5/Dmcr fed on HFC diet or SP diet for 2, 4, 6, 8 and 16 weeks. (a) NAS and fibrosis stage score of HFC diet‐fed SHRSP5/Dmcr (n = 6). All scores of SP diet‐fed SHRSP5/Dmcr were 0 (n = 6). (b) Quantitative analysis of areas staining for fibrosis, α‐SMA or CD68. Fibrosis areas (% of whole area of the liver section) in HFC diet‐ or SP diet‐fed SHRSP5/Dmcr. Data are shown as means, and bars indicate SEM (n = 6). **P < 0.01 versus SP diet group (Student's t‐test). (c) Total area of lipid droplet per each size in HFC diet‐fed SHRSP5/Dmcr. Total areas of lipid droplets within 20‐μm² size fractions ranging from 0 to 200 μm² and >200 μm² were calculated. For analysis, 5 sections each of an area of 4 mm2 were extracted from the digital slide images. Data are shown as means, and bars indicate SEM (n = 6).
Morphometric analysis
NASH‐like hepatic histopathological lesions were analysed quantitatively. We calculated the ratio of Azan‐, α‐SMA‐ and CD68‐stained area to the whole area of the liver section (% fibrosis area, % α‐SMA area and % CD68 area) in order to evaluate the extent of fibrosis and inflammation (Figure 4b). The Azan‐stained area increased significantly at 8 weeks of HFC diet feeding and continued to increase until 16 weeks. The immunoreactive area of α‐SMA and CD68 was increased significantly at 2 weeks in HFC diet‐fed SHRSP5/Dmcr compared to SP diet‐fed rats and gradually increased further until 8 weeks.
As a quantitative evaluation of microvesicular and macrovesicular steatosis, the size of lipid droplets in hepatocytes was measured, and then subdivided into incremental pools of 20 μm² from 0 to 200 μm² and one for size >200 μm². The total areas of lipid droplets per each size were presented (total area of lipid droplets per each size) (Figure 4c). Clearly, the larger lipid droplets were increased time dependently with the duration of HFC diet feeding. This is consistent with the microscopic findings.
Blood chemistry
Serum AST, ALT, γGTP, TBil, DBil, and CK18‐M30 significantly increased at 2 or 4 weeks in HFC diet‐fed SHRSP5/Dmcr as compared to SP diet‐fed rats and then gradually increased further until 16 weeks (Figure 5). Conversely, serum glucose, insulin, TG and ferritin levels were lower in the groups fed on HFC diet than on SP diet throughout almost all of the feeding periods. Again in distinction, serum TCHO, TBA and PLT levels were higher in HFC diet‐fed SHRSP5/Dmcr than in SP diet‐fed rats throughout almost all of the feeding periods. Importantly, serum COL4, HA, PIIINP and TIMP‐1 levels, all fibrosis‐related markers widely used in clinical situation, were significantly higher in HFC diet‐fed SHRSP5/Dmcr than in SP diet‐fed rats.
Figure 5.
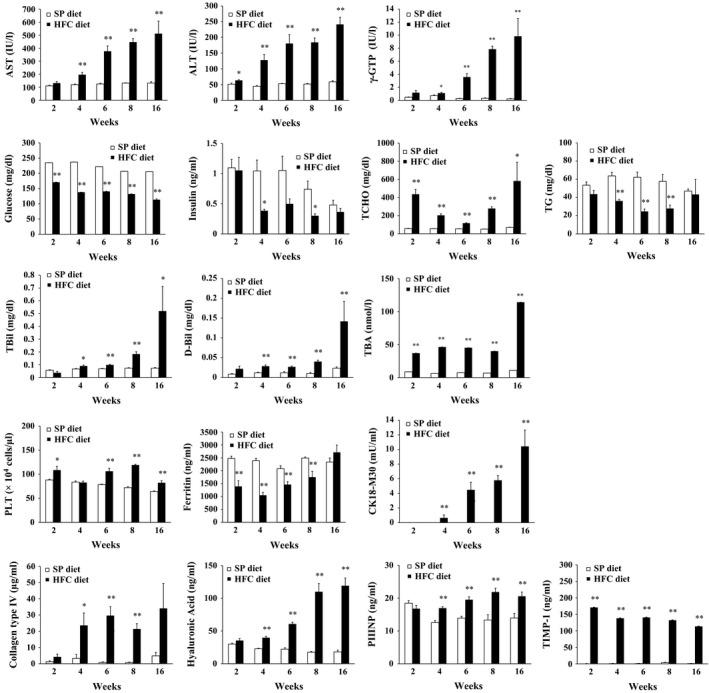
Blood chemistry in SHRSP5/Dmcr fed on HFC diet or SP diet for 2, 4, 6, 8 and 16 weeks. Values for serum CK18‐M30 and TIMP‐1 levels were under the detection limit (0.156 mIU/ml) in several rats. Data are shown as means, and bars indicate SEM (n = 6). *P < 0.05; **P < 0.01 versus SP diet group (Student's t‐test).
The mRNA expression level of liver
The mRNA expression levels of COL1A1, COL1A2, COL3A1, TGFβ1, TGFβ3 and ACTA2, all fibrosis‐related genes, and IL13LA2, an inflammation related gene, showed highly significant marked increase in HFC diet‐fed SHRSP5/Dmcr compared to SP diet‐fed rats (Figure 6).
Figure 6.
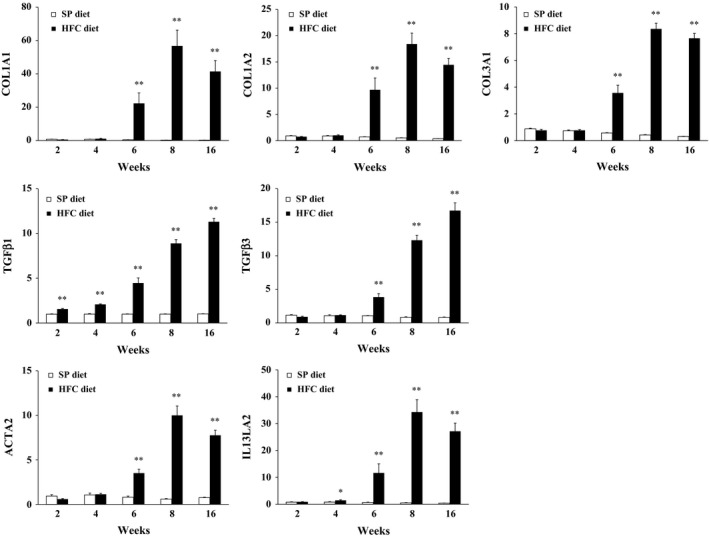
The mRNA expression levels in the liver of SHRSP5/Dmcr fed on HFC diet or SP diet for 2, 4, 6, 8 and 16 weeks. Data are shown as means, and bars indicate SEM (n = 6). **P < 0.01 versus SP diet group (Student's t‐test).
Discussion
The present study investigated the time‐dependent development of pathological signs of NASH in HFC diet‐fed SHRSP5/Dmcr. Histopathological examination of the liver revealed microvesicular steatosis already after 2 weeks of HFC diet feeding, and gradual replacement by macrovesicular steatosis with ongoing diet. This development was also proved quantitatively by morphometric analysis.
Fibrosis was observed partially in the liver at 6 weeks of HFC diet feeding and spread over the entire region of the liver with more severe formation of bridging, as in cirrhosis, by 8–16 weeks of diet. An increase of α‐SMA‐stained regions was observed after 2 weeks of HFC diet feeding, that is prior to the appearance of fibrosis. This is consistent with the previous report that α‐SMA expression was increased at the prefibrotic stage in patients (Hirabaru et al. 2014). These increases of stained area were confirmed by quantitative analysis.
Eosinophilic inclusion bodies were observed as of 6 weeks of HFC diet feeding. Such eosinophilic inclusion bodies occur in patients with chronic hepatitis (Strnad et al. 2008; Basaranoglu et al. 2014) which they have been identified as Mallory‐Denk body. A Mallory‐Denk body consists of aggregated keratin, ubiquitin, heat‐shock proteins and the adapter and stress protein p62. Accordingly these bodies may stain immunohistochemically for ubiquitin, M30 or p62 (Banner et al. 2000; Denk et al. 2006; Zatloukal et al. 2007). However, in our study, the eosinophilic inclusion body did not stain for ubiquitin. Instead, it had immunoreactivity for Cox‐4. Thus, the eosinophilic inclusion body was not thought to be a true Mallory‐Denk body, but rather mitochondrial in nature (Usui et al. 2014). Furthermore, in electron microscopic observation, the outline of the eosinophilic inclusion bodies was found to have a double‐membrane structure. Because the size was larger than normal mitochondria, these results suggest that the eosinophilic inclusion bodies are mega‐mitochondria, which is consistent with previous reports that abnormal mitochondria appear in NAFLD and NASH patients (Le et al. 2004; Noureddin et al. 2013; Lotowska et al. 2014).
Serum concentration of AST, ALT and γGPT, markers of hepatic injury, the mRNA expression level of COL1A1, COL1A2, COL3A1, TGFβ1, TGFβ3 and ACTA2, fibrosis‐related factors, and serum concentration of CK18‐M30, a biomarker that can be distinguish simple steatosis and NASH (Feldstein et al. 2006; Wieckowska et al. 2006; Musso et al. 2010), all increased gradually starting 2–6 weeks after the onset of HFC diet feeding. These results suggested that HFC diet‐induced inflammation impaired the liver and subsequently increased the fibrosis‐related components. Consequently, the simple steatosis developed into NASH.
Serum ferritin level, a marker of iron storage, was reported to be elevated in many patients with clinically manifest NAFLD and NASH (Kowdley et al. 2012). However, in the present study, ferritin levels were found to be lowered by HFC diet. Chronic liver disease with advanced fibrosis has known to be accompanied by thrombocytopenia. However, in the present study, PLT levels of HFC diet‐fed SHRSP5/Dmcr were higher than SP diet‐fed rats. A species difference between human and SHRSP5/Dmcr or disease duration might cause this discrepancy, although the correlation of ferritin and PLT in NASH condition remains to be examined in more detail.
NAFLD and NASH patients mostly exhibit insulin resistance and elevated TG and TC in blood. In the present study, body weight, glucose and insulin levels in HFC diet‐fed SHRSP5/Dmcr fed on HFC diet were lower than those in SP diet‐fed rats. This glycolipid amelioration is considered to be due to the cholic acid (CA) contained within HFC diet. CA is a kind of bile acids (BAs) and increases energy expenditure by activating brown adipose tissue (BAT), thereby ameliorating glucose tolerance and insulin resistance (Watanabe et al. 2006). Furthermore, BAs lower serum triglyceride levels via the FXR‐SHP‐SREBP1c pathway (Watanabe et al. 2004), which can also explain why the serum TG level in SHRSP5/Dmcr fed on HFC diet was lower than in rats fed on the SP diet in the present study.
As diet‐inducible NASH model, the MCD model is well known (Anstee & Goldin 2006; Fan & Qiao 2009; Takahashi et al. 2012), and recently, it has been reported that NASH‐like pathological conditions were induced by diets containing various sources of fat or cholesterol (Xu et al. 2009; Clapper et al. 2013; Fujii et al. 2013; Matsumoto et al. 2013). In the present study, the HFC diet consisted of palm oil (with a high content of the saturated fatty acid; palmitic acid), cholesterol and CA. These unique components and their combination for the diet might be able to induce histological features of NASH which are more similar to human pathology than the models reported previously.
Excessive intake of saturated fatty acids is known to increase the risk of coronary heart disease (Kromhout et al. 1995) and to promote NASH (Musso et al. 2009). However, a recent study has indicated that there may be no significant relationship between saturated fat intake and cardiovascular disease (Siri‐Tarino et al. 2010; Fattore & Fanelli 2013). Therefore, the influences of saturated fatty acid, including palm oil, on various diseases are still controversial.
CA has liver toxicity and changes the composition of BAs in the enterohepatic circulation. It has been reported that CA in the HFC diet increased the ratio of chenodeoxycholic acid which was even more toxic and decreased expression level of BAs transporter, which played an important role in the pathogenesis of NASH (Jia et al. 2014). Thus CA could be an essential component for inducing NASH histopathology, and simultaneously, for inducing lower weight gain and glycolipid amelioration by enhancing energy expenditure of BAT.
There are some reports that HFC diet induced hepatic features of NASH in SD rats (Ichimura et al. 2015), and hepatic cirrhosis in SHR (Wexler 1981). To clarify whether NASH‐like hepatic lesions are induced by HFC diet in only SHRSP5/Dmcr, we conducted preliminary investigations in other strains of rat (data not shown). In SHRSP/Izm, an inbred strain closest to SHRSP5/Dmcr, NASH‐like hepatic lesions including fibrosis were induced by HFC diet. As a result, NAS and fibrosis stage score were almost the same as those in SHRSP5/Dmcr at 8 weeks after HFC diet feeding. However, the HFC diet‐fed SHRSP/Izm model should be hard to use, because the mean blood pressure (more than 200 mmHg) was too high for some rats to survive for longer. In SD and WKY rats, the scores of steatosis and lobular inflammation were as same as in SHRSP5/Dmcr, but fibrosis stage score ranged from 1 to 3 between individual rats at 8 weeks of HFC diet feeding, which is very consistent with a previous report on SD rats (Ichimura et al. 2015). Thus, a genetic factor for hypertension seems to be necessary to guarantee induction of NASH histopathology including fibrosis at 8 weeks.
In conclusion, we have demonstrated pathological and morphometric changes in hepatic lesions in HFC diet‐fed SHRSP5/Dmcr. The lesions progressed during HFC diet feeding, the end result being very similar to the human NASH. In addition, quantitative morphometric analysis indicated that lipid droplets changed from microvesicular to macrovesicular, that inflammation increased gradually and that subsequently fibrosis became more severe from 6 weeks to 16 weeks of HFC diet feeding. These results suggest that HFC diet‐fed SHRSP5/Dmcr is a useful model for NASH research and for evaluating therapeutic effects of any agents targeting on NASH.
Funding
This research received no specific grant from any funding agency in the public, commercial or non‐profit sectors.
Conflict of interest
All authors are employees of Mitsubishi Tanabe Pharma Corporation. The authors declare no conflict of interest.
Acknowledgements
The authors thank Misae Takahashi for measurement of blood chemistry, Kana Takemoto and Satomi Nishikawa for helpful discussions, Makoto Yamazaki for supporting the present study and Prof. Dr. Bernhard F Becker (Ludwig‐Maximilians‐University, Munich) for restyling our English.
References
- Anstee Q.M. & Goldin R.D. (2006) Mouse models in non‐alcoholic fatty liver disease and steatohepatitis research. Int. J. Exp. Pathol. 87, 1–16. [DOI] [PMC free article] [PubMed] [Google Scholar]
- Banner B.F., Savas L., Zivny J. et al (2000) Ubiquitin as a marker of cell injury in nonalcoholic steatohepatitis. Am. J. Clin. Pathol. 114, 860–866. [DOI] [PubMed] [Google Scholar]
- Basaranoglu M., Turhan N., Sonsuz A. & Basaranoglu G. (2011) Mallory‐Denk Bodies in chronic hepatitis. World J. Gastroenterol. 17, 2172–2177. [DOI] [PMC free article] [PubMed] [Google Scholar]
- Brunt E.M., Janney C.G., Di Bisceglie A.M. et al (1999) Nonalcoholic steatohepatitis: a proposal for grading and staging the histological lesions. Am. J. Gastroenterol. 94, 2467–2474. [DOI] [PubMed] [Google Scholar]
- Clapper J.R., Hendricks M.D., Gu G. et al (2013) Diet‐induced mouse model of fatty liver disease and nonalcoholic steatohepatitis reflecting clinical disease progression and methods of assessment. Am. J. Physiol. Gastrointest. Liver Physiol. 305, G483–G495. [DOI] [PubMed] [Google Scholar]
- Denk H., Stumptner C., Fuchsbichler A. et al (2006) Are the Mallory bodies and intracellular hyaline bodies in neoplastic and non‐neoplastic hepatocytes related? J. Pathol. 208, 653–661. [DOI] [PubMed] [Google Scholar]
- Fan J.G. & Qiao L. (2009) Commonly used animal models of non‐alcoholic steatohepatitis. Hepatobiliary Pancreat. Dis. Int. 8, 233–240. [PubMed] [Google Scholar]
- Fattore E. & Fanelli R. (2013) Palm oil and palmitic acid: a review on cardiovascular effects and carcinogenicity. Int. J. Food Sci. Nutr. 64, 648–659. [DOI] [PubMed] [Google Scholar]
- Feldstein A.E., Wieckowska A., Lopez A.R. et al (2006) Cytokeratin‐18 fragment levels as noninvasive biomarkers for nonalcoholic steatohepatitis: a multicenter validation study. Hepatology 50, 1072–1078. [DOI] [PMC free article] [PubMed] [Google Scholar]
- Fujii M., Shibazaki Y., Wakamatsu K. et al (2013) A murine model for non‐alcoholic steatohepatitis showing evidence of association between diabetes and hepatocellular carcinoma. Med. Mol. Morphol. 46, 141–152. [DOI] [PubMed] [Google Scholar]
- Hirabaru M., Mochizuki K., Takatsuki M. et al (2014) Expression of alpha smooth muscle actin in living donor liver transplant recipients. World J. Gastroenterol. 20, 7067–7074. [DOI] [PMC free article] [PubMed] [Google Scholar]
- Ichimura M., Kawase M., Masuzumi M. et al (2015) High‐fat and high‐cholesterol diet rapidly induces non‐alcoholic steatohepatitis with advanced fibrosis in Sprague‐Dawley rats. Hepatol. Res. 45, 458–469. [DOI] [PubMed] [Google Scholar]
- Jia X., Suzuki Y., Naito H. et al (2014) A possible role of chenodeoxycholic acid and glycine‐conjugated bile acids in fibrotic steatohepatitis in a dietary rat model. Dig. Dis. Sci. 59, 1490–1501. [DOI] [PubMed] [Google Scholar]
- Kitamori K., Naito H., Tamada H. et al (2011) Development of novel rat model for high‐fat and high‐cholesterol diet‐induced steatohepatitis and severe fibrosis progression in SHRSP5/Dmcr. Environ. Health Prev. Med. 17, 173–182. [DOI] [PMC free article] [PubMed] [Google Scholar]
- Kleiner D.E., Brunt E.M., Van Natta M. et al (2005) Design and validation of a histological scoring system for nonalcoholic fatty liver disease. Hepatology 41, 1313–1321. [DOI] [PubMed] [Google Scholar]
- Kowdley K.V., Belt P., Wilson L.A. et al (2012) Serum ferritin is an independent predictor of histologic severity and advanced fibrosis in patients with nonalcoholic fatty liver disease. Hepatology 55, 77–85. [DOI] [PMC free article] [PubMed] [Google Scholar]
- Kromhout D., Menotti A., Bloemberg B. et al (1995) Dietary saturated and trans fatty acids and cholesterol and 25‐year mortality from coronary heart disease: the Seven Countries Study. Prev. Med. 24, 308–315. [DOI] [PubMed] [Google Scholar]
- Kumar D., Farrell G.C., Fung C. & George J. (2002) Hepatitis C virus genotype 3 is cytopathic to hepatocytes: reversal of hepatic steatosis after sustained therapeutic response. Hepatology 36, 1266–1272. [DOI] [PubMed] [Google Scholar]
- Le T.H., Caldwell S.H., Redick J.A. et al (2004) The zonal distribution of megamitochondria with crystalline inclusions in nonalcoholic steatohepatitis. Hepatology 39, 1423–1429. [DOI] [PubMed] [Google Scholar]
- Lee M.J., Bagci P., Kong J. et al (2013) Liver steatosis assessment: correlations among pathology, radiology, clinical data and automated image analysis software. Pathol. Res. Pract. 209, 371–379. [DOI] [PubMed] [Google Scholar]
- Li M., Song J., Mirkov S. et al (2011) Comparing morphometric, biochemical, and visual measurements of macrovesicular steatosis of liver. Hum. Pathol. 42, 356–360. [DOI] [PMC free article] [PubMed] [Google Scholar]
- Liang W., Menke A.L., Driessen A. et al (2014) Establishment of a general NAFLD scoring system for rodent models and comparison to human liver pathology. PLoS One 9, e115922. [DOI] [PMC free article] [PubMed] [Google Scholar]
- Lotowska J.M., Sobaniec‐Lotowska M.E., Bockowska S.B. & Lebensztejn D.M. (2014) Pediatric non‐alcoholic steatohepatitis: the first report on the ultrastructure of hepatocyte mitochondria. World J. Gastroenterol. 20, 4335–4340. [DOI] [PMC free article] [PubMed] [Google Scholar]
- Matsumoto M., Hada N., Sakamaki Y. et al (2013) An improved mouse model that rapidly develops fibrosis in non‐alcoholic steatohepatitis . Int. J. Exp. Pathol. 94, 93–103. [DOI] [PMC free article] [PubMed] [Google Scholar]
- Matteoni C.A., Younossi Z.M., Gramlich T. et al (1996) Nonalcoholic fatty liver disease: a spectrum of clinical and pathological severity. Gastroenterology 116, 1413–1419. [DOI] [PubMed] [Google Scholar]
- Musso G., Gambino R., Pacini G. et al (2009) Prolonged saturated fat‐induced, glucose‐dependent insulinotropic polypeptide elevation is associated with adipokine imbalance and liver injury in nonalcoholic steatohepatitis: dysregulated enteroadipocyte axis as a novel feature of fatty liver. Am. J. Clin. Nutr. 89, 558–567. [DOI] [PubMed] [Google Scholar]
- Musso G., Gambino R., Durazzo M. & Cassader M. (2010) Noninvasive assessment of liver disease severity with liver fat score and CK‐18 in NAFLD: prognostic value of liver fat equation goes beyond hepatic fat estimation. Hepatology 51, 715–717. [DOI] [PubMed] [Google Scholar]
- Noureddin M., Yates K.P., Vaughn I.A. et al (2013) Clinical and histological determinants of nonalcoholic steatohepatitis and advanced fibrosis in elderly patients. Hepatology 58, 1644–1654. [DOI] [PMC free article] [PubMed] [Google Scholar]
- Ratziu V., Charlotte F., Heurtier A. et al (2005) Sampling variability of liver biopsy in nonalcoholic fatty liver disease. Gastroenterology 128, 1898–1906. [DOI] [PubMed] [Google Scholar]
- Siri‐Tarino P.W., Sun Q., Hu F.B. & Krauss R.M. (2010) Meta‐analysis of prospective cohort studies evaluating the association of saturated fat with cardiovascular disease. Am. J. Clin. Nutr. 91, 535–546. [DOI] [PMC free article] [PubMed] [Google Scholar]
- Strnad P., Zatloukal K., Stumptner C. et al (2008) Mallory‐Denk‐bodies: lessons from keratin‐containing hepatic inclusion bodies. Biochim. Biophys. Acta 1782, 764–774. [DOI] [PubMed] [Google Scholar]
- Takahashi Y., Soejima Y. & Fukusato T. (2012) Animal models of nonalcoholic fatty liver disease/nonalcoholic steatohepatitis. World J. Gastroenterol. 18, 2300–2308. [DOI] [PMC free article] [PubMed] [Google Scholar]
- Usui T., Kajita K., Kajita T. et al (2014) Elevated mitochondrial biogenesis in skeletal muscle is associated with testosterone‐induced body weight loss in male mice. FEBS Lett. 588, 1935–1941. [DOI] [PubMed] [Google Scholar]
- Watanabe M., Houten S.M., Wang L. et al (2004) Bile acids lower triglyceride levels via a pathway involving FXR, SHP, and SREBP‐1c. J. Clin. Invest. 113, 1408–1418. [DOI] [PMC free article] [PubMed] [Google Scholar]
- Watanabe M., Houten S.M., Mataki C. et al (2006) Bile acids induce energy expenditure by promoting intracellular thyroid hormone activation. Nature 439, 484–489. [DOI] [PubMed] [Google Scholar]
- Wexler B.C. (1981) Inhibition of the pathogenesis of spontaneous hypertension in spontaneously hypertensive rats by feeding a high fat diet. Endocrinology 108, 981–989. [DOI] [PubMed] [Google Scholar]
- Wieckowska A., Zein N.N., Yerian L.M. et al (2006) In vivo assessment of liver cell apoptosis as a novel biomarker of disease severity in nonalcoholic fatty liver disease. Hepatology 44, 27–33. [DOI] [PubMed] [Google Scholar]
- Williams C.D., Stengel J., Asike M.I. et al (2011) Prevalence of nonalcoholic fatty liver disease and nonalcoholic steatohepatitis among a largely middle‐aged population utilizing ultrasound and liver biopsy: a prospective study. Gastroenterology 140, 124–131. [DOI] [PubMed] [Google Scholar]
- Xu Z.J., Fan J.G., Ding X.D. et al (2009) Characterization of high‐fat, diet‐induced, non‐alcoholic steatohepatitis with fibrosis in rats. Dig. Dis. Sci. 55, 931–940. [DOI] [PMC free article] [PubMed] [Google Scholar]
- Zatloukal K., French S.W., Stumptner C. et al (2007) From Mallory to Mallory‐Denk bodies: what, how and why? Exp. Cell Res. 313, 2033–2049. [DOI] [PubMed] [Google Scholar]
- Zubair A., Jamal S. & Mubarik A. (2009) Morphometric analysis of hepatic steatosis in chronic hepatitis C infection. Saudi J. Gastroenterol. 15, 11–14. [DOI] [PMC free article] [PubMed] [Google Scholar]


