Abstract
Detection of gene expression in different types of brain cells e.g., neurons, astrocytes, oligodendrocytes, oligodendrocyte precursors and microglia, can be hampered by the lack of specific primary or secondary antibodies for immunostaining. Here we describe a protocol to detect the expression of three different genes in the same brain section using double fluorescence in situ hybridization with two gene-specific probes followed by immunostaining with an antibody of high specificity directed against the protein encoded by a third gene. The Aspartoacyclase (ASPA) gene, mutations of which can lead to a rare human white matter disease - Canavan disease - is thought to be expressed in oligodendrocytes and microglia but not in astrocytes and neurons. However, the precise expression pattern of ASPA in the brain has yet to be established. This protocol has allowed us to determine that ASPA is expressed in a subset of mature oligodendrocytes and it can be generally applied to a wide range of gene expression pattern studies.
Keywords: Neuroscience, Issue 109, in situ hybridization, immunohistochemistry, gene expression, oligodendrocytes, ASPA, Canavan disease
Introduction
Glial cells, which are the most abundant cells in the central nervous system (CNS), comprise oligodendrocytes (the myelinating cells of CNS), oligodendrocytes precursors (OPs, also known as "NG2 cells"), astrocytes and microglia. There is growing interest in the functions of glial cells and their potential roles in neurological diseases1. For example, Canavan disease (CD) is a hereditary neurodegenerative disorder starting early in infancy with spongiform leukodystrophy and a progressive loss of neurons, leading to death usually before 10 years of age2,3. Mutations in the Aspartoacyclase (ASPA) gene that lead to drastically reduced ASPA activity4 in CD have been identified. ASPA is an enzyme catalysing the deacetylation of N-acetylaspartate (NAA), a molecule highly concentrated in the brain, generating acetate and aspartate 5-7. Many CD patients show higher levels of NAA due to lack of ASPA activity. Some studies speculate that NAA-derived acetate could be a major source of fatty acids/lipids in the brain during development and CD may result from decreased myelin synthesis during development caused by the failure of NAA to be broken down3,5,6.
ASPA is predominantly found in the kidney, liver and white matter of the brain, and given the important role of ASPA in CD, the cellular expression of this enzyme in the brain has been studied by several labs. By looking at ASPA enzymatic activity in the brain, earlier studies found that the increase in ASPA activity during brain development parallels the time course of myelination 8-10. At the cellular level, assays for enzymatic activity as well as in situ hybridization (ISH) and immunohistochemistry (IHC) analyses suggest that ASPA is mainly expressed in oligodendrocytes in the brain but not in neurons or astrocytes11-16. A few studies found that ASPA might also be expressed in microglia in the CNS12,14. So far data on ASPA expression in OPs are limited. According to a recent study where transcriptomes of different cell types in the mouse cerebral cortex including neurons, astrocytes, OPs, newly formed oligodendrocytes, myelinating oligodendrocytes, microglia, endothelial cells, and pericytes were analysed by RNA sequencing17, ASPA is exclusively expressed in oligodendrocytes, in particular in myelinating oligodendrocytes (http://web.stanford.edu/group/barres_lab/brain_rnaseq.html). Despite these studies on ASPA expression pattern in the brain, a number of uncertainties remain.
Different techniques can be used to study gene expression patterns. IHC is a commonly used method for detecting the functional product (i.e., protein) of a gene expression in tissue sections. Despite its great utility, this technique has limitations as its application and specificity are subject to the availability and specificity of the antibody needed. By comparison, ISH has the advantage of being able to reveal the expression of any gene at the mRNA level. However, it can be technically challenging to use several probes at the same time in order to localize a gene expression to specific cell types. In this article, we describe a protocol combining double fluorescence RNA in situ hybridization with fluorescence immunolabelling of a protein. We have used this set of techniques to examine the expression pattern of Aspa in mouse brain. This method allows the precise study of gene expression using confocal microscopy.
Protocol
Ethics Statement: Mouse husbandry and handling are in accordance with UK Home Office regulations and UCL ethics committee guidelines, complying with the Animals (Scientific Procedures) Act 1986 of the United Kingdom and its Amendment Regulations 2012.
NOTE: All solutions should be made with diethyl pyrocarbonate (DEPC)- treated water to destroy any residual RNase. For DEPC treatment, add DEPC (1 ml per litre), shake vigorously until all the DEPC globules have disappeared then autoclave to degrade the DEPC.
1. RNA Probe Synthesis
CAUTION: When handling formamide, wear Personal Protective Equipment (PPE) and use a safety cabinet. Prepare hybridization buffer: DEPC-treated deionized water with 50% (v/v) deionized formamide, 200 mM NaCl, 5 mM EDTA, 10 mM Tris-HCl pH 7.5, 5 mM NaH2PO4, 5 mM Na2HPO4, 0.01 mg/ml yeast tRNA, 1× Denhardt's solution, and 10% w/v dextran sulfate.
Choose a DNA clone that contains the cDNA sequence of the gene of interest in a plasmid with RNA polymerase promoters. For this example, use a pCMV-SPORT6 clone, IRAVp968C0654D (Genbank accessionBC024934), with T7 and Sp6 RNA polymerase promoters for Aspa (Supplementary Figure 1).
- Prepare linearized plasmid DNA as template.
- Grow the DNA clone, extract the plasmid with a small-scale plasmid purification kit according to the manufacturer's protocol and sequence with the T7 and Sp6 universal primers.
- Digest 1,020 µg plasmid DNA with a restriction enzyme that cuts at the 5' end of the sense strand of the cDNA. For this example, use 100 unit SalI to digest the pCMV-SPORT6-Aspa plasmid. Incubate for 1.5 hr at 37 oC.
- Run a small aliquot on an agarose gel to check that the plasmid is fully linearized.
- Purify the linearized plasmid using phenol-chloroform.
- Add 1/10 volume of 3 M sodium acetate, one volume of 10 mM Tris HCl (pH 8.0) - equilibrated phenol and one volume of chloroform/isoamyl alcohol (IAA) (24:1).
- Centrifuge at 16,000 x g for 1 min at RT (20 - 25 °C, RT) and extract upper aqueous phase.
- Add one volume of chloroform/IAA, centrifuge at 16,000 x g for 1 min and extract upper aqueous phase.
- Repeat step 1.4.3.
- Add 2 volumes of ethanol and leave at -20oC for 1 hr or O/N.
- Centrifuge at 16,000 x g at 4 °C for 10 min. Discard the supernatant.
- Wash the pellet with 70% cold ethanol and re-suspend at approximatively 1 µg cDNA per 2.5 µl in TE (10 mM Tris-HCl, 1 mM EDTA pH 7.5).
- Synthesize the two probes, one labelled with Digoxigenin (DIG) and the other with fluorescein isothiocyanate (FITC ).
- Select the appropriate RNA polymerase to make the anti-sense probe (complementary to the target mRNA). For this example, use T7 RNA polymerase to make Aspa probe.
- Prepare in vitro transcription reaction: add 1 µg of the linearized DNA, 4.0 µl 5 x transcription buffer, 6.0 µl of 100 mM DTT, 2.0 µl of 10x DIG or FITC RNA labelling mix containing dNTPs, 1 µl RNase inhibitor, and 20 - 40 units of RNA polymerase; make the final volume up to 20 µl with DEPC-treated water.
- Incubate at 37 oC for 1.5 hr.
Run1 µl of the transcription reaction on a 1.0% agarose gel to check that the reaction has worked. The gel should show the linear template and a bright band of the probe.
Make the volume up to 100 µl with hybridization buffer and store 10 µl aliquots at -80 °C.
2. Perfusion, Fixation and Tissue Collection
CAUTION: When handling paraformaldehyde (PFA), both solid and aqueous, wear PPE and use a safety cabinet. Prepare formaldehyde solution by dissolving 4% (w/v) PFA into 1x phosphate buffered saline (PBS) solution using heat (55 °C). Filter the formaldehyde solution with filter paper.
Prepare sucrose solution by dissolving 20% (w/v) sucrose in distilled water and add 0.1% (v/v) DEPC solution. Leave O/N at RT with a loose lid and then autoclave.
Terminally anaesthetize a mouse by intra-peritoneal injection of pentobarbitone (50 mg/kg). Assess the depth of anaesthesia by toe pinch and the absence of withdrawal reflex indicates deep anaesthesia.
Once the mouse is under deep anaesthesia, make an incision beneath the rib cage and cut through the rib cage on both sides, lift it to expose the heart.
Insert a 25-G needle into the left ventricle of the heart. Make a small incision in the right atrium of the heart.
Perfuse the animal with 20 ml PBS and then 40 ml formaldehyde solution. For P30 and older mice, use a perfusion rate of 12 ml/ min but for younger animals use a lower rate (7 - 10 ml/min).
- Dissect the brain.
- Sever the mouse head with surgical scissors by making a cut posterior from the ears. Make a caudal midline incision in the skin and work rostrally to remove the skin from skull.
- Starting from the caudal part, cut through the top of the skull along midline and between the eyes with Iris scissors. Remove the parietal and frontal bone plates by tilting one side of a bone plate each time and snapping it off with tweezers.
- Gently tilt the brain upward from the anterior part with tweezers and cut the optic nerves and other cranial nerves. Gently lift the brain out of the skull.
Place the brain into a mouse coronal brain matrix. Slice the brain into 3 approximately 4 mm pieces with a feather razor blade.
Transfer the slices into 4% PFA solution and incubate O/N at 4 °C.
Transfer brain slices to DEPC-treated 20% sucrose solution and incubate O/N at 4 °C
Place each brain slice into a dry cryomould, surround with optimum cutting temperature (OCT) medium and freeze on dry ice. Store at -80 °C.
3. Cryosectioning
Cut 15 µm sections of frozen tissue in a cryostat and collect the sections onto microscope slides. If required, wet the sections with DEPC-treated PBS and flatten them with a fine paintbrush.
Leave the slides to dry for approximately 1 hr to ensure that the tissue adheres to the slide.
4. Hybridization
Prepare 65 °C wash buffer: 150 mM NaCl, 15 mM Na3C3H5O(COO)3 (= 1x saline sodium citrate), 50% (v/v) formamide and 0.1% (v/v) Tween-20.
Prepare MABT buffer: 100 mM maleic acid, 150 mM NaCl, 0.1% (v/v) Tween-20, pH 7.5.
Dilute the two probes (DIG-labelled and FITC-labelled) 1/1,000 in hybridization buffer pre-warmed to 65 °C and mix well.
Apply around 300 µl of hybridization mixture onto each slide, coverslipwith oven-baked (200 oC) coverslips and incubate O/N at 65 °C in a humidified chamber.
Transfer the slides into a Coplin jar containing pre-warmed wash buffer. Wash the slides for 30 min twice at 65 °C with wash buffer.
Wash the slides for 10 min three times with MABT at RT.
5. Visualization of the FITC Probe
Prepare ISH blocking buffer: MABT with 2% blocking reagent and 10% heat-inactivated sheep serum.
Optional: use a hydrophobic pen to draw circles around the tissue sections on the slide to reduce the volume of antibody solutions required.
Incubate the slides for 1 hr at RT with ISH blocking buffer in a humidified chamber.
Incubate the slides O/N at 4 °C with a horseradish peroxidase (POD)- conjugated anti-FITC antibody diluted 1/500 (v/v) in ISH blocking buffer.
Place the slides into a Coplin jar containing PBS with 0.1% (v/v) Tween-20 (PBST). Wash 3 times for 10 min in PBST and replace with fresh PBST each time.
Immediately before use, prepare the fluorescent tyramide by diluting 100 times into the Amplification diluent. For this example, use FITC-tyramide.
Add this to the slides and leave for 10 min at RT.
Place the slides into a Coplin jar and wash 3 times in PBST for 10 min.
6. Visualization of the DIG Probe
Prepare 0.1 M Tris- HCl pH 8.2.
Incubate the slides with ISH blocking buffer for 1 hr at RT.
Incubate the slides O/N at 4 °C with an alkaline phosphatase (AP) -conjugated anti-DIG antibody diluted 1/1,500 (v/v) in ISH blocking buffer.
Wash with MABT for 10 min three times.
Wash twice with 0.1 M Tris-HCl pH 8.2 for 5 min at RT.
Immediately before use, prepare Fast Red solution by dissolving the tablets in 0.1 M Tris pH 8.2. Filter the solution through a 0.22 µM filter.
Incubate the slides at 37 °C with Fast Red solution in a humidified chamber. As the time for optimal development varies, check the slides regularly with a fluorescent microscope to monitor the formation of precipitate. For this example, stop the reaction after 2 - 3 hr.
Wash with PBST for 10 min three times.
7. Immunohistochemistry
Prepare IHC blocking buffer: 10% (v/v) serum (of a different species to primary antibody host) in PBST.
Incubate slides with IHC blocking buffer for 1 hr at RT in a humidified chamber.
Prepare primary antibody: dilute the primary antibody at an appropriate dilution in PBST with 5% serum (of a different species to primary antibody host). For this example, use a rabbit anti-Olig2 antibody at 1/400 (v/v) dilution.
Incubate in the primary antibody solution at 4 °C O/N.
Wash with PBST for 10 min three times.
Prepare secondary antibody: dilute a fluorophore-conjugated secondary antibody at an appropriate dilution in PBST with 5% (v/v) serum (of a different species to primary antibody host) and 0.1% (v/v) Hoechst 33258. For this example, use a donkey anti-rabbit Alexa647 secondary antibody at 1/1,000 (v/v) dilution.
Incubate in the secondary antibody solution at RT for 1 hr.
Wash with PBST for 10 min three times.
8. Mounting
Partially dry the slides at RT, and mount with a fluorescence mounting medium. Leave the slides to dry and then image in a confocal microscope under 10X, 20X and 63X objectives using 4 different channels with the following excitation wavelengths: 570 nm for Fast Red, 488 nm for FITC, 647 nm for Olig2 immunolabelling and 350 nm for Hoechst.
Representative Results
This article describes a method for a double fluorescence ISH followed by immunolabelling in mouse brain sections. A brief description of this protocol is shown in Figure 1. The first step was to synthesize probes specific to Aspa and Mbp (myelin basic protein). To check that the probes had been synthesized, a small aliquot of each reaction was run on an agarose gel. The faint linear template and a large amount of the RNA probe can be seen (Figure 2). Double fluorescence ISH forAspa and Mbp, followed by Olig2 immunolabelling and Hoechst nuclear staining, was performed on mouse brain sections. We scanned the brain sections in a confocal microscope and stitched the images together to reveal the distribution of gene expression signals in the brain. Aspa expression in Mbp-positive (Mbp+) cells was observed throughout the brain (Figure 3). We also examined Aspa expression in different brain structures using a higher magnification.Aspa expression in oligodendrocytes in the cortex and corpus callosum are shown in Figure 4. The co-localization of Mbp, Olig2, and Aspa indicates that Aspa is expressed in a subset of mature oligodendrocytes in the cortex and the corpus callosum (Figure 4). These results demonstrate that this protocol can simultaneously detect the expression of three different genes in brain sections.
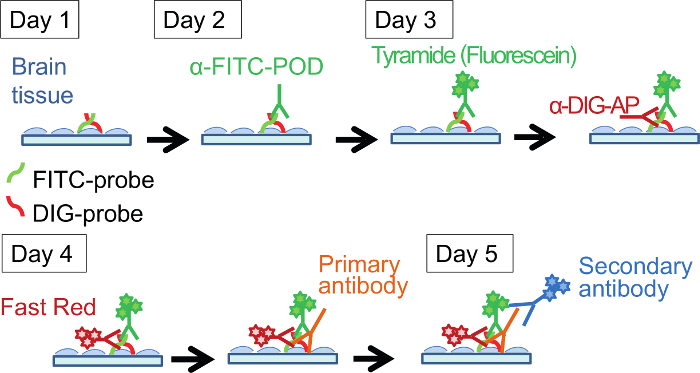 Figure 1. Protocol for Double Fluorescence In Situ Hybridization Followed by Immunostaining. This protocol runs over 5 days and detects the expression of three genes. Please click here to view a larger version of this figure.
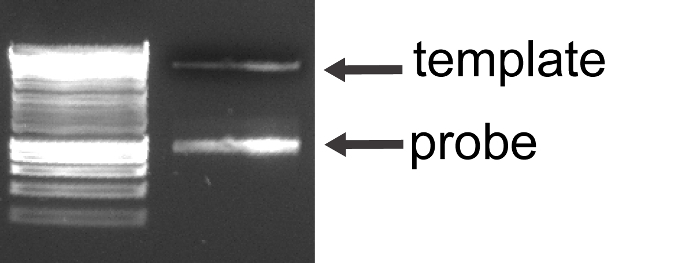 Figure 2. Examination of Aspa RNA Probe on Agarose Gel. The linear template and a large amount of the RNA probe of a lesser molecular weight can be observed. Please click here to view a larger version of this figure.
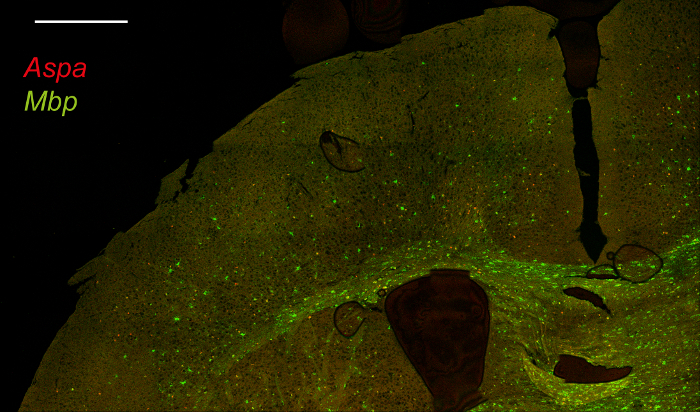 Figure 3. Double Fluorescence in situ Hybridization for Aspa and Mbp in Mouse Brain Sections. Brain sections were scanned with a confocal microscope and images were stitched together to show the distribution of Aspa (red) and Mbp (green) in the brain. Scale bar: 500 µm. Please click here to view a larger version of this figure.
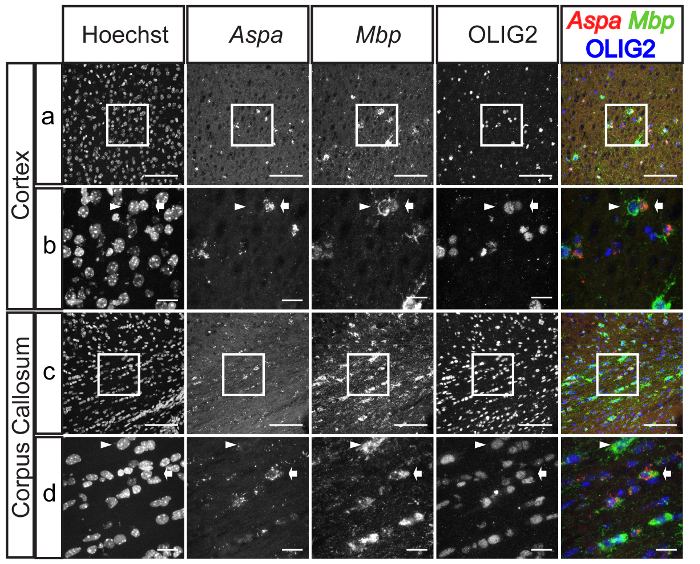 Figure 4. Expression of Aspa in Oligodendrocytes in the Cortex and the Corpus Callosum. Panels show representative images from ISH for Aspa (red) and Mbp (green) followed by immunostaining of Olig2 (blue) combined with Hoechst staining. Aspa was expressed in some Mbp+/Olig2+ cells in the cortex (A and B) and in the corpus callosum (C and D). Mbp+/Olig2+/Aspa+ cells are indicated with arrows and Mbp+/Olig2+/Aspa- cells are indicated with arrowheads in the enlarged panels (B and D). Scale bars: 100 µm (A and C); 20 µm (B and D). Please click here to view a larger version of this figure.
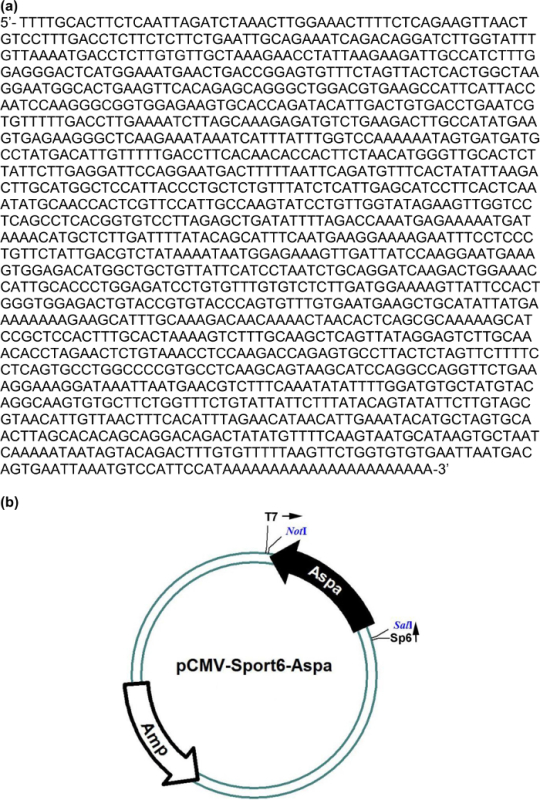
Supplementary Figure 1.Sequence and Map of Aspa Clone (IRAVp968C0654D). 1.5kb cDNA sequence of Aspa was inserted into pCMV-Sport6 plasmid (A). The map of pCMV-Sport6-Aspa plasmid is shown in (B). Please click here to download this file.
Discussion
This protocol provides a step-by-step procedure for a double RNA in situ hybridization followed by immunostaining. We have used this protocol to confirm that Aspa is expressed in mature oligodendrocytes in several brain areas.
This multi-step procedure has many potential pitfalls that can affect sensitivity and should be avoided. First, all the solutions and storage buffers for the transcription reaction need to be RNase-free. Second, the choice of cDNA templates is important and we prefer templates approximately 1kb in length. It is necessary to clean up the cDNA templates with phenol/chloroform extraction and re-precipitate them before in vitro transcription. In addition, the transcription of the probe needs to be optimal; if the probe is not produced in sufficient quantity, it will reduce the quality of ISH. The quality of the probe can be checked by examining it on an agarose gel and good quality will be evidenced by the strong brightness of the probe band compared to the template band (Figure 2). For double ISH, two differently labelled probes are used, usually one labelled with DIG and the other with FITC. The FITC-labelled probe is considered to be the least detectable and should be chosen where the target mRNA is expected to be highest in the tissue. This probe is usually developed first and the DIG-labelled probe is developed second.
Another critical step is the tissue preparation. Mice are perfused with DEPC-treated PBS followed by 4% PFA, post-fixed in 4% PFA O/N and then cryoprotected in 20% sucrose solutions that have been DEPC-treated to destroy any residual RNase. Fixation time is quite important; over- or under-fixation can lead to a weaker signal, perhaps due to reduced probe penetration (over-fixation) or degradation of the mRNA (under-fixation). The tissue is then cryosectioned and two probes are hybridized O/N. The formamide used in the hybridization buffer needs to be de-ionized. A very important consideration during the O/N hybridization at 65 ˚C is to avoid evaporation and concentration of the hybridization mixture as it might compromise sensitivity. In the experiment described we performed hybridization at 65 ˚C O/N, but it might be worth trying lower temperatures for different probes if it appears to be difficult to detect the target mRNA.
There is a choice of reagents for detecting the hybridized probes. Fast Red is a sensitive fluorescent reagent but not all batches of Fast Red give the same result. It needs AP for development and gives fluorescence with rhodamine excitation. In our experience, it is important to make it fresh with 0.1 M Tris-HCl pH 8.2 and filter it before use. A non-fluorescent option is colour development with nitro-blue tetrazolium (NBT) and 5-bromo-4-chloro-3'-indolyphosphate (BCIP) which works with the same AP-conjugated antibody. Another option is using fluorescent tyramide for detection. Although fluorescent tyramide systems are not the most sensitive methods, the developing reaction with horseradish peroxidase is very quick and there are at least three fluorescent colours (FITC, Cyanine 3 and Cyanine 5) that can be used. A limitation of this protocol is that some target antigens (or epitopes), especially low abundance proteins, may not be detectable after the ISH process and hence are not suitable for IHC after ISH. In our immunostaining, antibody detection of Olig2 appears unaffected. The user will need to choose the right antibody for immunolabelling following ISH.
IHC and ISH are commonly used techniques for gene expression pattern studies, and both have pros and cons. IHC is a highly sensitive method for detecting the cellular expression of genes in brain sections, but its reliance on the antibody affects its specificity and limits its application. By contrast, ISH has a high specificity and the probe of any gene can easily be synthesised by in vitro transcription using the gene specific cDNA as template. The protocol that we developed takes advantage of both methods, combining double ISH with IHC to achieve triple detection of gene expression with high specificity.
In short, the protocol we describe here enables simultaneous staining of two mRNAs and one protein, so it provides a useful tool for illustrating co-localized gene expression. Despite the fact that mRNA expression does not always correlate with protein expression, ISH is a powerful technique that allows us to examine gene expression with high specificity. Our protocol of double fluorescence ISH combined with IHC has proved to be a success in detecting Aspa expression in a subset of oligodendrocytes in brain tissue of adult mice, and it can be easily adapted for a variety of tissues of different origins and developmental stages. In addition, this protocol can also be used for detecting expression of small RNAs such as miRNA.
Disclosures
The authors declare that they have no competing financial interests.
Acknowledgments
Work in the authors' laboratories was supported by the UK Biotechnology and Biological Sciences Research Council (BB/J006602/1 and BB/L003236/1), the Wellcome Trust (WT100269MA) and the European Research Council (ERC, "Ideas" Programme 293544). SJ was supported by an EMBO long-term fellowship. The authors thank Stephen Grant for his technical assistance.
References
- Lobsiger CS, Cleveland DW. Glial cells as intrinsic components of non-cell-autonomous neurodegenerative disease. Nat Neurosci. 2007;10(11):1355–1360. doi: 10.1038/nn1988. [DOI] [PMC free article] [PubMed] [Google Scholar]
- Baslow MH. N-acetylaspartate in the vertebrate brain: metabolism and function. Neurochem Res. 2003;28(6):941–953. doi: 10.1023/a:1023250721185. [DOI] [PubMed] [Google Scholar]
- Hoshino H, Kubota M. Canavan disease: clinical features and recent advances in research. Pediatr Int. 2014;56(4):477–483. doi: 10.1111/ped.12422. [DOI] [PubMed] [Google Scholar]
- Kaul R, Gao GP, Balamurugan K, Matalon R. Cloning of the human aspartoacylase cDNA and a common missense mutation in Canavan disease. Nat Genet. 1993;5(2):118–123. doi: 10.1038/ng1093-118. [DOI] [PubMed] [Google Scholar]
- Divry P, Mathieu M. Aspartoacylase deficiency and N-acetylaspartic aciduria in patients with Canavan disease. Am J Med Genet. 1989;32(4):550–551. doi: 10.1002/ajmg.1320320425. [DOI] [PubMed] [Google Scholar]
- Bartalini G, et al. Biochemical diagnosis of Canavan disease. Childs Nerv Syst. 1992;8(8):468–470. doi: 10.1007/BF00274411. [DOI] [PubMed] [Google Scholar]
- Moffett JR, Ross B, Arun P, Madhavarao CN, Namboodiri AM. N-Acetylaspartate in the CNS: from neurodiagnostics to neurobiology. Prog Neurobiol. 2007;81(2):89–131. doi: 10.1016/j.pneurobio.2006.12.003. [DOI] [PMC free article] [PubMed] [Google Scholar]
- D'Adamo AF, Smith JC, Woiler C. The occurrence of N-acetylaspartate amidohydrolase (aminoacylase II) in the developing rat. J Neurochem. 1973;20(4):1275–1278. doi: 10.1111/j.1471-4159.1973.tb00097.x. [DOI] [PubMed] [Google Scholar]
- Bhakoo KK, Craig TJ, Styles P. Developmental and regional distribution of aspartoacylase in rat brain tissue. J Neurochem. 2001;79(1):211–220. doi: 10.1046/j.1471-4159.2001.00561.x. [DOI] [PubMed] [Google Scholar]
- Sommer A, Sass JO. Expression of aspartoacylase (ASPA) and Canavan. Gene. 2012;505(2):206–210. doi: 10.1016/j.gene.2012.06.036. [DOI] [PubMed] [Google Scholar]
- Klugmann M, et al. Identification and distribution of aspartoacylase in the postnatal rat brain. Neuroreport. 2003;14(14):1837–1840. doi: 10.1097/00001756-200310060-00016. [DOI] [PubMed] [Google Scholar]
- Madhavarao CN, et al. Immunohistochemical localization of aspartoacylase in the rat central nervous system. J Comp Neurol. 2004;472(3):318–329. doi: 10.1002/cne.20080. [DOI] [PubMed] [Google Scholar]
- Hershfield JR, et al. Aspartoacylase is a regulated nuclear-cytoplasmic enzyme. Faseb J. 2006;20(12):2139–2141. doi: 10.1096/fj.05-5358fje. [DOI] [PubMed] [Google Scholar]
- Moffett JR, et al. Extensive aspartoacylase expression in the rat central nervous system. Glia. 2011;59(10):1414–1434. doi: 10.1002/glia.21186. [DOI] [PMC free article] [PubMed] [Google Scholar]
- Kirmani BF, Jacobowitz DM, Kallarakal AT, Namboodiri MA. Aspartoacylase is restricted primarily to myelin synthesizing cells in the CNS: therapeutic implications for Canavan disease. Brain Res Mol Brain Res. 2002;107(2):176–182. doi: 10.1016/s0169-328x(02)00490-4. [DOI] [PubMed] [Google Scholar]
- Kirmani BF, Jacobowitz DM, Namboodiri MA. Developmental increase of aspartoacylase in oligodendrocytes parallels CNS myelination. Brain Res Dev Brain Res. 2003;140(1):105–115. doi: 10.1016/s0165-3806(02)00592-8. [DOI] [PubMed] [Google Scholar]
- Zhang Y, et al. An RNA-sequencing transcriptome and splicing database of glia, neurons, and vascular cells of the cerebral cortex. J Neurosci. 2014;34(36):11929–11947. doi: 10.1523/JNEUROSCI.1860-14.2014. [DOI] [PMC free article] [PubMed] [Google Scholar]


