Abstract
Two-pore channels (TPCs) contain two copies of a Shaker-like six-transmembrane (6-TM) domain in each subunit and are ubiquitously expressed in both animals and plants as organellar cation channels. Here, we present the first crystal structure of a vacuolar two-pore channel from Arabidopsis thaliana, AtTPC1, which functions as a homodimer. AtTPC1 activation requires both voltage and cytosolic Ca2+. Ca2+ binding to the cytosolic EF-hand domain triggers conformational changes coupled to the pair of pore-lining inner helices (IS6 helices) from the first 6-TM domains, whereas membrane potential only activates the second voltage-sensing domain (VSD2) whose conformational changes are coupled to the pair of inner helices (IIS6 helices) from the second 6-TM domains. Luminal Ca2+ or Ba2+ can modulate voltage activation by stabilizing VSD2 in the resting state and shifts voltage activation towards more positive potentials. Our Ba2+ bound AtTPC1 structure reveals a voltage sensor in the resting state, providing hitherto unseen structural insight into the general voltage-gating mechanism among voltage-gated channels.
Introduction
Two-pore channels (TPCs) are cation channels ubiquitously expressed in organelles of animals and plants1–4 (Extended Data Fig. 1a), and believed to be evolutionary intermediates between homotetrameric voltage-gated potassium/sodium channels and four-domain single subunit voltage-gated sodium/calcium channels5. Each TPC subunit contains 12 transmembrane segments that can be divided into two homologous copies of an S1–S6 Shaker-like 6-TM domain6, with the channel assembling as a dimer – the equivalent of a voltage-gated tetrameric cation channel.
Since the molecular identification of the first TPC channel from rat kidney7, three subfamilies of animal TPC channels have been defined – TPC1, 2 and 3 – with the first two expressed ubiquitously in animals and the subject of extensive studies2, 8–15. Animal TPC1 and 2 are localized to the endosomal/lysosomal membrane and their physiological functions are still under debate. While some studies suggested TPCs mediate NAADP-dependent calcium release from endolysosomes2,8–9,15, others have proposed they are sodium-selective channels activated by PI(3,5)P2 rather than NAADP10,11. It has also been shown that mammalian TPCs interact with the mTOR complex and sense cellular nutrient status via ATP inhibition in an mTOR-dependent manner11. A recent study demonstrated that TPC activity is essential for the release of Ebola virus from endosome/lysosome into the host cell, thus making TPCs potential targets for the treatment of Ebola infection16.
AtTPC1, the first TPC channel cloned from plant17, is localized to the vacuolar membrane and is responsible for generating the slow vacuolar (SV) current observed long before its molecular identification18 and consequently is also called the SV channel. AtTPC1 is a non-selective cation channel, permeable to various monovalent cations as well as Ca2+ (ref. 19, 20) and likely plays an important role in regulating cytosolic ion concentrations3. The channel is voltage-gated and its voltage-dependent activation can be modulated by both cytosolic and vacuolar Ca2+. Cytosolic Ca2+ potentiates voltage activation by binding to the EF-hand domain, located between the two 6-TM domains in plant TPC1 but absent in animal TPCs21. Interestingly, vacuolar Ca2+ adversely affects channel gating by slowing down voltage activation and shifting the voltage dependence toward positive potentials22. It has been shown that plant TPCs are involved in the regulation of various physiological processes such as germination and stomatal opening1, jasmonate biosythesis23,24, and long-distance calcium wave propagation induced by high salt concentrations25. In this study, we determined the crystal structure of AtTPC1 to 3.3 angstrom resolution, which, along with electrophysiological analysis, reveals the molecular mechanism of voltage-gating and calcium modulation in plant TPC1.
Results
Functional analysis of AtTPC1
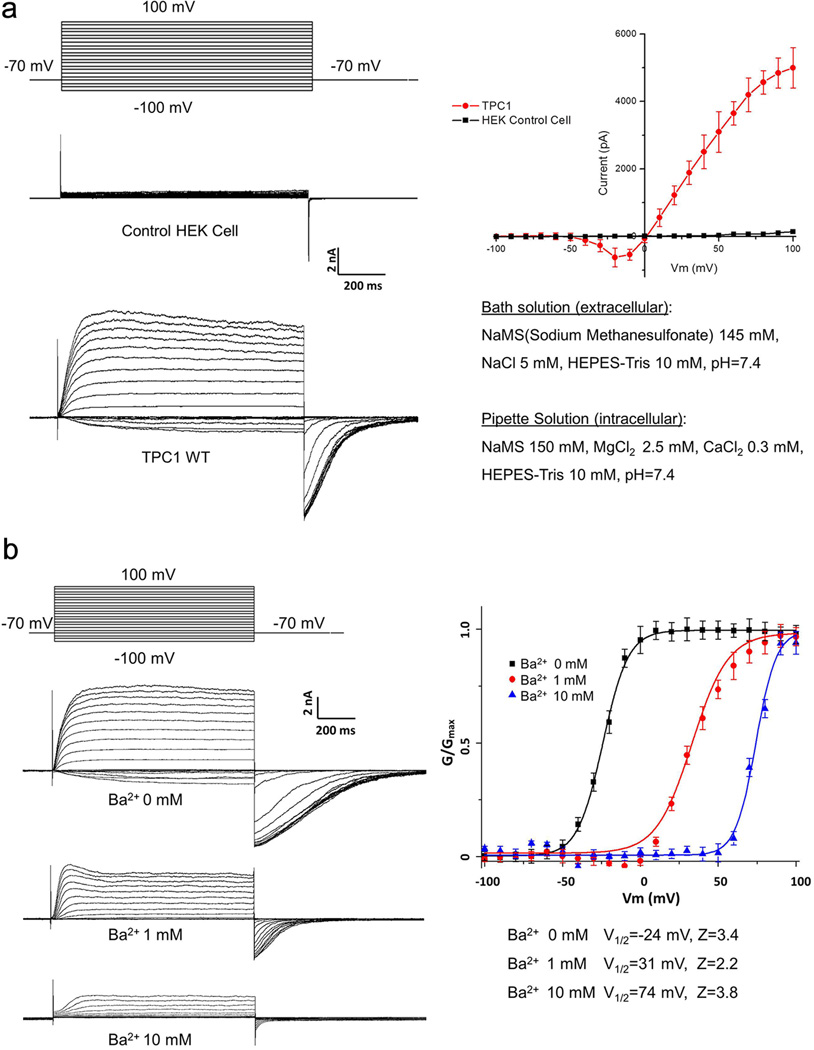
Unlike most activity measurements of AtTPC1 channels employing direct patch clamp recording of vacuolar membranes, we expressed AtTPC1 in HEK293 cells and measured plasma membrane channel activity using whole-cell patch clamping (Extended Data Fig. 2a and Methods). In this setting, the extracellular side (facing the bath solution) is equivalent to the luminal side of AtTPC1 in vacuoles. As previously shown, AtTPC1 is voltage-gated and cytosolic Ca2+ is required for channel activation as no current was observed at 100 mV membrane potential at [Ca2+]cytosol below 100 nM (Fig. 1a). Cytosolic Ca2+ potentiates channel activation by shifting the voltage activation towards hyperpolarization, increasing the activation rate and slowing down deactivation. Conversely, increasing bath [Ca2+], analogous to increased vacuolar Ca2+, shifts voltage activation towards a more positive potential, with the channel displaying slowed activation and faster deactivation (Fig. 1b). Ba2+ can have a similar inhibitory effect as vacuolar Ca2+ (Extended Data Fig. 2b). The non-selective nature of AtTPC1 was assessed using Na+ and K+ as permeating ions, confirming that AtTPC1 conducts Na+ and K+ equally well (Fig. 1c). No channel inactivation was observed in any of our recordings.
Figure 1. Voltage activation and Ca2+ modulation of AtTPC1 over-expressed in HEK cell.
a, Cytosolic Ca2+-dependent voltage activation of AtTPC1. Currents were recorded with varying [Ca2+]cyto in pipette and calcium free in bath (extracellular). Boltzmann fit yields V1/2=−28mV, Z=3.9 for voltage activation in 300uM [Ca2+]cyt and V1/2=48mV, Z=1.9 in 100µM [Ca2+]cyt. b, Extracellular Ca2+ inhibition of AtTPC1. Currents were recorded with the presence of 300 µM [Ca2+]cyt (pipette) using the same protocol as a. V1/2=−28mV, Z=3.5 for 0 [Ca2+]ext; V1/2=33mV, Z=2.1 for 0.1mM [Ca2+]ext. c, Selectivity measurement of AtTPC1 with intracellular 150 mM Na+, 300 µM Ca2+, and extracellular 150 mM Na+ or K+, 0 mM Ca2+. Reversal potential remains unchanged when bath solution is switched from 150 mM Na+ to 150 mM K+.
Overall Structure of AtTPC1
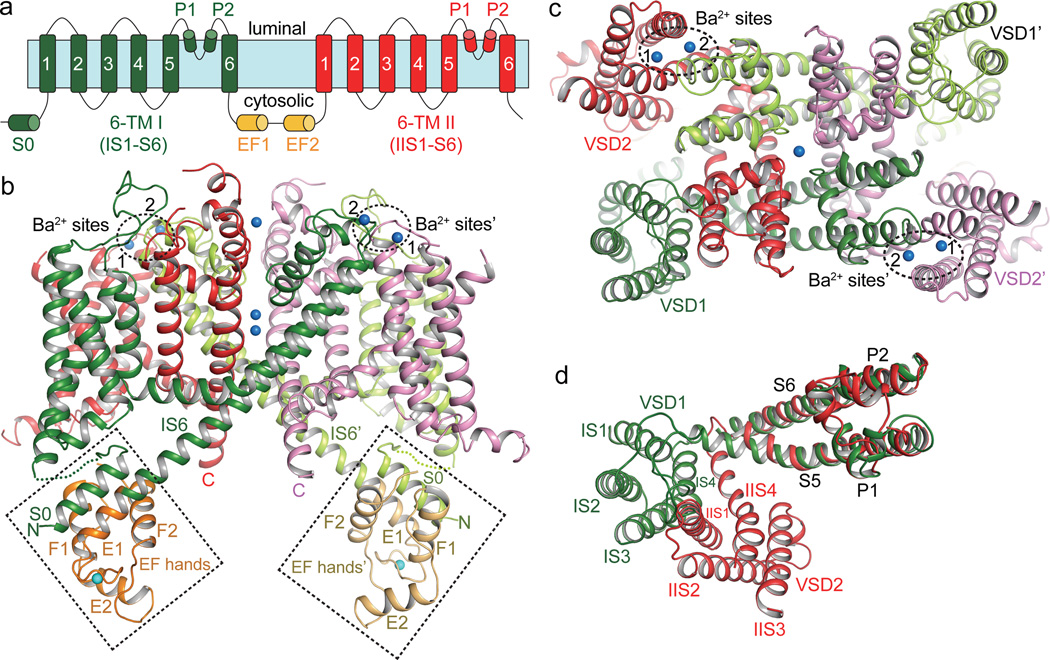
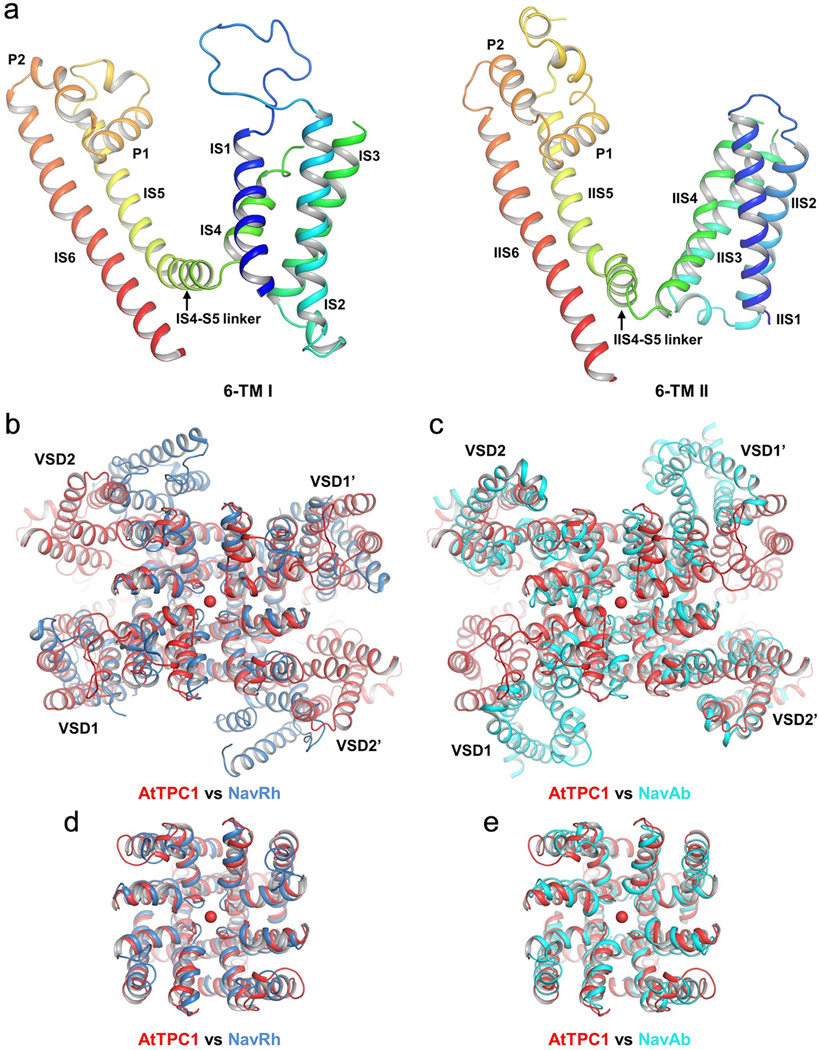
The crystal structure of AtTPC1, determined to 3.3 Å (Methods and Extended Data Table 1) reveals two 6-TM domains (6-TM I and 6-TM II) and an intervening cytosolic EF-hand domain per AtTPC1 subunit, two of which assemble into a functional channel equivalent to a tetrameric voltage-gated channel (Fig. 2a–c). Following the same nomenclature as other voltage-gated channels, we labeled the six membrane-spanning helices within each 6-TM domain as IS1–IS6 and IIS1–IIS6, respectively (Extended Data Fig. 1). The overall structure of each 6-TM domain resembles that of the prokaryotic Nav channels26,27 and contains two pore helices (P1 and P2) between S5 and S6 (Extended Data Fig. 1, 3). The AtTPC1 pore displays pseudo 4-fold symmetry and superimposes well with other tetrameric channel pores (Extended Data Fig. 3d, e). However, this symmetry breaks down at the peripheral S1–S4 VSDs, which are attached to the pore with different relative positions within each subunit (Fig. 2d), resulting in a rectangular shaped channel dimer when viewed from the luminal side, with the two intra-subunit VSDs being more proximal than the inter-subunit VSDs (Fig. 2c). Interestingly, the relative position of VSD1 attachment to the pore of AtTPC1 resembles that of NavRh27 whereas VSD2 is similar to NavAb26 (Extended Data Fig. 3b, c). The EF-hand domain contains two tandem EF-hand motifs and is located below VSD1 (Fig. 2b). The E1 helix of the first EF-hand comes from the C-terminal part of an exceptionally long IS6 helix; this structural feature allows for the Ca2+-dependent conformational change at the EF-hand domain to be directly coupled to the pair of pore-lining IS6 helices in a functional channel.
Figure 2. Overall structure of AtTPC1.
a, Topology diagram of AtTPC1. b, Side view of an AtTPC1 channel dimer. 6-TM I, 6-TM II, and EF hands from one subunit are shown in green, red and orange, respectively, and from the other symmetry related subunit are shown in lime green, purple and light orange, respectively. The cytosolic EF-hand domains with bound Ca2+ (cyan sphere) in EF-1 are boxed and the two luminal Ba2+ (blue spheres labeled 1 and 2) binding sites are circled. c, AtTPC1 viewed from luminal side. d, Superposition between the two 6-TM domains using the pore domains in the alignment. The orientation of 6-TM I is the same as that in c.
Ion conduction pore of AtTPC1
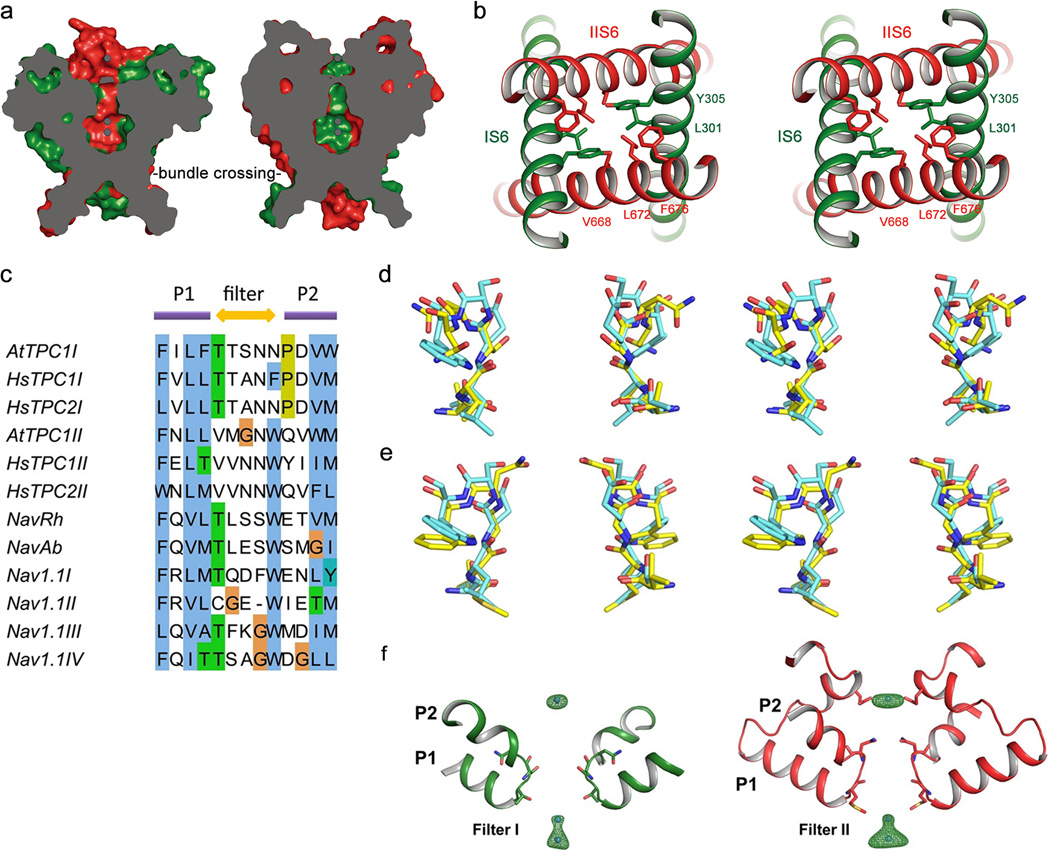
The AtTPC1 ion conduction pore contains two pore helices between the outer (S5) and inner (S6) helices similar to prokaryotic Nav channels26,27 (Fig. 3a). The pore is likely in a closed state since the four pore-lining inner helices form a bundle crossing at the cytosolic side with multiple constriction points that prevent the passage of hydrated cations (Fig. 3c and Extended Data Fig. 4a, b).
Figure 3. The ion conduction pore.
a, The ion conduction pore comprised of IS5–6 (left, green) and IIS5–6 (right, red). Ba2+ ions are shown as blue spheres. b, Structures of the selectivity filter formed by Filter I (left) and Filter II (right). c, Side view of the bundle crossing formed by IS6 pair (left) and IIS6 pair (right). Numbers are diagonal distances (in Å) of the constriction points.
Unlike a K+ channel filter, which forms a long narrow ion passageway with four well defined ion binding sites for dehydrated K+, AtTPC1 has a much shorter and wider selectivity filter comprising residues 264TS265 from filter I and 629MGN631 from filter II (Fig. 3b). These filter residues surround the ion conduction pathway with both side-chain hydroxyl groups and main-chain carbonyls. The overall main-chain conformations of both filters, especially filter II, are similar to that of prokaryotic Nav channels26 (Extended Data Fig. 4c–e). The atom-to-atom cross distances along the major part of the filter ion pathway are around 8–9 Å (Fig. 3b). The side chain of Asn631 forms the narrowest point at the external entrance of the filter II cross-section with a distance of ~5 Å. However, Asn631 does not interact with any nearby residues and its side chain can freely rotate away from the central axis, rendering it unlikely to constrict ion permeation. The wide filter dimension in AtTPC1 implies that permeable ions cross the filter in a hydrated or partially hydrated state.
The crystallization condition for AtTPC1 also contained high concentrations of BaCl2, and multiple Ba2+ ions were identified in the structure – three of which bind along the central pore axis: one at the external vestibule and two in the central cavity (Fig. 3a and Extended Data Fig. 4f). Unlike K+ channels, no Ba2+ is observed within the filter. Due to the resolution limit, no clear electron density from ions or water molecules could be defined within the filter despite the presence of Na+, Ba2+ and Ca2+ in the crystallization conditions. Thus, a higher resolution structure is required to define how permeable ions interact with the filter residues.
Cytosolic Ca2+ activation site
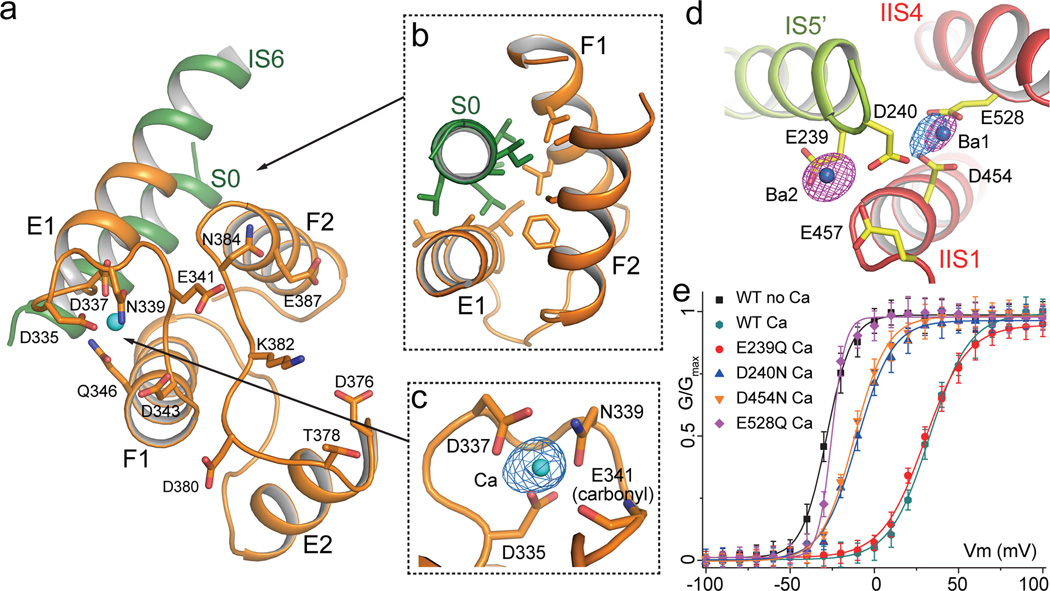
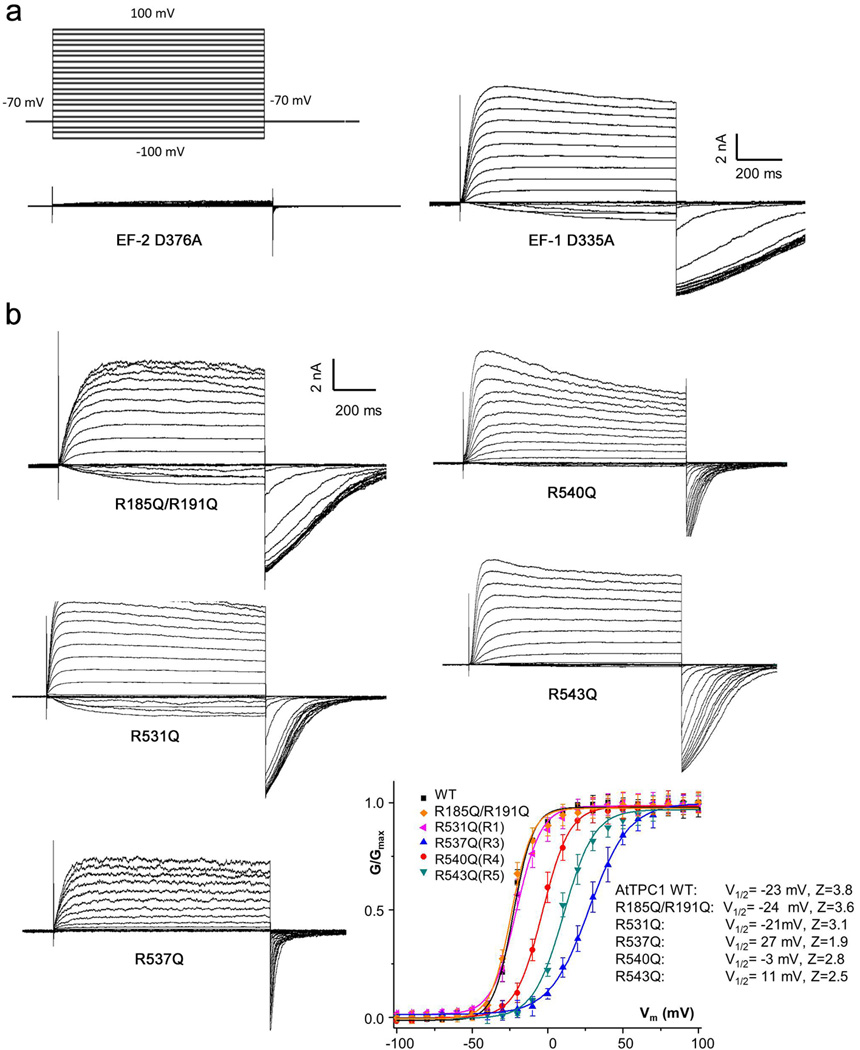
The AtTPC1 EF-hand domain follows the IS6 inner helix and contains two tandem EF-hand motifs (EF-1 and EF-2) where cytosolic Ca2+ binds and potentiates voltage activation (Fig. 2a, b and Fig. 4a). Despite the presence of high Ba2+ concentrations in the crystallization conditions, no Ba2+ binding was observed in either EF-hand, indicating high Ca2+ specificity. With the presence of 1 mM Ca2+ in the crystallization conditions, EF-1 adopts a canonical Ca2+-bound EF-hand structure. The bound Ca2+ was also confirmed by anomalous scattering calculated from X-ray diffraction data collected at 2 Å wavelength using a crystal grown in the absence of Ba2+ (Fig. 4c). EF-2, however, adopts an apo state likely due to a lower Ca2+ affinity and its structure differs significantly from the canonical Ca2+-bound EF-hand. The E2 helix is distal from the F2 helix and the Ca2+-binding loop adopts an extended conformation. Consequently, those key Ca2+-binding residues are no longer properly positioned for Ca2+ coordination (Fig. 4a). Interestingly, a previous study on AtTPC1 demonstrated that only EF-2 plays an essential role in Ca2+ sensing21. This is also confirmed in our functional assay showing that a D335A mutation in the EF-1 Ca2+ site retains cytosolic Ca2+ activation, whereas a D376A mutation in EF-2 abolishes it (Extended Data Fig. 6a). Thus, only Ca2+ binding to EF-2 triggers major conformational changes for channel activation and the structure of the EF-hand domain represents a deactivated state, despite the presence of Ca2+ at EF-1. The tight protein packing around EF-1 with the involvement of the S0 helix may explain the lack of EF-1 Ca2+ activation. The N-terminal S0 helix of AtTPC1, although distal in primary sequence, is an integral part of the EF-hand domain and has been shown to be functionally indispensable28. The S0 helix runs antiparallel to the E1 helix and is embedded in the deep hydrophobic groove formed by the E1, F1 and F2 helices (Fig. 4b). The extensive van der Waals interactions between S0 and EF-1 likely lock the E1/F1 helices into a fixed position and prevent it from undergoing any structural change in response to Ca2+.
Figure 4. The calcium modulation sites.
a, Overall structure of the EF-hand domain with S0 and the C-terminal part of IS6 in green, and EF-hand helices in orange. Side chains are from residues predicted to participate in Ca2+ binding in EF-1 and EF-2. b, Packing interactions between S0 and E1/F1/F2. Residues contributing to the extensive hydrophobic contacts are: A34, L37, V38, L40, A41 and I45 on S0; A330, L333 and I334 on E1; L350 and L354 on F1; F388, C392 and A396 on F2. c, EF-1 Ca2+ (cyan sphere) coordination with anomalous difference Fourier map (blue mesh contoured at 3.5 σ). d, Luminal Ba2+ sites. Density from Ba2+ (magenta mesh at 11 σ) and Ca2+ (blue mesh at 6 σ) are defined by anomalous difference Fourier maps from native crystals grown with and without Ba2+, respectively. e, G-V curves of wild type AtTPC1 and mutations at luminal Ba2+ sites recorded in the presence and absence of 100 µM extracellular Ca2+. Wild type and mutant G-V curves recorded in the absence of Ca2+ are similar and only the wild type one is shown.
Luminal Ca2+ inhibition site
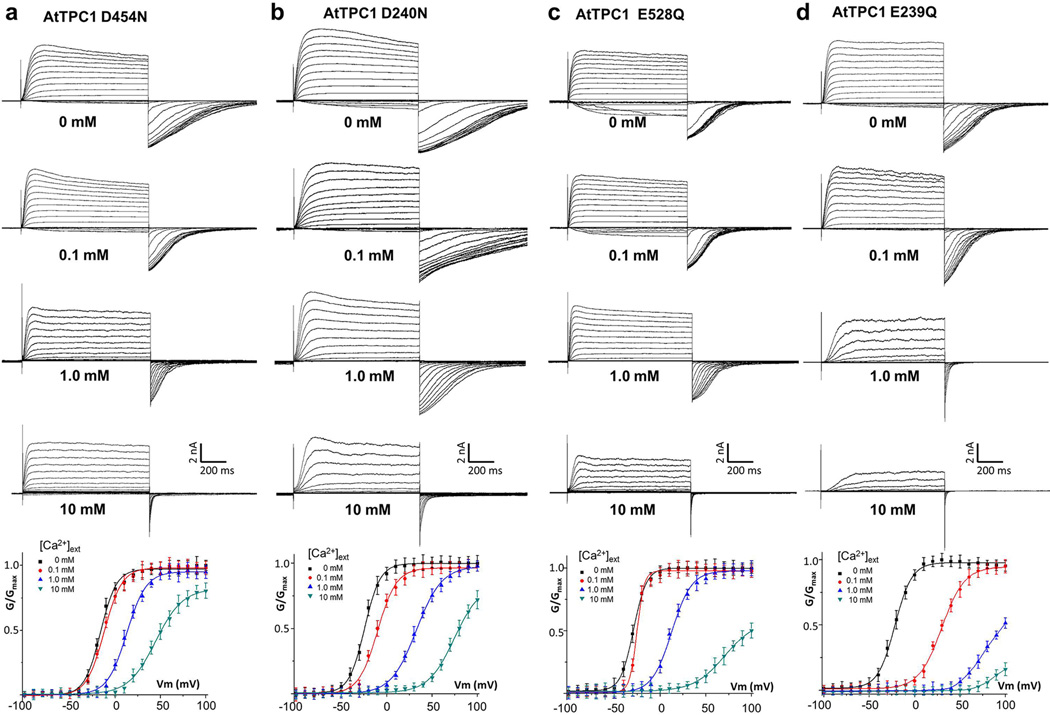
Contrary to cytosolic Ca2+, luminal Ca2+ is known to inhibit channel activation and Asp454 was previously identified to be important for luminal Ca2+ binding from a gain-of-function mutant fou222–24. Two Ba2+ ions are observed in the vicinity of Asp454 (Fig. 4d). The site 1 Ba2+ is coordinated by the side-chain carboxylates of Asp454 on IIS1, Glu528 on IIS4, and Asp240 on IS5 from a neighboring subunit. The second Ba2+ site is surrounded by residues Glu239, Asp240 and Glu457. Since Ba2+ exerts a similar inhibitory effect as Ca2+, albeit with weaker affinity (Extended Data Fig. 2b), they likely share the same inhibitory site. Two observations suggest that site 1 is the bona fide Ca2+ inhibition site and that the second Ba2+ binding is likely a consequence of high Ba2+ concentrations in the crystallization conditions. First, the anomalous difference map of a crystal grown in the absence of Ba2+ revealed a Ca2+ anomalous scattering peak at site 1 but not at site 2 (Fig. 4d). Second, neutralization mutations of the three site 1 acidic residues profoundly mitigated luminal Ca2+ inhibition, whereas mutagenesis at site 2, i.e. Glu239Gln, has no effect (Fig. 4e and Extended Data Fig. 5). It is important to note that only VSD2 in AtTPC1 is voltage sensitive and its S4 helix (IIS4) is the primary mobile component during voltage activation as discussed later. Thus, luminal Ca2+ stabilizes VSD2 in the resting state by tethering IIS4 to the static IIS1 helix and the pore forming IS5 of the neighboring subunit, which in turn hinders IIS4 movement in response to voltage changes, analogous to extracellular Zn2+ inhibition observed in the voltage-gated proton channel Hv129.
Voltage sensing domains in AtTPC1
The same gating charge numbering used for Kv1.2–2.130 is adopted in sequence and structure comparison of various VSDs (Fig. 5a). VSD1 from AtTPC1 and its S4–S5 linker have a structural arrangement similar to that of the activated VSD of NavRh27 (Fig. 5a–c, and Extended Data Fig. 3). However, VSD1 in AtTPC1 lacks a few key features seen in canonical voltage-gated channels: the IS4 helix of AtTPC1 contains only two conserved arginine residues at R2 and R4; the 310-helix motif that is commonly seen in voltage-gated channels26,27,31,32 is not preserved in IS4, which forms a regular helix; His and Leu respectively replace the highly conserved acidic and aromatic residues on S2 that form the charge transfer center in voltage-gated channels30, whereas Lys replaces the highly conserved acidic residue on S3. Consequently, VSD1 does not contribute to the voltage-dependent gating, and replacing both S4 arginines with neutral residues does not affect voltage activation of AtTPC1 (Fig. 5d and Extended Data Fig. 6b). VSD2 preserves the key elements of a canonical voltage sensor33–36 and is responsible for voltage-dependent gating in AtTPC1. The IIS4 helix contains 4 arginine residues, which corresponds to R1 (R531), R3 (R537), R4 (R540) and R5 (R543) (Fig. 5a) and mutagenesis analysis shows that R3 to R5, but not R1, contribute to voltage-sensing in AtTPC1 (Fig. 5d). Therefore, R537 at the R3 position represents the first gating charge in AtTPC1.
Figure 5. The voltage sensing domains.
a, Partial S4 sequence alignment and arginine registry. b, Locations of VSD1, VSD2 and IIS4–S5 linker regions in AtTPC1. c, Side view of VSD1 with S1 omitted for clarity - same for VSD2. d, G-V curves of wild type AtTPC1 and neutralization mutations of arginines on IS4 and IIS4. e, Structure of VSD2 (left) and its surface rendered cross section (right). Grey double arrows indicate the three segments of the curved IIS4 helix. Arginine in the gating charge transfer center is labeled in red. f, Acute-angled connection between IIS4 and IIS4–S5 linker and the extensive interactions between the linker and IIS6. For clarity, the channel in b is rotated about 40° around the indicated axis.
The majority of the IIS4 helix in VSD2 forms an exceptionally long, curved 310-helix from L533 to N547 (Fig. 5e), a feature initially observed in the S4 helix of the MlotiK1 potassium channel37 and, more recently, in several other voltage-gated channel structures26,27,31,32. The bent IIS4 helix can be divided into three segments: the N-terminal segment preceding the 310-helix, the short middle segment from L533 to R537, and the long C-terminal segment after R537 running diagonally towards the intracellular membrane surface and connecting to the IIS4–S5 linker helix with a sharp turn (Fig. 5e, f and Extended Data Fig. 3a). The linker helix forms extensive interactions with IIS6, including salt bridges and hydrogen bonds at the beginning, followed by hydrophobic contact towards the end of the linker (Fig. 5f). This extensive interaction network ensures a coupled movement between the linker helix and IIS6 at the intracellular gate.
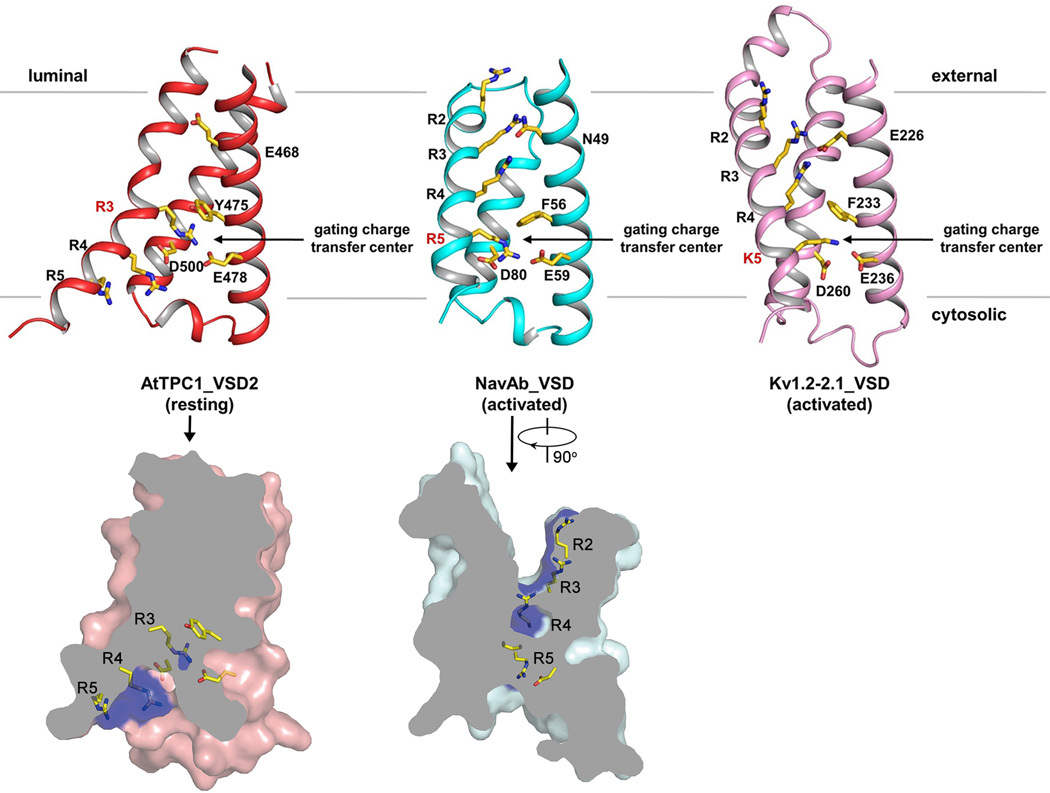
The structure of VSD2 is stabilized in a resting state by luminal Ba2+ and has several structural features distinct from other voltage-gated channels with an activated VSD. AtTPC1 IIS4 has its first gating charge (R537) positioned in the gating charge transfer center30, formed by highly conserved Y475/E478 from IIS2 and D500 from IIS3, whereas the activated VSD of NavAb26 or Kv1.2–2.131 has the last gating charge (R5 or K5) residing in the equivalent position (Fig. 5e and Extended Data Fig. 7). In AtTPC1, the long, curved C-terminal segment of IIS4 together with IIS1–S3 create a wide cavity below the charge transfer center, allowing the rest of the voltage-sensing arginines (R4 and R5) to be exposed to the cytosol (Fig. 5e). However, in an activated VSD, the S4 segment below the charge transfer center is a much shorter, straight helix whereas the segment above is a longer, curved helix, which consequently narrows the cytosolic cavity but creates a deep, external aqueous cavity above the charge transfer center where all the gating charges except the last one become exposed (Extended Data Fig. 7). This external cavity is occluded in the resting VSD2 of AtTPC1 since the N-terminal segment of IIS4 makes close contact with the external portion of IIS1–S3.
Voltage gating mechanism
The structure of AtTPC1 provides a first glance of a voltage-gated channel in a resting state, allowing us to elucidate the structural basis of voltage sensing through structural comparison with NavAb26.. The S1–S3 regions of both channels align well, indicating that S1–S3 undergo no major movement during voltage sensing (Fig. 6a–c). A major difference between the two VSDs is the vertical positioning of their S4 helix. AtTPC1 has R3, whereas NavAb has R5, positioned in the charge transfer center, representing a shift of approximately two 310-helical turns. Attributable to the imperfect alignment between two different channels, the Cα distance of about 8 Å between two equivalent gating charge residues (i.e. R3s) is slightly less than two helical turns. In the context of AtTPC1 a sliding motion of two helical-turns in S4 (~10 Å) from the resting (R3 in transfer center) to the activated (R5 in transfer center) state and resultant transfer of two gating charges across the membrane is plausible (Fig. 6d). The magnitude of the S4 movement and the total gating charges across the field likely vary among voltage-gated channels, depending on the number of gating charge residues. In NavAb with four and Shaker with five gating charges, voltage activation would give rise to three (~15 Å) and four helical-turns (~20 Å) displacements of S4, respectively, consistent with the estimation of 15–20 Å movement across the membrane in some studies38–40. As most voltage-gated channels seen to date appear to have a 310-helix at the gating charge region with all voltage-sensing arginines positioned in-line with respect to one another, the screw-like helical rotation observed in the voltage-sensing phosphatase41 is unlikely to occur in the S4 helix of voltage-gated channels.
Figure 6. Voltage gating mechanism.
a, Side view of Cα superposition between AtTPC1 VSD2 (red) and NavAb VSD (cyan) with S1 omitted. Spheres indicate the Cα positions of critical residues for voltage-sensing. Distances are between Cα atoms of two equivalent S4 residues at the N-terminus (R1-R1), middle (R3-R3) and C-terminus (V122–V548). b and c, Luminal and cytosolic views of the superposition, respectively. d, Cartoon representation of the translational S4 movement from the resting to activated states with two gating charges transferred. Red arrows indicate the directions of the movement at N-, middle, and C-terminal parts of S4, and at S4–5 linker and C-terminus of S6. e, Cytosolic view of the superposition between AtTPC1 (red) and NavAb (cyan) excluding the VSD1s of AtTPC1 and the equivalent VSDs of NavAb. Major structural changes highlighted in circles occur at S4 and S4–S5 linker.
The S4 displacement during voltage-gating induces little conformational change in S3, indicating that S3b-S4 is unlikely to undergo a concerted paddle movement proposed from earlier studies on KvAP39,42. This independent S4 movement is consistent with the recent study showing that removal of the complementarity between S3b and S4 in Shaker does not compromise voltage-gating43. Our study supports the conventional helix translation model44–46 but without rotation during voltage-gating. However, the S4 helix does not move as a simple piston-like rigid unit. Its sliding movement is also accompanied by the bending of its N- and C-terminal segments, converting part of the vertical motion in the middle of S4 into lateral movement at the two S4 termini (Fig. 6a–d). Consequently, the N-terminal S4 segment seals off the external aqueous cavity in the resting state while the C-terminal end of S4 undergoes more lateral movement on the internal membrane surface.
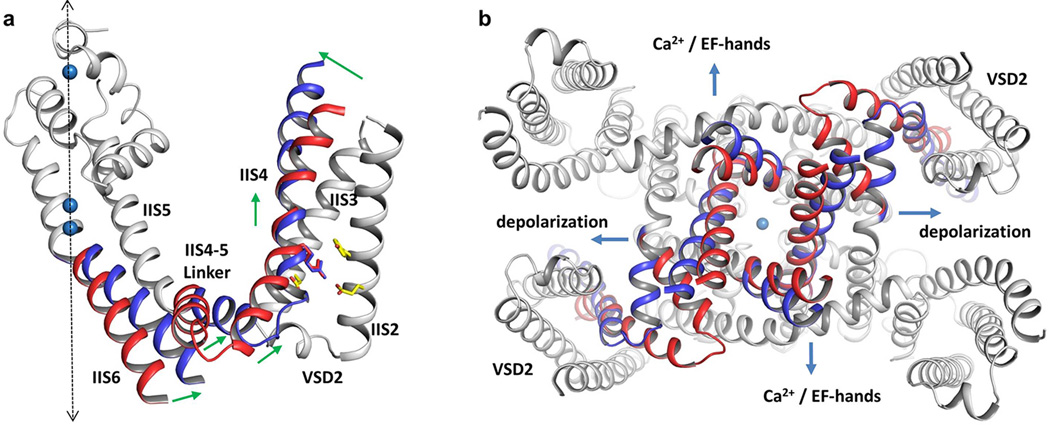
To visualize how S4 movement is coupled to the pore opening and closing, AtTPC1 is superimposed onto NavAb in the context of the whole channel with VSD1 omitted, as it does not contribute to voltage-gating and is positioned differently from the VSD of NavAb26 (Fig. 6e). In AtTPC1, the downward IIS4 helix pushes the IIS4–S5 linker to tightly cuff around IIS6 at the bundle-crossing region, preventing the cytosolic gate from opening. In the activated NavAb, the upward S4 helix pulls the linker helix apart from S6. While the NavAb structure is defined as a pre-open state and its S6 helix appears to be decoupled from the linker, we expect the IIS6 inner helix to move concurrently with the IIS4–S5 linker upon voltage activation in AtTPC1 since its linker helix is tightly packed with IIS6 (Fig. 6d and Extended Data Fig. 8). In a tetrameric voltage-gated channel, this concerted movement of S6 and S4–S5 linker would dilate the gate. In AtTPC1, however, only VSD2 is voltage dependent and the linker movement would only be coupled to the diagonal pair of IIS6 inner helices from the second 6-TM domains. We suspect that cytosolic Ca2+ binding in the EF-hand domains would introduce a similar kind of dilation movement to the other pair of IS6 helices (Extended Data Fig. 8). This dual coupling mechanism explains the requirement for having both cytosolic Ca2+ and depolarization for AtTPC1 activation.
Methods
Protein expression and purification
The full-length AtTPC1 gene (NCBI Accession: NM_116594) was ligated into the pPICZ vector (Invitrogen) containing a C-terminal EGFP-8xHistidine tag. The plasmid was linearized with PmeI restriction enzyme and transformed into Pichia pastoris SMD1163 strain by electroporation (Bio-Rad). The positive strains integrated with recombinant AtTPC1 gene were selected on agar plates containing 500ug/ml zeocin (Invitrogen). For protein expression, the transformed cells were grown in MGYH medium to an OD600=3.0 and then induced in MMH medium for 2 days at 28 °C. Cells were harvested and washed in buffer A (50 mM Tris pH8.0, 150 mM NaCl, 1 mM CaCl2), and then frozen and stored at −80 °C until use.
The cells were re-suspended in buffer A and homogenized with an M-110P homogenizer (Microfluidics) for four times at 25,000 psi. Whole cell lysate was centrifuged at 10,000 × g for 10 minutes and the supernatant was subjected to a second round of centrifugation at 40,000 rpm (Beckman type 45 Ti rotor) for 1 hour to pellet the membrane. The membrane fraction was re-suspended in buffer A and homogenized with a glass dounce homogenizer. AtTPC1 was extracted using n-Dodecyl-β-D-Maltopyranoside (DDM) (Anatrace) at a concentration of 1% (w/v), stirring at 4 °C for 3 hours. The supernatant, after extraction, was collected after a 40-minute centrifugation at 48,000 × g at 4 °C and loaded onto a Talon cobalt affinity column (Clontech) followed by a wash of the column with 3 column volumes of buffer A + 0.05 % (w/v) DDM + 20 mM imdazole. The detergent was then exchanged from DDM to 0.05 % (w/v) Lauryl Maltose Neopentyl Glycol (LMNG) (Anatrace) on column by gravity flow. AtTPC1 was released from the column after histidine-tag removal by on-column thrombin digestion (Roche Diagnostics) at 4 °C overnight. The protein eluate was concentrated (100 kD MWKO centrifuge concentrator, Millipore) to 5–10 mg/ml and further purified by size exclusion chromatography (Superdex 200 column, GE Healthcare) in buffer SEC (20 mM Tris pH8.0, 150 mM NaCl, 1 mM CaCl2 and 0.05% (w/v) LMNG). The major peak eluted at around 11.2 ml and was pooled and concentrated to 5–14 mg/ml for crystallization.
To obtain phasing information and to facilitate model building, more than 20 AtTPC1 mutants with a single-cysteine substitution at various parts of the protein were generated using Quickchange Site-Directed Mutagenesis Method (Agilent). All mutants were expressed, purified and crystallized in similar conditions as the wild-type protein. 18 mutant proteins yielded crystals that diffracted X-ray to ~4.0 Å resolution.
Crystallization and data collection
The crystals were grown at 20 °C using conventional sitting drop vapor diffusion methods. Crystals appeared within 1–3 days in a condition consisting of 26% PEG400, 150 mM BaCl2, 100 mM HEPES pH7.0) and grew to their full size (0.1 mm × 0.2 mm × 0.2 mm) within 1–2 weeks. To identify the calcium specific binding sites, crystals were also obtained in solutions containing 22% PEG400, 150 mM NaCl, 1 mM CaCl2, 100 mM HEPES pH7.0, and were used for data collection at longer wavelength (2 Å). For cryo-protection, the PEG400 in the reservoir solution was increased to 38% and crystals were allowed to equilibrate for 1 day before freezing in liquid nitrogen. The mercury-derivatized crystals were obtained by soaking the crystals in 0.5–1.0 mM CH3HgCl for about 12 hours before freezing.
X-ray diffraction data was collected using synchrotron radiation source (Advanced Photon Source 23IDB, 23IDD and 19ID; Advanced Light Source BL8.2.1 and BL8.2.2). The crystal belongs to space group C2221 with cell dimensions of a = 88.4 Å, b = 158.9 Å, c = 217.2 Å, α = β = γ = 90°, and contains one subunit per asymmetric unit. The molecular dyad of a functional channel dimer coincides with the crystallographic dyad. To maximize the anomalous signal, the mercury-derivative data were collected near the mercury absorption edge (λ = 1.0070 Å), and the data of native crystal grown in Ca2+ (without Ba2+) were collected at λ = 2.0000 Å.
Structure determination
The diffraction data was integrated and scaled using the HKL2000 package47. Since the diffraction data were anisotropic, ellipsoidal truncation, anisotropic scaling and B-factor sharpening were applied to the data using two approaches. In the first approach, “auto-correction” function in HKL2000 was applied during the final scaling. Data after auto-correction yielded better experimental maps (Extended Data Figure 9a). However, significant amount of data was discarded in this approach, resulting in a very low completeness at high-resolution shells. This approach was mainly used in the initial phasing and map calculation for model building. The anisotropy server (UCLA) was used in the second approach48. In this approach, the best native data were truncated to1/3.3 Å−1, 1/4.1 Å−1 and 1/3.5 Å−1 along a*, b* and c*, respectively. After anisotropic scaling, an isotropic B-factor of −63.9 Å2 was applied. The data processed in the second approach have higher completeness and were used in the final refinement.
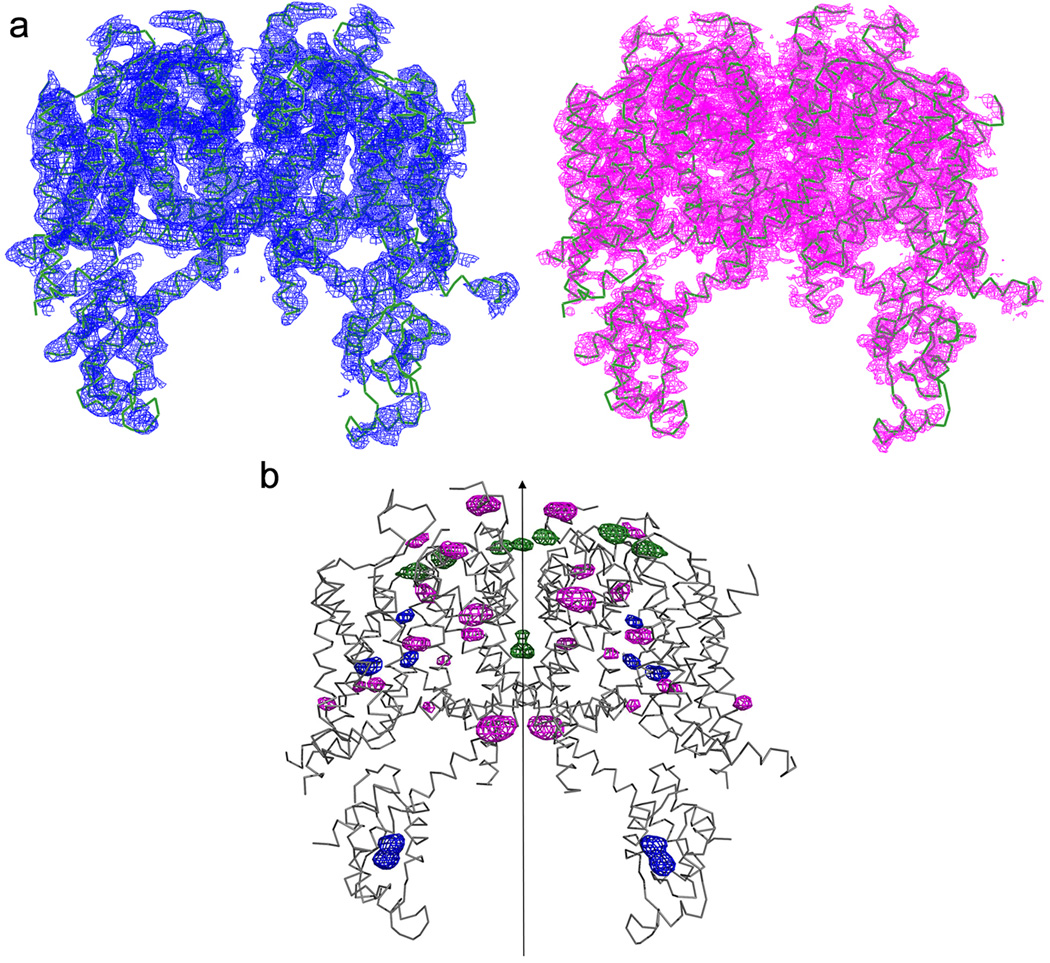
The structure was determined by single isomorphous replacement with anomalous scattering (SIRAS). The native data and the mercury-derivatized A604C mutant data were used to calculate the experimental phases using the AutoSharp Suite49. The heavy atom positions were determined in SHELXD50 and refined in SHARP51,52. The initial phases were improved by solvent flattening with SOLOMON53. The experimental electron density map is of sufficient quality for initial assignment of most helical elements of the channel (Extended Data Fig. 9a). To facilitate accurate model building, we also obtained 14 mutant crystals containing one single-cysteine substitution at various parts of the protein. These mutant crystals were also derivatized by soaking with CH3HgCl, which together with the heavy atom sites from the wild-type crystals, provided unambiguous registry for 20 residues throughout the protein, allowing us to accurately model the structured regions of AtTPC1 (Extended Data Fig. 9b). PHENIX54 and Coot55 were used for the refinement and model building, respectively. As there are several barium ions in the native structure, F(+) and F(−) were separated in the data used for refinement. The final structure was refined to 3.3Å with Rwork of 32.5% and Rfree of 33.2%, and contained residues 32–53, 62–173, 184–402, 415–518, 524–590 and 595–686, covering 84% of the full-length AtTPC1. The geometry of the final structural model was analyzed with Procheck56, giving statistics of 90.2%, 9.6%, 0.2% and 0.0% for the most favored, additional allowed, generously allowed and disallowed regions, respectively, on the Ramachandran plot. The bound Ca2+ ions at EF-1 and the luminal inhibition site were confirmed by calcium anomalous scattering. The anomalous difference Fourier map was calculated from 4 Å resolution X-ray diffraction data collected at 2 Å wavelength using a crystal grown in the absence of Ba2+. The data collection and refinement statistics are listed in Extended Data Table 1. All the structure figures in this paper were prepared with Pymol57.
Electrophysiology
The AtTPC1 open reading frame (ORF) was cloned into SalI/SmaI sites of the pEGFP-C1 vector (Clontech). All single-site mutants were generated using Quikchange Site-Directed Mutagenesis method (Agilent) and confirmed by DNA sequencing. 1–2 µg of the plasmid was transfected into HEK293 cells that were grown as a mono-layer in 35 mm tissue culture dish (to ~70% confluence) using Lipofectamine 2000 (Life Technology). 24–48 hours after transfection, cells were dissociated by trypsin treatment and kept in complete serum-containing medium and re-plated onto 35 mm tissue culture dishes and incubated in a tissue culture incubator until recording. Patch clamp in the whole-cell configuration was employed to measure AtTPC1 current in HEK293 cells expressing GFP-AtTPC1. The standard bath solution contained (in mM): 145 sodium methanesulfonate (Na-MS), 5 NaCl, 10 HEPES buffered with Tris, pH 7.4. The pipette solution contained (in mM): 150 Na-MS, 2.5 MgCl2, 10 HEPES buffered with Tris, pH 7.4. For free Ca2+ concentrations less than 100 µM, a mixture of 5 mM EGTA and certain amount of CaCl2 was prepared to achieve the target free Ca2+ concentration according to MAXCHELATOR (http://maxchelator.stanford.edu). The patch pipettes were pulled from borosilicate glass (Harvard Apparatus) and heat polished to a resistance of 3–5 MΩ. Data was acquired using an AxoPatch 200B amplifier (Molecular Devices) and a low-pass analogue filter set to 1 kHz. The current signal was sampled at a rate of 20 kHz using a Digidata 1322A digitizer (Molecular Devices) and further analyzed with pClamp 9 software (Molecular Devices). After the patch pipette attached to the cell membrane, a giga seal (5–10 GΩ) was formed by gentle suction. The whole cell configuration was formed by short zap or suction to rupture the patch. The holding potential was set to −70 mV. The whole cell current reached a maximum and remained stable within ~5 minutes. The membrane was stepped from the holding potential (−70 mV) to various testing potentials (−100 mV to +100 mV) for 1 second and then returned to the holding potential. The peak tail currents were used to generate G/Gmax-V curves (G=I/V). Gmax in most experiments was obtained from the peak tail current at 100 mV testing potential with the presence of 300 µM [Ca2+]cyt and 0 mM [Ca2+]ext. V1/2 and Z values were obtained from the fits of data with Boltzmann equation. To determine the selectivity of AtTPC1, the membrane potential was stepped to +80 mV for 1 second to fully activate the channels and then switched to various testing potentials (−100 mV to +60 mV). The tail currents were recorded to generate an I-V curve for the determination of the reversal potential. All data points are mean ± SEM (n ≥5).
Extended Data
Extended Data Figure 1. Sequence analysis.
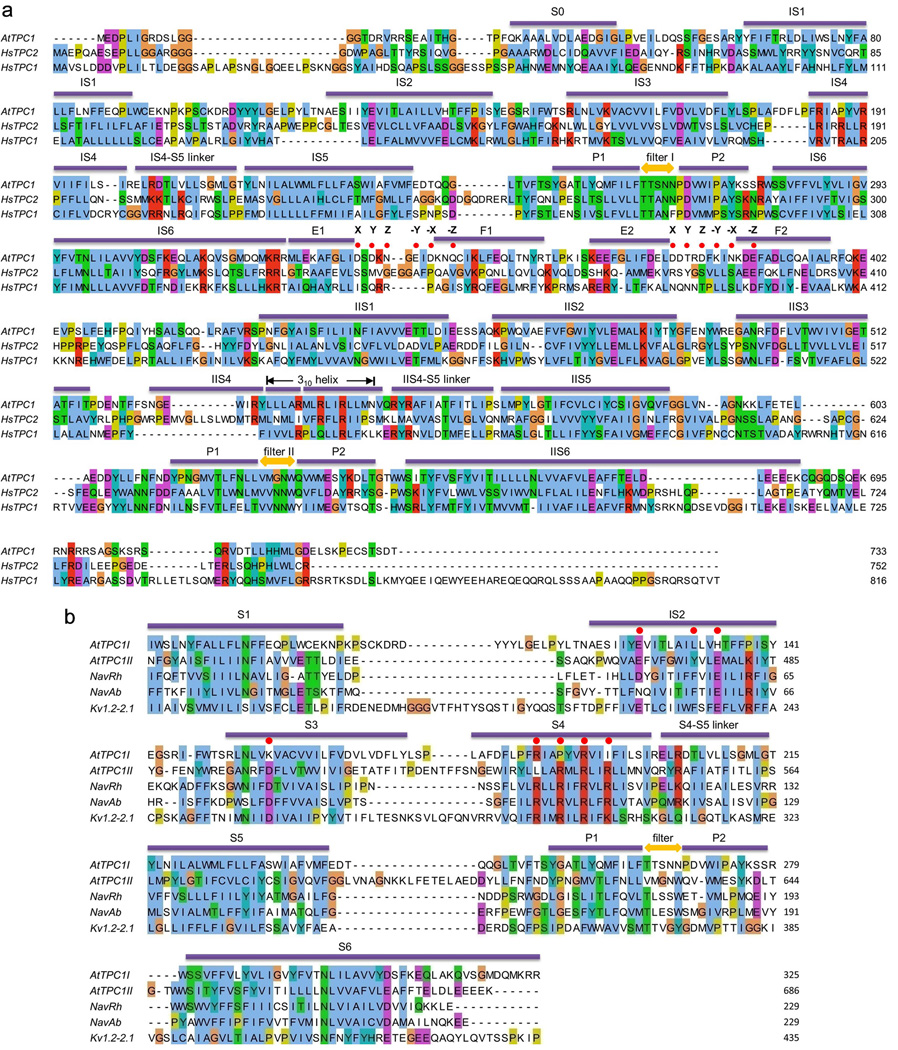
a, Sequence alignment of AtTPC1, human TPC1 (HsTPC1) and TPC2 (HsTPC2). Secondary structure assignments are based on the AtTPC1 structure. Red dots indicate the residues predicted to participate in calcium coordination in EF-hand domain. b, Sequence alignment of the two 6-TM domains of AtTPC1 (AtTPC1I and AtTPC1II), NavRh (PDB: 4DXW), NavAb (PDB: 3RVY) and Kv1.2–2.1 (PDB: 2R9R). Red dots indicate the residues critical for voltage sensing. Secondary structure assignments are based on the AtTPC1 6-TM I structure.
Extended Data Figure 2. Voltage activation and Ba2+ modulation of AtTPC1 over-expressed in HEK cell.
a, Voltage dependent activation of wild-type AtTPC1. Channel currents were recorded using patch clamp in the whole-cell configuration. The membrane was stepped from holding potential (−70 mV) to various testing potentials and then returned to the holding potential. The I–V curve was plotted using the steady peak current against the voltage. The peak tail currents were recorded to generate the G-V curves for voltage activation analysis. b, Extracellular Ba2+ inhibition of AtTPC1. The intracellular solution (pipette) contains 300 µM Ca2+ necessary for channel activation.
Extended Data Figure 3. Structure of AtTPC1 transmembrane region and its alignment with prokaryotic Nav channels.
a, Structure of the individual 6-TM domain of AtTPC1 in rainbow color with the same pore orientation. b, Superposition of AtTPC1 (red) and NavRh (blue, PDB: 4DXW). The NavRh VSDs align well with AtTPC1 VSD1s. c, Superposition of AtTPC1 (red) and NavAb (cyan, PDB: 3RVY). The NavAb VSDs align well with AtTPC1 VSD2s. d, Pore superposition between AtTPC1 (red) and NavRh (blue). e, Pore superposition between AtTPC1 (red) and NavAb (cyan).
Extended Data Figure 4. The ion conduction pore of AtPTC1.
a, Cross sections of surface rendered AtTPC1 pore along IS6 pair (left) and IIS6 pair (right). The channel is closed at the bundle crossing. b, Stereo view of the bundle crossing region from the cytosolic side. c, Partial sequence alignment of the selectivity filters from two pore channels (AtTPC1, HsTPC1 and HsTPC2), bacterial sodium channels (NavRh and NavAb) and human voltage-gated sodium channel Nav1.1. d, Stereo view of the structural alignment between AtTPC1 Filter I (carbon in yellow) and NavAb filter (carbon in cyan). e, Stereo view of structural alignment between AtTPC1 Filter II and NavAb filter. f, Anomalous difference Fourier map of native crystal (green mesh, 4.5 σ level) reveals the bound Ba2+ along the ion conduction pathway. The two cavity sites are likely occupied by a single Ba2+ ion alternatively, as the two sites are only 3 Å apart, too close to accommodate two ions simultaneously.
Extended Data Figure 5. The whole cell currents and G-V curves of AtTPC1 with mutations at the luminal Ba2+ binding sites.
a–d are D454N, D240N, E528Q and E239Q, respectively. The bath solutions contained 0, 0.1, 1, or 10 mM [Ca2+]ext. The pipette solutions contained 300 µM [Ca2+]cyt. Data measured in 0.1 mM [Ca2+]ext are shown in the main text Fig. 4e.
Extended Data Figure 6. Functional analysis of AtTPC1 mutants.
a, The whole cell currents of AtTPC1 containing EF-hand Ca2+ site mutations (D335A in EF-1 and D376A in EF-2). Currents were recorded with the presence of 300 µM [Ca2+]cyt. b, Whole cell currents and G-V Curves of AtTPC1 neutralization mutations of arginines on IS4 and IIS4 of the voltage sensing domains.
Extended Data Figure 7. Structural comparison between AtTPC1_VSD2, NavAb_VSD (PDB: 3RVY) and Kv1.2–2.1_VSD (PDB: 2R9R).
All structures are aligned at the gating charge transfer center and S1 helices are removed for clarity. The side chains of the voltage-sensing arginines in S4, residues in gating charge transfer center and the conserved acidic residue in S2 are shown in stick model. Voltage sensing residues in gating charge transfer center are labeled in red. Lower panels are cross sections of surface rendered AtTPC1 VSD2 (left) and NavAb VSD (right) with S4 gating charge arginines in blue. NavAb VSD is rotated by 90° to visualize the external aqueous cavity.
Extended Data Figure 8. Proposed model for AtTPC1 activation.
a, The model of AtTPC1 6-TM II in voltage-activated state is generated based on the structural comparison between AtTPC1 and NavAb. Only IIS4, IIS4–S5 linker and IIS6 are considered as the moving parts, assuming IIS6 moves concurrently with IIS4–S5 linker. The moving parts are colored red for resting state and blue for activated state. The rest of the protein is colored in grey. Green arrows indicate the directions of the movement at N-terminus, middle part, and C-terminus of IIS4, and at IIS4–S5 linker and C-terminus of IIS6. Dashed arrow indicates the central axis of the channel. b, Cytosolic view of the channel opening mechanism. Compared with the closed state (red), membrane depolarization and calcium binding to EF hand domain lead to the opening of IIS6 and IS6 (modeled in blue), respectively.
Extended Data Figure 9. Structure determination of AtTPC1.
a, Experimental electron density maps superposed with the final refined model. Density in blue (left) is the experimental SIRAS map calculated from the native and Hg-derivative data without anisotropic truncation and B-factor sharpening. Density in magenta (right) is the experimental SIRAS map calculated from the same native and Hg-derivative data after anisotropic truncation and B-factor sharpening using ‘auto correction’ in HKL2000. This map provides much better structural features, i.e. side chains. All maps are contoured at 1.5 σ level. b, Anomalous difference Fourier maps of Hg-derivatized native and mutant crystals superposed on the final refined model. The blue density peaks indicate the positions of Hg bound to the native cysteine residues. The magenta density peaks indicate the positions of Hg bound to cysteine residues introduced into various part of the protein (single-cysteine mutants). The green density peaks are calculated from the wild-type crystal (no Hg soaking), indicating the barium positions in wild type AtTPC1. All maps are contoured at 4 σ. Total 20 residues in each subunit are accurately registered by the mercury sites. Arrow indicates the central two-fold axis of the channel
Extended Data Table 1.
Data collection and refinement statistics.
| Dataset | Native | A604C_Hg | Ca_2Aa |
|---|---|---|---|
| Data collection | |||
| Space group | C2221 | C2221 | C2221 |
| Cell dimensions | |||
| a, b, c (Å) | 88.44, 158.85, 217.24 | 88.57, 158.19, 217.03 | 88.10, 151.00, 214.91 |
| α, β, γ, (°) | 90, 90, 90 | 90, 90, 90 | 90, 90, 90 |
| Wavelength (Å) | 1.0332 | 1.0070 | 2.0000 |
| Resolution (Å) | 50.00-3.30 (3.36-3.30)b | 50.00-3.30 (3.36-3.30) | 50.00-4.00 (4.07-4.00) |
| Rmerge | 0.060 (0.809) | 0.052 (>1.000) | 0.051 (0.302) |
| CC1/2 | (0.924) | (0.878) | (0.927) |
| I/σ | 36.1 (1.6) | 24.4 (0.9) | 25.4 (2.0) |
| Completeness (%) | 96.2 (78.2) | 94.7 (74.4) | 81.8 (58.7) |
| Redundancy | 6.5 (5.2) | 5.5 (4.5) | 6.4 (3.8) |
| Refinement | |||
| Resolution (Å) | 33* 4.1* 3.5c | ||
| No. reflections | 34119 | ||
| Rwork/Rfreed | 0.3247/0.3321 | ||
| No. atoms | |||
| Protein | 4949 | ||
| Ligand/ion | 11 | ||
| Water | 4 | ||
| B-factors | |||
| Protein | 91.12 | ||
| Ligand/ion | 120.39 | ||
| Water | 55.33 | ||
| R.m.s deviations | |||
| Bond lengths (Å) | 0.006 | ||
| Bond angles (°) | 0.854 |
The crystal was grown in 1 mM CaCl2 and no barium; the data was collected at 2 Å wavelength to maximize the calcium anomalous signal.
The numbers in the parentheses show the values in the highest resolution shell.
The data was elliptically truncated to 3.3 * 4.1 * 3.5 Å along a*, b*, and c*.
Rfree was calculated with 5% of reflection data.
Acknowledgments
We thank N. Nguyen for manuscript preparation, R. Hedrich at University of Würzburg and M. X. Zhu at University of Texas Health Science Center at Houston for providing clones of plant and animal TPC genes. The experimental results reported in this article derive from work performed at Argonne National Laboratory, Structural Biology Center (19ID) and GM/CA (23ID) at the Advanced Photon Source, and from work performed at the Berkeley Center for Structural Biology at the Advanced Light Source (ALS). Argonne is operated by UChicago Argonne, LLC, for the U.S. Department of Energy, Office of Biological and Environmental Research under contract DE-AC02-06CH11357. The Berkeley Center for Structural Biology is supported in part by the National Institutes of Health, National Institute of General Medical Sciences, and the Howard Hughes Medical Institute. The Advanced Light Source is supported by the Director, Office of Science, Office of Basic Energy Sciences, of the U.S. Department of Energy under Contract No. DE-AC02-05CH11231. This work was supported in part by the Howard Hughes Medical Institute and by grants from the National Institute of Health (GM079179 to Y. J.; NS055293 and NS074257 to D.R.) and the Welch Foundation (Grant I-1578 to Y. J.).
Footnotes
The authors declare no competing financial interests.
Author Contributions J.G. performed the structure determination; W.Z., C.C. and D.R. performed electrophysiology; Q.C., C.L., L.C and Y.Y. participated in sample preparation; J.G., W.Z. and Y.J. designed the research, analyzed data, and prepared the manuscript.
The atomic coordinates and structure factors have been deposited in the Protein Data Bank under accession number 5E1J.
References
- 1.Peiter E, et al. The vacuolar Ca2+-activated channel TPC1 regulates germination and stomatal movement. Nature. 2005;434:404–408. doi: 10.1038/nature03381. [DOI] [PubMed] [Google Scholar]
- 2.Calcraft PJ, et al. NAADP mobilizes calcium from acidic organelles through two-pore channels. Nature. 2009;459:596–600. doi: 10.1038/nature08030. [DOI] [PMC free article] [PubMed] [Google Scholar]
- 3.Hedrich R, Marten I. TPC1-SV channels gain shape. Mol Plant. 2011;4:428–441. doi: 10.1093/mp/ssr017. [DOI] [PubMed] [Google Scholar]
- 4.Xu H, Ren D. Lysosomal physiology. Annu Rev Physiol. 2015;77:57–80. doi: 10.1146/annurev-physiol-021014-071649. [DOI] [PMC free article] [PubMed] [Google Scholar]
- 5.Rahman T, et al. Two-pore channels provide insight into the evolution of voltage-gated Ca2+ and Na+ channels. Science Signaling. 2014;7:ra109. doi: 10.1126/scisignal.2005450. [DOI] [PMC free article] [PubMed] [Google Scholar]
- 6.Papazian DM, Schwarz TL, Tempel BL, Jan YN, Jan LY. Cloning of genomic and complementary DNA from Shaker, a putative potassium channel gene from Drosophila. Science. 1987;237:749–753. doi: 10.1126/science.2441470. [DOI] [PubMed] [Google Scholar]
- 7.Ishibashi K, Suzuki M, Imai M. Molecular cloning of a novel form (two-repeat) protein related to voltage-gated sodium and calcium channels. Biochem Biophys Res Commun. 2000;270:370–376. doi: 10.1006/bbrc.2000.2435. [DOI] [PubMed] [Google Scholar]
- 8.Brailoiu E, et al. Essential requirement for two-pore channel 1 in NAADP-mediated calcium signaling. J Cell Biol. 2009;186:201–209. doi: 10.1083/jcb.200904073. [DOI] [PMC free article] [PubMed] [Google Scholar]
- 9.Zong X, et al. The two-pore channel TPCN2 mediates NAADP-dependent Ca2+-release from lysosomal stores. Eur J Physiol. 2009;458:891–899. doi: 10.1007/s00424-009-0690-y. [DOI] [PMC free article] [PubMed] [Google Scholar]
- 10.Wang X, et al. TPC proteins are phosphoinositide- activated sodium-selective ion channels in endosomes and lysosomes. Cell. 2012;151:372–383. doi: 10.1016/j.cell.2012.08.036. [DOI] [PMC free article] [PubMed] [Google Scholar]
- 11.Cang C, et al. mTOR regulates lysosomal ATP-sensitive two-pore Na+ channels to adapt to metabolic state. Cell. 2013;152:778–790. doi: 10.1016/j.cell.2013.01.023. [DOI] [PMC free article] [PubMed] [Google Scholar]
- 12.Cang C, Bekele B, Ren D. The voltage-gated sodium channel TPC1 confers endolysosomal excitability. Nat Chem Biol. 2014;10:463–469. doi: 10.1038/nchembio.1522. [DOI] [PubMed] [Google Scholar]
- 13.Jha A, Ahuja M, Patel S, Brailoiu E, Muallem S. Convergent regulation of the lysosomal two-pore channel-2 by Mg2+, NAADP, PI(3,5)P2 and multiple protein kinases. EMBO J. 2014;33:501–511. doi: 10.1002/embj.201387035. [DOI] [PMC free article] [PubMed] [Google Scholar]
- 14.Pitt SJ, Lam AK, Rietdorf K, Galione A, Sitsapesan R. Reconstituted human TPC1 is a proton-permeable ion channel and is activated by NAADP or Ca2+ . Sci Signal. 2014;7:ra46. doi: 10.1126/scisignal.2004854. [DOI] [PMC free article] [PubMed] [Google Scholar]
- 15.Ruas M, et al. Expression of Ca2+-permeable two-pore channels rescues NAADP signalling in TPC-deficient cells. EMBO J. 2015;34:1743–1758. doi: 10.15252/embj.201490009. [DOI] [PMC free article] [PubMed] [Google Scholar]
- 16.Sakurai Y, et al. Ebola virus. Two-pore channels control Ebola virus host cell entry and are drug targets for disease treatment. Science. 2015;347:995–998. doi: 10.1126/science.1258758. [DOI] [PMC free article] [PubMed] [Google Scholar]
- 17.Furuichi T, et al. A putative two pore channel AtTPC1 mediates Ca2+ flux Arabidopsis leaf cells. Plant Cell Physiol. 2001;42:900–905. doi: 10.1093/pcp/pce145. [DOI] [PubMed] [Google Scholar]
- 18.Hedrich R, Neher E. Cytoplasmic calcium regulates voltage-dependent ion channels. Nature. 1987;329:833–836. [Google Scholar]
- 19.Amodeo G, Escobar A, Zeiger E. A Cationic Channel in the Guard Cell Tonoplast of Allium cepa. Plant Physiol. 1994;105:999–1006. doi: 10.1104/pp.105.3.999. [DOI] [PMC free article] [PubMed] [Google Scholar]
- 20.Ward JM, Schroeder JI. Calcium-activated K+ channels and calcium-induced calcium release by slow vacuolar ion channels in guard cell vacuoles implicated in the control of stomatal closure. The Plant Cell. 1994;6 doi: 10.1105/tpc.6.5.669. [DOI] [PMC free article] [PubMed] [Google Scholar]
- 21.Schulze C, Sticht H, Meyerhoff P, Dietrich P. Differential contribution of EF-hands to the Ca2+-dependent activation in the plant two-pore channel TPC1. The Plant Journal. 2011;68:424–432. doi: 10.1111/j.1365-313X.2011.04697.x. [DOI] [PubMed] [Google Scholar]
- 22.Dadacz-Narloch B, et al. A novel calcium binding site in the slow vacuolar cation channel TPC1 senses luminal calcium levels. Plant Cell. 2011;23:2696–2707. doi: 10.1105/tpc.111.086751. [DOI] [PMC free article] [PubMed] [Google Scholar]
- 23.Bonaventure G, et al. A gain-of-function allele of TPC1 activates oxylipin biogenesis after leaf wounding in Arabidopsis. Plant J. 2007;49:889–898. doi: 10.1111/j.1365-313X.2006.03002.x. [DOI] [PubMed] [Google Scholar]
- 24.Bonaventure G, Gfeller A, Rodriguez VM, Armand F, Farmer EE. The fou2 gain-of-function allele and the wild-type allele of Two Pore Channel 1 contribute to different extents or by different mechanisms to defense gene expression in Arabidopsis. Plant Cell Physiol. 2007;48:1775–1789. doi: 10.1093/pcp/pcm151. [DOI] [PubMed] [Google Scholar]
- 25.Choi WG, Toyota M, Kim SH, Hilleary R, Gilroy S. Salt stress-induced Ca2+ waves are associated with rapid, long-distance root-to-shoot signaling in plants. Proc Natl Acad Sci U S A. 2014;111:6497–6502. doi: 10.1073/pnas.1319955111. [DOI] [PMC free article] [PubMed] [Google Scholar]
- 26.Payandeh J, Scheuer T, Zheng N, Catterall WA. The crystal structure of a voltage-gated sodium channel. Nature. 2011;475:353–358. doi: 10.1038/nature10238. [DOI] [PMC free article] [PubMed] [Google Scholar]
- 27.Zhang X, et al. Crystal structure of an orthologue of the NaChBac voltage-gated sodium channel. Nature. 2012;486:130–134. doi: 10.1038/nature11054. [DOI] [PMC free article] [PubMed] [Google Scholar]
- 28.Larisch N, Schulze C, Galione A, Dietrich P. An N-terminal dileucine motif directs two-pore channels to the tonoplast of plant cells. Traffic. 2012;13:1012–1022. doi: 10.1111/j.1600-0854.2012.01366.x. [DOI] [PubMed] [Google Scholar]
- 29.Takeshita K, et al. X-ray crystal structure of voltage-gated proton channel. Nat Struct mol Biol. 2014;21:352–357. doi: 10.1038/nsmb.2783. [DOI] [PubMed] [Google Scholar]
- 30.Tao X, Lee A, Limapichat W, Dougherty DA, MacKinnon R. A gating charge transfer center in voltage sensors. Science. 2010;328:67–73. doi: 10.1126/science.1185954. [DOI] [PMC free article] [PubMed] [Google Scholar]
- 31.Long SB, Tao X, Campbell EB, MacKinnon R. Atomic structure of a voltage-dependent K+ channel in a lipid membrane-like environment. Nature. 2007;450:376–382. doi: 10.1038/nature06265. [DOI] [PubMed] [Google Scholar]
- 32.Vieira-Pires RS, Morais-Cabral JH. 310 helices in channels and other membrane proteins. J Gen Physiol. 2010;136:585–592. doi: 10.1085/jgp.201010508. [DOI] [PMC free article] [PubMed] [Google Scholar]
- 33.Armstrong CM, Bezanilla F. Charge movement associated with the opening and closing of the activation gates of the Na channels. J Gen Physiol. 1974;63:533–552. doi: 10.1085/jgp.63.5.533. [DOI] [PMC free article] [PubMed] [Google Scholar]
- 34.Seoh SA, Sigg D, Papazian DM, Bezanilla F. Voltage-sensing residues in the S2 and S4 segments of the Shaker K+ channel. Neuron. 1996;16:1159–1167. doi: 10.1016/s0896-6273(00)80142-7. [DOI] [PubMed] [Google Scholar]
- 35.Aggarwal SK, MacKinnon R. Contribution of the S4 segment to gating charge in the Shaker K+ channel. Neuron. 1996;16:1169–1177. doi: 10.1016/s0896-6273(00)80143-9. [DOI] [PubMed] [Google Scholar]
- 36.Schoppa NE, McCormack K, Tanouye MA, Sigworth FJ. The size of gating charge in wild-type and mutant Shaker potassium channels. Science. 1992;255:1712–1715. doi: 10.1126/science.1553560. [DOI] [PubMed] [Google Scholar]
- 37.Clayton GM, Altieri S, Heginbotham L, Unger VM, Morais-Cabral JH. Structure of the transmembrane regions of a bacterial cyclic nucleotide-regulated channel. Proc Natl Acad Sci U S A. 2008;105:1511–1515. doi: 10.1073/pnas.0711533105. [DOI] [PMC free article] [PubMed] [Google Scholar]
- 38.Larsson HP, Baker OS, Dhillon DS, Isacoff EY. Transmembrane movement of the Shaker K+ channel S4. Neuron. 1996;16:387–397. doi: 10.1016/s0896-6273(00)80056-2. [DOI] [PubMed] [Google Scholar]
- 39.Jiang Y, Ruta V, Chen J, Lee A, MacKinnon R. The principle of gating charge movement in a voltage-dependent K+ channel. Nature. 2003;423:42–48. doi: 10.1038/nature01581. [DOI] [PubMed] [Google Scholar]
- 40.Ruta V, Chen J, MacKinnon R. Calibrated measurement of gating-charge arginine displacement in the KvAP voltage-dependent K+ channel. Cell. 2005;123:463–475. doi: 10.1016/j.cell.2005.08.041. [DOI] [PubMed] [Google Scholar]
- 41.Li Q, et al. Structural mechanism of voltage-dependent gating in an isolated voltage-sensing domain. Nat Struct Mol Biol. 2014;21:244–252. doi: 10.1038/nsmb.2768. [DOI] [PMC free article] [PubMed] [Google Scholar]
- 42.Jiang Y, et al. X-ray structure of a voltage-dependent K+ channel. Nature. 2003;423:33–41. doi: 10.1038/nature01580. [DOI] [PubMed] [Google Scholar]
- 43.Xu YP, Ramu Y, Lu Z. A Shaker K+ channel with a miniature engineered voltage sensor. Cell. 2010;142:580–589. doi: 10.1016/j.cell.2010.07.013. [DOI] [PMC free article] [PubMed] [Google Scholar]
- 44.Bezanilla F. Voltage sensor movements. J Gen Physiol. 2002;120:465–473. doi: 10.1085/jgp.20028660. [DOI] [PMC free article] [PubMed] [Google Scholar]
- 45.Gandhi CS, Isacoff EY. Molecular models of voltage sensing. J Gen Physiol. 2002;120:455–463. doi: 10.1085/jgp.20028678. [DOI] [PMC free article] [PubMed] [Google Scholar]
- 46.Horn R. Coupled movements in voltage-gated ion channels. J Gen Physiol. 2002;120:449–453. doi: 10.1085/jgp.20028658. [DOI] [PMC free article] [PubMed] [Google Scholar]
Methods References
- 47.Otwinowski Z, Minor W. Processing of X-ray Diffraction Data Collected in Oscillation Mode. Methods Enzymol. 1997;276(part A):307–326. doi: 10.1016/S0076-6879(97)76066-X. Macromolecular Crystallography. [DOI] [PubMed] [Google Scholar]
- 48.Strong M, et al. Toward the structural genomics of complexes: crystal structure of a PE/PPE protein complex from Mycobacterium tuberculosis. Proc Natl Acad Sci U S A. 2006;103:8060–8065. doi: 10.1073/pnas.0602606103. [DOI] [PMC free article] [PubMed] [Google Scholar]
- 49.Vonrhein C, Blanc E, Roversi P, Bricogne G. Automated structure solution with autoSHARP. Methods Mol Biol. 2007;364:215–230. doi: 10.1385/1-59745-266-1:215. [DOI] [PubMed] [Google Scholar]
- 50.Schneider TR, Sheldrick GM. Substructure solution with SHELXD. Acta Crystallogr D Biol Crystallogr. 2002;58:1772–1779. doi: 10.1107/s0907444902011678. [DOI] [PubMed] [Google Scholar]
- 51.Fortelle Edl, Bricogne G. Maximum-likelihood heavy-atom parameter refinement for multiple isomorphous replacement and multiwavelength anomalous diffraction methods. Methods Enzymol. 1997;276(part A):472–494. doi: 10.1016/S0076-6879(97)76073-7. Macromolecular Crystallography. [DOI] [PubMed] [Google Scholar]
- 52.Bricogne G, Vonrhein C, Flensburg C, Schiltz M, Paciorek W. Generation, representation and flow of phase information in structure determination: recent developments in and around SHARP 2.0. Acta Crystallogr D Biol Crystallogr. 2003;59:2023–2030. doi: 10.1107/s0907444903017694. [DOI] [PubMed] [Google Scholar]
- 53.Abrahams JP, Leslie AGW. Methods used in the structure determination of bovine mitochondrial F1_ATPase. Acta Crystallogr D Biol Crystallogr. 1996;52:30–42. doi: 10.1107/S0907444995008754. [DOI] [PubMed] [Google Scholar]
- 54.Adams PD, et al. PHENIX: a comprehensive Python-based system for macromolecular structure solution. Acta Crystallogr D Biol Crystallogr. 2010;66:213–221. doi: 10.1107/S0907444909052925. [DOI] [PMC free article] [PubMed] [Google Scholar]
- 55.Emsley P, Lohkamp B, Scott WG, Cowtan K. Features and development of Coot. Acta Crystallogr D Biol Crystallogr. 2010;66:486–501. doi: 10.1107/S0907444910007493. [DOI] [PMC free article] [PubMed] [Google Scholar]
- 56.Laskowski RA, MacArthur MW, Moss DS, Thornton JM. PROCHECK: a program to check the stereochemical quality of protein structures. J. Appl. Cryst. 1993;26:283–291. [Google Scholar]
- 57.The PyMOL Molecular Graphics System, Version 1.7.4. Schrödinger: LLC; [Google Scholar]


