

Abstract
Objective
Genome-wide association (GWA) studies have identified multiple genetic variants affecting the risk of coronary artery disease (CAD). However, individually these explain only a small fraction of the heritability of CAD and for most, the causal biological mechanisms remain unclear. We sought to obtain further insights into potential causal processes of CAD by integrating large-scale GWA data with expertly curated databases of core human pathways and functional networks.
Approaches and Results
Employing pathways (gene sets) from Reactome, we carried out a two-stage gene set enrichment analysis strategy. From a meta-analyzed discovery cohort of 7 CADGWAS data sets (9,889 cases/11,089 controls), nominally significant gene-sets were tested for replication in a meta-analysis of 9 additional studies (15,502 cases/55,730 controls) from the CARDIoGRAM Consortium. A total of 32 of 639 Reactome pathways tested showed convincing association with CAD (replication p<0.05). These pathways resided in 9 of 21 core biological processes represented in Reactome, and included pathways relevant to extracellular matrix integrity, innate immunity, axon guidance, and signaling by PDRF, NOTCH, and the TGF-β/SMAD receptor complex. Many of these pathways had strengths of association comparable to those observed in lipid transport pathways. Network analysis of unique genes within the replicated pathways further revealed several interconnected functional and topologically interacting modules representing novel associations (e.g. semaphorin regulated axonal guidance pathway) besides confirming known processes (lipid metabolism). The connectivity in the observed networks was statistically significant compared to random networks (p<0.001). Network centrality analysis (‘degree’ and ‘betweenness’) further identified genes (e.g. NCAM1, FYN, FURIN etc.) likely to play critical roles in the maintenance and functioning of several of the replicated pathways.
Conclusions
These findings provide novel insights into how genetic variation, interpreted in the context of biological processes and functional interactions among genes, may help define the genetic architecture of CAD.
Keywords: GWAS, coronary artery disease, pathway analysis, network analysis
Introduction
Meta-analysis of genome-wide association studies (GWAS) involving tens of thousands of subjects have provided a wealth of new information on the genetic basis of coronary artery disease (CAD), yet common susceptibility variants with achieved genome-wide significance explain only a small fraction of the heritability of CAD (∼10.6%)1, 2. It has been proposed that much of the residual genetic risk may be attributable to rare variants with large effect3, 4. However, recent simulation, exome sequencing, and fine mapping studies of established GWAS loci support the hypothesis that joint contributions from common variants with modest effects are likely to account for a sizeable fraction of the missing heritability of complex diseases5-7.
It is likely that many more common variants are linked to CAD but have not achieved genome-wide significance in GWAS because of small effect size and/or lower allele frequency and insufficient sample size. However, based on the premise that clinically informative polymorphisms related to complex disease occur in systems of closely interacting genes8, even weakly associated variants may provide important information regarding the biological basis of disease when such variants cluster within a common functional module or pathway. One common approach for pathway-based analysis of genomic data is gene-set enrichment analysis (GSEA), originally developed and extensively utilized for the analysis of gene expression data9. In 2007, Wang et al.10 described a modified version of the GSEA, designed to analyze genome-wide SNP associations rather than gene expression data. Since then, several other GSEA methods have been developed for this purpose11-15. The common goal of these analytic algorithms is to identify a subset of genes whose variants collectively demonstrate strong association with a trait of interest even if the component SNPs individually exhibit relatively modest or non-significant association. Importantly, pathway analysis can also place the set of validated SNPs for a trait of interest into a broader and clearer biologic context. A natural extension of this list-based pathway approach is the interrogation of molecular networks to unravel the architecture underlying complex diseases. A molecular network is based on ‘interactions’ among biomolecules (genes, protein, metabolites, etc.), where such interactions can take various forms (protein-protein interactions, coexpression, gene regulation, functional interactions, etc.). Efforts at the characterization of disease-associated genes reveal that genes associated with the same or similar disorders tend to occupy similar neighborhoods in molecular networks through physical or functional modules16, 17. Furthermore, the study of network topology suggests that key disease-related genes differ from other genes in terms of their network connectivity and network centrality properties17. Finally, molecular networks provide two distinct enhancements over traditional pathway based approach – (i) they provide additional information on interactions among gene subsets within a given pathway, and (ii) they allow for the identification of interactions between components of different biological pathways. Through these analyses, one is able to draw a clearer picture of the functional connectivities that influence pathway functions, and how multiple pathways may interact with one another to influence a phenotype.
Several studies have applied molecular networks for generating insights from GWAS data8, 18-20 in disorders such as schizophrenia, multiple sclerosis and prostate cancer. However, most of these approaches have relied mainly on protein-protein interaction networks, thereby missing the rich mechanistic information available from traditional biological pathway repositories and networks based on functional interactions. In this study, we have coupled the advantages of a well curated biological pathway repository with a similarly curated functional interaction network to identify mechanism-based processes that may underlie the genetic architecture of CAD. First, to identify novel associations between established biological mechanisms and CAD, we have carried out a two-stage pathway-based GSEA analysis of sixteen GWAS data sets for CAD using the i-GSEA4GWAS tool15 and the Reactome pathway database21. Collectively, these GWAS include over 25,000 subjects with CAD and over 66,000 controls. We have then taken the replicated pathways as a starting point to explore functional interactions within and between pathways via interrogation of molecular interacting networks. Lastly, we have characterized the CAD-associated genes based on their topological properties within these networks as a way of prioritizing gene candidates for functional follow-up studies.
Materials and Methods
Materials and Methods are available in the online-only Data Supplement. Briefly, employing pathways (gene sets) from Reactome, we first carried out a two-stage gene set enrichment analysis strategy. From a meta-analyzed discovery cohort of 7 CAD GWAS data sets (9,889 cases/11,089 controls), nominally significant gene-sets were tested for replication in a meta-analysis of 9 additional studies (15,502 cases/55,730 controls) from the CARDIoGRAM Consortium (Table 1). Genes from the replicated pathways were then mapped onto well-curated interaction networks.
Table 1. Demographics of Discovery & Replication Cohorts.
| GWAS Data Set | Number Cases/controls | Age (mean±SD) Cases/controls | % male Cases/controls | % MI cases |
|---|---|---|---|---|
| Stage 1 Studies | ||||
| OHGS_A | 921/994 | 48.2±7.0/74.9±4.9 | 78.1/54.6 | 54.6 |
| OHGS_CCGB-B | 2,688/1,819 | 49.8±7.7/74.8±5.4 | 75.1/49.0 | 59.8 |
| DUKE_2 | 1,200/648 | 56.7±9.7/63.3±8.7 | 69.4/42.0 | 48.0 |
| GerMIFs I | 875/1,644 | 50.2±7.8/62.6±10.0 | 50.6/49.2 | 100 |
| GerMIFs II | 1,222/1,298 | 51.4±7.5/51.2±11.9 | 66.9/51.7 | 100 |
| GerMIFs III (KORA) | 1,157/1,748 | 58.6±8.7/55.9±10.7 | 79.9/51.1 | 100 |
| WTCCC | 1,926/2,938 | 49.8±7.7/N/A | 79.3/50.0 | 71.5 |
| Total Stage 1 | 9,889/11,089 | |||
| Stage 2 Studies | ||||
| ADVANCE | 278/312 | 45.8±6.2/45.3±5.7 | 42.1/41.0 | 50.4 |
| CADomics | 2,078/2,952 | 60.8±10.1/55.3±10.8 | 78.1/49.5 | 58.3 |
| CHARGE | 2,287/22,024 | 60.0±7.9/63.1±8.0 | 66.6/40.4 | 48.0 |
| deCODE CAD | 6,640/27,611 | 74.8±11.8/53.7±21.5 | 63.7/38.1 | 54.7 |
| LURIC/AtheroRemo 1 | 652/213 | 61.0±11.8/58.3±12.1 | 79.7/54.0 | 71.9 |
| LURIC/ AtheroRemo 2 | 486/296 | 63.7±9.4/56.4±12.7 | 76.6/51.4 | 79.0 |
| MedStar | 874/447 | 48.9±6.4/59.7±8.9 | 67.0/45.4 | 48.1 |
| MIGen | 1,274/1,407 | 42.4±6.6/43.0±7.8 | 62.8/60.1 | 100 |
| PennCATH | 933/468 | 52.7±7.6/61.7±9.6 | 76.3/48.1 | 50.3 |
| Total Stage 2 | 12,501/55,730 | |||
| Total Stage 1 & 2 | 25,491/66,819 |
Results
Significant Pathways
A total of 85 out of the 639 Reactome pathways tested in Stage 1 achieved a gene set enrichment p-value < 0.05 at a false discovery rate <0.25. Thirty two out of these 85 pathways were further replicated in Stage 2 at a nominal p<0.05 (Table 2). When the replicated pathways were compared to the full pathway content of Reactome, at least one replicated from 9 of the 21 core Reactome-defined biological processes. These included the core processes of ‘metabolism’, ‘signal transduction’, ‘developmental biology’, ‘extracellular matrix organization’, ‘immune system’, ‘metabolism of proteins’, ‘cell-cell communication’, ‘transmembrane transport of small molecules’, and ‘gene expression’ (Figure 2). Due to the hierarchical organization of Reactome pathways, several replicated pathways were nested within larger gene sets, either completely or partially (Figure SII, online-only Data Supplement). This hierarchical structure enabled us to identify instances of pathway selectivity – for example, although the ‘CRMPS in SEMA3A signaling’, ‘Sema4D in semaphorin signaling’ and ‘Sema3A PAK dependent axon repulsion’ pathways all nested completely within the ‘Semaphorin Interactions’ pathway, only the former was significantly replicated (p<0.001) whereas the latter two pathways were not. In order to put the identified pathways in a broader context, we have also listed the non-replicated pathways that share similar levels of hierarchy as the replicated pathways in Table SI (online-only Data Supplement).
Table 2.
List of replicated Reactome pathways enriched for genetic association to CAD. Pathway names are listed in column 1; column 2 lists the nominal p-value for pathway enrichment; column 3 lists the corresponding false discovery rates (FDR); column 4 records the number of genes in each pathway.
| Reactome Pathway | Enrichment p-value | FDR | # genes/ pathway |
|---|---|---|---|
| CHYLOMICRON_MEDIATED_LIPID_TRANSPORT | <0.001 | 0.000 | 16 |
| CRMPS_IN_SEMA3A_SIGNALING | <0.001 | 0.000 | 14 |
| DEGRADATION_OF_THE_EXTRACELLULAR_MATRIX | <0.001 | 0.000 | 29 |
| LIPID_DIGESTION_MOBILIZATION_AND_TRANSPORT | <0.001 | 0.000 | 46 |
| LIPOPROTEIN_METABOLISM | <0.001 | 0.000 | 28 |
| METABOLISM_OF_POLYAMINES | <0.001 | 0.000 | 15 |
| NOTCH1_INTRACELLULAR_DOMAIN_REGULATES_TRANSCRIPTION | <0.001 | 0.000 | 46 |
| SULFUR_AMINO_ACID_METABOLISM | <0.001 | 0.000 | 24 |
| TOLL_RECEPTOR_CASCADES | <0.001 | 0.000 | 118 |
| ORGANIC_CATION_ANION_ZWITTERION_TRANSPORT | <0.001 | 0.001 | 13 |
| SMAD2_SMAD3_SMAD4_HETEROTRIMER_REGULATES_TRANSCRIPTION | <0.001 | 0.001 | 27 |
| NOTCH_HLH_TRANSCRIPTION_PATHWAY | <0.001 | 0.002 | 13 |
| EXTRACELLULAR_MATRIX_ORGANIZATION | <0.001 | 0.003 | 87 |
| HS_GAG_BIOSYNTHESIS | <0.001 | 0.003 | 31 |
| PTM_GAMMA_CARBOXYLATION_HYPUSINE_FORMATION_AND_ARYLSULFASE_ACTIVATION_ACTIVATION | <0.001 | 0.004 | 27 |
| SIGNALING_BY_NOTCH | 0.003 | 0.005 | 70 |
| TRANSCRIPTIONAL_ACTIVITY_OF_SMAD2_SMAD3_SMAD4_HETEROTRIMER | 0.001 | 0.005 | 38 |
| SIGNALING_BY_PDGF | 0.003 | 0.017 | 122 |
| SIGNALING_BY_NOTCH | 0.007 | 0.019 | 103 |
| G_BETA_GAMMA_SIGNALING_THROUGH_PI3KGAMMA | 0.002 | 0.020 | 25 |
| HEPARAN_SULFATE_HEPARIN_HS_GAG_METABOLISM | 0.004 | 0.020 | 52 |
| NCAM_SIGNALING_FOR_NEURITE_OUT_GROWTH | 0.003 | 0.022 | 64 |
| SIGNALING_BY_TGF_BETA_RECEPTOR_COMPLEX | 0.007 | 0.033 | 63 |
| PI3K_AKT_ACTIVATION | 0.014 | 0.048 | 38 |
| PPARA_ACTIVATES_GENE_EXPRESSION | 0.014 | 0.048 | 104 |
| HDL_MEDIATED_LIPID_TRANSPORT | 0.016 | 0.052 | 15 |
| NUCLEAR_RECEPTOR_TRANSCRIPTION_PATHWAY | 0.022 | 0.061 | 49 |
| TRANSCRIPTIONAL_ACTIVATION_OF_WHITE_ADIPOCYTE_DIFFERENTIATION | 0.019 | 0.063 | 72 |
| INITIAL_TRIGGERING_OF_COMPLEMENT | 0.032 | 0.082 | 16 |
| NCAM1_INTERACTIONS | 0.023 | 0.092 | 39 |
| CELL_EXTRACELLULAR-MATRIX_INTERACTIONS | 0.032 | 0.102 | 14 |
| COLLAGEN_FORMATION | 0.041 | 0.124 | 58 |
Figure 2. Replicated Reactome pathways for CAD using i-GSEA4GWAS with a 100kb mapping interval.
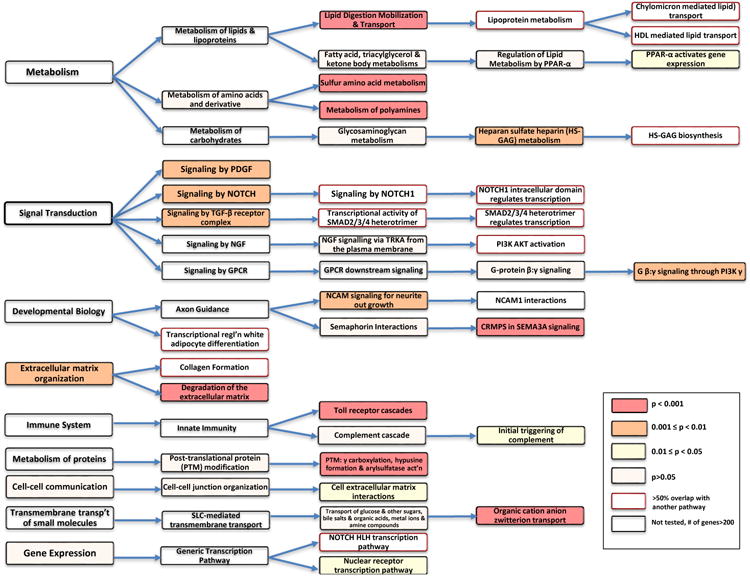
Replicated pathways are represented in a hierarchical Reactome pathway diagram. Top-level pathways, representing core biological processes, are listed to the left, and sub-levels corresponding to each top level are illustrated progressively to the right. The 9 top-level pathways that contain at least one replicated pathway (top-level and/or sub-levels) are shown. No sub-level pathways are shown to the right of the last replicated pathway. Pathways are color coded according to their gene-set enrichment p-value from the replication stage as indicated in the legend. A p <0.05 corresponds to an FDR <12.5%. Pathways containing less than 10 or greater than 200 genes were not tested. Replicated pathways with >50% overlap of genes with other replicated pathways are also identified as indicated in the legend.
About a third of the 32 replicated pathways were also significant in Stage 2 (p<0.05) after correcting for linkage disequilibrium between the SNPs, by analyzing SNPs pruned genome-wide at either r2>0.5 or r2>0.2 (Table SII, online-only Data Supplement). The pathways that were in common to all three pruned and unpruned SNP analyses were ‘Toll receptor cascades’, ‘degradation of the extracellular matrix’, ‘lipid digestion, mobilization and transport’, and ‘lipoprotein metabolism’, While the association of these pathways may be of higher confidence, pruning of SNPs may also lead to loss of power due to significant reduction in SNP number (5-15% of unpruned SNPs) and to the fact that the pruning was agnostic to the actual CAD SNP association p-values. Hence, for downstream gene and network analyses we chose to use the full set of 19 pathways that replicated with the unpruned list of SNPs.
Lastly, we examined the possible effect of LD among genes leading to inflated significance scores for the replicated pathways by considering the extent of LD among the gene-tagging (best scoring) SNPs for all genes in a pathway. The extent of LD among the most significant SNPs was found to be minimal. Specifically, of all the SNPs tested, we found only 2 SNP pairs with an r2 >0.8, observed across 3 pathways. Even at the more permissive r2 threshold of 0.2, only 4 SNP pairs were observed across 5 pathways (Table SIII, online-only Data Supplement).
Gene and Pathway Prioritization
The 32 replicated pathways contained a total of 770 unique genes that were taggable by at least one SNP (no SNP tags were available for 83 genes). Figure SIII (online-only Data Supplement) summarizes the proportion of genes within the replicated pathways that were associated with CAD. All replicated pathways contained 50% or more genes above the significance threshold (range 50.0% to 92.3%), confirming that the pathway findings were driven by the combined contributions of multiple genes in each pathway and not due to large effects from a small minority of genes. For comparison purposes, we also analyzed a synthetic pathway derived from genes within the CARDIoGRAM loci reaching genome wide significance. This synthetic pathway contained the second highest proportion of genes reaching the significance threshold.
Network analysis
Statistical evaluation of network
A total of 770 genes from the replicated pathways were mapped to the InWeb PPI network and the observed network connectivity parameters (‘degree’, and number of edges) compared to random networks of similar size and degree distribution. A network of direct interactions could be created with 620 genes (assuming a minimum interaction size of 2 genes). The resulting network (Figure SIV) was significantly different with respect to random networks; thus there were 3726 direct edges in the network compared to only 1548 edges expected by chance (p<0.001), and the observed average connectivity per gene (‘degree’ of gene) was 12, compared to an expected 5.8 from random networks (p<0.001). These results indicate that the networks constructed from the replicated pathway genes are likely not due to chance.
Mapping of replicated pathway genes to an interaction network
Although this PPI-based analysis provided confidence that the networks derived from the replicated pathway genes are unlikely to arise from chance, it allows only limited insights into the various biological mechanisms impacted by these pathways. Thus, in order to identify networks that contain more relevant information onbiological processes (including PPI), the genes from the replicated pathways were mapped to a functionally interacting network curated and maintained at Reactome. A total of 733 genes could be mapped to the larger network. This sub-network was further clustered to reveal within-network modules. Clustering resulted in the identification of 17 clusters with 10 clusters containing >10 gene members (Figure 3 and Table SIV). Within each cluster, a diverse array of interactions (reactions, complex formation, activation, etc.) was represented by the edges connecting the genes (nodes), as exemplified in Figure SV (online-only Data Supplement) for the genes in clusters 8 and 9. We also observed considerable inter-connectivity between the clusters; for example, the links between cluster 4 and other clusters are highlighted in Figure 3 (additional inter-cluster connectivities for each of the remaining clusters are shown in Figure SVI, online-only Data Supplement). Enrichment analysis within each cluster using Gene Ontology identified several cluster-specific overrepresentations of biological processes, as further highlighted in Figure 3. The following are some notable examples of functional enrichment within the clusters (FDR<0.001):‘innate immunity’ (cluster 1 and 4),‘Notch signaling’ (cluster 6), ‘extracellular matrix organization’ (cluster 7), ‘lipid metabolism’ (cluster 8) and ‘axon guidance’ (cluster 9). The full list of all significantly overrepresented GO-BP terms (FDR<0.001) is provided in Table SV (online-only Data Supplement).
Figure 3. Functionally interacting network modules constructed from genes belonging to the replicated, CAD-associated pathways.
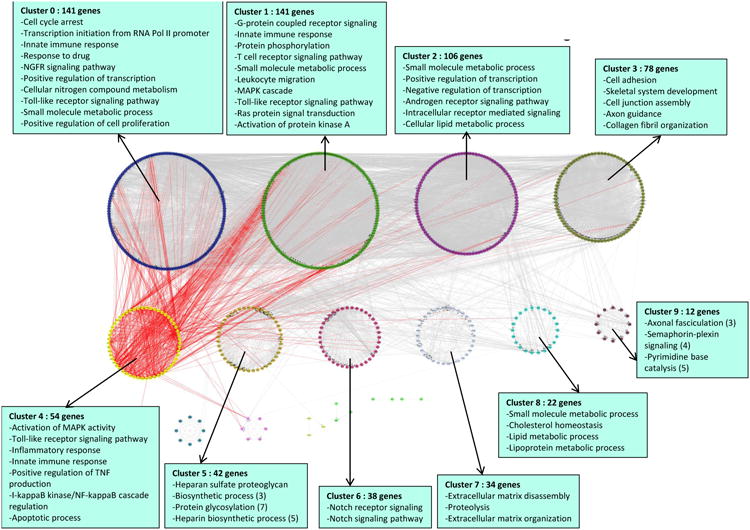
Functional interactions among the genes from all replicated pathways were analyzed and clustered by the ReactomeFI tool and visualized in Cytoscape. Genes are represented as nodes and interactions among genes are represented as edges. The parent network was further analyzed to yield sub-network clusters; each cluster is shown separately and color coded for clarity. Inter-cluster connectivity is exemplified in red for cluster 4. The top GO-BP terms that are enriched in each cluster are listed in the blue boxes. For each cluster, all terms are at FDR<0.0001 and contain a minimum of 10 genes (unless otherwise indicated in parentheses). A maximum of 10 GO-BP terms are shown for each cluster. Genes that were not linked to at least one other gene were excluded from the network diagram.
Gene and pathway prioritization based on network topology
Network topology provides vital information towards the understanding of network architecture and performance and allows for the prioritization of genes based on their topological characteristics within the network. Thus, we interrogated the topological properties of the networks derived from the replicated pathways. Specifically, we investigated two key node centrality measures, namely ‘degree’ and “betweenness”, due to their reported significance in biological networks as drivers for gene/protein essentiality (see online-only Data Supplement for additional information on ‘degree’ and ‘betweenness’).22 For this purpose, the replicated pathways were first converted into Reactome functional interaction networks (conversion was successful for 29 pathways, with the exclusion of ‘collagen formation’, ‘metabolism of polyamines’ and ‘organic cation anion zwitterion transport’ pathways) and subsequently analyzed for the above two node centrality measures. Figure 4 depicts the ‘betweenness’ centrality measures for a merged network derived from two pathways related to cell-cell interactions (‘NCAM signaling for neurite outgrowth’ and ‘CRMPs in Sema3a signaling’). In this network, the NCAM1 and Fyn proteins display large ‘betweenness’ centrality and act as bridges connecting multiple other proteins in the network. Some additional genes with GWAS association p<0.001 that occupy potentially critical positions (betweenness > 100) in a subset of the replicated pathways include FURIN (component of ‘degradation of extracellular matrix’, ‘extracellular matrix organization’, ‘signaling by NOTCH1′ pathways), MMP1 (‘degradation of extracellular matrix’ and ‘extracellular matrix organization’ pathways), and RPS6KA5 (‘Toll receptor cascades’ and ‘NCAM signaling for neurite outgrowth’ pathways). Results for the remaining pathways are shown in Figure SVII and Table SVI (online-only Data Supplement).
Figure 4. Topology based network analysis in replicated pathways.
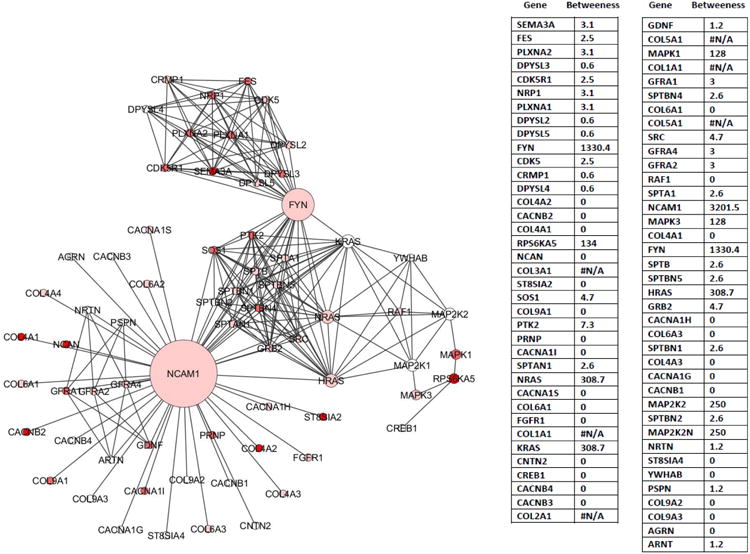
Topological relationships among genes are shown for a merged Reactome functional interaction network created in Cytoscape from two replicated pathways associated with cell-cell interactions (NCAM signaling for neurite outgrowth and CRMPs in Sema3a signaling). Genes (nodes) in the network are color coded by their replication p-values (deep red, p<0.001; lighter red, 0.001<p<0.01; lightest red, 0.01<p<0.05; white, p>0.05) and sized by their “betweenness” network centrality score (calculated via Centiscape 2.0). The individual gene names and their “betweenness” scores are listed beside the network diagram. Betweenness scores are not calculated for genes that do not connect to at least one other gene in the network (these genes are indicated with #N/A for betweenness).
Discussion
Despite the recent successes of large GWAS meta-analyses1, 2, the genetic architecture of CAD remains poorly understood and the identified loci explain a small proportion of genetic risk. By integrating GWAS data with expertly curated databases of core human pathways as well as gene and reaction-based functional networks, we sought to obtain novel insights into the potential causal processes of coronary atherosclerosis. Additionally, the large size of the discovery population and replication sample (25,000 CAD cases and 66,000 controls) and the two-step discovery-replication strategy increases confidence in the results. The current analysis implicates 32 core human pathways representing 9 distinct biologic processes as being most etiologically relevant to CAD.
Notably, a number of replicated pathways from the two-stage GWAS analysis strategy converged on processes regulating cellular growth, migration and proliferation, such as the ‘Signaling by TGF-β receptor’ and ‘Signaling by PDGF’, pathways previously intensively investigated for their functional role in coronary atherosclerosis. By combining GWAS-based findings with such a priori information we obtained evidence that genetic variation in a critical number of genes representing these pathways contribute to the heritability of CAD. Moreover, these data support hypotheses that alterations in these pathways are potentially causally related to CAD. Specifically, TGF-β is known to control cell proliferation, cell migration, matrix synthesis, wound contraction, calcification and the immune response, all of which are major components of the atherosclerotic process23. PDGF is expressed in every cell type of the atherosclerotic arterial wall, as well as in infiltrating inflammatory cells24 and plays a key role in the migration of vascular smooth muscle cells from the media into the intima and their subsequent proliferation. Although both pathways have been studied in animal models, animal data are often conflicting or inadequate and there are no data related to modulation of these pathways in humans. A number of pathways related to the integrity of the extracellular matrix were also highly significant including ‘Extracellular matrix organization’, ‘degradation of the extracellular matrix, and ‘Cell Extracellular matrix (ECM) interactions’. The ECM is responsible for maintaining not only the structural integrity of vessel wall plaques, but also participates in several key events such as cell migration, lipoprotein retention and thrombosis that are critically linked to plaque stability25.
Two of the axon guidance pathway sub-classes, ‘CRMPs in Sema3 signaling’, and ‘NCAM signaling for neurite out-growth’ also replicated. The axon guidance pathways modulate diverse biological phenomena including cellular adhesion, migration, proliferation, differentiation, survival and synaptic plasticity through the participation of highly conserved families of guidance molecules including netrins, slits, semaphorins, and ephrins, and their cognate receptors26. Neural guidance cues such as netrin-1 and semaphorins have important roles outside the nervous system. Moore et al. provide compelling evidence that netrin-1 is secreted by macrophage foam cells in atherosclerotic plaques and acts to inhibit emigration of these cells out of lesions by causing dysregulation of the actin cytoskeleton27. Oksala et al. reported that NTN1 is downregulated in atherosclerotic plaques and its expression correlates negatively with inflammatory markers and M2 signals28. Like netrin-1, semaphorin 3A, encoded by SEMA3A, one of the top ranked genes in this analysis, is also expressed in coronary artery endothelial cells and potently inhibits chemokine-directed migration of human monocytes29, 30. The present study also provides further supportive evidence for a causal role of innate immunity in atherosclerosis and/or plaque rupture with significant pathways including both ‘Toll receptor cascades’ and ‘initial triggering of complement’. Innate immune responses mounted by macrophages and other immune cells recruited to the arterial wall in response to an inflammatory challenge have a major role in the initiation of atherosclerosis31.
An important advance encompassed in the current work is our further examination of the topological characteristics of genes comprising the replicated gene-sets and the potential implication of topology on biological function. Specifically, we applied the Reactome FI tool to identify gene-sets related to biological processes such as innate immunity, cell adhesion, and lipid metabolism that were further reorganized into functionally interacting networks and sub-network clusters demonstrating a high degree of inter-connectedness. Network clustering, followed by pathway enrichment analysis on the identified clusters via Gene Ontology, generated new insights on interrelationships among the enriched pathways, not available through our initial traditional gene-set analysis. For example, whereas the lipid-metabolizing genes were largely concentrated in a single cluster (cluster 8), genes related to innate immunity were, by contrast, distributed within three separate clusters (clusters 0, 1, 4), along with other biological processes, highlighting the possibility of extensive interactions among these processes. Lastly, through analysis of such networks, we were further able to evaluate the possible criticality of genes in network function, based on the‘degree’ and ‘betweenness’ centrality properties of the network genes.
Collectively, these additional analytic approaches provide important insights into the interrelationships among genes that are not usually available through conventional gene-set enrichment analysis, and could assist in the formation of testable hypotheses on areas of robustness and vulnerability in functional networks otherwise not intuitively evident. For example, topological analysis implicated a potential role for the axonal growth related pathways in CAD with NCAM1 (neural adhesion molecule 1) being a major hub in a network including plexins (PLXNA1, PLXNA2), neuropilin (NRP1) as well as adhesion molecules (CNTN2) and several members of the collagen family relevant to the extracellular matrix of the vessel wall (Figure 4). These data support the concept that neuronal guidance cues have important roles in both arteriogenesis32, 33 and atherosclerosis by regulating macrophage retention in plaques27, 29, 30. Other studies demonstrate that semaphorin 3A and its receptors, neuropilin-1 and -2, plexins A1/A2/A3 are highly expressed in human monocyte derived macrophages and play a role in induction of macrophage apoptosis34.
Despite these plausible observations, we are cognizant that ‘betweenness’ is but only one of several network centrality measures that could play critical roles in network function. As both fields of network biology and network pharmacology are currently evolving, our findings should be considered more as hypotheses-generating rather than conclusive evidence of the importance of one gene or one pathway over another. Functional testing is necessary as the next step, and can take several forms, including (i) overexpression or knockdown of medium to high ‘betweenness’ genes in target pathways (e.g. NCAM1, FYN, for the network in Figure 4) in CAD-relevant cell models (e.g. human coronary artery endothelial or smooth muscle cells, macrophages, etc.) and to interrogate their effects on cell function (cell migration, lipid accumulation, etc.); (ii) testing the effects of candidate genes (e.g. NCAM1, FURIN) in knockout or overexpression mouse models (generated by somatic manipulation or transgene creation) on lesion formation (similar to studies on candidate GWAS genes for lipoprotein metabolism35-38); (iii) statistical epistasis analysis, limited to genes within a replicated pathway, to uncover functionally important interactions underlying the genetic basis of atherosclerosis, and (iv) prioritizing gene products from replicated pathways based on the availability of pharmacologic agents against them, and testing these for potential benefits in animal models of atherosclerosis (successfully demonstrated in identification of memory-modulating drugs39). We hope our approach stimulates extensive further discussion on how to experimentally interrogate CAD related networks and pathways.
We acknowledge potential caveats pertaining to this study. First, the number of pathways identified and replicated was modest but the pathways are biologically plausible. In the discovery analysis, 85 of the 639 (13%) pathways tested were significant at p<0.05 (and FDR <25%) with at least 50% of the genes in any given pathway being individually significant at a p<0.05. A total of 32 of these 85 (37%) pathways, achieved replication, a number somewhat lower than expected (75%) given the FDR threshold used in the discovery phase to select pathways for testing in the replication sample. This may reflect the less stringent criteria for age of onset of CAD cases applied in some of the replication studies as well as study-specific differences in inclusion/exclusion criteria and adjudication of outcomes, leading to increased sample heterogeneity1. Our study also highlights several generic issues that currently impose limitations on the conduct and interpretation of pathway analyses40. Some of these issues pertain to (i) the mapping of SNPs to genes, (ii) choosing the optimum ‘pathway analysis’ tool for GWAS, (iii) consequences of the permutation scheme used in i-GSEA4GWAS, and (iv) the effects of inter-SNP linkage disequilibrium on pathway analysis results. An additional caveat is the potential for bias in the network and topological analyses due to limitations in the extent and type of experimental data available in the source databases. We have provided a further detailed discussion of issues related to pathway and network analysis in the Results section of the online-only Data Supplement.
This is an area of emerging methodology and different approaches can yield complementary findings. Our findings extend gene-centric verification of CAD GWAS loci41 and those recently reported by CARDIoGRAM+C4D, applying Ingenuity network analysis only on the top 239 candidate genes 2. In another recently published study, based on this large-scale meta-analysis of GWAS studies for CAD, we used a very different approach42. Rather than a location based approach to map SNPs to genes, we used eQTL data from CAD-related tissues and primary cells to link CAD SNPs to their empirically defined target genes. We then created data-driven, tissue-specific gene expression networks from a multitude of human and mouse experiments 42. These networks relied heavily on available gene expression data and did not involve other types of interactions such as protein-protein interactions or biochemical reactions. In contrast, the present analysis is based on gene-to-SNP mapping methods for gene set enrichment rather than eQTL data and our analysis of the topological relationships among genes in the filtered, replicated pathways using Reactome FI and PID cover a more extensive array of molecular interactions, thus revealing important aspects that we failed to capture from the gene expression based networks. It is encouraging that these two approaches have yielded consistent results in terms of core processes related to lipid metabolism, immune system, Notch-HLH transcription and PPAR signaling. However, here we have identified additional biologically relevant pathways including extracellular matrix integrity, TGF-β signaling and axon guidance, the latter being of particular interest given recent laboratory findings27-30, 32-34. Many of these pathways had strengths of association comparable to those observed in known pathways related to lipoprotein metabolism.
The findings of this extensive but preliminary analysis do not imply causality. However, the utility of the integrative approach in elucidating the genetic bases of disease has been demonstrated by studies in several complex phenotypes. For example, in an investigation of the WTCCC Crohn's disease GWAS data set, only 3 genes at 2 loci showed GWAS significant signals but pathway analysis carried out by Wang et al. identified the 20 gene IL-12/IL-23 pathway to be associated with Crohn's disease that remained significant even when the 2 original loci were removed11, 43. In a similar vein, Holmans et al. provided supporting evidence for the immunogenetic origins of Parkinson's disease by identifying the regulation of leukocyte/lymphocyte activation and cytokine-mediated signaling as conferring increased susceptibility to Parkinson's disease, although none of the SNPs linked to genes within these pathways had achieved GWAS significance44. On the contrary, pathway analysis studies have had little success in generating new biological insights for other disorders including type 2 diabetes. Due to this variability, extensive mechanistic and functional validation of pathway and interactome-derived networks at multiple levels will be essential. An example of systematic experimental perturbation of interactome networks to understand cancer predisposition has been presented in Rozenblatt-Rozen et al.45 and a framework for network inference and validation based on gene knock-down has been proposed in Olsen et al.46
In summary, the present analysis has provided potential new insights into mechanisms underlying atherosclerosis and its clinical sequelae. The results of this investigation suggest a possible link between several core human biological processes and CAD, including several with and several without a substantial body of prior experimental evidence. Further study of the genes within the highlighted pathways may facilitate the development of novel testable hypotheses that could ultimately improve our understanding of atherosclerosis.
Supplementary Material
Figure 1. Analytical approach.

Schematic of analytical approach as described in detail in Methods section.
Significance.
Genome-wide association studies (GWAS) have identified over 45 loci associated with CAD risk but provide limited insight into causal mechanisms. Furthermore, the identified signals explain little more than 10% of the predicted heritability of CAD. Part of this “missing heritability” It is likely because many more common variants are linked to CAD but have not achieved genome-wide significance in GWAS because of small effect size and/or lower allele frequency and insufficient sample size. However, even weakly associated variants may provide important information regarding the biological basis of disease when such variants cluster within a common functional module or pathway. By integrating GWAS data with extensive databases on core biological processes, we have identified novel biological pathways relevant to the pathogenesis of CAD. These findings provide new insight into how genetic variation, interpreted in the context of biological processes and functional interactions among genes, may help define the genetic architecture of CAD.
Acknowledgments
We thank all the individuals who contributed to these multi-centered studies. The full list of the investigators who are part of the CARDIoGRAM Consortium is listed in the S1 Material online. A full list of the investigators who contributed to the generation of the Wellcome Trust data is available from http://www.wtccc.org.uk.
Sources of Funding: This work was supported by grants from the American Heart Association (AHA10SDG4230068 to S.G.; 13POST17240095 to V.P.M.; 13SDG17290032 to X.Y.); National Institutes of Health (1R21DK088319, 2P20MD000175-11 to S.G.); (P01HL098055, P01HL076491, P20HL113452 to SLH); (R01-HL095987 to SHS); (K23DK088942 to TLS); Wellcome Trust (#076113 and #085475) British Heart Foundation (to NJS); European Union (#201668 to RL). Deutsche Forschungsgemeinschaft and the German Federal Ministry of Education and Research (BMBF) in the context of the German National Genome Research Network (NGFN-2 and NGFN-plus), the FP6 and FP7 EU funded integrated projects Cardiogenics (# LSHM-CT-2006-037593) and ENGAGE (#201413), and the bi-national BMBF/ANR funded project CARDomics (#01KU0908A); Canadian Institutes of Health Research (# MOP-2380941 to RM), (#MOP82810, MOP77682 to AFS & RM); Canada Foundation for Innovation (#11966 to RR, AFS & RM; Heart & Stroke Foundation of Canada (#NA6001, #NA6650 to RM).
Abbreviations & Acronyms
- GWAS
genome-wide association study
- CAD
coronary artery disease
- CARDIoGRAM
Coronary Artery DIsease Genome wide Replication and Meta-analysis
- GSEA
gene-set enrichment analysis
- CEU
Center d'Etude du Polymorphisme Humain
- MSIGDB
Molecular Signatures Database v3.1
- PID
Pathway Interaction Database
Footnotes
Supplemental Data Description: The supplemental data includes 6 tables and 7 figures.
Disclosures: The authors state no conflicts of interest related to the contents of this manuscript.
| SNAP | https://www.broadinstitute.org/mpg/snap/ |
| Gene Ontology | http://www.geneontology.org/ |
| PLINK | http://pngu.mgh.harvard.edu/∼purcell/plink/ |
| MSigDB v3.1 | http://www.broadinstitute.org/gsea/msigdb/index.jsp |
| i-GSEA4GWAS | http://gsea4gwas.psych.ac.cn/inputPage.jsp |
| ReactomeFI Cytoscape plugin | http://chianti.ucsd.edu/cyto_web/plugins/displayplugininfo.php?name=Reactome%20FIs |
| Cytoscape (v 2.8.2) | http://www.cytoscape.org/ |
References
- 1.Schunkert H, Konig IR, Kathiresan S, et al. Large-scale association analysis identifies 13 new susceptibility loci for coronary artery disease. Nat Genet. 2011;43:25–33. doi: 10.1038/ng.784. [DOI] [PMC free article] [PubMed] [Google Scholar]
- 2.Deloukas P, Kanoni S, Willenborg C, et al. Large-scale association analysis identifies new risk loci for coronary artery disease. Nat Genet. 2012;45:25–33. doi: 10.1038/ng.2480. [DOI] [PMC free article] [PubMed] [Google Scholar]
- 3.Dickson SP, Wang K, Krantz I, Hakonarson H, Goldstein DB. Rare variants create synthetic genome-wide associations. PLoS Biol. 2010;8:e1000294. doi: 10.1371/journal.pbio.1000294. [DOI] [PMC free article] [PubMed] [Google Scholar]
- 4.Cirulli ET, Goldstein DB. Uncovering the roles of rare variants in common disease through whole-genome sequencing. Nat Rev Genet. 2010;11:415–25. doi: 10.1038/nrg2779. [DOI] [PubMed] [Google Scholar]
- 5.Visscher PM, Brown MA, McCarthy MI, Yang J. Five years of GWAS discovery. Am J Hum Genet. 2012;90:7–24. doi: 10.1016/j.ajhg.2011.11.029. [DOI] [PMC free article] [PubMed] [Google Scholar]
- 6.Yang J, Benyamin B, McEvoy BP, Gordon S, Henders AK, Nyholt DR, Madden PA, Heath AC, Martin NG, Montgomery GW, Goddard ME, Visscher PM. Common SNPs explain a large proportion of the heritability for human height. Nat Genet. 2010;42:565–9. doi: 10.1038/ng.608. [DOI] [PMC free article] [PubMed] [Google Scholar]
- 7.Stahl EA, Wegmann D, Trynka G, et al. Bayesian inference analyses of the polygenic architecture of rheumatoid arthritis. Nat Genet. 2012;44:483–9. doi: 10.1038/ng.2232. [DOI] [PMC free article] [PubMed] [Google Scholar]
- 8.Jia P, Wang L, Fanous AH, Pato CN, Edwards TL, Zhao Z. Network-assisted investigation of combined causal signals from genome-wide association studies in schizophrenia. PLoS Comput Biol. 2012;8:e1002587. doi: 10.1371/journal.pcbi.1002587. [DOI] [PMC free article] [PubMed] [Google Scholar]
- 9.Subramanian A, Tamayo P, Mootha VK, Mukherjee S, Ebert BL, Gillette MA, Paulovich A, Pomeroy SL, Golub TR, Lander ES, Mesirov JP. Gene set enrichment analysis: a knowledge-based approach for interpreting genome-wide expression profiles. Proc Natl Acad Sci U S A. 2005;102:15545–50. doi: 10.1073/pnas.0506580102. [DOI] [PMC free article] [PubMed] [Google Scholar]
- 10.Wang K, Li M, Bucan M. Pathway-based approaches for analysis of genomewide association studies. Am J Hum Genet. 2007;81:1278–83. doi: 10.1086/522374. [DOI] [PMC free article] [PubMed] [Google Scholar]
- 11.Wang K, Li M, Hakonarson H. Analysing biological pathways in genome-wide association studies. Nat Rev Genet. 2010;11:843–54. doi: 10.1038/nrg2884. [DOI] [PubMed] [Google Scholar]
- 12.Wang L, Jia P, Wolfinger RD, Chen X, Zhao Z. Gene set analysis of genome-wide association studies: methodological issues and perspectives. Genomics. 2011;98:1–8. doi: 10.1016/j.ygeno.2011.04.006. [DOI] [PMC free article] [PubMed] [Google Scholar]
- 13.Segre AV, Groop L, Mootha VK, Daly MJ, Altshuler D. Common inherited variation in mitochondrial genes is not enriched for associations with type 2 diabetes or related glycemic traits. PLoS Genet. 2010;6:e1001058. doi: 10.1371/journal.pgen.1001058. [DOI] [PMC free article] [PubMed] [Google Scholar]
- 14.Nam D, Kim J, Kim SY, Kim S. GSA-SNP: a general approach for gene set analysis of polymorphisms. Nucleic Acids Res. 2010;38:W749–W754. doi: 10.1093/nar/gkq428. [DOI] [PMC free article] [PubMed] [Google Scholar]
- 15.Zhang K, Cui S, Chang S, Zhang L, Wang J. i-GSEA4GWAS: a web server for identification of pathways/gene sets associated with traits by applying an improved gene set enrichment analysis to genome-wide association study. Nucleic Acids Res. 2010;38:W90–W95. doi: 10.1093/nar/gkq324. [DOI] [PMC free article] [PubMed] [Google Scholar]
- 16.Oti M, Brunner HG. The modular nature of genetic diseases. Clin Genet. 2007 Jan;71(1):1–11. doi: 10.1111/j.1399-0004.2006.00708.x. [DOI] [PubMed] [Google Scholar]
- 17.Feldman I, Rzhetsky A, Vitkup D. Network properties of genes harboring inherited disease mutations. Proc Natl Acad Sci U S A. 2008 Mar 18;105(11):4323–8. doi: 10.1073/pnas.0701722105. [DOI] [PMC free article] [PubMed] [Google Scholar]
- 18.Baranzini SE, Galwey NW, Wang J, Khankhanian P, Lindberg R, Pelletier D, Wu W, Uitdehaag BM, Kappos L, Polman CH, Matthews PM, Hauser SL, Gibson RA, Oksenberg JR, Barnes MR. Pathway and network-based analysis of genome-wide association studies in multiple sclerosis. Hum Mol Genet. 2009 Jun 1;18(11):2078–90. doi: 10.1093/hmg/ddp120. [DOI] [PMC free article] [PubMed] [Google Scholar]
- 19.Lu C, Latourelle J, O'Connor GT, Dupuis J, Kolaczyk ED. Network-guided sparse regression modeling for detection of gene-by-gene interactions. Bioinformatics. 2013 May 15;29(10):1241–9. doi: 10.1093/bioinformatics/btt139. [DOI] [PMC free article] [PubMed] [Google Scholar]
- 20.Wang L, Matsushita T, Madireddy L, Mousavi P, Baranzini SE. PINBPA: Cytoscape app for network analysis of GWAS data. Bioinformatics. 2015 Jan 15;31(2):262–4. doi: 10.1093/bioinformatics/btu644. [DOI] [PubMed] [Google Scholar]
- 21.Matthews L, Gopinath G, Gillespie M, et al. Reactome knowledgebase of human biological pathways and processes. Nucleic Acids Res. 2009;37:D619–D622. doi: 10.1093/nar/gkn863. [DOI] [PMC free article] [PubMed] [Google Scholar]
- 22.Yu H, Kim PM, Sprecher E, Trifonov V, Gerstein M. The importance of bottlenecks in protein networks: correlation with gene essentiality and expression dynamics. PLoS Comput Biol. 2007;3:e59. doi: 10.1371/journal.pcbi.0030059. [DOI] [PMC free article] [PubMed] [Google Scholar]
- 23.Toma I, McCaffrey TA. Transforming growth factor-beta and atherosclerosis: interwoven atherogenic and atheroprotective aspects. Cell Tissue Res. 2012;347:155–75. doi: 10.1007/s00441-011-1189-3. [DOI] [PMC free article] [PubMed] [Google Scholar]
- 24.Raines EW. PDGF and cardiovascular disease. Cytokine Growth Factor Rev. 2004;15:237–54. doi: 10.1016/j.cytogfr.2004.03.004. [DOI] [PubMed] [Google Scholar]
- 25.Katsuda S, Kaji T. Atherosclerosis and extracellular matrix. J Atheroscler Thromb. 2003;10:267–74. doi: 10.5551/jat.10.267. [DOI] [PubMed] [Google Scholar]
- 26.Schmidt EF, Strittmatter SM. The CRMP family of proteins and their role in Sema3A signaling. Adv Exp Med Biol. 2007;600:1–11. doi: 10.1007/978-0-387-70956-7_1. [DOI] [PMC free article] [PubMed] [Google Scholar]
- 27.van Gils JM, Derby MC, Fernandes LR, et al. The neuroimmune guidance cue netrin-1 promotes atherosclerosis by inhibiting the emigration of macrophages from plaques. Nat Immunol. 2012;13:136–43. doi: 10.1038/ni.2205. [DOI] [PMC free article] [PubMed] [Google Scholar]
- 28.Oksala N, Parssinen J, Seppala I, Raitoharju E, Ivana K, Hernesniemi J, Lyytikainen LP, Levula M, Makela KM, Sioris T, Kahonen M, Laaksonen R, Hytonen V, Lehtimaki T. Association of neuroimmune guidance cue netrin-1 and its chemorepulsive receptor UNC5B with atherosclerotic plaque expression signatures and stability in human(s): Tampere Vascular Study (TVS) Circ Cardiovasc Genet. 2013;6:579–87. doi: 10.1161/CIRCGENETICS.113.000141. [DOI] [PubMed] [Google Scholar]
- 29.Wanschel A, Seibert T, Hewing B, Ramkhelawon B, Ray TD, van Gils JM, Rayner KJ, Feig JE, O'Brien ER, Fisher EA, Moore KJ. Neuroimmune guidance cue Semaphorin 3E is expressed in atherosclerotic plaques and regulates macrophage retention. Arterioscler Thromb Vasc Biol. 2013;33:886–93. doi: 10.1161/ATVBAHA.112.300941. [DOI] [PMC free article] [PubMed] [Google Scholar]
- 30.van Gils JM, Ramkhelawon B, Fernandes L, Stewart MC, Guo L, Seibert T, Menezes GB, Cara DC, Chow C, Kinane TB, Fisher EA, Balcells M, varez-Leite J, Lacy-Hulbert A, Moore KJ. Endothelial expression of guidance cues in vessel wall homeostasis dysregulation under proatherosclerotic conditions. Arterioscler Thromb Vasc Biol. 2013;33:911–9. doi: 10.1161/ATVBAHA.112.301155. [DOI] [PMC free article] [PubMed] [Google Scholar]
- 31.Hansson GK, Hermansson A. The immune system in atherosclerosis. Nat Immunol. 2011;12:204–12. doi: 10.1038/ni.2001. [DOI] [PubMed] [Google Scholar]
- 32.Serini G, Valdembri D, Zanivan S, Morterra G, Burkhardt C, Caccavari F, Zammataro L, Primo L, Tamagnone L, Logan M, Tessier-Lavigne M, Taniguchi M, Puschel AW, Bussolino F. Class 3 semaphorins control vascular morphogenesis by inhibiting integrin function. Nature. 2003;424:391–7. doi: 10.1038/nature01784. [DOI] [PubMed] [Google Scholar]
- 33.Lanahan A, Zhang X, Fantin A, Zhuang Z, Rivera-Molina F, Speichinger K, Prahst C, Zhang J, Wang Y, Davis G, Toomre D, Ruhrberg C, Simons M. The neuropilin 1 cytoplasmic domain is required for VEGF-A-dependent arteriogenesis. Dev Cell. 2013;25:156–68. doi: 10.1016/j.devcel.2013.03.019. [DOI] [PMC free article] [PubMed] [Google Scholar]
- 34.Ji JD, Park-Min KH, Ivashkiv LB. Expression and function of semaphorin 3A and its receptors in human monocyte-derived macrophages. Hum Immunol. 2009;70:211–7. doi: 10.1016/j.humimm.2009.01.026. [DOI] [PMC free article] [PubMed] [Google Scholar]
- 35.Bauer RC, Stylianou IM, Rader DJ. Functional validation of new pathways in lipoprotein metabolism identified by human genetics. Curr Opin Lipidol. 2011;22:123–8. doi: 10.1097/MOL.0b013e32834469b3. [DOI] [PubMed] [Google Scholar]
- 36.Musunuru K, Strong A, Frank-Kamenetsky M, et al. From noncoding variant to phenotype via SORT1 at the 1p13 cholesterol locus. Nature. 2010;466:714–9. doi: 10.1038/nature09266. [DOI] [PMC free article] [PubMed] [Google Scholar]
- 37.Kjolby M, Andersen OM, Breiderhoff T, Fjorback AW, Pedersen KM, Madsen P, Jansen P, Heeren J, Willnow TE, Nykjaer A. Sort1, encoded by the cardiovascular risk locus 1p13.3, is a regulator of hepatic lipoprotein export. Cell Metab. 2010;12:213–23. doi: 10.1016/j.cmet.2010.08.006. [DOI] [PubMed] [Google Scholar]
- 38.Burkhardt R, Toh SA, Lagor WR, Birkeland A, Levin M, Li X, Robblee M, Fedorov VD, Yamamoto M, Satoh T, Akira S, Kathiresan S, Breslow JL, Rader DJ. Trib1 is a lipid- and myocardial infarction-associated gene that regulates hepatic lipogenesis and VLDL production in mice. J Clin Invest. 2010;120:4410–14. doi: 10.1172/JCI44213. [DOI] [PMC free article] [PubMed] [Google Scholar]
- 39.Papassotiropoulos A, Gerhards C, Heck A, et al. Human genome-guided identification of memory-modulating drugs. Proc Natl Acad Sci U S A. 2013;110:E4369–E4374. doi: 10.1073/pnas.1314478110. [DOI] [PMC free article] [PubMed] [Google Scholar]
- 40.Khatri P, Sirota M, Butte AJ. Ten years of pathway analysis: current approaches and outstanding challenges. PLoS Comput Biol. 2012;8:e1002375. doi: 10.1371/journal.pcbi.1002375. [DOI] [PMC free article] [PubMed] [Google Scholar]
- 41.Erbilgin A, Civelek M, Romanoski CE, Pan C, Hagopian R, Berliner JA, Lusis AJ. Identification of CAD candidate genes in GWAS loci and their expression in vascular cells. J Lipid Res. 2013;54:1894–905. doi: 10.1194/jlr.M037085. [DOI] [PMC free article] [PubMed] [Google Scholar]
- 42.Makinen VP, Civelek M, Meng Q, et al. Integrative genomics reveals novel molecular pathways and gene networks for coronary artery disease. PLoS Genet. 2014;10:e1004502. doi: 10.1371/journal.pgen.1004502. [DOI] [PMC free article] [PubMed] [Google Scholar]
- 43.Wang K, Zhang H, Kugathasan S, et al. Diverse genome-wide association studies associate the IL12/IL23 pathway with Crohn Disease. Am J Hum Genet. 2009;84:399–405. doi: 10.1016/j.ajhg.2009.01.026. [DOI] [PMC free article] [PubMed] [Google Scholar]
- 44.Holmans P, Moskvina V, Jones L, et al. Hum Mol Genet. 2013;22:1039–49. doi: 10.1093/hmg/dds492. [DOI] [PMC free article] [PubMed] [Google Scholar]
- 45.Rozenblatt-Rosen O, Deo RC, Padi M, et al. Interpreting cancer genomes using systematic host network perturbations by tumour virus proteins. Nature. 2012;487:491–5. doi: 10.1038/nature11288. [DOI] [PMC free article] [PubMed] [Google Scholar]
- 46.Olsen C, Fleming K, Prendergast N, Rubio R, Emmert-Streib F, Bontempi G, Haibe-Kains B, Quackenbush J. Inference and validation of predictive gene networks from biomedical literature and gene expression data. Genomics. 2014;103:329–36. doi: 10.1016/j.ygeno.2014.03.004. [DOI] [PMC free article] [PubMed] [Google Scholar]
Associated Data
This section collects any data citations, data availability statements, or supplementary materials included in this article.