

Abstract
The importance of preventing and controlling hypertension (HTN) and diabetes mellitus (DM) to mitigate risks to physical health has long been understood by healthcare professionals. More recently, a growing body of evidence also implicates HTN and DM in age-related cognitive decline and risk for dementia, though consensus has yet to be reached on whether older adults living with comorbid HTN and DM are at heightened risk for cognitive impairment. The present study sought to contribute to this topic through a coordinated analysis of three longitudinal studies of aging from England, Sweden, and the United States (total N=12 513). Identical multilevel linear growth models were fit to each to estimate the impact of baseline disease status on initial level and change in verbal declarative memory performance. Overall, few associations between HTN, DM and cognition were observed. Rate of decline was steeper for Swedish participants with independent HTN but attenuated for their American counterparts. Americans with comorbid HTN and DM showed attenuated decline. Treatment with medication was substantially less prevalent in the earlier-born and lower-educated Swedish sample, which may help to explain our pattern of results. In addition, those living with multiple conditions may be more likely to receive treatment, mitigating cognitive decline. Our results present a nuanced view of the interactions between HTN, DM and cognition and lead us to recommend consideration of treatment status or proxies such as birth cohort and education, in combination with age at assessment and specific measure used, in the interpretation of research in this area.
Keywords: Hypertension, diabetes mellitus, verbal memory, cognitive aging, coordinated analysis
Hypertension (HTN) and diabetes mellitus (DM) are two of the most prevalent health conditions diagnosed in the older adult population. In Canada, over 50% of individuals aged 65–69 years have diagnosed HTN while over 20% in the same age group have a DM diagnosis, and prevalence increases with age (Public Health Agency of Canada, 2010, 2011). The numbers are similar in many other Western nations (Danaei et al., 2011; Kaerney, Whelton, Reynolds, Whelton, & He, 2004). If left untreated or uncontrolled, both conditions increase the risk for more serious cerebral- and cardiovascular diseases (CVDs) such as stroke and myocardial infarction. Healthcare professionals have long understood the importance of preventing and controlling HTN and DM to mitigate such risks to physical health. More recently, a growing body of evidence indicates that age-related cognitive decline and risk for dementia may also be consequences of HTN and DM. As both are highly amenable to treatment and control by medication and lifestyle changes, there is considerable interest in further understanding their potential roles in the development of cognitive impairment and dementia in later life (Launer et al., 2010).
Past research consistently suggests that a long exposure time to HTN beginning in mid-life is associated with both future cognitive impairment as assessed by neuropsychological measures and dementia diagnosis (Gottesman et al., 2014; Kennelly, Lawlor, & Kenny, 2009; Qiu, Winblad, & Fratiglioni, 2005). In contrast, HTN in later life (age 65 and older) is less reliably associated with cognitive decline and, among the old-old, is in fact more often related to preserved functioning (Kennelly & Collins, 2012; Li et al., 2007; Power et al., 2011; Rastas et al., 2010). Instead, low blood pressure at advanced ages tends to predict elevated risk of dementia (Morris et al., 2001; Nilsson et al., 2007; Ruitenberg et al., 2001; Verghese, Lipton, Hall, Kuslansky, & Katz, 2003). The age-dependency of blood pressure’s relation to cognition, and the complications this introduces for study design, has been characterized as a “cognitive minefield” by Kennelly and Collins (2012). More straightforward conclusions, however, can be made from the literature on cognitive aging and DM. Several reviews of population-based longitudinal studies have reported “compelling evidence” that both mid- and late-life DM are associated with a greater risk of cognitive decline and all-cause dementia (Allen, Frier, & Strachan, 2004, p.174; Cukierman, Gerstein, & Williamson, 2005). Indeed, individuals living with DM in late-life may face an increase in the rate of decline by as much as 1.5 to 2.0 times relative to non-diabetic peers (Biessels, Staekenborg, Brunner, & Scheltens, 2008).
Few studies have explicitly studied the cognitive impacts of comorbid HTN and DM, though the two conditions share many risk factors and often co-occur. According to the Public Health Agency of Canada (2010), those with HTN are six times more likely to develop DM than normotensives while those with DM are three times more likely to develop HTN than non-diabetics. Despite this overlap, the issue of whether their interaction may heighten the risk of cognitive decline remains not yet fully understood. Hassing et al. (2004a) reported that MMSE scores over six years declined at a steeper rate for older adults with the comorbidity compared to those with neither or only one of the conditions. Other studies report variously that the two conditions may interact to increase the risk of cognitive impairment (Elias et al., 1997; Mount, 2011; Petrova, Prokopenko, Pronina, & Mozheyko, 2010) or may not (Cahana-Amitay et al., 2013; Fontbonne, Berr, Ducimetiére, & Alpérovitch, 2001; Gregg et al., 2000; Kuo et al., 2005). The great deal of heterogeneity in conclusions typically reached in this area of the literature may be aggravated by varying study designs, sample characteristics, neuropsychological measures, dementia and blood pressure classification schemes and the analytical approaches used across studies (Obisesan, 2009). In addition, studies of HTN as a predictor of cognitive change inconsistently adjust samples or statistical models for DM and vice-versa (Gifford et al., 2013). This results in a sample of varying cardiovascular loads, potentially introduces confounds to the results and further complicates cross-study comparison.
The purpose of the present study was to investigate whether there are differences in the level and rate of change of verbal memory functioning among older adults with independent HTN (i.e., without DM); with independent DM (i.e., without HTN); with comorbid HTN and DM; and individuals free of both conditions. The major goal of our study was to contribute to this field through coordinated data analysis; that is, by applying a consistent analytic model to three longitudinal studies of aging and comparing the patterns of results (Hofer & Piccinin, 2009). This flexible approach does not require identical outcome measures or a large number of included studies and provides an immediate opportunity for conceptual replication of findings across samples, facilitating an evaluation of the robustness of the association between cognitive functioning and HTN and DM.
Method
English Longitudinal Study on Aging (ELSA) Sample (England)
Data collection for ELSA began in 2002 with participants aged 50 years and older recruited from the Health Survey for England (N=11391 at baseline). Participants were assessed at two-year intervals on a range of physical, cognitive and health variables for up to 10 years (Steptoe, Breeze, Banks, & Nazroo, 2012). The present study encompasses five waves of data spanning eight years. All individuals with a dementia diagnosis at the first wave and those missing data on the cognitive outcome variable were excluded such that the sample for analysis consisted of 10698 individuals with an average age of 64 years (SD=9.7), of whom 56% are female. The follow-up rate was 77.3% of the baseline sample at wave two, 66.3% at wave three, 58.3% at wave four and 55.0% at wave five, with a mean of 5.64 years of follow-up (SD=3.3).
ELSA measures and procedure
Verbal declarative memory was assessed in-person with an immediate word recall task. After a computer read aloud a list of ten words, participants were asked to recall as many words as possible in any order for a maximum of two minutes. Performance on this task was scored from 0 to 10 points.
Diagnoses of HTN, DM and stroke were classified by self-report (“has a doctor ever told you that you have (or have had)…”). Smoking status was classified as never or ever based on responses to the question “have you ever smoked cigarettes?”
Origins of Variance in the Old-Old (OCTO-Twin) Sample (Sweden)
Data collection for the OCTO-Twin study began in 1991 with intact twin pairs aged 80 years and older recruited from the population-based Swedish Twin Registry (N=702 at baseline). Participants were assessed at two-year intervals for a maximum of five waves spanning eight years. Participants identified with probable dementia at baseline and those missing data on the cognitive outcome variable were excluded from analyses, such that the sample for analysis includes 594 individuals with an average age of 83 years (SD=2.7), of whom 70% are female. The follow-up rate was 90.3% of the baseline sample at wave two, 67.8% at wave 3, 52.3% at wave 4 and 39.0% at wave 5, with a mean of 5.02 years of follow-up (SD=2.9) and almost all attrition due to mortality.
OCTO-Twin measures and procedure
Verbal declarative memory was assessed in-person with the prose recall task (Johansson, Zarit, & Berg, 1992), a Swedish language analogue of the Wechsler Memory Test prose passages (Wechsler, 1991). Participants listened to a short humorous story of 100 words and were scored from 0 to 16 points on the number of story units recalled immediately after presentation.
Diagnoses of HTN, DM and stroke were classified by information retrieved jointly from medical records, medication usage and self-reports. Smoking status was classified as never or ever by responses to the question “have you ever smoked?”
Rush Memory and Aging Project (MAP) Sample (USA)
Data collection for the Rush MAP began in 1997 with participants aged 50 years and older recruited from retirement homes, subsidized housing and local church groups in north-eastern Illinois (N=1692 at baseline). Participants were assessed annually for a maximum of sixteen waves (Bennett et al., 2012). Those with a dementia diagnosis at baseline and those missing data on the cognitive outcome variables were excluded from the analyses such that the sample for analysis was comprised of 1221 individuals with an average age of 79 years (SD=7.6), of whom 76% are female. The follow-up rate was 85.9% of the baseline sample at wave two, 75.3% at wave three, 63.7% at wave four and 53.1% at wave five, with a mean of 5.02 years of follow-up (SD=3.8). All waves were used in the analysis, though just two participants remained at the sixteenth wave.
Rush MAP measures and procedure
Verbal declarative memory was assessed in-person by three different immediate recall tasks. The East Boston Memory Test (Albert et al., 1991) asks participants to recall as many story units as possible immediately after listening to a three-sentence story and is scored from 0 to 12 points. The Logical Memory Test (Wechsler, 1987) is administered similarly and is scored from 0 to 25 points. Finally, the Word List Memory test from the CERAD battery (Morris, Mohs, Rogers, Fillenbaum, & Heyman, 1988) presents participants with a 10-word list three times with scores from 0 to 30 points. A composite score was not created to permit within-study replication across the measures.
HTN and DM diagnoses were classified by use of antihypertensive or anti-diabetic medication, or by responses to the questions “have you ever been told by a doctor, nurse or therapist that you had …,” “has a doctor, nurse or therapist ever told you to take …” and “has a doctor, nurse or therapist ever told you to take medication by mouth for your …” Smoking status was classified as never or ever by responses to the questions “do you smoke cigarettes now?” and “did you ever smoke cigarettes regularly?” Diagnoses of stroke was classified by joint examination of self-report, medical exam and use of medications.
Analytic Approach
The present study sought to contribute to the wider literature on the independent and interactive roles of HTN and DM in age-related cognitive decline. This was accomplished through coordinated analysis by fitting the same model to each of three longitudinal studies of aging, selected from the Integrative Analysis of Longitudinal Studies of Aging (IALSA) network (Hofer & Piccinin, 2009; Piccinin & Hofer, 2008) on the basis of the similarity of cognitive measures and breadth of CVD diagnoses.
Baseline differences in age and years of education between four diagnostic groups (independent HTN, independent DM, comorbid HTN and DM, and neither HTN nor DM) were assessed with one-way analyses of variance. Chi-square tests were used to test for baseline differences in the dichotomous variables of sex, smoking status (ever/never) and diagnosis of stroke.
To examine the independent and interactive associations of HTN and DM with verbal declarative memory level and change over time, a multilevel linear growth model that described change as a function of time in study was fit separately to each study using Mplus Version 7 (Muthén & Muthén, 2012). Models were estimated using robust maximum likelihood (MLR) to account for non-normality and specified as censored from above to account for ceiling effects. The model for the OCTO-Twin study nested participants within their twin pair.
Baseline diagnostic statuses for HTN and DM were included as main effect terms representing those with independent HTN (i.e., without comorbid DM) and those with independent DM (i.e., without comorbid HTN), respectively. The HTN*DM term represented individuals with comorbid HTN and DM, and the fixed effects represented individuals with neither HTN nor DM at baseline (reference group). Control variables for baseline age, years of education, sex, smoking status and diagnosis of stroke were also included. To facilitate interpretation of results across studies, we centred baseline age and years of education at a “centercept,” the mean value across all three studies (Wainer, 2000). This value for baseline age (M=75.3 years) would have been outside the range of values for OCTO-Twin so was rounded to 80 years of age in all analyses. Years of education was centred at 11 years. The reference category for sex was male; thus model intercepts represent the initial level of performance for an 80-year-old man with 11 years of education who had never smoked and who had no diagnosis of prevalent HTN, DM or stroke at the first occasion of measurement. See the online supplement for the model equation.
Results
Descriptive characteristics at baseline are displayed in Table 1. As expected, baseline HTN was more highly prevalent than DM with less than 10% of each sample diagnosed with both conditions concurrently. Though data were not pooled for analyses, this amounts to 4.5% of participants with comorbid HTN and DM across the three studies (13.9% of those with a HTN or DM diagnosis). Tests for baseline differences across the four diagnostic groups showed that, overall, participants free of both conditions were likely to have more years of education and to have never had a stroke. Moreover, undiagnosed participants in ELSA were more likely to be younger and smokers, while those with independent DM tended to be male. In Rush MAP, individuals with independent HTN tended to be female and older.
Table 1.
Participant characteristics at baseline of the sample for analysis across four diagnostic groups in three longitudinal studies of aging.
| Characteristics | Neither hypertension nor diabetes | Hypertension without diabetes | Diabetes without hypertension | Diabetes and hypertension | Full sample | ||||||||||
|---|---|---|---|---|---|---|---|---|---|---|---|---|---|---|---|
|
| |||||||||||||||
| ELSA N=6370 |
OCTO N=389 |
RUSH N=511 |
ELSA N=3551 |
OCTO N=148 |
RUSH N=549 |
ELSA N=276 |
OCTO N=36 |
RUSH N=43 |
ELSA N=501 |
OCTO N=23 |
RUSH N=118 |
ELSA N=10698 |
OCTO N=594 |
RUSH N=1221 |
|
|
|
|||||||||||||||
| Years of age (M±SD) |
63.0±9.5 | 83±2.8 | 79±7.6 | 66±9.7 | 82±2.3 | 80±7.2 | 67±10 | 84±2.8 | 77±7.0 | 67±8.6 | 84±3.1 | 77±8.4 | 64±9.7 | 83±2.7 | 79±7.6 |
| Years of education (M±SD) |
11±1.8 | 7.4±2.5 | 15±3.1 | 11±1.7 | 7±2.0 | 14±2.9 | 11±1.7 | 7.1±2.0 | 14±3.6 | 10±1.8 | 7.0±1.1 | 14±3.2 | 10±1.8 | 7.3±2.3 | 15±3.1 |
| Sex (women) % | 55 | 68 | 74 | 58 | 76 | 78 | 42 | 58 | 56 | 47 | 64 | 76 | 56 | 70 | 76 |
| Never smoked % | 37 | 60 | 59 | 38 | 71 | 59 | 31 | 60 | 50 | 31 | 57 | 67 | 37 | 63 | 59 |
| Stroke % | 1.6 | 15 | 7.4 | 6.1 | 15 | 9.9 | 6.8 | 27 | 12.0 | 8.4 | 15 | 10.5 | 3.5 | 16 | 8.9 |
M=mean; SD=standard deviation; ELSA=English Longitudinal Study on Aging; OCTO=Origins of Variance in the Old-Old; Rush=Rush Memory and Aging Project.
Note. After exclusion due to baseline cognitive dementia and missingness.
Results from the multilevel linear growth models are displayed in Table 2. Initial memory scores were not associated with HTN or DM or their interaction in any models, with the exception of ELSA where those with independent DM had lower scores (b=−.22, p<.05). Slope fixed effects revealed declines in memory over the study period in all samples (all p<.001) with the exception of OCTO-Twin where performance across eight years was stable (b=−.11, p=.37). In the OCTO-Twin and Rush MAP studies, independent HTN was related to change in performance over time though in opposite directions; in OCTO-Twin, it was associated with steeper decline (b=−.18, p<.05) while in Rush MAP, decline in Logical Memory (b=.09, p<.05) scores were slightly attenuated. The interaction between HTN and DM was associated with change over time for the Logical Memory Test only; again, decline was attenuated (b=.34, p<.05). Model-predicted trajectories across diagnostic groups for the OCTO-Twin and Rush MAP (Logical Memory) models are displayed in figures 1–2.
Table 2.
Raw beta coefficients and standard errors derived from above-censored multilevel linear growth models applied to three longitudinal studies of aging.
| ELSA | Rush MAP | Rush MAP | Rush MAP | OCTO-Twin | |||||||||||
|---|---|---|---|---|---|---|---|---|---|---|---|---|---|---|---|
| Immediate Word Recall | CERAD | East Boston | Logical Memory | Prose Recall | |||||||||||
| b (SE) | p | b (SE) | p | b (SE) | p | b (SE) | p | b (SE) | p | ||||||
|
|
|||||||||||||||
| Intercept | 4.61 (.04) | <.001 | 14.99 (.28) | <.001 | 9.09 (.01) | <.001 | 8.89 (.30) | <.001 | 11.81 (.56) | <.001 | |||||
| Age | −.058 (.00) | <.001 | −.15 (.01) | <.001 | −.037 (.01) | <.001 | −.12 (.01) | <.001 | −.23 (.06) | <.001 | |||||
| Female | .23 (.03) | <.001 | 2.12 (.22) | <.001 | .35 (.12) | <.01 | 1.64 (.24) | <.001 | 1.16 (.39) | <.01 | |||||
| Education | .21 (.01) | <.001 | .35 (.03) | <.001 | .11 (.02) | <.001 | .34 (.03) | <.001 | .41 (.07) | <.001 | |||||
| HTN | −.043 (.03) | .18 | −.15 (.22) | .50 | .061 (.11) | .57 | .04 (.22) | .85 | .025 (.37) | .95 | |||||
| DM | −.22 (.10) | <.05 | .039 (.57) | .94 | .052 (.27) | .85 | .36 (.48) | .47 | −.27 (.91) | .77 | |||||
| HTNDM | −.089 (.12) | .47 | .61 (.67) | .37 | .037 (.32) | .91 | −.47 (.59) | .43 | −.17 (1.33) | .90 | |||||
| Smoking | −.03 (.03) | .33 | −.43 (.20) | <.05 | .14 (.10) | .17 | −.22 (.21) | .28 | −.029 (.38) | .94 | |||||
| Stroke | −0.31 (.08) | <.001 | −.69 (.35) | <.05 | −.12 (.17) | .48 | −.11 (.37) | .77 | −.39 (.46) | .40 | |||||
| Slope | −.072 (.01) | <.001 | −.27 (.06) | <.001 | −.21 (.04) | <.001 | −.20 (.06) | <.001 | −.11 (.12) | .37 | |||||
| Age | −.003 (.00) | <.001 | −.022 (.00) | <.001 | −.012 (.00) | <.001 | −.02 (.00) | <.001 | −.004 (.02) | .83 | |||||
| Female | .012 (.01) | <.10 | −.053 (.05) | .26 | −.011 (.03) | .72 | −.07 (.05) | .12 | −.018 (.10) | .86 | |||||
| Education | .000 (.00) | .96 | .005 (.01) | .51 | .005 (.00) | .18 | .011 (.01) | .10 | .000 (.02) | .98 | |||||
| HTN | .002 (.01) | .83 | .017 (.05) | .70 | .042 (.03) | .14 | .088 (.04) | <.05 | −.18 (.09) | <.05 | |||||
| DM | −.026 (.03) | .30 | .074 (.12) | .54 | −.11 (.10) | .26 | −.15 (.12) | .21 | −.16 (.29) | .59 | |||||
| HTNDM | .024 (.03) | .42 | −.003 (.14) | .99 | .13 (.11) | .22 | .34 (.14) | <.05 | .22 (.35) | .53 | |||||
| Smoking | .001 (.01) | .89 | .027 (.05) | .54 | −.032 (.03) | .24 | −.010 (.04) | .82 | −.17 (.09) | <.10 | |||||
| Stroke | .002 (.02) | .92 | .043 (.07) | .56 | −.004 (.05) | .94 | .043 (.07) | .54 | −.31 (.17) | <.10 | |||||
| Variance Components | |||||||||||||||
| Slope | .002 (.00) | .23 | .24 (.02) | <.001 | .083 (.01) | <.001 | .21 (.02) | <.001 | .18 (.04) | <.001 | |||||
| Intercept | .86 (.04) | <.001 | 10.79 (.56) | <.001 | 1.75 (.16) | <.001 | 11.17 (.50) | <.001 | 7.87 (.88) | <.001 | |||||
| Residual | 1.65 (.03) | <.001 | 7.07 (.19) | <.001 | 3.52 (.09) | <.001 | 6.39 (.16) | <.001 | 5.56 (.39) | <.001 | |||||
ELSA=English Longitudinal Study on Aging; OCTO-Twin=Origins of Variance in the Old-Old; Rush MAP=Rush Memory and Aging Project; CERAD=Word List Memory test; SE=standard error.
Note. Standardized estimates are not presented due to sample differences in measure used, age range and variability (64); the primary goal of identifying directions of change in common across studies rather than direct comparison of magnitude of change; and to preserve the meaning inherent in the interpretation of centred covariate terms.
Figure 1.
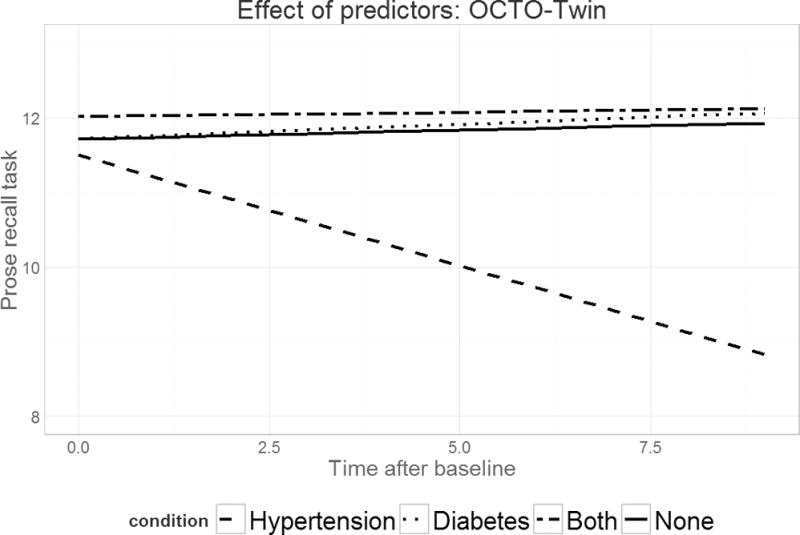
Predicted verbal declarative memory performance over time across four diagnostic groups for the OCTO-Twin study. The dashed line indicates the trajectory for those with independent HTN; the dotted line for those with independent DM; the dot-dash line for those with comorbid HTN and DM; and the solid line for those with neither HTN nor DM.
Figure 2.

Predicted verbal declarative memory performance (Logical Memory test) over time across four diagnostic groups for the Rush MAP study. The dashed line indicates the trajectory for those with independent HTN; the dotted line for those with independent DM; the dot-dash line for those with comorbid HTN and DM; and the solid line for those with neither HTN nor DM.
Between-person differences in baseline age, sex and education were associated with level of memory across all studies and outcomes such that older individuals, men, and those with fewer years of education performed more poorly (all p<.01). With the exception of OCTO-Twin, the study with the narrowest age range and oldest average age, older adults declined more quickly over time (all p<.001). Dichotomous covariates for smoking status and stroke diagnosis were generally not predictive of memory level or change, though when statistically significant, were negatively associated with the outcome. Both variables were associated with a lower level of performance on the CERAD test but not with other Rush MAP tasks. Accelerated decline was found for smoking and stroke diagnosis only in OCTO-Twin, the study with the oldest individuals and greatest proportion of smokers.
An earlier model included covariate terms for myocardial infarction and congestive heart failure diagnoses in addition to two-way interactions between age, sex, HTN and DM at both levels. Each term was almost entirely not statistically significant in any model and were therefore trimmed to improve parsimony.
Discussion
The present study questioned whether older adults living with comorbid HTN and DM experience exacerbated decline in declarative memory relative to those living with only one or neither of the conditions. We compared the results of the same multilevel linear growth model applied to three longitudinal studies of aging and observed few associations between HTN, DM and memory performance overall. Only in ELSA was independent DM related to a lower initial level, while independent HTN was related to both attenuated (Rush MAP) and increased (OCTO-Twin) decline over time. The comorbidity was predictive of only attenuated decline over the course of sixteen years in Rush MAP. The individual, fixed effect and main effect trajectories for each diagnostic group across studies are illustrated in Figures 3–7.
Figure 3.
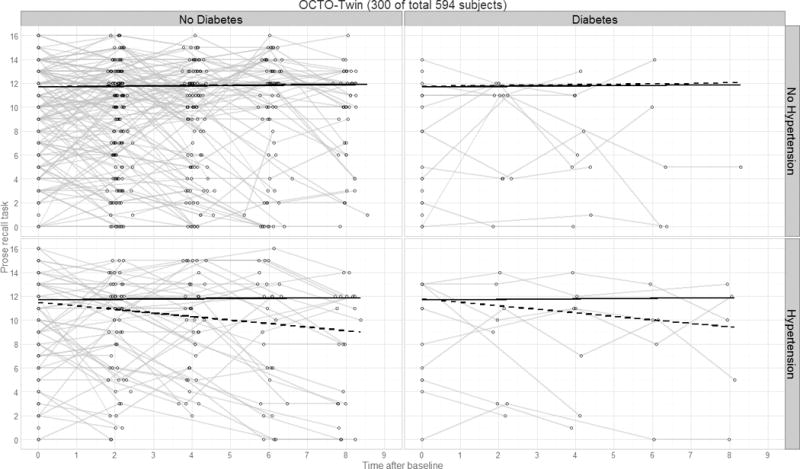
Panel plot illustrating predicted verbal declarative memory performance over time by diagnostics group for the OCTO-Twin study. Thin lines represent raw trajectories for a random sample of participants (total N=300); solid lines represent the fixed effect intercept and slope estimates; dashed lines represent the main effect intercept and slope estimates.
Figure 7.
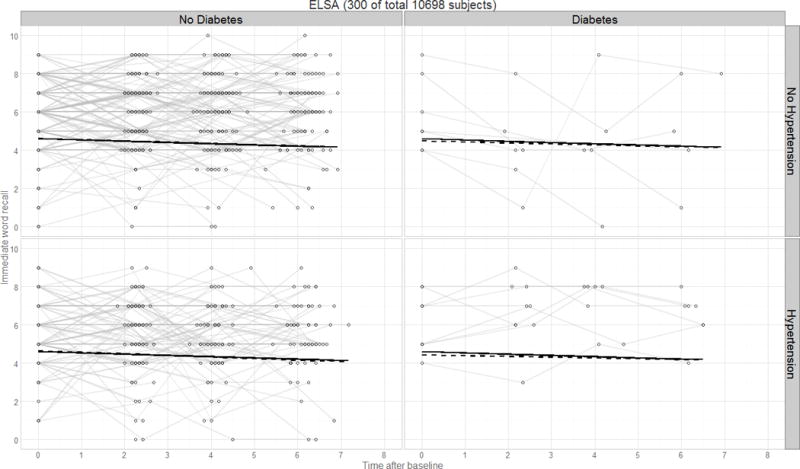
Panel plot illustrating predicted verbal declarative memory performance over time by diagnostics group for the ELSA study. Thin lines represent raw trajectories for a random sample of participants (total N=300); solid lines represent the fixed effect intercept and slope estimates; dashed lines represent the main effect intercept and slope estimates.
Current understanding of the cognitive impacts of late-life HTN is particularly inconsistent relative to mid-life HTN, which has more often been reported to be predictive of impairment, decline and dementia (Qiu et al., 2005). This association is influenced by the age at diagnosis and duration of the illness, study design factors such as age at blood pressure assessment and the time interval to the outcome assessment and, perhaps, by antihypertensive medication use (though this remains contentious; Kennelly et al., 2009; McGuinness, Todd, Passmore, & Bullock, 2009). Peila and colleagues (2006) reported slower decline in global cognition for older male hypertensives who had used medication for between five to 12 years, relative to untreated peers. Every year of medication use reduced the risk for dementia and Alzheimer disease by 5% while long-term use (more than 12 years) was associated with no greater risk than that for normotensive individuals. This same general conclusion has been reached by several systematic reviews; namely, that patients taking antihypertensives are at a significantly lower risk for all-cause or vascular dementia (Chang-Quan et al., 2011; Marpillat, Macquin-Mavier, Tropeano, Bachoud-Levi, & Maison, 2013; Shah et al., 2009). However, studies which distinguish between treated and controlled versus treated and uncontrolled HTN find that unless medication use has controlled the condition, the individual remains at high risk for future cognitive decline (Brady, Spiro, & Gaziano, 2005; Köhler et al., 2014).
Baseline age does not appear to explain our conflicting findings on HTN, as Rush MAP and OCTO-Twin are separated by just four years on average and, though we might expect older hypertensives to show preserved cognitive functioning (Kennelly & Collins, 2012), the opposite was observed. Our pattern of results instead appears to be closely aligned with the prevalence of antihypertensive medication use, as approximately 87% of Rush MAP hypertensives were treated compared to 69% in OCTO-Twin. This difference in turn likely represents the influences of birth cohort (OCTO-Twin M±SD=1909.1±3.1; Rush MAP M±SD=1925.6±9.3) and education (OCTO-Twin M±SD=7.3±2.3; Rush MAP M±SD=15±3.1 years) given that awareness, treatment and control of HTN have improved over time (McAlister et al., 2011; Psaty et al., 2002). In addition, it is important to consider the interaction of birth cohort and age at assessment on treatment prevalence. The oldest participants at the time of assessment were born in the earliest years, thus experiencing age-related changes with fewer years to yield the personal benefits of modern healthcare, drug treatments and treatment guidelines. Freis (1995) notes that HTN went largely untreated until the late 1940s, when the major course of action was dietary and drugs caused unpleasant side effects. A turning point was the first report of the Joint National Committee on Prevention, Detection, Evaluation, and Treatment of High Blood Pressure (JNC) in 1977 though in it, physicians were counseled to take no specific action against HTN unless the diastolic value was over 105mmHg (Moser, 2006). Since then, treatment emphasis has shifted to systolic pressure and the number of drugs available has increased three-fold. OCTO-Twin participants, already in their late-60s by this point, may have lived with untreated or uncontrolled mid-life HTN for many years and may have experienced greater impact of this history than younger individuals from Rush MAP and ELSA. Treatment prevalence in ELSA was fairly high (77%), as expected due to the sample’s later birth cohort and high level of education; together with the relatively young age at memory assessment (M±SD=64±9.7 years at baseline), this likely explains the null association between HTN and memory.
The literature consistently suggests that DM is related to higher dementia risk and faster overall cognitive decline (Allen et al., 2004; Biessels, Staekenborg, Brunner, Brayne, & Scheltens, 2006) and that verbal memory in particular is frequently identified as impaired, (Awad, Gagnon, & Messier, 2004) although others have reported relatively selective effects on perceptual speed (Arvanitakis, Wilson, Bienias, Evans, & Bennett, 2004). In line with this, diabetic participants in ELSA performed poorly at initial assessment, though this did not translate to long-term performance and was not observed in other studies. An important caveat to interpreting the wider literature is to recognize that of the studies which assessed verbal memory in a review by Awad and colleagues, (Awad et al.) 65% failed to find a significant association with DM. For example, in the Maastricht Aging Study (Mage=64 years), baseline DM was not associated with change on the immediate word recall task over twelve years in models both unadjusted for and with HTN and CVD covariates (Spauwen, Köhler, Verhey, Stehouwer, & van Boxtel, 2013). Treated and controlled DM has been found to mitigate the risk of cognitive decline (Logroscino, Kang, & Grodstein, 2004; Xu, von Strauss, Qiu, Winblad, & Fratiglioni, 2009), and 100% of diabetics in Rush MAP were treated. However, this does not fully explain our findings as DM was not related to cognitive change in OCTO-Twin where only half of diabetics reported treatment.
The present study is among a few that explicitly distinguish between individuals with only one of HTN or DM and those affected by both conditions. Overall, we found that the comorbidity introduced no exacerbation of cognitive impairment or decline; in fact, this group showed attenuated decline on the Logical Memory Test in Rush MAP. Research on this topic is divided between negative and null associations; our positive estimate is an exception and may be related to medication use, as those living with multiple conditions may be more likely to receive treatment, though data limitations prevented further pursuit on this inquiry. Another potential influence is the specific neuropsychological measure used, as delayed word recall may be more sensitive to changes than immediate word recall, which is supported by short-term memory (Hassing et al., 2004b; Johnson, Storandt, & Balota, 2003). For example, in a large population-based cohort study in Germany, diabetes was associated with worse performance on delayed, but not immediate, recall on the East Boston Naming Test (Debling, Amelang, Hasselbach, & Stürmer, 2006). Prose recall may be more sensitive than word recall; indeed the present study found associations between diagnosis and long-term change for prose recall tasks only. More tellingly, identical models run within Rush MAP were unable to replicate findings from a prose recall task with the word recall test.
A number of considerations must be taken into account when interpreting our results. For one, we cannot unequivocally determine the direction of the association between cognitive function and HTN and DM. It is possible that cognitive changes may be symptomatic of underlying health processes which also affect the cardiovascular system (Guan et al., 2011), or that those who are cognitively impaired have poorer command of skills necessary to manage chronic diseases like HTN and DM, leading to poorer cognitive and health outcomes later (Feil, Zhu, & Sultzer, 2012; Hawkins et al., 2012). Excluding individuals with baseline cognitive impairment and adjusting models for stroke provides some defense, as estimates of cognitive functioning are not magnified by those individuals with comorbidities known to adversely impact cognition (Obisesan, 2009). However, this also introduces survivor bias or selective mortality as we may have selected for a relatively healthy sample unrepresentative of the typical older adult, potentially leading to conservative estimates (Cukierman et al., 2005; Rastas et al., 2010).
A limitation of the study is that a relatively small proportion of participants in OCTO-Twin and Rush MAP reported independent DM or comorbid HTN and DM at baseline, so estimates for these groups were based on small numbers and should be treated cautiously. Second, diagnoses were based in part on self-report which is subject to recall and measurement bias; those who experience cognitive decline may have difficulties remembering the nature of pre-existing diagnoses, and some respondents may neglect to report HTN if the condition has been under control for some time. Finally, while coordinated data analysis is an optimal method for conceptual replication work, other fundamental differences between studies apart from treatment prevalence may play into inconsistencies in results and must be considered when interpreting findings. For example, the health of participants is likely to be influenced by the healthcare system of their country and accessibility of treatment.
The present study has considerable strengths, including the application of coordinated data analysis to three geographically diverse longitudinal studies of aging and clear distinction between cases of independent and comorbid HTN and DM. Our findings present a nuanced view of the interactions between HTN, DM and cognition which may be dependent, in part, on treatment with medication. This leads us to recommend consideration of treatment status, or proxies such as birth cohort and education, in combination with age at assessment and specific measure used, in the interpretation of research in this area. Overall, we conclude that 1) treatment of HTN may attenuate memory decline, 2) further work is required to provide clarity on the cognitive impacts of treatment for DM and 3) comorbid HTN and DM does not necessarily exacerbate cognitive aging, though under which conditions remains to be more fully elucidated.
Supplementary Material
Figure 4.
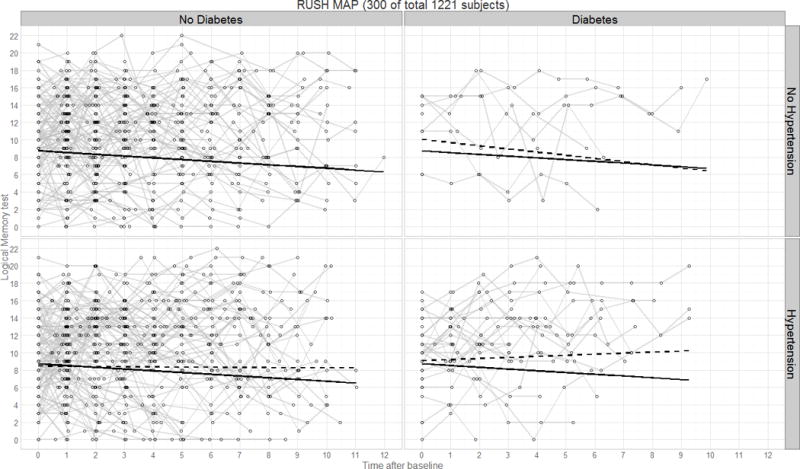
Panel plot illustrating predicted verbal declarative memory performance (Logical Memory test) over time by diagnostics group for the Rush MAP study. Thin lines represent raw trajectories for a random sample of participants (total N=300); solid lines represent the fixed effect intercept and slope estimates; dashed lines represent the main effect intercept and slope estimates.
Figure 5.
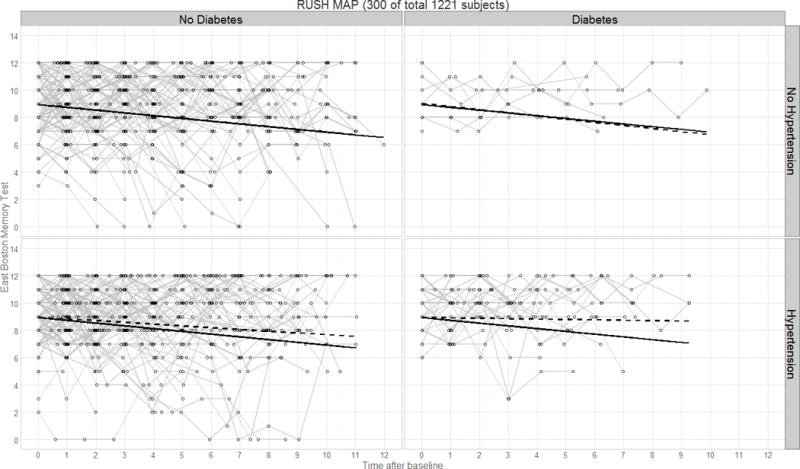
Panel plot illustrating predicted verbal declarative memory performance (East Boston Memory Test) over time by diagnostics group for the Rush MAP study. Thin lines represent raw trajectories for a random sample of participants (total N=300); solid lines represent the fixed effect intercept and slope estimates; dashed lines represent the main effect intercept and slope estimates.
Figure 6.
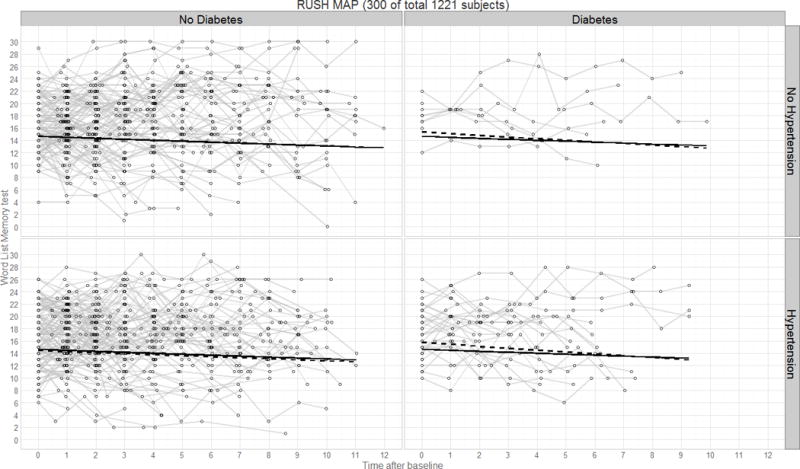
Panel plot illustrating predicted verbal declarative memory performance (CERAD test) over time by diagnostics group for the Rush MAP study. Thin lines represent raw trajectories for a random sample of participants (total N=300); solid lines represent the fixed effect intercept and slope estimates; dashed lines represent the main effect intercept and slope estimates.
Acknowledgments
Research reported in this publication was supported by the National Institute on Aging of the National Institutes of Health under award number P01AG043362 for the Integrative Analysis of Longitudinal Studies of Aging (IALSA) research network. The content is solely the responsibility of the authors and does not necessarily represent the official views of the National Institutes of Health.
This article reports data from the OCTO-Twin study, supported by a grant from the National Institute on Aging (NIA: AG 08861), and the Rush Memory and Aging Project, supported by a grant from the National Institute on Aging: R01AG17917. L. A. Kelly was supported by a Canada Graduate Scholarship – Master’s from the Canadian Institutes of Health Research (CIHR). L. B. Hassing was supported by the Bank of Sweden Tercentenary Foundation P12-0567:1, Swedish Research Council for Health, Working Life and Welfare (EpiLife and AGECAP 2013-2300).
The authors wish to extend sincere thanks to Lesa Hoffman (Department of Psychology, University of Kansas) for her assistance with management of the OCTO-Twin data set, and to Lei Yu (Rush Alzheimer’s Disease Center, Rush University Medical Center) for his assistance with the Rush MAP data set.
Contributor Information
Amanda Kelly, Department of Psychology, University of Victoria.
Matthew Calamia, Department of Psychology, Louisiana State University.
Andrey Koval, Department of Psychology, University of Victoria.
Graciela Muniz Terrera, MRC Unit for Lifelong Health & Ageing, University College London.
Andrea M. Piccinin, Department of Psychology, University of Victoria
Sean Clouston, Preventative Medicine Program in Public Health, Stony Brook University.
Linda B. Hassing, Department of Psychology, University of Gothenburg
David A. Bennett, Rush Alzheimer’s Disease Center, Rush University Medical Center
Boo Johansson, Department of Psychology, University of Gothenburg.
Scott M. Hofer, Department of Psychology, University of Victoria
References
- Albert M, Smith LA, Scherr PA, Taylor JO, Evans DA, Funkesntein HH. Use of brief cognitive tests to identify individuals in the community with clinically diagnosed Alzheimer’s disease. International Journal of Neuroscience. 1991;57(3–4):167–178. doi: 10.3109/00207459109150691. [DOI] [PubMed] [Google Scholar]
- Allen KV, Frier BM, Strachan MWJ. The relationship between type 2 diabetes and cognitive dysfunction: Longitudinal studies and their methodological limitations. European Journal of Pharmacology. 2004;490(1–3):169–175. doi: 10.1016/j.ejphar.2004.02.054. [DOI] [PubMed] [Google Scholar]
- Arvanitakis Z, Wilson RS, Bienias JL, Evans DA, Bennett DA. Diabetes mellitus and risk of Alzheimer disease and decline in cognitive function. Archives of Neurology. 2004;61(5):661–666. doi: 10.1001/archneur.61.5.661. [DOI] [PubMed] [Google Scholar]
- Awad N, Gagnon M, Messier C. The relationship between impaired glucose tolerance, type 2 diabetes, and cognitive function. Journal of Clinical and Experimental Neuropsychology. 2004;26(8):1044–1080. doi: 10.1080/13803390490514875. [DOI] [PubMed] [Google Scholar]
- Bennett DA, Schneider JA, Buchman AS, Barnes LL, Boyle PA, Wilson RS. Overview and findings from the Rush Memory and Aging Project. Current Alzheimer’s Research. 2012;9(6):646–663. doi: 10.2174/156720512801322663. [DOI] [PMC free article] [PubMed] [Google Scholar]
- Biessels GJ, Staekenborg S, Brunner E, Brayne C, Scheltens P. Risk of dementia in diabetes mellitus: A systematic review. The Lancet Neurology. 2006;5(1):64–74. doi: 10.1016/S1474-4422(05)70284-2. [DOI] [PubMed] [Google Scholar]
- Brady CB, Spiro A, III, Gaziano JM. Effects of age and hypertension status on cognition: The Veterans Affairs Normative Aging Study. Neuropsychology. 2005;19(6):770–777. doi: 10.1037/0894-4105.19.6.770. [DOI] [PubMed] [Google Scholar]
- Cahana-Amitay D, Albert ML, Ojo EA, Sayers J, Goral M, Obler LK, Spiro A. Effects of hypertension and diabetes on sentence comprehension in aging. Journals of Gerontology, Series B: Psychological Sciences and Social Sciences. 2013;68(4):513–521. doi: 10.1093/geronb/gbs085. [DOI] [PMC free article] [PubMed] [Google Scholar]
- Chang-Quan H, Hui W, Chao-Min W, Zheng-Rong W, Jun-Wen G, Yong-Hong L, Qing-Xiu L. The association of antihypertensive medication use with risk of cognitive decline and dementia: A meta-analysis of longitudinal studies. The International Journal of Clinical Practice. 65(12):1295–1305. doi: 10.1111/j.1742-1241.2011.02810.x. [DOI] [PubMed] [Google Scholar]
- Cukierman T, Gerstein HC, Williamson JD. Cognitive decline and dementia in diabetes – systematic overview of prospective observational studies. Diabetologia. 2005;48(12):5460–2469. doi: 10.1007/s00125-005-0023-4. [DOI] [PubMed] [Google Scholar]
- Danaei G, Finucane MM, Lu Y, Singh GM, Cowan MJ, Paciorek CJ, Ezzati M. National, regional, and global trends in fasting plasma glucose and diabetes prevalence since 1980: Systematic analysis of health examination surveys and epidemiological studies with 370 country-years and 2.7 million participants. The Lancet. 2011;378(9785):31–40. doi: 10.1016/S0140-6736(11)60679-X. [DOI] [PubMed] [Google Scholar]
- Debling D, Amelang M, Hasselbach P, Stürmer T. Diabetes and cognitive function in a population-based study of elderly women and men. Journal of Diabetes and Its Complications. 2006;20(4):238–245. doi: 10.1016/j.jdiacomp.2005.06.016. [DOI] [PubMed] [Google Scholar]
- Elias PK, Elias MF, D’Agostino RB, Cupples LA, Wilson PW, Silbershatz H, Wolf PA. NIDDM and blood pressure as risk factors for poor cognitive performance. Diabetes Care. 1997;20(9):1388–1395. doi: 10.2337/diacare.20.9.1388. [DOI] [PubMed] [Google Scholar]
- Feil DG, Zhu CW, Sultzer DL. The relationship between cognitive impairment and diabetes self-management in a population-based community sample of older adults with type 2 diabetes. Journal of Behavioral Medicine. 2012;35(2):190–199. doi: 10.1007/s10865-011-9344-6. [DOI] [PubMed] [Google Scholar]
- Fontbonne A, Berr C, Ducimetiére P, Alpérovitch A. Changes in cognitive abilities over a 4-year period are unfavorably affected in elderly diabetic subjects: Results of the Epidemiology of Vascular Aging Study. Diabetes Care. 2001;24(2):366–370. doi: 10.2337/diacare.24.2.366. [DOI] [PubMed] [Google Scholar]
- Freis ED. Historical development of antihypertensive treatment. In: Laragh JH, Brenner BM, editors. Hypertension: Pathophysiology, Diagnosis, and Management. Second. New York: Raven Press Ltd; 1995. pp. 2714–2751. [Google Scholar]
- Gottesman RF, Schneider ALC, Albert M, Alonso A, Bandeen-Roche K, Coker L, Mosley TH. Midlife hypertension and 20-year cognitive change: The Atherosclerosis Risk in Communities Neurocognitive Study. JAMA Neurology. 2014;71(10):1218–1227. doi: 10.1001/jamaneurol.2014.1646. [DOI] [PMC free article] [PubMed] [Google Scholar]
- Gifford KA, Badaracco M, Liu D, Tripodis Y, Gentile A, Lu Z, Jefferson AL. Blood pressure and cognition among older adults: A meta-analysis. Archives of Clinical Neuropsychology. 2013;28(7):649–664. doi: 10.1093/arclin/act046. [DOI] [PMC free article] [PubMed] [Google Scholar]
- Gregg EW, Yaffe K, Cauley JA, Rolka DB, Blackwell TL, Narayan KMV, Cummings SR. Is diabetes associated with cognitive impairment and cognitive decline among older women? Archives of Internal Medicine. 2000;160(2):174–180. doi: 10.1001/archinte.160.2.174. [DOI] [PubMed] [Google Scholar]
- Guan J, Huang C, Li Y, Wan C, You C, Wang Z, Liu Q. No association between hypertension and risk for Alzheimer’s disease: A meta-analysis of longitudinal studies. Journal of Alzheimer’s Disease. 2011;27(4):799–807. doi: 10.3233/JAD-2011-111160. [DOI] [PubMed] [Google Scholar]
- Hassing LB, Grant MD, Hofer SM, Pedersen NL, Nilsson SE, Berg S, McClearn G, Johansson B. Type 2 diabetes mellitus contributes to cognitive decline in old age: A longitudinal population-based study. Journal of the International Neuropsychological Society. 2004b;10(4):599–607. doi: 10.1017/S1355617704104165. [DOI] [PubMed] [Google Scholar]
- Hassing LB, Hofer SM, Nilsson SE, Berg S, Pedersen NL, McClearn G, Johansson B. Comorbid type 2 diabetes mellitus and hypertension exacerbates cognitive decline: Evidence from a longitudinal study. Age and Ageing. 2004a;33(4):355–361. doi: 10.1093/ageing/afh100. [DOI] [PubMed] [Google Scholar]
- Hawkins LA, Kilian S, Firek A, Kashner TM, Firek CJ, Silvet H. Cognitive impairment and medication adherence in outpatients with heart failure. Heart & Lung: The Journal of Acute and Critical Care. 2012;41(6):572–582. doi: 10.1016/j.hrtlng.2012.06.001. [DOI] [PubMed] [Google Scholar]
- Higgins JPT, Green S, editors. 2011 Cochrane handbook for systematic reviews of interventions version 5.1.0. The Cochrane Collaboration; 2011. Retrieved from www.cochrane-handbook.org. [Google Scholar]
- Hofer SM, Piccinin AM. Integrative data analysis through coordination of measurement and analysis protocol across independent longitudinal studies. Psychological Methods. 2009;14(2):150–164. doi: 10.1037/a0015566. [DOI] [PMC free article] [PubMed] [Google Scholar]
- Johansson B, Zarit SH, Berg S. Changes in cognitive functioning in the oldest old. Journals of Gerontology. 1992;47(2):75–80. doi: 10.1093/geronj/47.2.p75. [DOI] [PubMed] [Google Scholar]
- Johnson DK, Storandt M, Balota DA. Discourse analysis of logical memory recall in normal aging and in dementia of the Alzheimer type. Neuropsychology. 2003;17(1):82–92. [PubMed] [Google Scholar]
- Kaerney PM, Whelton M, Reynolds K, Whelton PK, He J. Worldwide prevalence of hypertension: A systematic review. Journal of Hypertension. 2004;22(1):11–19. doi: 10.1097/00004872-200401000-00003. [DOI] [PubMed] [Google Scholar]
- Kennelly S, Collins O. Walking the cognitive “minefield” between high and low blood pressure. Journal of Alzheimer’s Disease. 2012;32(3):609–621. doi: 10.3233/JAD-2012-120748. [DOI] [PubMed] [Google Scholar]
- Kennelly SP, Lawlor BA, Kenny RA. Review: Blood pressure and dementia – A comprehensive review. Therapeutic Advances in Neurological Disorders. 2009;2(4):241–260. doi: 10.1177/1756285609103483. [DOI] [PMC free article] [PubMed] [Google Scholar]
- Köhler S, Baars MAE, Spauwen P, Schievink S, Verhey FRJ, van Boxtel MJP. Temporal evolution of cognitive changes in incident hypertension: Prospective cohort study across the adult age span. Hypertension. 2014;63(2):245–251. doi: 10.1161/HYPERTENSIONAHA.113.02096. [DOI] [PubMed] [Google Scholar]
- Kuo H, Jones RN, Milberg WP, Tennstedt S, Talbot L, Morris JN, Lipsitz LA. Effect of blood pressure and diabetes mellitus on cognitive and physical functions in older adults: A longitudinal analysis of the Advanced Cognitive Training for Independent and Vital Elderly Cohort. Journal of the American Geriatrics Society. 2005;53(7):1154–1161. doi: 10.1111/j.1532-5415.2005.53368.x. [DOI] [PMC free article] [PubMed] [Google Scholar]
- Launer LJ, Hughes T, Yu B, Masaki K, Patrovich H, Ross GW, White LR. Lowering midlife levels of systolic blood pressure as a public health strategy to reduce late-life dementia: Perspective from the Honolulu Heart Program/Honolulu Asia Aging Study. Hypertension. 2010;55(6):1352–1359. doi: 10.1161/HYPERTENSIONAHA.109.147389. [DOI] [PMC free article] [PubMed] [Google Scholar]
- Li G, Rhew IC, Shofer JB, Kukull WA, Breitner JCS, Peskind E, Larson EB. Age-varying association between blood pressure and risk of dementia in those aged 65 and older: A community-based prospective cohort study. Journal of the American Geriatrics Society. 2007;55(8):1161–1167. doi: 10.1111/j.1532-5415.2007.01233.x. [DOI] [PubMed] [Google Scholar]
- Logroscino G, Kang JH, Grodstein F. Prospective study of type 2 diabetes and cognitive decline in women aged 70–81 years. British Medical Journal. 2004;328(7439):548–551. doi: 10.1136/bmj.37977.495729.EE. [DOI] [PMC free article] [PubMed] [Google Scholar]
- Marpillat NL, Macquin-Mavier I, Tropeano A, Bachoud-Levi A, Maison P. Antihypertensive classes, cognitive decline and incidence of dementia: A network meta-analysis. Journal of Hypertension. 2013;31(6):1073–1082. doi: 10.1097/HJH.0b013e3283603f53. [DOI] [PubMed] [Google Scholar]
- McAlister FA, Wilkins K, Joffres M, Leenen FHH, Fodor G, Gee M, Tremblay MS, Walker R, Johansen H, Campbell N. Changes in the rates of awareness, treatment and control of hypertension in Canada over the past two decades. Canadian Medical Association Journal. 2011;183(9):1007–1013. doi: 10.1503/cmaj.101767. [DOI] [PMC free article] [PubMed] [Google Scholar]
- McGuinness B, Toss S, Passmore P, Bullock R. Blood pressure lowering in patients without prior cerebrovascular disease for prevention of cognitive impairment and dementia. Cochrane Database of Systematic Reviews. 2009;4:CD004034. doi: 10.1002/14651858.CD004034.pub3. [DOI] [PMC free article] [PubMed] [Google Scholar]
- Morris JC, Mohs RC, Rogers H, Fillenbaum G, Heyman A. Consortium to establish a registry for Alzheimer’s disease (CERAD): Clinical and neuropsychological assessment of Alzheimer’s disease. Psychopharmacology Bulletin. 1988;24(4):641–652. [PubMed] [Google Scholar]
- Morris MC, Scherr PA, Hebert LE, Glynn RJ, Bennett DA, Evans DA. Association of incident Alzheimer disease and blood pressure measured from 13 years before to 2 years after diagnosis in a large community study. Archives of Neurology. 2001;58(10):1640–1646. doi: 10.1001/archneur.58.10.1640. [DOI] [PubMed] [Google Scholar]
- Moser M. Historical perspectives on the management of hypertension. The Journal of Clinical Hypertension. 2006;8(8 S2):15–20. doi: 10.1111/j.1524-6175.2006.05836.x. [DOI] [PMC free article] [PubMed] [Google Scholar]
- Mount DL. Hypertension associated with neurocognitive performance among persons with types 2 diabetes: A brief report. Mental Health in Family Medicine. 2011;8(4):243–247. [PMC free article] [PubMed] [Google Scholar]
- Muthén LK, Muthén BO. Mplus user’s guide. 7th. Los Angeles, CA: Muthén & Muthén; 1998–2012. [Google Scholar]
- Nilsson SE, Read S, Berg S, Johansson B, Melander A, Lindblad U. Low systolic blood pressure is associated with impaired cognitive function in the oldest old: Longitudinal observations in a population-based sample 80 years and older. Aging Clinical and Experimental Research. 2007;19(1):41–47. doi: 10.1007/BF03325209. [DOI] [PubMed] [Google Scholar]
- Obisesan TO. Hypertension and cognitive function. Clinics In Geriatric Medicine. 2009;25(2):259–288. doi: 10.1016/j.cger.2009.03.002. [DOI] [PMC free article] [PubMed] [Google Scholar]
- Peila R, White LR, Masaki K, Petrovitch H, Launer LJ. Reducing the risk of dementia: Efficacy of long-term treatment of hypertension. Stroke. 2006;37(5):1165–1170. doi: 10.1161/01.STR.0000217653.01615.93. [DOI] [PubMed] [Google Scholar]
- Petrova M, Prokopenko S, Pronina E, Mozheyko E. Diabetes type 2, hypertension and cognitive dysfunction in middle age women. Journal of the Neurological Sciences. 2010;299(1–2):39–41. doi: 10.1016/j.jns.2010.08.057. [DOI] [PubMed] [Google Scholar]
- Piccinin AM, Hofer SM. Integrative Analysis of Longitudinal Studies on Aging: collaborative research networks, meta-analysis, and optimizing future studies. In: Hofer SM, Alwin DF, editors. Handbook on Cognitive Aging: Interdisciplinary Perspectives. Thousand Oaks, CA: Sage Publications, Inc; 2008. pp. 446–476. [Google Scholar]
- Power MC, Weuve J, Gagne JJ, McQueen MB, Viswanathan A, Blacker D. The association between blood pressure and incident Alzheimer disease. Epidemiology. 2011;22(5):646–659. doi: 10.1097/EDE.0b013e31822708b5. [DOI] [PMC free article] [PubMed] [Google Scholar]
- Psaty BM, Manolio TA, Smith NL, Heckbert SR, Gottdiener JS, Burke GL, Furberg CD. Time trends in high blood pressure control and the use of antihypertensive medications in older adults: The Cardiovascular Health Study. Archives of Internal Medicine. 2002;162(20):2325–2332. doi: 10.1001/archinte.162.20.2325. [DOI] [PubMed] [Google Scholar]
- Public Health Agency of Canada. (Catalogue number: HP32-4/2010E-PDF).Report from the Canadian Chronic Disease Surveillance System: Hypertension in Canada. 2010 Retrieved from: http://www.phac-aspc.gc.ca/cd-mc/cvd-mcv/ccdss-snsmc-2010/index-eng.php.
- Public Health Agency of Canada. (Catalogue number: HP35-25/2011E-PDF).Diabetes in Canada: Facts and figures from a public health perspective. 2011 Retrieved from: http://www.phac-aspc.gc.ca/cd-mc/publications/diabetes-diabete/facts-figures-faits-chiffres-2011/index-eng.php.
- Qiu C, Winblad B, Fratiglioni L. The age-dependent relation of blood pressure to cognitive function and dementia. The Lancet Neurology. 2005;4(8):487–499. doi: 10.1016/S1474-4422(05)70141-1. [DOI] [PubMed] [Google Scholar]
- Rastas S, Pirttilä T, Mattila K, Verkkoniemi A, Juva K, Niinistö E, Sulkava R. Vascular risk factors and dementia in the general population aged > 85 years: Prospective population-based study. Neurobiology of Aging. 2010;31(1):1–7. doi: 10.1016/j.neurobiolaging.2008.02.020. [DOI] [PubMed] [Google Scholar]
- Ruitenberg A, Skoog I, Otta A, Aevarsson O, Witteman JCM, Lernfelt B, Breteler MMB. Blood pressure and risk of dementia: Results from the Rotterdam Study and the Gothenburg H-70 Study. Dementia and Geriatric Cognitive Disorders. 2001;12(1):33–39. doi: 10.1159/000051233. [DOI] [PubMed] [Google Scholar]
- Shah K, Qureshi SU, Johnson M, Parikh N, Schulz PE, Kunik ME. Does use of antihypertensive drugs affect the incidence or progression of dementia? A systematic review. The American Journal of Geriatric Pharmacotherapy. 2009;7(5):250–261. doi: 10.1016/j.amjopharm.2009.11.001. [DOI] [PubMed] [Google Scholar]
- Spauwen PJJ, Köhler S, Verhey FRJ, Stehouwer CDA, van Boxtel MPJ. Effects of type 2 diabetes on 12-year cognitive change: Results from the Maastricht Aging Study. Diabetes Care. 2013;36(6):1554–1561. doi: 10.2337/dc12-0746. [DOI] [PMC free article] [PubMed] [Google Scholar]
- Steptoe A, Breeze E, Banks J, Nazroo J. Cohort profile: The English Longitudinal Study of Ageing. International Journal of Epidemiology. 2012;42(6):1640–1648. doi: 10.1093/ije/dys168. [DOI] [PMC free article] [PubMed] [Google Scholar]
- Verghese J, Lipton RB, Hall CB, Kuslansky G, Katz MJ. Low blood pressure and the risk of dementia in very old individuals. Neurology. 2003;61(12):1667–1672. doi: 10.1212/01.wnl.0000098934.18300.be. [DOI] [PubMed] [Google Scholar]
- Wainer H. The centercept: An estimable and meaningful regression parameter. Psychological Science. 2000;11(5):434–436. doi: 10.1111/1467-9280.00284. [DOI] [PubMed] [Google Scholar]
- Wechsler D. Wechsler Memory Scale – revised manual. New York, USA: Psychological Corporation; 1987. [Google Scholar]
- Wechsler D. Manual for the Wechsler Adult Intelligence Scale – revised. New York, USA: Psychological Corporation; 1991. [Google Scholar]
- Xu WL, von Strauss E, Qiu CX, Winblad B, Fratiglioni L. Uncontrolled diabetes increases the risk of Alzheimer’s disease: A population-based study. Diabetologia. 2009;52(6):1031–1039. doi: 10.1007/s00125-009-1323-x. [DOI] [PubMed] [Google Scholar]
Associated Data
This section collects any data citations, data availability statements, or supplementary materials included in this article.