

Abstract
Inhibition of dipeptidyl peptidase-IV (DPP-4) enzyme activity has been revealed to protect myocardium from ischemia-reperfusion through enhancing the endogenous glucagon-like peptide-1 (GLP-1) level. However, whether exogenous supply of exendin-4, an analogue of GLP-1, would still offer benefit for protecting myocardial damage from trans-aortic constriction (TAC)-induced hypertrophic cardiomyopathy in preexistence of DPP-4 deficiency (DPP-4D) remained unclear. Male-adult (DPP-4D) rats (n = 32) were randomized into group 1 [sham control (SC)], group 2 (DPP-4D + TAC), group 3 [DPP-4D + TAC + exendin-4 10 µg/day], and group 4 [DPP-4D + TAC + exendin-4 10 µg + exendin-9-39 10 µg/day]. The rats were sacrificed by day 60 after last echocardiographic examination. By day 60 after TAC, left ventricular ejection fraction (LVEF) (%) was highest in group 1 and lowest in group 2, and significantly lower in group 4 than that in group 3 (all p < 0.001). The protein expressions of oxidative stress (oxidized protein, NOX-1, NOX-2), inflammatory (MMP-9, TNF-α, NF-κB), apoptotic (Bax, cleaved caspase 3 and PARP), fibrotic (TGF-β, Smad3), heart failure (BNP, β-MHC), DNA damaged (γ-H2AX) and ischemic stress (p-P38, p-Akt, p53, ATM) biomarkers showed an opposite pattern of LVEF among the four groups (all p < 0.03). Fibrotic area (by Masson’s trichrome, Sirius red), and cellular expressions of DNA-damaged markers (Ki-67+, γ-H2AX+, CD90+/53BP1+) displayed an identical pattern, whereas cellular expressions of angiogenesis (CD31+, α-SMA+) and sarcomere length exhibited an opposite pattern compared to that of oxidative stress among the four groups (all p < 0.001). Take altogether, Exendin-4 effectively suppressed TAC-induced pathological cardiac hypertrophy in DPP-4D rat.
Keywords: Dipeptidyl peptidase-IV enzyme deficiency, transverse aortic constriction, hypertrophic cardiomyopathy, DNA damage signaling, glucagon-like peptide-1 analogue
Introduction
Cardiac hypertrophy is well recognized as an abnormal increase in heart muscle mass and functionally, mechanistically, and histologically differs from that of the normal embryonic and postnatal myocardial growth by characteristic changes in cardiomyocyte shape and volume rather than a change in the number of cardiomyocytes [1]. Pathological hypertrophic cardiomyopathy (PHC), a phenotypical increase in size and mass of cardiomyocytes, is the result of a complex network of signaling transduction involved in the regulation of cardiomyocyte growth and the reactivation of fetal gene program triggered by stress burden, such as pressure overload, volume overload, oxidative stress, metabolism disorder, and hypoxia [2-5]. Importantly, without appropriate treatment, PHC progressively induces interstitial fibrosis in myocardium, cardiac dysfunction, cardiomyocyte death, and eventual overt heart failure (HF) [6]. Intriguingly, although tremendous progress has been made in our understanding of the signaling network involved in cardiac hypertrophy in recent years, the whole picture of pathogenesis is still unclear.
An interesting finding is that blockade of DPP-4 enzyme activity by either exogenous property or endogenous administration has been demonstrated to enhance endothelial progenitor cell mobilization and angiogenesis and protect the kidneys and the heart from ischemia-reperfusion injury, suggesting increases in circulating levels of stromal cell-derived factor (SDF)-1α and glucagon-like peptide-1 (GLP-1) as possible underlying mechanisms [7-10]. Additionally, exogenous administration of GLP-1 analogue has also been revealed to protect organs from ischemic or ischemia-reperfusion injury attributable to its anti-oxidative stress, anti-apoptotic and anti-inflammatory effects [10,11]. Recently, our study has shown that DPP-4 deficient (DPP-4D) rats possess the ability of cardiac protection against acute ischemia-reperfusion injury [9]. However, whether exendin-4, a GLP-1 analogue, could offer an additional benefit to DPP-4D rats in protecting from transverse aortic constriction (TAC)-induced PHC is still unclear. Accordingly, this study used the DPP-4D rats and a TAC experimental model of PHC to test the hypothesis that exendin-4 therapy provides an additional benefit for DPP-4D rats in protecting against myocardial injury in the setting of TAC-induced PHC.
Materials and methods
Ethics
Animal grouping and induction of pathological hypertrophic cardiomyopathy by transverse aortic constriction
All animal experimental procedures were approved by the Institute of Animal Care and Use Committee at Kaohsiung Chang Gung Memorial Hospital (Affidavit of Approval of Animal Use Protocol No. 2012032602) and performed in accordance with the Guide for the Care and Use of Laboratory Animals (NIH publication No. 85-23, National Academy Press, Washington, DC, USA, revised 1996).
Pathogen-free, adult male DPP4-deficiency rats (DPP-4D, i.e., DPP-4 mutant of Fischer 344; n = 32) weighing 300-325 g (Charles River Technology, BioLASCO, Taiwan) were equally divided into group 1 [sham control (SC)], group 2 (TAC only), group 3 [TAC + exendin-4 (Ex-4)/10 μg/kg/day, i.p.], and group 4 [TAC + Ex4 + exendin-9-39 (Ex-9-39) i.p.]. The purpose of administration of exendin-9-39, an antagonist of exendin-4, was to test if the protective effect of exendin-4 against TAC-induced PHC was essential in DPP-4D animals. The exendin-4 and exendin-9-39 were administered from days 14 to 60 after TAC procedure. The dosage of exendin-4 utilized in the present study was based on our previous study [12].
All animals were placed in a supine position under anesthesia with 2.0% inhalational isoflurane on a warming pad at 37°C and then intubated with positive-pressure ventilation (180 mL/min) with room air using a small animal ventilator (SAR-830/A, CWE, Inc., USA) for the TAC procedure. Under sterile conditions, the heart was exposed via a left thoracotomy. TAC was induced in groups 2, 3, and 4 animals by tying the ascending aorta with a piece of 7-0 prolene on a 25# needle between the aortic arch (after right common carotid artery) and left common carotid artery. The needle was then removed, leaving a constricted aorta. These rats were then assigned to groups 2 to 4 respectively. Only a left thoracotomy without TAC was performed for group 1 animals. After the procedure, the thoracotomy wound was closed and the animals were allowed to recover from anaesthesia in a portable animal intensive care unit (ThermoCare®) for 24 hours.
A pilot study for supporting the feasibility of TAC experimental model
To elucidate the validity of the TAC-induced PHC model in DPP-4D animals, eight additional animals underwent the TAC procedure. Serial transthoracic echocardiography was performed prior to and after the TAC procedure (i.e., by days 0, 14 and 60) to the animals. The results demonstrated hypertrophic myocardium [i.e., increased the interventricular septum (IVS) and LV posterior wall] by day 14 after the procedure. By day 60, prominent concentric LV hypertrophy with preservation of the heart function mild LV chamber dilatation was identified. Thus a PHC rather dilated cardiomyopathy was successfully created in the current study (please see Figure 1 and the Table 1 results). The animals were sacrificed by days 14 and 60, respectively for assessing the activated DNA damage signaling pathway (i.e., γ-H2AX, Akt, ATM) (please see Figure 2).
Figure 1.
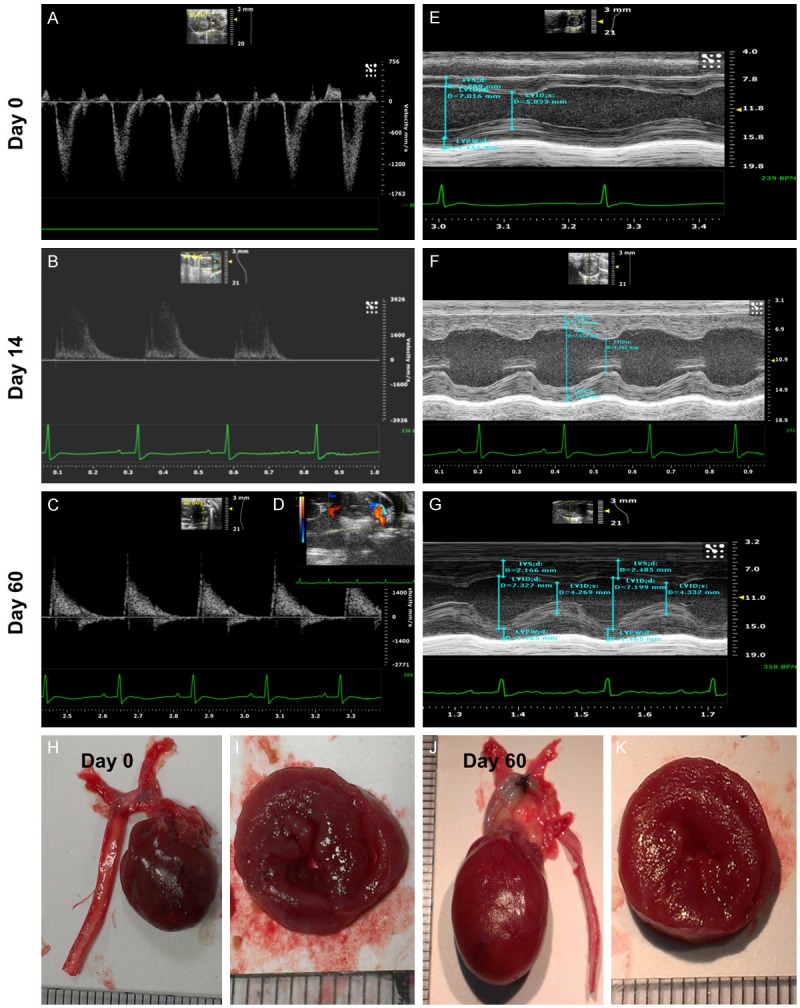
Echocardiography and pathological findings provided evidence of pathological hypertrophic cardiomyopathy (PHC). (A-C) Illustrating the transthoracic echo Doppler findings of velocity of blood flow in ascending aorta of DPP-4 deficiency rats at baseline and by days 14 and 60 after transverse aortic constriction (TAC) procedure. The results showed that the velocity was notably increased at day 14 and more remarkably increased by day 60 after TAC procedure as compared with the baseline level. The systolic blood flow velocity of ascending aorta at baseline, and days 14 and 60 after TAC, was < 100 mm/s, 3500 mm/s and 4200 mm/s, respectively. (D) The transthoracic echocardiography showed remarkably mosaic turbulence blood flow in ascending aorta by day 60 after TAC procedure. (E-G) M-mode showing the thickness of interventricular septum (IVC) and posterior wall of left ventricle were notably increased by day 14 and further remarkably increased by day 60 after TAC induction as compared with baseline level in the DPP-deficiency rat. (H and J) The anatomical finding showing the appearance of whole heart size in DPP-deficiency rat was remarkably larger by day 60 after TAC induction as compared with animal without receiving TAC procedure. (I and K) The pathological finding (i.e., cross section picture at papillary muscle level) showed the notably concentric hypertrophy of LV muscle at day 60 (K) as compared with day 0 (I). Data from (A-K) suggesting the TAC model for inducing PHC was successfully created.
Table 1.
Transthoracic echocardiographic findings prior to and by day 60 after transverse aortic constriction
| Variable | Group 1 (n = 10) | Group 2 (n = 10) | Group 3 (n = 10) | Group 4 (n = 10) | p-value |
|---|---|---|---|---|---|
| Day 0 | |||||
| IVS thickness (mm) | 1.27 ± 0.21 | 1.28 ± 0.15 | 1.29 ± 0.19 | 1.24 ± 0.17 | 0.526 |
| PW thickness (mm) | 1.19 ± 0.23 | 1.22 ± 0.22 | 1.19 ± 0.25 | 1.21 ± 0.28 | 0.758 |
| LVEDD (mm) | 7.05 ± 0.82 | 7.01 ± 0.24 | 7.01 ± 0.61 | 7.02 ± 0.92 | 0.822 |
| LVESD (mm) | 3.84 ± 0.75 | 3.85 ± 0.25 | 3.75 ± 0.94 | 3.76 ± 0.67 | 0.558 |
| LVEDV (µL) | 335.60 ± 73.90 | 325.80 ± 90.10 | 323.70 ± 72.10 | 329.30 ± 87.40 | 0.810 |
| LVESV (µL) | 90.40 ± 15.40 | 91.20 ± 10.70 | 87.30 ± 19.50 | 89.30 ± 14.30 | 0.664 |
| LVFS (%) | 47.92 ± 2.77 | 46.69 ± 2.43 | 46.24 ± 3.33 | 48.69 ± 3.19 | 0.436 |
| LVEF (%) | 73.52 ± 3.30 | 72.81 ± 2.70 | 72.36 ± 2.30 | 74.78 ± 3.50 | 0.526 |
| By day 60 after TAC | |||||
| IVS thickness (mm) | 1.34 ± 0.05a | 2.08 ± 0.26b | 1.29 ± 0.19 | 1.87 ± 0.14b,c | < 0.001 |
| PW thickness (mm) | 1.20 ± 0.51a | 1.57 ± 0.99b | 1.19 ± 0.25 | 1.41 ± 0.24b,c | < 0.001 |
| LVEDD (mm) | 7.08 ± 0.12a | 7.37 ± 0.74b | 7.01 ± 0.61 | 7.23 ± 0.46c | < 0.001 |
| LVESD (mm) | 3.95 ± 0.11a | 4.37 ± 0.15b | 3.75 ± 0.94 | 4.24 ± 0.24b | < 0.001 |
| LVEDV (µL) | 337.20 ± 33.50a | 396.50 ± 21.10b | 323.70 ± 72.10 | 379.40 ± 81.10c | < 0.001 |
| LVESV (µL) | 97.00 ± 13.20a | 150.10 ± 21.30b | 87.30 ± 19.50 | 136.60 ± 40.30b | < 0.001 |
| LVFS (%) | 47.91 ± 1.27a | 40.95 ± 2.76b | 46.24 ± 3.33 | 41.46 ± 1.02b | < 0.001 |
| LVEF (%) | 72.22 ± 0.90a | 62.91 ± 2.30b | 72.36 ± 2.30 | 65.25 ± 1.10d | < 0.001 |
Data are expressed as mean ± SD or %. Group 1 = DPP-4D; Group 2 = DPP-4D + TAC; Group 3 = DPP-4D + TAC + Extendin-4; Group 4 = DPP-4D + TAC + Extendin-4 + EX39-9. Dipeptidyl peptidase-IV deficiency = DPP-4D; LVEDD = left ventricular end-diastolic dimension; LVESD = left ventricular end-systolic dimension; LVEDV = left ventricular end-diastolic volume; LVESV = left ventricular end-systolic volume; LVFS = left ventricular fractional shortening; LVEF = left ventricular ejection fraction. All statistical analyses using one-way ANOVA, followed by Bonferroni multiple comparison post hoc test.
indicates significance (at 0.05 level);
indicates significance (at 0.05 level);
indicates significance (at 0.05 level);
indicates significance (at 0.05 level).
Figure 2.
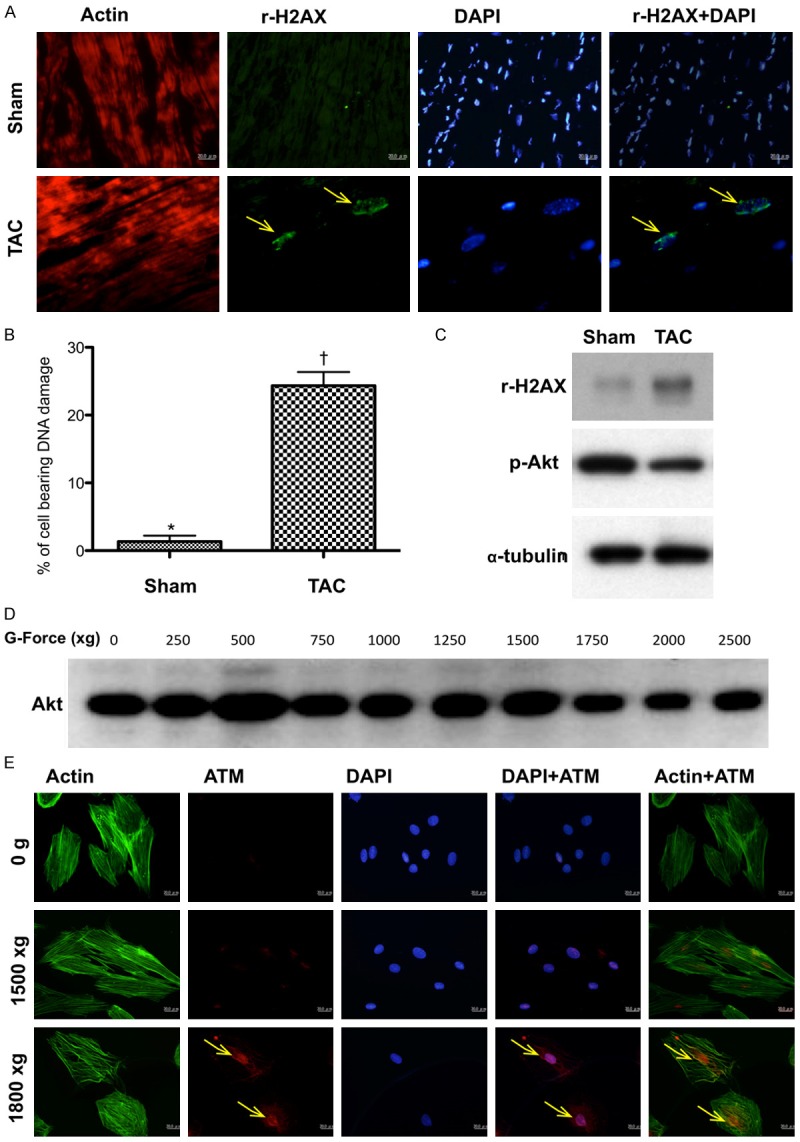
The results of pilot experimental and in vitro studies for proving pressure overload activated DNA damage signaling (Figures 1, 2 and 3) (n = 6). A. Immunofluorescent (IF) microscopic (200x) finding for identification of γ-H2AX+ cells (yellow arrows) in sham controls and in animals after day-60 transverse aortic constriction (TAC) procedure. B. Statistical results showing the percentage of cell bearing DNA damage was significantly higher in TAC group than in sham control, * vs. †, p < 0.0001. C. By day 60 after TAC procedure, the protein expression of γ-H2AX was notably increased whereas the protein expression of phosphorylated (p)-Akt was remarkably reduced in TAC animals than in sham-control animals. D. In vitro study showing that the protein expressions of Akt was notably inhibited after the gravity (G) force was increased up to ≥ 1500. E. The number of ATM+ cellular expression (yellow arrows) was notably stepwise increase after increased G force application to the H9C2 cells.
The blood samples were collected by day 60 prior to sacrifice the animals for measuring the circulating GLP-1 level. This measurement was in order to find out that if the elevation of GLP-1 level was not enough after TAC to protect the myocardial damage against TAC-induced PHC (please see Figure 3E). Accordingly, the exdenin-4 treatment might provide an additional benefit for those of TAC animals.
Figure 3.
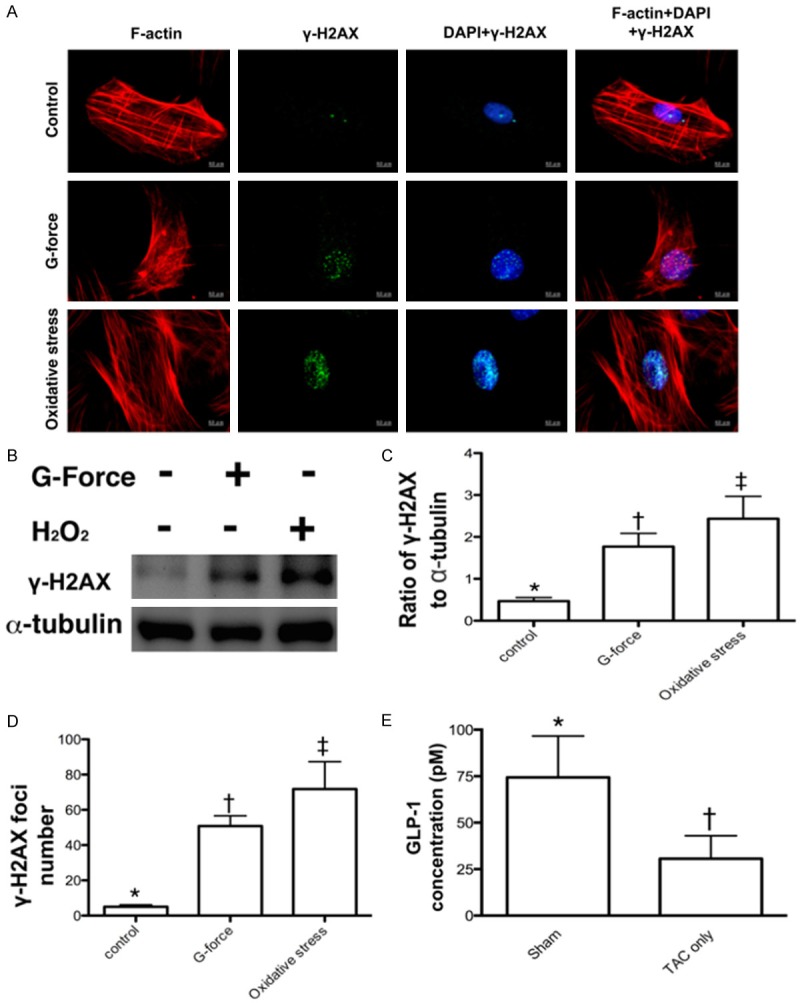
Compared the protein and cellular expressions of γ-H2AX after the G force (2500 xg) application and 30-minute H2O2 (200 µM) treatment (n = 6) and determined the circulating GLP-1 level by day 60 after TAC procedure (n = 4). A. Confocal microscopic (400x) finding for the expressions of γ-H2AX+ cells in situations of control, G force, and H2O2 treatment, respectively. B. The protein expression of γ-H2AX was remarkably higher in G force treatment and more remarkably higher in H2O2 treatment as compared with the control. C. Analytical result of the ratio of γ-H2AX to α-tubulin, * vs. other groups with different symbols (*, †, ‡), p < 0.001. D. Analytical result of counted γ-H2AX foci formation (green color), * vs. other groups with different symbols (*, †, ‡), p < 0.0001. E. Analytical result of day-60 circulating glucagon-like peptide (GLP)-1 level, * vs. †, p = 0.047. All statistical analyses were performed by one-way ANOVA, followed by Bonferroni multiple comparison post hoc test. Symbols (*, †, ‡) indicate significance (at 0.05 level).
Functional assessment by echocardiography
Transthoracic echocardiography was performed in each group prior to and on day 60 after myocardial IR induction. The procedure was performed by an animal cardiologist blind to the experimental design using an ultrasound machine (Vevo 2100, Visualsonics). M-mode standard two-dimensional (2D) left parasternal-long axis echocardiographic examination was conducted. Left ventricular internal dimensions [i.e., left ventricular end-systolic diameter (LVESd) and left ventricular end-diastolic diameter (LVEDd)] were measured at mitral valve and papillary levels of left ventricle, according to the American Society of Echocardiography leading-edge method using at least three consecutive cardiac cycles. Left ventricular ejection fraction (LVEF) was calculated as follows: LVEF (%) = [(LVEDd3-LVESd3)/LVEDd3] x 100%.
Western blot study
The procedure and protocol for Western blot analysis were based on our recent reports [7,9,13]. Briefly, equal amounts (50 μg) of protein extracts were loaded and separated by SDS-PAGE using acrylamide gradients. After electrophoresis, the separated proteins were transferred electrophoretically to a polyvinylidene difluoride (PVDF) membrane (Amersham Biosciences). Nonspecific sites were blocked by incubation of the membrane in blocking buffer [5% nonfat dry milk in T-TBS (TBS containing 0.05% Tween 20)] overnight. The membranes were incubated with the indicated primary antibodies [Bax (1:1000, Abcam), cleaved poly (ADP-ribose) polymerase (PARP) (1:1000, Cell Signaling), caspase 3 (1:1000, Cell Signaling), tumor necrotic factor (TNF)-α (1:1000, Cell Signaling), nuclear factor (NF)-κB (1:250, Abcam), matrix metalloproteinase (MMP)-9 (1:3000, Abcam), NADPH oxidase (NOX)-1 (1:1500, Sigma), NOX-2 (1:500, Sigma), Smad3 (1:1000, Cell Signaling), transforming growth factor (TGF)-β (1:500, Abcam), Smad5 (1:1000, Cell Signaling), bone morphogenetic protein (BMP)-2 (1:1000, Abcam), Phosphorylation of histone H2AX (γ-H2AX) (1:1000, Cell Signaling), Protein expression of peroxisome proliferator-activated receptor gamma coactivator-1α (PGC-1α) (1:1000, Abcam), alpha myosin heavy chain (α-MHC) (1:300, Santa Cruz), β-MHC (1:1000, Santa Cruz), brain natriuretic peptide (BNP) (1:800, Abcam), ataxia telangiectasia mutated kinase (ATM) (1:1000, Cell Signaling), p38 (1:1000, Abcam), p53 (1:300, Santa Cruz), Akt (1:1000, Cell Signaling), endothelial nitric oxide synthase (eNOS) (1:1000, Abcam), and glucagon-like peptide-1 receptor (GLP-1R) (1:1000, abcam)] for 1 hour at room temperature. Horseradish peroxidase-conjugated anti-rabbit immunoglobulin IgG (1:2000, Cell Signaling) was used as a secondary antibody for one-hour incubation at room temperature. The washing procedure was repeated eight times within one hour. Immunoreactive bands were visualized by enhanced chemiluminescence (ECL; Amersham Biosciences) and exposed to Biomax L film (Kodak). For the purpose of quantification, ECL signals were digitized using Labwork software (UVP).
Oxidative stress measurement of LV myocardium
The procedure and protocol for assessing the protein expression of oxidative stress have been described in details in our previous report [7,9,13]. The Oxyblot Oxidized Protein Detection Kit was purchased from Chemicon (S7150). DNPH derivatization was carried out on 6 μg of protein for 15 minutes according to the manufacturer’s instructions. One-dimensional electrophoresis was carried out on 12% SDS/polyacrylamide gel after DNPH derivatization. Proteins were transferred to nitrocellulose membranes which were then incubated in the primary antibody solution (anti-DNP 1:150) for 2 hours, followed by incubation in secondary antibody solution (1:300) for 1 hour at room temperature. The washing procedure was repeated eight times within 40 minutes. Immunoreactive bands were visualized by enhanced chemiluminescence (ECL; Amersham Biosciences) which was then exposed to Biomax L film (Kodak). For quantification, ECL signals were digitized using Labwork software (UVP). For oxyblot protein analysis, a standard control was loaded on each gel.
Immunofluorescent (IF) and immunohistochemical (IHC) staining
IF staining was performed using respective primary antibodies for the examinations of CD31+ (1:100, Abcam), γ-H2AX+ (1:500, Abcam), Ki-67+ (1:100, Abcam), and CD90+/53BP1+ (1:100, Abcam; 1:300, Novus) cells and Actinin-phalloidin (1:500, LuBio Science; 1:500, Life Technologies) in LV myocardium based on our recent study [7,9-13]. Moreover, IHC staining was performed for examinations of Sca-1+ (1:300, BioLegend) and C-kit+ (1:300, Santa Cruz) cells using respective primary antibodies as described [7,9,11,13]. Irrelevant antibodies were used as controls in the current study.
Histological quantification of myocardial fibrosis and collagen deposition
The procedure and protocol was described in details in our previous report [9,11]. Briefly, Masson’s trichrome staining was used for identifying the fibrosis of LV myocardium, respectively. Three serial sections of LV myocardium in each animal at the same levels were prepared at 4 µm thickness by Cryostat (Leica CM3050S). The integrated area (µm2) of infarct area and fibrosis on each section were calculated using the Image Tool 3 (IT3) image analysis software (University of Texas, Health Science Center, San Antonio, UTHSCSA; Image Tool for Windows, Version 3.0, USA). Three randomly selected high-power fields (HPFs) (100 x) were analyzed in each section. After determining the number of pixels in each infarct and fibrotic area per HPF, the numbers of pixels obtained from three HPFs were summated. The procedure was repeated in two other sections for each animal. The mean pixel number per HPF for each animal was then determined by summating all pixel numbers and dividing by 9. The mean integrated area (µm2) of fibrosis in LV myocardium per HPF was obtained using a conversion factor of 19.24 (1 µm2 represented 19.24 pixels).
To analyze the extent of collagen synthesis and deposition, cardiac paraffin sections (6 µm) were stained with picrosirius red (1% Sirius red in saturated picric acid solution) for one hour at room temperature using standard methods. The sections were then washed twice with 0.5% acetic acid. The water was physically removed from the slides by vigorous shaking. After dehydration in 100% ethanol thrice, the sections were cleaned with xylene and mounted in a resinous medium. High power fields (×100) of each section were used to identify Sirius red-positive area on each section. Analyses of collagen deposition area in LV myocardium were identical to the description for the calculations of the infarct and fibrotic areas.
Vessel density in LV myocardium
The procedure and protocol for identification of small vessel in heart infarct area were based on our previous reports [11]. In details, IHC staining of small blood vessels was performed with primary antibody against α-SMA (1:400) at room temperature for 1 hour, followed by washing with PBS thrice. Ten minutes after the addition of anti-mouse-HRP conjugated secondary antibody, the tissue sections were washed with PBS thrice. Then 3,3’ diaminobenzidine (DAB) (0.7 gm/tablet) (Sigma) was added, followed by washing with PBS thrice after one minute. Finally, hematoxylin was added as a counter-stain for nuclei, followed by washing twice with PBS after one minute. Three heart sections were analyzed in each rat. For quantification, three randomly selected HPFs (100x) were analyzed in each section. The mean number per HPF for each animal was then determined by summation of all numbers divided by 9.
Statistical analysis
Quantitative data are expressed as means ± SD. Statistical analysis was adequately performed by ANOVA followed by Bonferroni multiple-comparison post hoc test. SAS statistical software for Windows version 8.2 (SAS institute, Cary, NC) was utilized. A probability value < 0.05 was considered statistically significant.
Results
Pilot experimental and in vitro studies for determining the pressure overload induced pathological hypertrophic cardiomyopathy (PHC), DNA damage signaling, and circulating GLP-1 level
The results of echocardiography (Figure 1) in pilot study showed that the LVEF was preserved in TAC animals as compared to the control animals by day 60 after TAC procedure. However, thickness of interventricular septum (IVS) and LV posterior wall were notably increased in TAC animals than in normal controls. Additionally, the heart size was grossly increased and the cross-section of the heart at papillary level showed a notably concentric hypertrophic appearance of left ventricle in TAC animals as compared to those in normal controls (Figure 1).
By day 60, the cellular and protein levels of γ-H2AX in myocardium, an indicator of DNA damage, were markedly increased, whereas the protein expression of phosphorylated (p)-Akt was notably downregulated (Figure 2).
To determine whether ATM and Akt signalings (i.e., two downstream signaling of DNA damage) were upregulated and downregulated, respectively, pressure (created by gravity force) was applied to H9C2 cell line (i.e., cardioblasts) with a stepwise-increase in gravity force (Figures 2 and 3). The results revealed that cellular expression of ATM was remarkably increased, whereas the protein expression of Akt was markedly attenuated when the gravity force was applied up to 1800 g (Figure 2). Furthermore, the cellular and protein expressions of γ-H2AX in H9C2 cells were substantially increased when a similar gravity force was applied or underwent an oxidative stress (Figure 3). Moreover, by day 60, the circulating of GLP-1 was significantly lower in TAC animals than those of sham control animals (Figure 3E). This finding was reasonably to support the benefit of utilizing extendin-4 for those TAC animals.
Echocardiographic findings of heart function prior to and by day 60 after TAC procedure among the four group animals (Table 1)
By day 0 prior to TAC procedure, the LVEF, LVEDD, LVESD, left ventricular left ventricular end-diastolic volume (LVEDV), left ventricular end-systolic volume (LVESV), left ventricular fractional shortening (LVFS), thickness of interventricular septum (IVS) and LV posterior wall did not differ among the four groups. However, by day 60 after TAC procedure, the IVS and LV posterior wall was thickest in group 2 (TAC only) and thinnest in group 1 (SC), but they showed no difference between and group 3 (TAC + exendin-4) and group 4 (TAC + exendin-4 + exendin-9-39), or between groups 2 and 4. Additionally, the LVEDD and LVEDV were significantly higher in group 2 than in other groups, and significantly higher in groups 3 and 4 than in group 1, but they showed no difference between groups 3 and 4. Furthermore, LVESD and LVESV were significantly higher in groups 2 and 4 than in groups 1 and 3, but they showed no difference between the former or later two groups. Moreover, the LVFS was significantly higher in group 1 than in other groups, significantly higher in group 3 than in groups 2 and 4, but it exhibited no difference between the later two groups. Finally, the LVEF was highest in group 1 and lowest in group 2, and significantly higher in group 3 than in group 4. These findings implicate that exendin-4 treatment preserved LVEF and prevented LV remodeling.
Exendin-4 therapy suppressed the protein expression of oxidative stress and inflammatory biomarkers in myocardium by day 60 after TAC (Figure 4)
Figure 4.
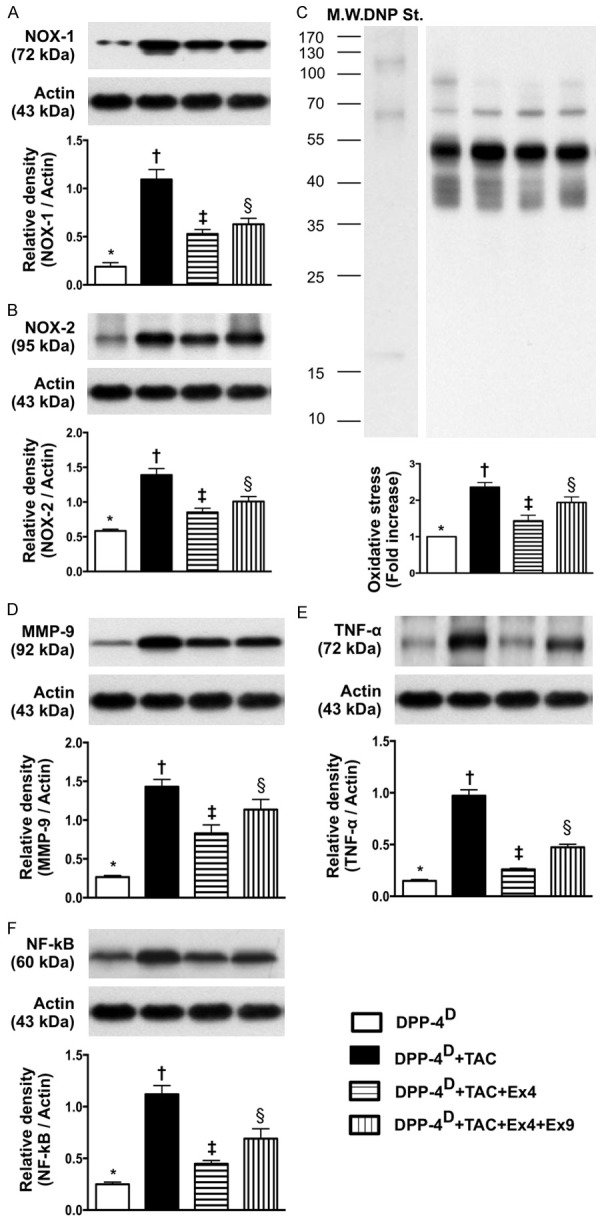
Protein expressions of oxidative stress and inflammatory biomarkers in myocardium by day 60 after transverse aortic constriction (TAC) procedure (n = 10). A. Protein expression of NOX-1, * vs. other groups with different symbols (*, †, ‡, §), p < 0.0001. B. Protein expression of NOX-2, * vs. other groups with different symbols (*, †, ‡, §), p < 0.001. C. The oxidized protein expression, * vs. other groups with different symbols (*, †, ‡, §), p < 0.001. (Note: left lanes shown on the upper panel represent protein molecular weight marker and control oxidized molecular protein standard, respectively). M.W = molecular weight; DNP = 1-3 dinitrophenylhydrazone. D. Protein expression of matrix metalloproteinase (MMP)-9, * vs. other groups with different symbols (*, †, ‡, §), p < 0.0001. E. Protein expression of tumor necrosis factor (TNF)-α, * vs. other groups with different symbols (*, †, ‡, §), p < 0.001. F. Protein expression of nuclear factor (NF)-α, * vs. other groups with different symbols (*, †, ‡, §), p < 0.001. All statistical analyses were performed by one-way ANOVA, followed by Bonferroni multiple comparison post hoc test. Symbols (*, †, ‡) indicate significance (at 0.05 level). DPP-4D = dipeptidyl peptidase-4 deficiency; Ex4 = exendin-4; Ex9 = exendin-9-39; HPF = high-power field.
The protein expressions of NOX-1 and NOX-2, two indicators of oxidative stress, were highest in group 2 and lowest in group 1, and significantly lower in group 3 than those in group 4. Moreover, the protein expressions of MMP-9, TNF-α, and NF-κB, three indices of inflammation, exhibited an identical pattern compared to that of oxidative stress.
Exendin-4 Therapy Suppressed the Protein Expressions of Apoptosis and Fibrosis and Upregulated anti-Fibrotic Biomarkers in Myocardium by Day 60 after TAC (Figure 5)
Figure 5.
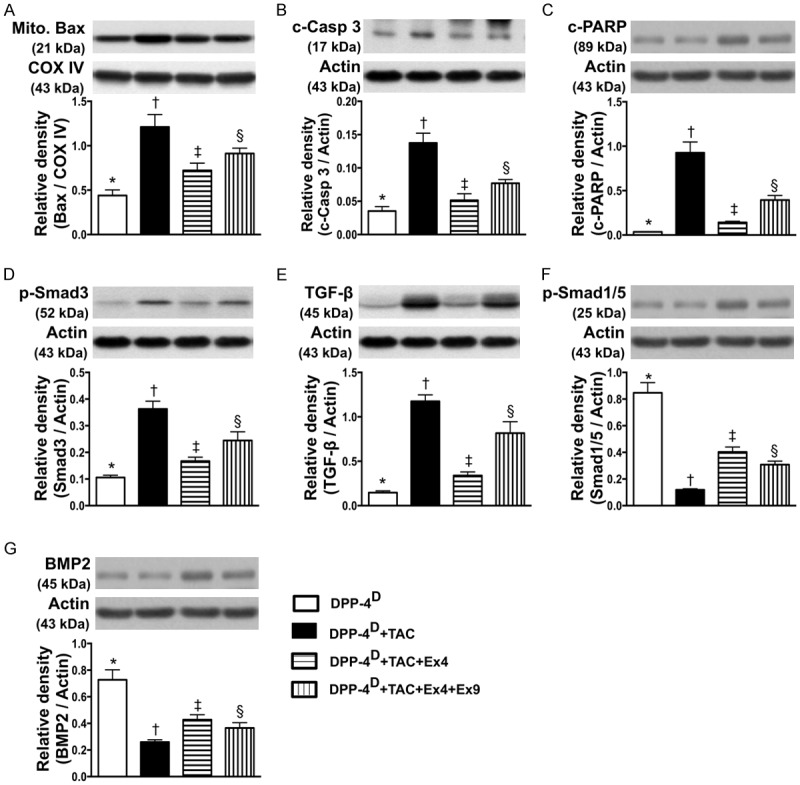
Protein expressions of apoptosis, fibrosis and anti-fibrotic biomarkers in myocardium by day 60 after TAC procedure (n = 10). A. Protein expression of mitochondrial Bax, * vs. other groups with different symbols (*, †, ‡, §), p < 0.001. B. Protein expression of cleaved (c) caspase 3, * vs. other groups with different symbols (*, †, ‡, §), p<0.001. C. Protein expression of cleaved poly (ADP-ribose) polymerase (c-PARP), * vs. other groups with different symbols (*, †, ‡, §), p < 0.0001. D. Protein expression of phosphorylated (p)-Smad3, * vs. other groups with different symbols (*, †, ‡, §), p < 0.001. E. Protein expression of transforming growth factor (TGF)-β, * vs. other groups with different symbols (*, †, ‡, §), p < 0.0001. F. Protein expression of p-Samd1/5, * vs. other groups with different symbols (*, †, ‡, §), p < 0.0001. G. Protein expression of bone morphogenesis protein (BMP)-2, * vs. other groups with different symbols (*, †, ‡, §), p < 0.0001. All statistical analyses were performed by one-way ANOVA, followed by Bonferroni multiple comparison post hoc test. Symbols (*, †, ‡) indicate significance (at 0.05 level). DPP-4D = dipeptidyl peptidase-4 deficiency; Ex4 = exendin-4; Ex9 = exendin-9-39; HPF = high-power field.
The protein expressions of mitochondrial Bax, cleaved caspase 3 and PARP, three indicators of apoptosis, were highest in group 2 and lowest in group 1, and significantly lower in group 3 than those in group 4. In addition, protein expressions of Smad3 and TGF-β, two indicators of fibrosis, displayed an identical pattern compared to that of apoptosis among the four groups. On the other hand, the protein expressions of Smad1/5 and BMP-2, two indicators of anti-fibrosis, showed a pattern opposite to that of fibrosis among the four groups.
Exendin-4 therapy inhibited the expressions of myocardial damage and pressure-overload biomarkers in myocardium by day 60 after TAC (Figure 6)
Figure 6.
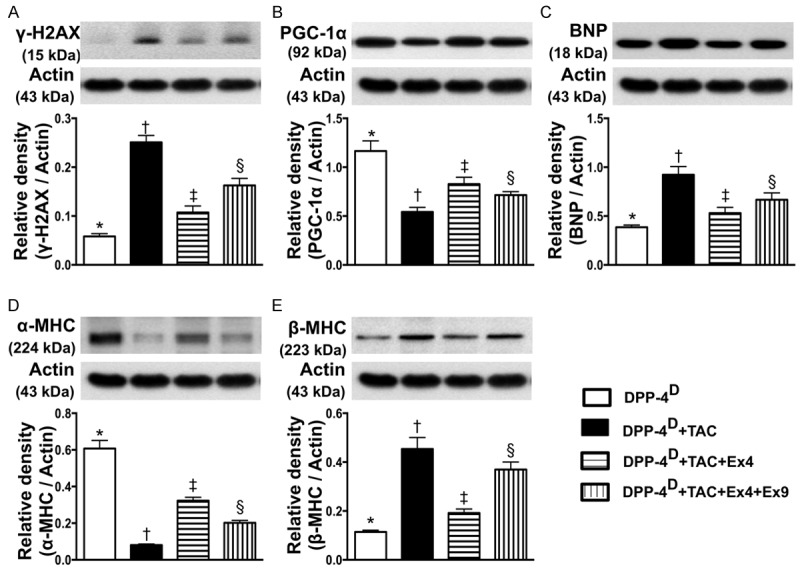
Protein expressions of myocardial damage and pressure-overload biomarkers in myocardium by day 60 after TAC procedure (n = 10). A. Protein expression of γ-H2AX, * vs. other groups with different symbols (*, †, ‡, §), p < 0.001. B. Protein expression of peroxisome proliferatoractivated receptor gamma coactivator-1α (PGC-1α), * vs. other groups with different symbols (*, †, ‡, §), p < 0.001. C. Protein expression of brain natriuretic peptide (BNP), * vs. other groups with different symbols (*, †, ‡, §), p < 0.001. D. Protein expression of alpha myosin heavy chain (α-MHC), * vs. other groups with different symbols (*, †, ‡, §), p < 0.0001. E. Protein expression of β-MHC, * vs. other groups with different symbols (*, †, ‡, §), p < 0.001. All statistical analyses were performed by one-way ANOVA, followed by Bonferroni multiple comparison post hoc test. Symbols (*, †, ‡) indicate significance (at 0.05 level). DPP-4D = dipeptidyl peptidase-4 deficiency; Ex4 = exendin-4; Ex9 = exendin-9-39; HPF = high-power field.
The protein expression of γ-H2AX, a DNA damaged marker, was highest in group 2 and lowest in group 1, and significantly lower in group 3 than that in group 4. Conversely, the protein expression of PGC-1α, an energy preservation biomarker, showed an opposite pattern compared to that of DNA damaged marker among the four groups. Additionally, the protein expression of BNP, a pressure-overload/heart failure biomarker, exhibited an identical pattern compared to that of γ-H2AX among the four groups. Moreover, cardiac hypertrophy is characterized by a switch from α- to β-MHC protein expression (i.e. reactivation of fetal gene program). The results of the present study showed that α-MHC in LV myocardium was highest in group 1 and lowest in group 2, and significantly higher in group 3 than that in group 4. On the other hand, β-MHC protein expression in LV myocardium showed a reversed pattern compared to that of α-MHC among the four groups.
Exendin-4 therapy inhibited the protein expressions of dna damage downstream signaling pathways in myocardium by day 60 after TAC (Figures 7 and 13)
Figure 7.
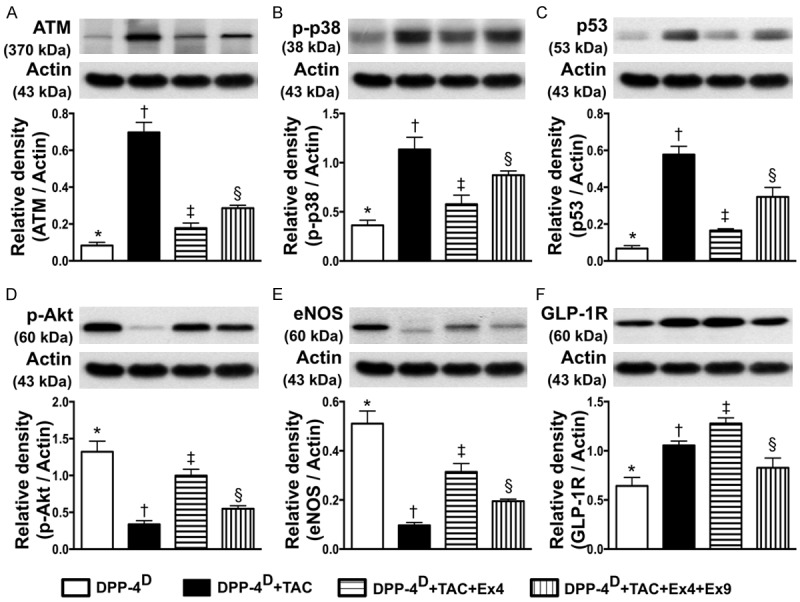
Protein expressions of DNA damage downstream signalings, eNOS and GLP-1R in myocardium by day 60 after TAC procedure (n = 10). A. Protein expression of ataxia telangiectasia mutated kinase (ATM), * vs. other groups with different symbols (*, †, ‡, §), p < 0.0001. B. Protein expression of phosphorylated (p)-p38, * vs. other groups with different symbols (*, †, ‡, §), p < 0.001. C. Protein expression of p53, * vs. other groups with different symbols (*, †, ‡, §), p < 0.001. D. Protein expression of p-Akt, * vs. other groups with different symbols (*, †, ‡, §), p < 0.0001. E. Protein expression of endothelial nitric oxide synthase (eNOS), * vs. other groups with different symbols (*, †, ‡, §), p < 0.0001. F. Protein expression of glucagon-like peptide-1 receptor (GLP-1R), * vs. other groups with different symbols (*, †, ‡, §), p < 0.0001. All statistical analyses were performed by one-way ANOVA, followed by Bonferroni multiple comparison post hoc test. Symbols (*, †, ‡) indicate significance (at 0.05 level). DPP-4D = dipeptidyl peptidase-4 deficiency; Ex4 = exendin-4; Ex9 = exendin-9-39; HPF = high-power field.
Figure 13.

Proposed mechanisms underlying the positive therapeutic effects of exendin-4 on TAC-induced PHC. ATM = ataxia telangiectasia mutated kinase; BMP-2 = bone morphogenetic protein; TGF-β = transforming growth factor-β; MMP = matrix metalloproteinase; TNF-α = tumor necrotic factor-α; NF = nuclear factor; Mito = mitochondria; Csp = caspase 3; PARP = cleaved poly (ADP-ribose) polymerase; NOX = NADPH oxidase; eNOS = endothelial nitric oxide synthase; BNP = brain natriuretic peptide; MHC = myosin heavy chain.
The protein expression of ATM, a downstream signaling of DNA damage, was lowest in group 1 and highest in group 2, and significantly lower in group 3 than that in group 4. Moreover, the protein expressions of p-p38 and p53, two downstream signaling molecules of ATM that would be activated following the activation of ATM after DNA damage, displayed a pattern identical to that of ATM among the four groups. On the other hand, the protein expression of p-Atk, the downstream signaling of p-p38 showed an opposite pattern compared to that of p-p38.
Exendin-4 therapy upregulated the protein expressions of eNOS and GLP-1R in myocardium by day 60 after TAC (Figure 7)
The protein expression of eNOS, an indicator of anti-inflammation and angiogenesis/integrity of endothelial function, was highest in group 1 and lowest in group 2, significantly higher in group 3 than that in group 4. Additionally, the protein expression of GLP-1R was highest in group 3 and lowest in group 1, and significantly higher in group 2 than that in group 4.
Exendin-4 therapy effectively reduced fibrotic and collagen deposition areas in myocardium by day 60 after TAC (Figure 8)
Figure 8.
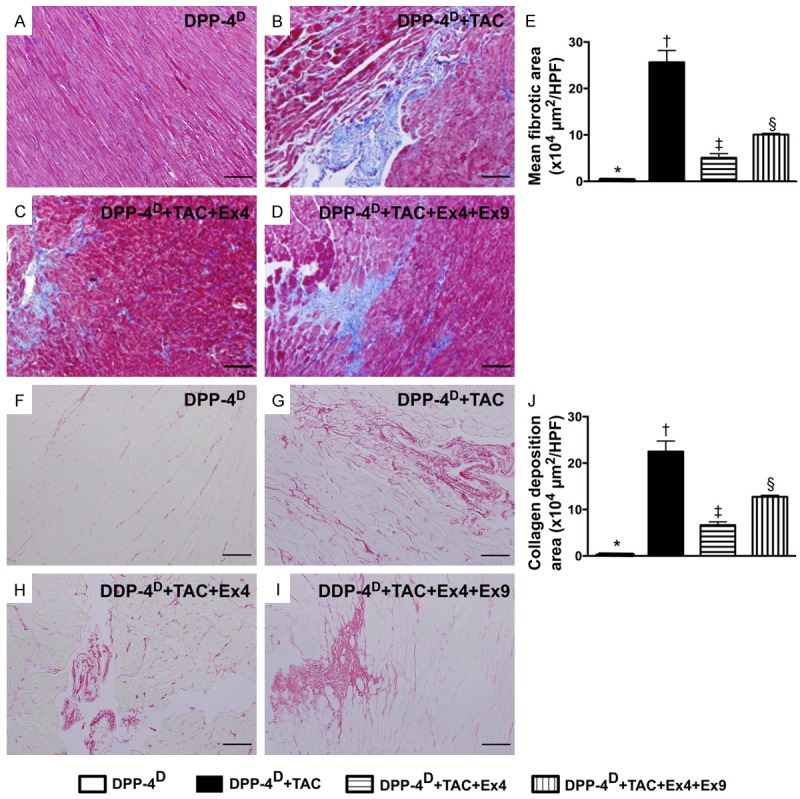
Microscopic findings of fibrotic area and collagen deposition area in myocardium by day 60 after TAC procedure (n = 10). A-D. Microscopic finding (100x) Mason’s trichrome staining for identification of fibrotic area. E. Results of statistical analysis, * vs. other groups with different symbols (*, †, ‡, §), p < 0.0001. The scale bars in right lower corner represent 100 µm. F-I. Microscopic finding (200x) of Sirius red staining for identification of collagen deposition area. J. Results of statistical analysis, * vs. other groups with different symbols (*, †, ‡, §), p < 0.0001. The scale bars in right lower corner represent 50 µm. All statistical analyses were performed by one-way ANOVA, followed by Bonferroni multiple comparison post hoc test. Symbols (*, †, ‡) indicate significance (at 0.05 level). DPP-4D = dipeptidyl peptidase-4 deficiency; Ex4 = exendin-4; Ex9 = exendin-9-39; HPF = high-power field.
IHC staining showed that the fibrotic area (i.e., by Mason’s trichrome staining) and collagen deposition area (i.e., by Sirius red staining) were lowest in group 1 and highest in group 2, and significantly lower in group 3 than those in group 4.
Exendin-4 therapy increased expressions of cardiac stem cells and angiogenesis in myocardium by day 60 after TAC (Figures 9 and 10)
Figure 9.
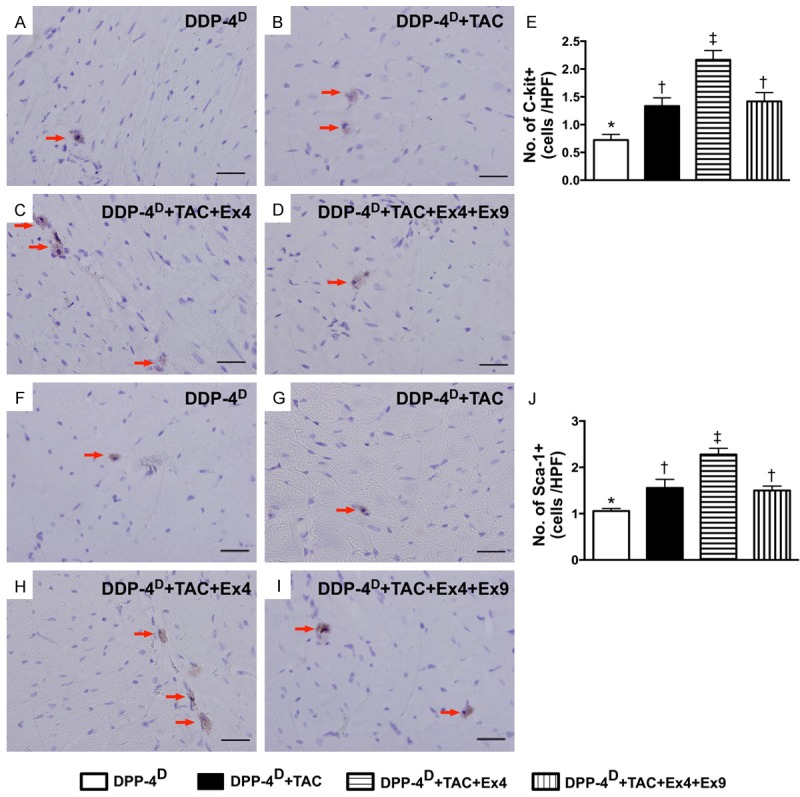
Immunohistochemical (IHC) staining for cardiac stem cells in myocardium by day 60 after TAC procedure (n = 10). A-D. Microscopic (400x) finding of IHC staining for identifying the number of c-Kit+ cells (red arrows). E. Results of statistical analysis, * vs. other groups with different symbols (*, †, ‡), p < 0.001. The scale bars in right lower corner represent 20 µm. F-I. Microscopic (400x) finding of IHC staining for identifying the number of Sca-1+ cells (red arrows). J. Results of statistical analysis, * vs. other groups with different symbols (*, †, ‡), p < 0.001. The scale bars in right lower corner represent 20 µm. All statistical analyses were performed by one-way ANOVA, followed by Bonferroni multiple comparison post hoc test. Symbols (*, †, ‡) indicate significance (at 0.05 level). DPP-4D = dipeptidyl peptidase-4 deficiency; Ex4 = exendin-4; Ex9 = exendin-9-39; HPF = high-power field.
Figure 10.
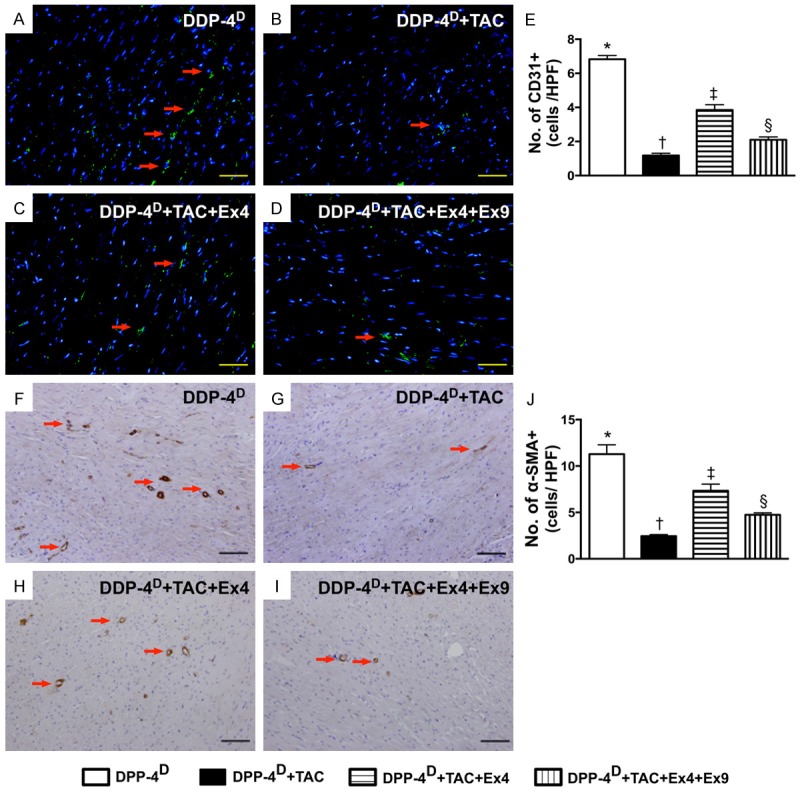
Angiogenesis in myocardium by day 60 after TAC induction (n = 10). A-D. Immunofluorecent microscopic (200x) finding for identifying the number of CD31+ cell (green color). E. Results of statistical analysis, * vs. other groups with different symbols (*, †, ‡, §), p < 0.001. The scale bars in right lower corner represent 50 µm. F-I. Microscopic (100x) finding of IHC staining (i.e., α-smooth muscle actin positive stain) for identifying the number of small vessels (≤ 25 µM) (red arrows). J. Results of statistical analysis, * vs. other groups with different symbols (*, †, ‡, §), p < 0.0001. The scale bars in right lower corner represent 100 µm. All statistical analyses were performed by one-way ANOVA, followed by Bonferroni multiple comparison post hoc test. Symbols (*, †, ‡) indicate significance (at 0.05 level). DPP-4D = dipeptidyl peptidase-4 deficiency; Ex4 = exendin-4; Ex9 = exendin-9-39; HPF = high-power field.
On the other hand, IHC staining demonstrated that the numbers of cells positive for C-kit and Sca-1, two indicators of cardiac stem cells, were significantly higher in group 3 than those in the other groups, and significantly higher in groups 2 and 4 than those in group 1, but there was no difference between groups 2 and 4 (Figure 9). In addition, IF staining also revealed that the number of CD31+ cells, an indicator of endothelial cells/angiogenesis, was highest in group 1 and lowest in group 2, and significantly higher in group 3 than that in group 4 (Figure 10). Consistently, IHC staining showed that the number of small vessels (≤ 25 µm) (i.e. α-SMA positively stained) exhibited an identical pattern compared to that of CD31+ cells among the four groups (Figure 10).
Exendin-4 therapy suppressed the expressions of DNA damage biomarkers in myocardium by day 60 after TAC (Figure 11)
Figure 11.
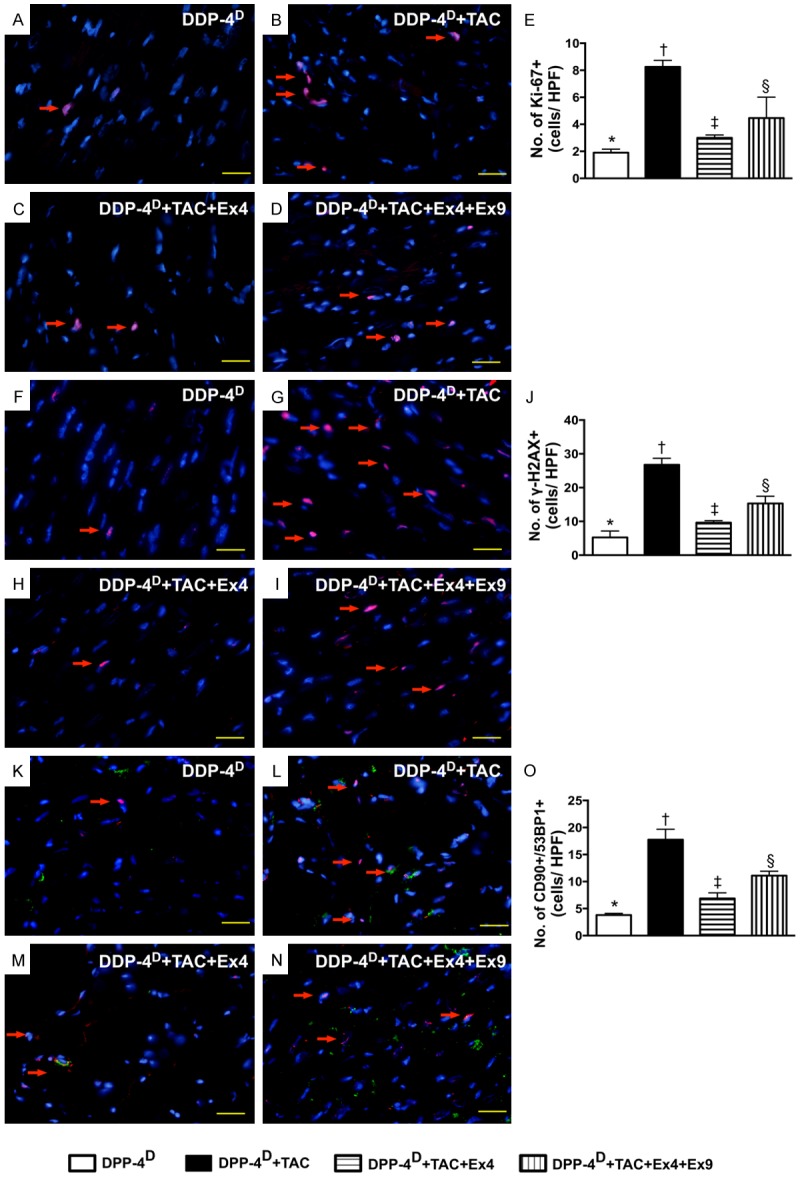
Immunofluorecent (IF) staining of DNA damage biomarkers in myocardium by day 60 after TAC induction (n = 10). A-D. IF microscopic (400x) finding for identifying the numbers of Ki-67+ cells (red color). E. Results of statistical analysis, * vs. other groups with different symbols (*, †, ‡, §), p < 0.0001. The scale bars in right lower corner represent 20 µm. F-I. IF microscopic (400x) finding for identifying the numbers of γ-H2AX+ cells (red color). J. Results of statistical analysis, * vs. other groups with different symbols (*, †, ‡, §), p < 0.001. The scale bars in right lower corner represent 20 µm. K-N. IF microscopic (400x) finding for identifying the numbers of double stained CD90+/53BP1+ cells (green-reddish color). O. Results of statistical analysis, * vs. other groups with different symbols (*, †, ‡, §), p < 0.001. The scale bars in right lower corner represent 20 µm. All statistical analyses were performed by one-way ANOVA, followed by Bonferroni multiple comparison post hoc test. Symbols (*, †, ‡) indicate significance (at 0.05 level). DPP-4D = dipeptidyl peptidase-4 deficiency; Ex4 = exendin-4; Ex9 = exendin-9-39; HPF = high-power field.
Microscopically, IF staining demonstrated that the numbers of Ki-67+ and γ-H2AX+ cells, two indices of DNA damage markers, were highest in group 2 and lowest in group 1, and significantly lower in group 3 than those in group 4. Besides, IF staining also showed that the number CD90+/53BP1+ cells (i.e., double staining), an indicator of double-strand DNA breakage in cardiomyoblasts, displayed a pattern identical to that of γ-H2AX+ cells.
Exendin-4 therapy alleviated tac-induced pathological hypertrophic cardiomyopathy by day 60 after TAC (Figure 12)
Figure 12.
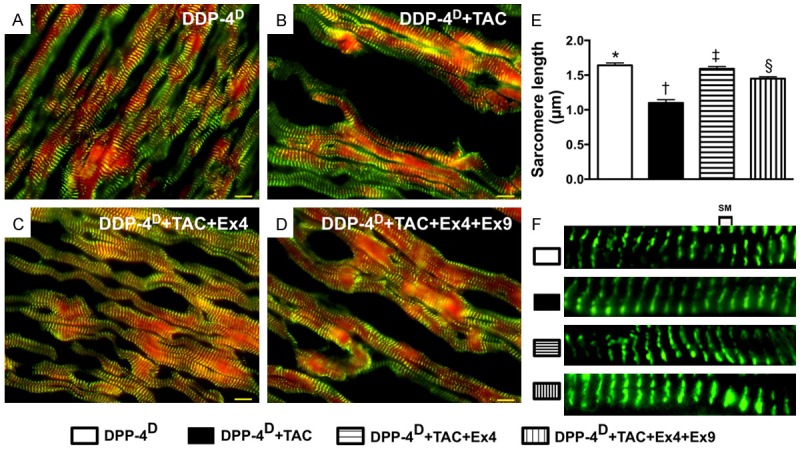
Actinin-phalloidin staining for measuring the sarcomere length of cardiomyocytes by day 60 after TAC procedure (n = 10). A-D. IF microscopic (600x) finding for identifying the sarcomere length. E. Results of statistical analysis, * vs. other groups with different symbols (*, †, ‡, §), p < 0.0001. The scale bars in right lower corner represent 10 µm. F. Illustrating the measurement (magnified A-D) of distance of sarcomere length. SM = sarcomere. All statistical analyses were performed by one-way ANOVA, followed by Bonferroni multiple comparison post hoc test. Symbols (*, †, ‡) indicate significance (at 0.05 level). DPP-4D = Dipeptidyl peptidase-4 deficiency; Ex4 = exendin-4; Ex9 = exendin-9-39.
Double staining of actinin + phalloidin showed that the sarcomere was longest group 1 and shortest in group 2, and significantly shorter in group 4 than that in group 3, suggesting that PHC after TAC was suppressed after exendin-4 treatment.
Discussion
This experimental study, which investigated the therapeutic role of exendin-4 in TAC-induced PHC in DPP-4D rats, yielded several striking implications. First, this experimental model successfully induced PHC with a preservation of LV function without the confounding existence of dilated cardiomyopathy. Second, even in the presence of a preexistent protecting factor of DPP-4 deficiency, exendin-4 therapy still offered a very important additional therapeutic advantage of reducing TAC-induced PHC of the left ventricle. Third, exendin-4 therapy remarkably impeded the overexpression of molecular-cellular perturbations in the setting of TAC-induced PHC through inhibiting the DNA damage signaling (Please see Figure 13). Finally, exendin-4 therapy notably preserved LV performance and prevented LV remodeling.
Abundant data have showed that PHC is a common phenomenon in various diseases, including hypertension, pressure or volume overload, valvular heart disease, and idiopathic cardiac hypertrophy [1-6]. One important finding in the present study is that, through echocardiographic and gross anatomical studies, myocardial hypertrophy was clearly identified in TAC animals with reference to the normal cardiac features of the control animals. Of importance is that the features of PHC were remarkably attenuated in TA animals after exednin-4 therapy. Additionally, at a cellular level, IF staining showed remarkably decreased sarcomere length in TAC animals, signifying cardiomyocyte hypertrophy, which is a finding consistent with that of previous studies [1-5]. Interestingly, after administration of exendin-9-39, an antagonist of exendin-4, the inhibition of exendin-4 on PHC was remarkably reversed. Our recent study has also shown that exendin-9-39 suppressed expression of GLP-1R and the renal protective effect of sitagliptin against ischemia-reperfusion injury [12]. In the present study, the protein expression of GLP-1R was found to be significantly and progressively increased from the control group to TAC-treated group, suggesting pressure overload and ischemic stress induced the upregulation of GLP-1R that was further augmented after exendin-4 treatment in LV myocardium. Consistent with the finding of our recent study [12], GLP-1R expression in LV myocardium was diminished after exendin-9-39 treatment regardless the presence or absence of exendin-4. Accordingly, our results, in addition to extending those of our previous study [12], further proved the unique role of exendin-4 in suppressing the development of PHC. Our findings, therefore, highlight the therapeutic potential of exendin-4 for diabetic patients with hypertension, aortic stenosis, or idiopathic hypertrophic cardiomyopathy.
Another important finding in the present study is that both in vitro study and in vivo studies showed that not only did pressure overload induce DNA damage and the activation of its downstream signaling pathways, but it also triggered oxidative stress, fibrosis, collagen deposition, and apoptosis of LV myocardium. Our findings corroborate those of previous studies [1,2,6] which have revealed that PHC without treatment induces progressive cell death and eventually dilated cardiomyopathy. Of particular importance is that exednin-4 therapy not only suppressed the DNA damage, oxidative stress, fibrosis, and apoptosis, but also unregulated the expressions of anti-fibrotic markers and PGC-1α, an energy biogenesis biomarker. Our recent study [12] has also shown that exendin-4 treatment significantly ameliorated cellular damage/apoptosis and fibrosis in the setting of acute kidney ischemia-reperfusion injury. In this way, our findings strengthen those of our recent study [12].
Undoubtedly, pressure overload/heart failure always induced an upregulation of BNP and β-MHC. An essential finding in the present is that the protein expressions of BNP and β-MHC were significantly enhanced, whereas the protein expression of α-MHC was notably reduced in the TAC group than that in the sham controls. However, these parameters were markedly reversed in TAC animals after exendin-4 treatment. Furthermore, the expressions of inflammatory biomarkers in LV myocardium were found to be augmented in TAC animals and were significantly inhibited after exendin-4 treatment. These findings not only support the suppressive effect of exendin-4 therapy on TAC-induced cardiac hypertrophy, but also proved that the therapeutic approach alleviated the inflammation frequently present in PHC/dilated cardiomyopathy [14].
An interesting finding in the current study is that the expressions of angiogenesis factors, including eNOS as well as the number of small vessels and CD31+ cells, were remarkably reduced in TAC animals as compared with those in the sham controls. These findings were comparable to those of our previous study that demonstrated suppressed angiogenesis in the setting of dilated cardiomyopathy [14]. The upregulated expressions of these biomarkers after exednin-4 therapy, therefore, further highlight the significance of exendin-4 in this experimental setting. Another intriguing finding is that the number of cardiac stem cells was notably increased in TAC animals as compared with that in the controls. We suggest that this could be an intrinsic response of the heart to pressure overload/ischemic stimulation that triggers a myocardial protective/repair mechanism. Of distinctive importance is that exendin-4 further upregulated the expressions of these cardiac stem cells. This finding encourages further investigation in the future into whether exendin-4 therapy would improve systolic LV dysfunction, especially in the presence of heart failure, through the underlying mechanisms of pluripotent cardiac stem cell renewal.
Study limitations
First, because of the relatively short study period of 60 days, the impact of exendin-4 therapy on more long-term outcome in the setting of TAC-induced PHC remains unclear. Second, the results of the present study did not provide insight into the exact mechanisms by which exednin-4 therapy suppressed TAC-induced PHC. The proposed mechanisms underlying the observed protection of exendin-4 treatment against TAC-induced PHC based on our findings have been summarized in Figure 13.
In conclusion, the results of the present study supported that exendin-4 therapy effectively suppressed TAC-induced PHC through inhibiting molecular-cellular perturbations in the myocardium. The results of the present study highlight the potential implication of exendin-4 therapy for diabetic patients with concomitant hypertension, aortic stenosis or idiopathic hypertrophic cardiomyopathy.
Acknowledgements
This study was supported by a program grant from Chang Gung Memorial Hospital, Chang Gung University (Grant number: CMRPG 8B0441). We thank the molecular imaging core of the Center for Translational Research in Biomedical Sciences, Kaohsiung Chang Gung Memorial Hospital, Kaohsiung, Taiwan for technical and facility supports on Echo Vevo 2100.
Disclosure of conflict of interest
None.
Author’s contribution
HIL, HKY and FYL participated in the design of the study, data acquisition and analysis as well as drafting the manuscript. SYC, THT, YLC, THH, YYZ, CFL and YLC were responsible for the laboratory assay and troubleshooting. SC, YYZ, MWC, JJS and HKY participated in data acquisition, analysis, and interpretation. FYL and HKY conceived of the study, and participated in its design and coordination and helped to draft the manuscript. All authors read and approved the final manuscript.
References
- 1.Bishop SP. The myocardial cell: normal growth, cardiac hypertrophy and response to injury. Toxicol Pathol. 1990;18:438–453. [PubMed] [Google Scholar]
- 2.Frey N, Olson EN. Cardiac hypertrophy: the good, the bad, and the ugly. Annu Rev Physiol. 2003;65:45–79. doi: 10.1146/annurev.physiol.65.092101.142243. [DOI] [PubMed] [Google Scholar]
- 3.Ahmad F, Seidman JG, Seidman CE. The genetic basis for cardiac remodeling. Annu Rev Genomics Hum Genet. 2005;6:185–216. doi: 10.1146/annurev.genom.6.080604.162132. [DOI] [PubMed] [Google Scholar]
- 4.Heineke J, Molkentin JD. Regulation of cardiac hypertrophy by intracellular signalling pathways. Nat Rev Mol Cell Biol. 2006;7:589–600. doi: 10.1038/nrm1983. [DOI] [PubMed] [Google Scholar]
- 5.Sundaresan NR, Gupta M, Kim G, Rajamohan SB, Isbatan A, Gupta MP. Sirt3 blocks the cardiac hypertrophic response by augmenting Foxo3a-dependent antioxidant defense mechanisms in mice. J Clin Invest. 2009;119:2758–2771. doi: 10.1172/JCI39162. [DOI] [PMC free article] [PubMed] [Google Scholar]
- 6.Seidman JG, Seidman C. The genetic basis for cardiomyopathy: from mutation identification to mechanistic paradigms. Cell. 2001;104:557–567. doi: 10.1016/s0092-8674(01)00242-2. [DOI] [PubMed] [Google Scholar]
- 7.Leu S, Sun CK, Sheu JJ, Chang LT, Yuen CM, Yen CH, Chiang CH, Ko SF, Pei SN, Chua S, Youssef AA, Wu CJ, Yip HK. Autologous bone marrow cell implantation attenuates left ventricular remodeling and improves heart function in porcine myocardial infarction: an echocardiographic, six-month angiographic, and molecular-cellular study. Int J Cardiol. 2011;150:156–168. doi: 10.1016/j.ijcard.2010.03.007. [DOI] [PubMed] [Google Scholar]
- 8.Chua S, Sheu JJ, Chen YL, Chang LT, Sun CK, Leu S, Sung HC, Tsai TH, Chung SY, Yeh KH, Cho CL, Kao YH, Yip HK. Sitagliptin therapy enhances the number of circulating angiogenic cells and angiogenesis-evaluations in vitro and in the rat critical limb ischemia model. Cytotherapy. 2013;15:1148–1163. doi: 10.1016/j.jcyt.2013.05.005. [DOI] [PubMed] [Google Scholar]
- 9.Yang H, Li H, Wang Z, Shi Y, Jiang G, Zeng F. Exendin-4 ameliorates renal ischemia-reperfusion injury in the rat. J Surg Res. 2013;185:825–832. doi: 10.1016/j.jss.2013.06.042. [DOI] [PubMed] [Google Scholar]
- 10.Chua S, Lee FY, Tsai TH, Sheu JJ, Leu S, Sun CK, Chen YL, Chang HW, Chai HT, Liu CF, Lu HI, Yip HK. Inhibition of dipeptidyl peptidase-IV enzyme activity protects against myocardial ischemia-reperfusion injury in rats. J Transl Med. 2014;12:357. doi: 10.1186/s12967-014-0357-0. [DOI] [PMC free article] [PubMed] [Google Scholar]
- 11.Chen YT, Tsai TH, Yang CC, Sun CK, Chang LT, Chen HH, Chang CL, Sung PH, Zhen YY, Leu S, Chang HW, Chen YL, Yip HK. Exendin-4 and sitagliptin protect kidney from ischemia-reperfusion injury through suppressing oxidative stress and inflammatory reaction. J Transl Med. 2013;11:270. doi: 10.1186/1479-5876-11-270. [DOI] [PMC free article] [PubMed] [Google Scholar]
- 12.Chen HH, Chang CL, Lin KC, Sung PH, Chai HT, Zhen YY, Chen YC, Wu YC, Leu S, Tsai TH, Chen CH, Chang HW, Yip HK. Melatonin augments apoptotic adipose-derived mesenchymal stem cell treatment against sepsis-induced acute lung injury. Am J Transl Res. 2014;6:439–458. [PMC free article] [PubMed] [Google Scholar]
- 13.Chen YT, Chiang HJ, Chen CH, Sung PH, Lee FY, Tsai TH, Chang CL, Chen HH, Sun CK, Leu S, Chang HW, Yang CC, Yip HK. Melatonin treatment further improves adipose-derived mesenchymal stem cell therapy for acute interstitial cystitis in rat. J Pineal Res. 2014;57:248–261. doi: 10.1111/jpi.12164. [DOI] [PubMed] [Google Scholar]
- 14.Sun CK, Chang LT, Sheu JJ, Chiang CH, Lee FY, Wu CJ, Chua S, Fu M, Yip HK. Bone marrow-derived mononuclear cell therapy alleviates left ventricular remodeling and improves heart function in rat-dilated cardiomyopathy. Crit Care Med. 2009;37:1197–1205. doi: 10.1097/CCM.0b013e31819c0667. [DOI] [PubMed] [Google Scholar]