

Abstract
Background:
Tumor cell senescence is a common outcome of anticancer therapy. Here we investigated how therapy-induced senescence (TIS) affects tumor-infiltrating leukocytes (TILs) and the efficacy of immunotherapy in melanoma.
Methods:
Tumor senescence was induced by AURKA or CDK4/6 inhibitors (AURKAi, CDK4/6i). Transcriptomes of six mouse tumors with differential response to AURKAi were analyzed by RNA sequencing, and TILs were characterized by flow cytometry. Chemokine RNA and protein expression were determined by quantitative real-time polymerase chain reaction and enzyme-linked immunosorbent assay. Therapeutic response was queried in immunodeficient mice, in mice with CCL5-deficient tumors, and in mice cotreated with CD137 agonist to activate TILs. CCL5 expression in reference to TIS and markers of TILs was studied in human melanoma tumors using patient-derived xenografts (n = 3 patients, n = 3 mice each), in AURKAi clinical trial samples (n = 3 patients, before/after therapy), and in The Cancer Genome Atlas (n = 278). All statistical tests were two-sided.
Results:
AURKAi response was associated with induction of the immune transcriptome (P = 3.5x10⁻²⁹) while resistance inversely correlated with TIL numbers (Spearman r = -0.87, P < .001). AURKAi and CDK4/6i promoted the recruitment of TILs by inducing CCL5 secretion in melanoma cells (P ≤ .005) in an NF-κB-dependent manner. Therapeutic response to AURKAi was impaired in immunodeficient compared with immunocompetent mice (0% vs 67% tumors regressed, P = .01) and in mice bearing CCL5-deficient vs control tumors (P = .61 vs P = .02); however, AURKAi response was greatly enhanced in mice also receiving T-cell-activating immunotherapy (P < .001). In human tumors, CCL5 expression was also induced by AURKAi (P ≤ .02) and CDK4/6i (P = .01) and was associated with increased immune marker expression (P = 1.40x10-93).
Conclusions:
Senescent melanoma cells secret CCL5, which promotes recruitment of TILs. Combining TIS with immunotherapy that enhances tumor cell killing by TILs is a promising novel approach to improve melanoma outcomes.
Advanced metastatic melanoma is aggressive and often fatal. Despite recent breakthroughs in melanoma treatment, the prognosis for patients whose tumor cells have spread beyond their primary site remains extremely poor (1). Clearly, therapeutic intervention for these patients needs further improvement. The main drawback of the therapies targeting oncogenic BRAF pathway (BRAFV600E and MEK inhibitors) is the universal acquisition of drug resistance (2,3). In contrast, an immune checkpoint blockade (CTLA4 or PD1/PD-L1-targeting antibodies) is capable of inducing durable responses; however, over half of melanoma patients are intrinsically resistant to immunotherapy (4–6). Understanding how targeted therapies affect the tumor microenvironment will provide a basis for future rational combinatorial treatment approaches.
Senescence is a metabolically active cytostasis. While proliferation is stably shut down in senescent cells, there is enhanced expression of many secreted factors, described as the senescence-associated secretory phenotype (SASP) (7,8). Tumor suppressors p53 and Rb are the main mediators of the cell cycle exit in senescence (9), and SASP is largely attributed to the activation of the NF-κB pathway (10). A number of studies demonstrated that senescence is relevant beyond the premalignant state. Senescence can be induced in cancer cells upon treatment with a variety of drugs (11,12) and termed therapy-induced senescence (TIS). TIS has been demonstrated in many experimental models of cancers, including melanoma (11,13).
Upon chemotherapy, TIS is initiated through activation of the DNA damage response pathway (11,12). The tumor suppressor p53 plays a critical role in the response to chemotherapy-induced DNA damage by orchestrating both proliferative arrest and apoptosis in cancer cells (14). In addition to chemotherapy, TIS may be induced by certain targeted therapeutics. For instance, specific small molecule inhibitors of cell cycle kinases were shown to direct cells to a senescent state (15–17). We have also demonstrated that inhibition of the essential mitotic kinase AURKA induces senescence in melanoma tumors in vivo (18), and this process could be reinforced by pharmacological activation of p53 (19).
Paradoxically, senescence and SASP can have both tumor-promoting and tumor-suppressing properties depending on the cellular context and inducing stimuli. Senescence is associated with a proliferative block, therefore TIS is expected to halt tumor progression (12). However, some studies suggest that senescent tumor cells acquire resistance to cytotoxic chemotherapies (20) or give rise to stem-like cells responsible for post-therapy tumor recurrence (21). Similarly, some cytokines secreted by senescent cells can reinforce senescence, while others promote tumorigenesis by stimulating growth and invasiveness of neighboring nonsenescent cells (11). Furthermore, pro-inflammatory SASP mediators may boost immune surveillance of senescent cells by cytotoxic lymphocytes (22,23). However, tumor-infiltrating immune cells have been shown to promote tumor progression and facilitate therapeutic resistance in some cancers (24).
To date, the influence of TIS on cancer therapeutic response has not been fully elucidated and was a subject of this study.
Methods
Cell lines, Drugs, Vectors, and Antibodies
B16F0 cells were purchased from ATCC (Manassas, VA). SM1 cells were provided by Anthony Ribas (25). MelA cells and NFκB luciferase reporter–expressing HS294T cells were described previously (26–28). Alisertib and LEE011 were provided by Takeda (Osaka, Japan) and Novartis (Basel, Switzerland), respectively. Vemurafenib, selumetinib, and palbociclib were from Selleckchem (Houston, TX). CD137 antibody (3H3) and isotype control (2A3) were from BioExcell (West Lebanon, NH). CCL5 shRNA vectors were obtained from The RNAi Consortium (TRC, TRCN0000068100, TRCN0000068102).
Mice and Patient Samples
All mouse experiments were approved by the Vanderbilt University Institutional Animal Care and Use Committee. Eight- to 12-week-old female C57Bl6 mice were injected subcutaneously with 5x10⁶ Mel A, 5x10⁴ B16F0, or 5x10⁵ SM1 cells per flank. Isofluorane inhalation (5%) and ketoprofen SC injection (5mg/kg) were used as anesthetic and analgesic, respectively. Therapy was initiated when tumors were approximately 100mm3 (MelA and SM1 models) or palpable (B16F0). Alisertib was administered by oral gavage (30mg/kg) five days a week. Antibodies (115 ug/mouse i.p.) were injected on fifth, seventh, ninth, and 11th days of therapy. Mice were killed if tumors reached 15mm in diameter, if tumors became perforated, or if mice lost 10% of body mass. PDXs were established as described previously (29) and in the Supplementary Methods (available online). Patient melanoma tissue was collected after patient consent, and tissue collection was approved by the Vanderbilt institutional review board.
RNA Sequencing, Gene Set Enrichment Analysis, and TCGA Inquiries
The RNA sequencing was performed by the genomic services laboratory of the HudsonAlpha Institute for Biotechnology as described in the Supplementary Methods (available online). Genes statistically significantly associated with response to alisertib were identified using SAM supervised learning software for genomic expression data mining (Stanford University) (30). Genes with five or greater–fold differential expression were used for analysis. The response data was inputted using “quantitative type” format, and the association between gene expression and tumor response was tested using linear regression model. The analysis of gene set enrichment was performed using WEB-based GEne SeT AnaLysis Toolkit (WebGestalt) (31). TCGA data were analyzed using cBioPortal (32).
Immunofluorescence, flow cytometry, real-time PCR, SAβGal, cytokine, and luciferase assays are described in the Supplementary Methods (available online).
Statistical Methods
All tests of statistical significance were two-sided. Findings were considered statistically significant at a P value of less than .05. Error bars in graphics represent SD. We used the two-sample, pooled-variance t test to compare the effect of drug treatment on the percentages of CD45+ cells in control and CCL5-deficient tumors. The statistical tests for tumors collected on days 7 and 15 of treatment were performed independently. We assessed the association between the percentages of CD45+ cells in tumor and drug response with restricted cubic spline regression and linear regression.
We compared the progression of tumor volume (mm3) over time among groups of mice receiving different therapy with linear mixed effects regression analysis. To meet the normality assumptions for these parametric methods, a square root or the natural log transformations were used to ameliorate the heterogeneous variability in tumor volume measurements over time. Additionally, a constant of 1 was added to correct for tumor volumes of zero. Mixed models estimate corrected variance estimates in the presence of correlated measurements taken in the same mouse (eg, left and right flank) and for repeated measures on the same tumor over time. The Akaike information criterion was used to select among competing correlation structures. Similar statistical methods were employed to compare relative mRNA expression among groups. Standard residual analysis and goodness-of-fit statistics were evaluated.
Results
Transcriptome Changes Associated With Response to Mitotic Kinase Inhibition
To study the response of melanoma tumors to senescence-inducing therapy, we used an immune-competent model. Mouse melanoma cells MelA (CDKN2ADEL, BRAFWT) were grown subcutaneously in C57Bl6 mice that were treated with alisertib, an inhibitor of Aurora kinase A (AURKAi) (18,19). The initial four weeks of therapy were followed by a two-week pause and then resumed for additional two weeks. This “treatment-pause-treatment” approach yielded different tumor responses overall (Figure 1A, right panel). We next performed transcriptome analysis in tumors with differential responses using RNA sequencing. Tumors that showed resistance either earlier or later during treatment were included. SAM expression analysis identified a set of 544 genes whose expression statistically significantly correlated with tumor response to AURKAi with 10% false discovery rate (FDR) (Figure 1B; Supplementary Table 1, available online). The expression of all 544 genes was decreased in drug-resistant tumors compared with responsive tumors. Gene set enrichment analysis (GSEA) demonstrated highly statistically significant (P = 3.5x10⁻²⁹) enrichment of the GO annotation “immune response” in this gene set (Figure 1C; Supplementary Table 2, available online). Furthermore, the majority of KEGG pathways associated with our “durable-response” genes was related to immune system function, including “natural killer cell mediated toxicity,” “complement,” and “cytokine/chemokine” pathways (Figure 1D; Supplementary Table 3, available online). Among the 544 statistically significant hits were gene encoding pan-leukocyte marker CD45 (Ptprc), T-cell receptor encoding genes, and cytotoxic T-cell markers such as perforin (Prf1) and Fas ligand (Fasl) (Supplementary Table 1, available online).
Figure 1.

Analysis of transcriptome in tumors with differential response to mitotic inhibition. A) The average (left panel) and individual progression (right panel) of melanoma tumors treated with alisertib. C57Bl/6 mice bearing MelA melanoma tumors were treated with 30mg/kg of AURKAi (alisertib, n = 8) or vehicle (water, n = 41). Error bars represent SD. B) Heat map of the expression levels of 544 genes that were statistically significantly associated with response to AURKAi therapy (final tumor volume, blue bars) as determined by SAM software with FDR 10%. C) Enrichment of the GO annotation “immune response” in the set of 544 genes associated with AURKAi response. D) Top 10 most enriched KEGG pathways in the set of 544 genes associated with AURKAi response. Count: number of genes in a 544 set that are involved in a given pathway. Fold enrichment shows how many fold more a given term was overrepresented in the 544 gene set compared with a background of the total mouse genome.
Next we studied whether pro-inflammatory changes in the transcriptome of AURKAi-responsive tumors are reflected by tumor microenvironment. In an independent validation experiment with MelA tumor-bearing mice, two rounds of AURKAi therapy separated by a two-week rest period (Supplementary Figure 1, A and B, available online) and individual tumors were categorized as responsive (<2-fold tumor volume increase), resistant (>4-fold volume increase), or intermediately responsive (2- to 4-fold progression) based on their growth after second round of AURKAi therapy (Supplementary Figure 1C, available online). The infiltration of immune cells was increased in AURKAi-responsive tumors but not in resistant tumors (Figure 2A). Helper and cytotoxic T-cells were recruited into AURKAi-responsive tumors (Figure 2B, Table 1). We found a negative association between the percentages of total leukocytes and individual immune subsets in tumors and progression on AURKAi (Spearman r = -0.87, P < .001; Cubic R-square = 0.56, P = .009; Pearson R [log-transformed tumor volume] = -0.89, P < .001) (Figure 2C). Analysis of correlations of individual immune subsets and tumor response to AURKAi is shown in Table 2.
Figure 2.
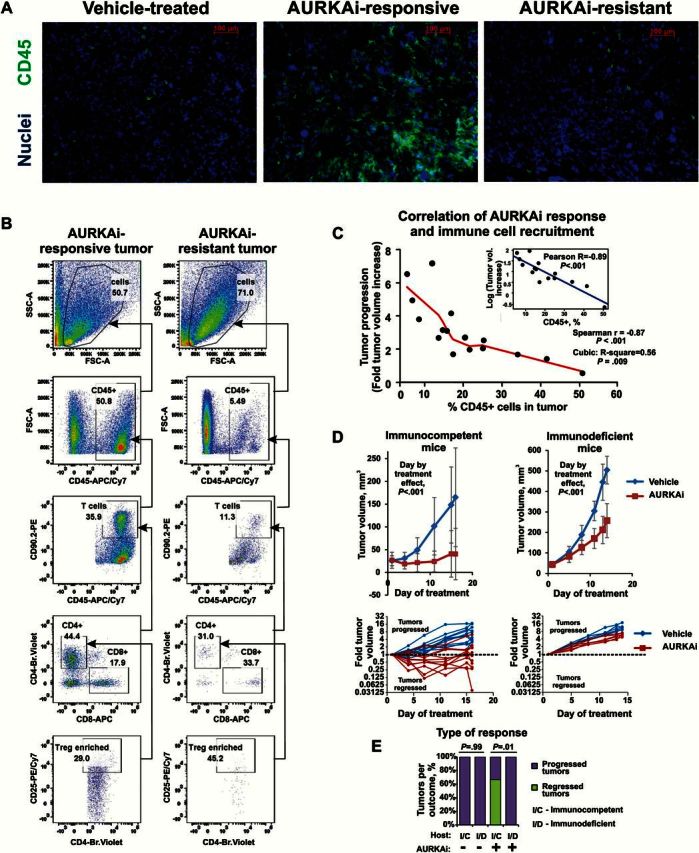
Analysis of immune cell recruitment in response to mitotic kinase inhibition. A) Immuno-fluorescent staining of pan-leukocyte marker CD45 in tumors with differential responses to AURKAi shown in Supplementary Figure 1 (available online). C57Bl6 mice bearing MelA melanoma tumors were treated with 30mg/kg of AURKAi (n = 10) or vehicle (n = 3). After four weeks of therapy, treatment was paused for two weeks then resumed for another two weeks to establish differential tumor response. Tumor tissue was snap-frozen at the end of study and subsequently used for immunofluorescent staining. Responsive and resistant tumors represent tumors that showed less than two-fold and over four-fold volume increase after second therapy round, respectively. B) Results of the flow cytometry–based analysis of the tumor-infiltrating immune cells in tumors described in Supplementary Figure 1 (available online). CD90.2+, CD25+: Treg-enriched population was gated based on fluorescence-minus-one control. One representative responding (AURKAi 7) and one representative nonresponding tumor (AURKAi 2) are shown. C) Scatter plot of the final tumor volume (resistance) and tumor infiltration with immune cells (%CD45 cells) shows very strong inverse correlation. Insert shows linear correlation of log-transformed tumor progression values with the percent of tumor-infiltrating CD45+ cells. D) Cells derived from AURKAi-sensitive tumor were injected into 12 immunocompetent C57Bl/6 (top panels) or six severely immune-deficient NSG mice (top panels) at 5x10⁶ cells/flank on both flanks. Mice were divided into two groups that were treated daily with 30mg/kg of AURKAi (alisertib) or vehicle (water). Tumor volume increase over time is shown. A nested mixed-effects model was fitted to compare tumor volume between immunocompetent CD57Bl and immunodeficient NSG mice with a random effect for the intercept for each mouse and for each flank of each mouse. To better meet normality assumptions for the analysis model, a square root transformation of tumor volumes was performed to adjust for heteroscedacity observed over time. E) Comparison of the therapeutic outcomes (tumor progressed vs tumor regressed) in immunocompetent C57Bl/6 and in severely immune-deficient NSG mice in the experiment shown in (D). Fisher’s exact test was used to compare outcomes in different host types. All statistical tests were two-sided. Error bars represent SD.
Table 1.
Comparison of tumor progression (fold tumor volume change after second therapy round) and levels of indicated tumor-infiltrating immune cells shown as a percent of total tumor cells and of CD45+ tumor-infiltrating leukocytes
| Tumor ID | Tumor progression | CD45, % in tumor | T-cells, % in tumor | CD4+, % in tumor | Treg, % in tumor | CD8+, % in tumor | T-cells, % in CD45 | CD4+, % in CD45 | Treg, % in CD45 | CD8+, % in CD45 |
|---|---|---|---|---|---|---|---|---|---|---|
| AURKAi 7 | 0.53 | 50.8 | 18.2 | 8.1 | 2.4 | 3.3 | 35.9 | 15.9 | 4.6 | 6.4 |
| AURKAi 15 | 1.39 | 41.6 | 17.5 | 6.9 | 3.0 | 1.8 | 42.1 | 16.5 | 7.2 | 4.2 |
| AURKAi 4 | 1.67 | 17.3 | 3.3 | 1.1 | 0.3 | 1.0 | 19.0 | 6.5 | 1.6 | 5.7 |
| AURKAi 9 | 1.70 | 34.0 | 7.4 | 2.8 | 0.6 | 1.4 | 21.8 | 8.1 | 1.8 | 4.0 |
| AURKAi 12 | 1.99 | 21.5 | 9.3 | 4.6 | 1.3 | 1.2 | 43.1 | 21.4 | 6.2 | 5.4 |
| AURKAi 5 | 2.07 | 25.0 | 9.9 | 3.3 | 1.1 | 2.9 | 39.8 | 13.3 | 4.6 | 11.6 |
| AURKAi 6 | 2.48 | 25.2 | 7.7 | 3.1 | 1.5 | 1.2 | 30.5 | 12.4 | 5.8 | 4.7 |
| AURKAi 11 | 2.70 | 13.5 | 4.0 | 1.7 | 0.4 | 0.8 | 29.5 | 12.8 | 3.0 | 5.5 |
| AURKAi 16 | 2.73 | 20.3 | 5.2 | 1.7 | 0.7 | 0.9 | 25.6 | 8.3 | 3.7 | 4.3 |
| AURKAi 10 | 3.13 | 15.5 | 2.9 | 0.8 | 0.2 | 0.8 | 18.3 | 5.3 | 1.5 | 5.4 |
| AURKAi 13 | 3.14 | 14.7 | 3.8 | 1.4 | 0.6 | 1.1 | 25.5 | 9.5 | 4.4 | 7.5 |
| AURKAi 8 | 3.75 | 8.5 | 2.0 | 0.6 | 0.2 | 0.6 | 23.6 | 7.1 | 2.5 | 6.8 |
| AURKAi 14 | 4.11 | 16.8 | 3.6 | 1.3 | 0.5 | 0.7 | 21.4 | 7.6 | 2.7 | 4.3 |
| AURKAi 3 | 4.89 | 6.8 | 1.4 | 0.4 | 0.1 | 0.4 | 21.1 | 5.7 | 2.0 | 5.5 |
| AURKAi 2 | 6.51 | 5.5 | 0.6 | 0.2 | 0.1 | 0.2 | 11.3 | 3.5 | 1.6 | 3.8 |
| AURKAi 1 | 7.15 | 12.0 | 3.6 | 1.8 | 0.5 | 0.9 | 29.9 | 14.8 | 4.5 | 7.2 |
Table 2.
Analysis of correlation between tumor progression and percentages of indicated tumor-infiltrating immune cells*
| Statistical test | Parameter | CD45, % in tumor | T-cells, % in tumor | CD4+, % in tumor | Treg, % in tumor | CD8+, % in tumor | T-cells, % in CD45 | CD4+, % in CD45 | Treg, % in CD45 | CD8+, % in CD45 |
|---|---|---|---|---|---|---|---|---|---|---|
| Spearman’s rank correlation | Correlation coefficient r |
-0.87 | -0.77 | -0.71 | -0.67 | -0.82 | -0.49 | -0.49 | -0.40 | 0.05 |
| P† | <.001 | <.001 | .002 | .005 | <.001 | .05 | .05 | .12 | .85 | |
| Cubic regression | Correlation coefficient R-square |
0.57 | 0.41 | 0.49 | 0.29 | 0.44 | 0.14 | 0.01 | 0.00 | 0.00 |
| P† | .009 | .04 | .02 | .1 | .03 | .24 | .43 | .74 | .86 |
* Spearman linear correlation and cubic regression analyses were performed.
† All statistical tests were two-sided.
To determine the role of the infiltrating immune cells in the response to AURKAi, we implanted cells from AURKAi-sensitive tumors into C57Bl/6 or severely immunodeficient NOD-SCID/IL2rγnull (NSG) mice and found that AURKAi inhibited tumor growth in both hosts (P < .001) (Figure 2D, top panels). However, individual tumors in immunocompetent mice showed different responses to the therapy, ranging from regression to fast progression. In contrast, tumors in immunodeficient mice progressed uniformly fast in response to AURKAi (Figure 2D, bottom panels). Furthermore, 67% of the tumors in immunocompetent mice regressed after 11 days of AURKAi therapy, while none of the AURKAi-treated tumors regressed in immonodeficient model (Fisher’s exact test P = .01) (Figure 2E). These findings suggest that immune cell recruitment augments the response to AURKA inhibition while acquisition of resistance is associated with immune evasion.
Role of CCL5 in Immune Cell Recruitment and Response to TIS
“Cytokine-cytokine receptor interaction” was the most statistically significantly enriched KEGG pathway (P = 1x10-11) in our “durable response” gene set (Figure 1E). Therefore, we hypothesized that cytokines secreted by senescent cells promote recruitment of immune cells into the tumor. Melanoma cells were treated with AURKA inhibitor, or with CDK4/6 inhibitor, which induces senescence by activating Rb and blocking FoxM1 (16,17). These treatments induced senescence, based on enlarged cell morphology, increased activity of SAβGal (Supplementary Figure 2A, available online), inhibition of proliferation (Supplementary Figure 2B, available online), activation of senescence effectors p21, p53, p27, and downregulation of cell cycle protein Cyclin A (Supplementary Figure 2C, available online). Cytokine array showed induction of CCL5 in the supernatants of AURKAi and CDK4/6i-treated cells (Figure 3A). Increased CCL5 secretion in response to AURKAi and CDK4/6i was confirmed using enzyme-linked immunosorbent assay (ELISA) (Figure 3B) in MelA cells (P = .001) and two other mouse melanoma cell lines: B16F0 (P = .005 and P < .001) and SM1 (P = .004 and P < .001) (25). Interestingly, CCL5 was also induced by BRAF inhibitor in BRAFV600E cells SM1 (P = .007), possibly because of senescence resulting from stable G1 cell cycle arrest (33). In contrast, MEK inhibition was toxic and did not induce CCL5 (Figure 3B). CCL5 induction relied on NF-κB activity as blocking NF-κB with an inhibitor of IκB kinase β–abrogated CCL5 induction by AURKAi and CDK4/6 in MelA (P = .003 and P < .001, respectively) and B16F0 cells (P < .001 and P = .03) (Figure 3C). In addition, AURKAi and CDK4/6i treatments activated NF-κB luciferase reporter in human melanoma cells (P < .001) while the IKKβ antagonist inhibited NF-κB activity (P < .001) (Figure 3D). Furthermore, there was a statistically significant negative association detected between the CCL5 expression and resistance to AURKAi in a subset of tumors shown in Supplementary Figure 1 (available online) (Spearman coefficient r = -0.72, P = .04).
Figure 3.

Effect of senescence-inducing therapy on expression and secretion of CCL5 by melanoma cells. A) Cytokine array analysis of the condition media from the MelA cell cultured for five days with 1 uM AURKA inhibitor alisertib, 10 µM CDK4/6 inhibitor palbociclib, or vehicle control (DMSO). Rectangular frame shows the position of CCL5. Complete list of cytokines detected by the array is listed in the Supplementary Methods (available online). B) Enzyme-linked immunosorbent assay of the condition media from indicated cells treated with DMSO (vehicle), 1 µM alisertib (AURKAi), 10 µM palbociclib (CDK4/6i), 1 µM MEK inhibitor selumetinib (MEKi), and 1 µM BRAF inhibitor vemurafenib (BRAFi) for five days. The levels of secreted CCL5 were normalized to total protein level in cell lysates. C) Real-time polymerase chain reaction analysis of CCL5 mRNA expression in MelA and B16F0 cells treated for five days with 1 µM AURKAi or 10 µM CDK4/6i in the presence (+IKKi) or absence (no cotreatment) of 10 µM of IKKβ inhibitor BMS-345541. The levels of CCL5 mRNA were normalized to β-Actin mRNA. D) Luciferase reporter of NFκB activity. HS295T human melanoma cells stably expressing a luciferase NF-κB reporter were treated for three days with 10 µM of IKKβ inhibitor BMS-345541, 1 µM alisertib (AURKAi), or 10 µM palbociclib (CDK4/6i). Data shown in (B-D) are representative of three independent experiments. Error bar represents standard deviation. Statistical comparison is illustrated by P values that were based on analysis of variance (ANOVA) model linear contrasts. For experiments in (C and D), data were log-transformed to meet the ANOVA model statistical assumptions. All statistical tests were two-sided.
We next investigated whether CCL5 induction modulates response to senescence-inducing therapy. B16F0 melanoma cells were transduced with lentiviral vectors delivering two different CCL5 shRNAs. AURKAi caused statistically significant inhibition of growth of control tumors expressing nontargeting shRNA (P = .02) but did not affect CCL5-deficient tumors (P = .56 and P = .61 for two different shRNA clones) (Figure 4A). No difference in response to AURKAi between CCL5-deficient and control cells was observed in vitro based on viability assay (Supplementary Figure 3A, available online), dose-dependent inhibition of cell growth (Supplementary Figure 3B, available online), equivalent induction of p21 (Supplementary Figure 3C, available online), and comparable inhibition of EDU incorporation (Supplementary Figure 3D, available online). AURKAi-mediated recruitment of immune cells was compromised in CCL5-deficient tumors (Figure 4B). Compared with control nontargeting shRNA-expressing tumors, immune cell recruitment (the difference between the percentages of CD45+ cells in AURKAi- and vehicle-treated tumors) was reduced in CCL5-deficient tumors on 7th (27.5% vs -2.8% and 11.6, P = .002 and P = .06, for 2 tested shRNA clones) and 14th days of treatment (29.5% vs 14.6% and 6.8%, P = .03 and P < .001) (Figure 4C). The efficiency of CCL5 knockdown is shown in Figure 4D.
Figure 4.

The role of CCL5 induction in therapeutic response to AURKAi and recruitment of immune cells into the tumor. A) Therapeutic response to AURKAi in C57Bl/6 mice bearing B16F0 melanoma tumors expressing nontargeting shRNA or shRNA targeting CCL5 (CCL5 shRNA1 and CCL5 shRNA2). Mice bearing each tumor type were split into two groups for daily treatments with 30mg/kg of AURKAi (n = 5) or vehicle (n = 5). A linear mixed-effects model was fitted to compare tumor volume in vehicle and AURKAi treatment groups adjusted for day of treatment as described in the Methods section. Tumor volume values were log-transformed to meet the assumption of normality. B) Immunofluorescent staining of tumor-infiltrating immune cells in tumors obtained after 15 days of treatment (shown in [A]) using CD45-specific antibody. C) Results of the flow cytometry–based analysis of the tumor-infiltrating leukocytes obtained from vehicle-treated mice or mice treated with 30mg/kg of AURKAi. Two independent experiments were performed to analyze tumors on day 7 or on day 15 (shown in [A]) after the beginning of treatment. AURKAi effect on the percent of CD45+ cells was compared in CCL5 knockdown and nontargeting shRNA groups using pooled variance t test. The mean drug effect (difference in the percentage of CD45+ cells in between vehicle and AURKAi-treated mice) ± pooled SD is plotted. D) The efficiency of CCL5 knockdown was analyzed by real-time polymerase chain reaction after reverse transcription. All statistical tests were two-sided.
Combining Senescence-Inducing and T-Cell-Activating Therapies
We next hypothesized that stimulation of tumor-infiltrating T-cells recruited in response to TIS may further improve therapeutic outcome. For T-cell stimulation, the CD137 agonist antibodies were used. CD137 activation promotes survival, proliferation, and effector function of antigen-primed T-cells (34). We found that combined therapy with AURKAi and CD137 agonist was statistically significantly more effective than vehicle or single-agent therapies (mixed model P < .001 compared with vehicle or single-agent therapies) (Figure 5A). Only two tumors regressed after treatment with anti-CD137 alone, and the other eight tumors progressed similarly to vehicle control (Figure 5B). In contrast, all tumors cotreated with AURKAi and CD137 antibodies showed growth inhibition, and six out 10 tumors completely regressed (Figure 5, A and B). No recurrences were detected during the 12 months of post-therapy monitoring, suggesting that the AURKAi and CD137 agonist combination improves survival in the studied mouse model (Figure 5C).
Figure 5.
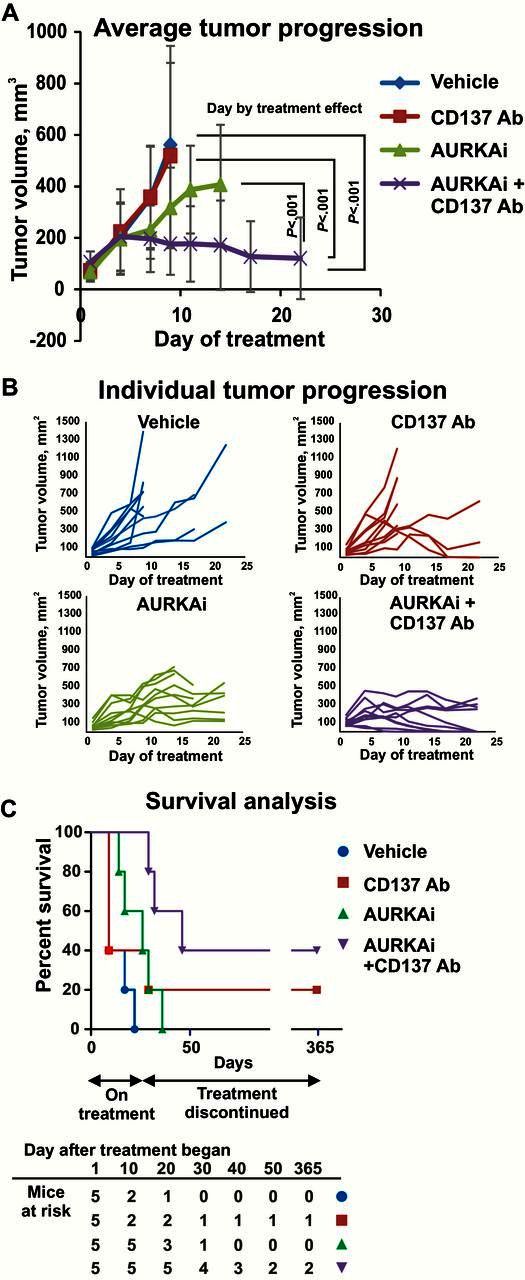
Effect of senescence-inducing therapy on tumor response to T-cell stimulation with CD137 agonist antibody. A) Average progression of the SM1 melanoma tumors grown in C57Bl6 mice that were treated with 30mg/kg of AURKAi (5 mice bearing 2 tumors each) or vehicle (5 mice, 2 tumors each) and injected with anti-CD137 antibody (115µg i.p.) or isotype control every other day. A linear mixed-effects model was fitted to compare tumor volume in treatment groups and calculate P values. This test was two-sided. To meet the normality assumptions, square root transformations of tumor volumes were performed. Error bars represent SD. B) Tumor volume changes over the treatment course are shown for each individual tumor described in (A). Survival of SM1 tumor-bearing mice treated as described in (A). Mice were monitored for 12 months after the completion of the therapy.
Association of CCL5 Expression With Tumor-Suppressive Immune Environment in Human Melanoma Tumors
We next sought to determine if our findings are relevant in human disease. Using PDX tumors, we showed that CCL5 is induced in vivo in response to the senescence-inducing treatments with AURKAi (fold CCL5 induction ±SD in three tested mice were 4.9±0.2, 3.9±1.2, and 20.4±2.7 for PDX1 and 10.1±0.9, 6.8±0.3, 2.9±0.1 for PDX2, P = .02 and 0.007, respectively) and CDK4/6i (fold CCL5 induction ±SD were 45.9±7, 33.8±5.3, and 3.9±0.1, P = .01) (Figure 6A). Furthermore, analysis of the TCGA dataset of 278 melanoma tumors revealed association between CCL5 and immune marker expression (Figure 6B). Interestingly, while the pan-leukocyte marker CD45 had a moderate association with CCL5 expression (Pearson score = 0.47, P < .001), the molecules associated with T-cells (CD2, CD3, CD8A and B, CXCR3, CCR5) and cytotoxic immune cells (granzymes and FAS ligand) showed a very strong positive association with CCL5 (Pearson score > 0.9, P < .001) (Figure 1, B and C). Moreover, the GO gene set enrichment analysis on genes co-expressed with CCL5 in the TCGA dataset showed very strong association with the terms “Immune Response” and “T-cell activation” (Benjamini-adjusted P values are 1.4x10-93 and 1.9x10⁻²⁹, respectively) (Supplementary Table 4, available online). We also analyzed tumor tissue from patients enrolled in the AURKAi clinical trial (NCT01316692) that were collected pre- and post-therapy (Supplementary Table 5, available online). Notably, patients who gained therapeutic benefit had increased CCL5 expression and CD8 T-cells recruitment in tumors post-treatment, while treatment-resistant tumors showed no CCL5 and CD8 induction (Figure 6, D and E).
Figure 6.

Analysis of CCL5 expression in human melanoma tumors in response to senescent-inducing therapy and its association with tumor-suppressive immune microenvironment. A) Induction of CCL5 expression by senescence-inducing therapy in patient-derived melanoma tumors. Nude mice bearing subcutaneous PDX tumors were treated with vehicle, 30mg/kg of AURKAi, or 100mg/kg CDK4/6i (LEE011) for two to four weeks until the tumors in control group reached 15mm in diameter. CCL5 mRNA expression was analyzed in tumors from three mice in each treatment group using real-time polymerase chain reaction. The levels of CCL5 mRNA were normalized to β-Actin mRNA. The statistical significance of the deference between CCL5 levels in tumors of vehicle- and AURKAi- or CDK4/6i-treated mice was analyzed using linear mixed-effects regression; base 2 logarithmic transformation of expression fold-change was performed. B) Genes co-expressed with CCL5 in human melanoma tumors. CBio portal analysis was performed on The Cancer Genome Atlas (TCGA) melanoma tumor collection. Genes showing very strong (Pearson correlation coefficient r > 0.9) positive relationship with CCL5 are displayed. C) Scatter plots demonstrating co-expression of selected genes (pan-leukocyte marker CD45, cytotoxic T-cell marker CD8A, and protease of cytotoxic immune cells granzyme B) with CCl5. Analysis of the TCGA melanoma dataset performed using CBio portal resource. D) Induction of CCL5 expression by AURKAi treatment in human melanoma tumors. The levels of CCL5 mRNA were normalized to β-Actin mRNA. Tumor tissue from patients treated with AURKAi was sampled before the AURKAi treatment was initiated and five to seven months after the trial therapy started. Response was determined in accordance with the Response Evaluation Criteria In Solid Tumors (RECIST). E) Immunofluorescent staining of tumor-infiltrating CD8+ cells in samples from patients enrolled in AURKAI trial. All tests of statistical significance were two-sided. Error bars represent SD. TCGA = The Cancer Genoma Atlas.
Discussion
Melanoma is among immunogenic tumors that are often treated with immunotherapy (35,36). The immune checkpoint blockade with CTLA4 and PD-1 antagonists is the most promising approach in melanoma immunotherapy to date (4–6). Interestingly, an analysis of melanoma patients receiving PD-1 blockade showed that responders have higher percentages of cytotoxic T-cells in the tumor (37). Here, we tested if therapy that promotes tumor immune infiltration can sensitize melanoma to immunotherapy. Indeed, tumors treated with senescence-inducing drugs exhibited increased T-cell infiltration and responded better to T-cell stimulation with CD137 agonists compared with nonsenescent tumors. Multiple clinical trials with agonists of CD137 (Urelumab or BMS-663513 and PF-05082566) are ongoing. Other antibodies activating costimulatory pathways in T-cells (eg, OX40, GITR, CD40) or targeting co-inhibitory pathways (TIM-3, LAG-3) are currently in clinical and preclinical development (38,39). Furthermore, it was recently shown that combined therapy with BRAF and MEK inhibitors increases CD8+ T-cell infiltration in mouse BRAFV600E tumors, and the addition of PD-1-blocking antibodies to this regiment improves therapeutic responses (40). Therefore, it is plausible that TIS may sensitize melanoma tumors to an immune checkpoint blockade.
Our results indicate that upon cessation of TIS melanoma tumors can evade an antitumor immune response. Consequently, TIS may only temporarily sensitize tumors to immunotherapy, which argues for a combined therapy approach. A potential drawback of administering immunotherapy in combination with senescent-inducing drugs is that the latter will block cell proliferation, which is important for T-cell expansion. While in our mouse experiments antimitotic therapy strongly promoted, rather than inhibited, response to CD137 stimulation treatment effect may differ in humans. In a phase I clinical trial of alisertib, about 20% of patients developed neutropenia; however, it was generally resolved in less than seven days (41). Therefore, sequential drug administration may be advantageous.
Senescence induced by p53 can promote tumor immune surveillance (19,42). Here we demonstrated that leukocyte recruitment by TIS depends on CCL5 activation. CCL5 is a chemokine ligand for CCR5, CCR3, and CCR1 receptors found on activated T, natural killer, immature dendritic, and other cells (43). CCL5 expression is increased in human melanoma tumors responding to chemotherapy and is associated with better patient survival and increased levels of T-cell markers (44). We found that response to senescence-inducing treatment is fully abrogated in CCL5-deficient tumors, suggesting that CCL5 favors a tumor-suppressive immune microenvironment.
Using a mouse model to investigate the interplay between melanoma cells and the host’s immunity is a limitation of our study as it may differ in humans. To address this issue, we supported our conclusions with analysis of samples from melanoma patients such as PDX, clinical trial material, and TCGA collection. In addition, while studying tumors from the AURKAi clinical trial yielded results that fit well with our hypotheses, the number of samples was limited and the tumor locations varied between samples. Therefore, these results should be interpreted with caution.
In summary, our findings demonstrate that TIS promotes expression of chemotactic protein CCL5 that facilitates immune cell homing into melanoma tumors to support antitumor inflammatory response. Combining TIS with T-cell-activating therapies may improve the outcome for many melanoma patients.
Funding
This work was supported by the Department of Veterans Affairs (MERIT grant number 5101BX000196-04 and a senior research career scientist award to A. Richmond), by the Harry J. Lloyd Charitable Trust award (to A. Vilgelm), and by the National Cancer Institute at the National Institutes of Health (grant numbers CA116021, CA90625, and CA68485).
Supplementary Material
The study funders had no role in the design of the study; the collection, analysis, or interpretation of the data; the writing of the manuscript; or the decision to submit the manuscript for publication.
References
- 1. Balch CM, Gershenwald JE, Soong SJ, et al. Final version of 2009 AJCC melanoma staging and classification. J Clin Oncol. 2009;27(36):6199–6206. [DOI] [PMC free article] [PubMed] [Google Scholar]
- 2. Robert C, Karaszewska B, Schachter J, et al. Improved overall survival in melanoma with combined dabrafenib and trametinib. N Engl J Med. 2015;372(1):30–39. [DOI] [PubMed] [Google Scholar]
- 3. Sosman JA, Kim KB, Schuchter L, et al. Survival in BRAF V600-mutant advanced melanoma treated with vemurafenib. N Engl J Med. 2012;366(8):707–714. [DOI] [PMC free article] [PubMed] [Google Scholar]
- 4. Topalian SL, Hodi FS, Brahmer JR, et al. Safety, activity, and immune correlates of anti-PD-1 antibody in cancer. N Engl J Med. 2012;366(26):2443–2454. [DOI] [PMC free article] [PubMed] [Google Scholar]
- 5. Hamid O, Robert C, Daud A, et al. Safety and tumor responses with lambrolizumab (anti-PD-1) in melanoma. N Engl J Med. 2013;369(2):134–144. [DOI] [PMC free article] [PubMed] [Google Scholar]
- 6. Hodi FS, O’Day SJ, McDermott DF, et al. Improved survival with ipilimumab in patients with metastatic melanoma. N Engl J Med. 2010;363(8):711–723. [DOI] [PMC free article] [PubMed] [Google Scholar]
- 7. Kuilman T, Peeper DS. Senescence-messaging secretome: SMS-ing cellular stress. Nat Rev Cancer. 2009;9(2):81–94. [DOI] [PubMed] [Google Scholar]
- 8. Coppe JP, Desprez PY, Krtolica A, et al. The senescence-associated secretory phenotype: the dark side of tumor suppression. Annu Rev Pathol. 2010;5:99–118. [DOI] [PMC free article] [PubMed] [Google Scholar]
- 9. Chandler H, Peters G. Stressing the cell cycle in senescence and aging. Curr Opin Cell Biol. 2013;25(6):765–771. [DOI] [PubMed] [Google Scholar]
- 10. Salminen A, Kauppinen A, Kaarniranta K. Emerging role of NF-kappaB signaling in the induction of senescence-associated secretory phenotype (SASP). Cell Signal. 2012;24(4):835–845. [DOI] [PubMed] [Google Scholar]
- 11. Perez-Mancera PA, Young AR, Narita M. Inside and out: the activities of senescence in cancer. Nat Rev Cancer. 2014;14(8):547–558. [DOI] [PubMed] [Google Scholar]
- 12. Ewald JA, Desotelle JA, Wilding G, et al. Therapy-induced senescence in cancer. J Natl Cancer Inst. 2010;102(20):1536–1546. [DOI] [PMC free article] [PubMed] [Google Scholar]
- 13. Vilgelm A, Richmond A. Combined therapies that induce senescence and stabilize p53 block melanoma growth and prompt anti-tumor immune responses. OncoImmunology. 2015;4(8):e1009299. [DOI] [PMC free article] [PubMed] [Google Scholar]
- 14. Vilgelm AE, Washington MK, Wei J, et al. Interactions of the p53 protein family in cellular stress response in gastrointestinal tumors. Mol Cancer Ther. 2010;9(3):693–705. [DOI] [PMC free article] [PubMed] [Google Scholar]
- 15. Huck JJ, Zhang M, McDonald A, et al. MLN8054, an inhibitor of Aurora A kinase, induces senescence in human tumor cells both in vitro and in vivo. Mol Cancer Res. 2010;8(3):373–384. [DOI] [PubMed] [Google Scholar]
- 16. Anders L, Ke N, Hydbring P, et al. A systematic screen for CDK4/6 substrates links FOXM1 phosphorylation to senescence suppression in cancer cells. Cancer Cell. 2011;20(5):620–634. [DOI] [PMC free article] [PubMed] [Google Scholar]
- 17. Rader J, Russell MR, Hart LS, et al. Dual CDK4/CDK6 inhibition induces cell-cycle arrest and senescence in neuroblastoma. Clin Cancer Res. 2013;19(22):6173–6182. [DOI] [PMC free article] [PubMed] [Google Scholar]
- 18. Liu Y, Hawkins OE, Su Y, et al. Targeting aurora kinases limits tumour growth through DNA damage-mediated senescence and blockade of NF-kappaB impairs this drug-induced senescence. EMBO Mol Med. 2013;5(1):149–166. [DOI] [PMC free article] [PubMed] [Google Scholar]
- 19. Vilgelm AE, Pawlikowski JS, Liu Y, et al. Mdm2 and aurora kinase a inhibitors synergize to block melanoma growth by driving apoptosis and immune clearance of tumor cells. Cancer Res. 2015;75(1):181–193. [DOI] [PMC free article] [PubMed] [Google Scholar]
- 20. Dean JL, McClendon AK, Knudsen ES. Modification of the DNA damage response by therapeutic CDK4/6 inhibition. J Biol Chem. 2012;287(34):29075–29087. [DOI] [PMC free article] [PubMed] [Google Scholar]
- 21. Achuthan S, Santhoshkumar TR, Prabhakar J, et al. Drug-induced senescence generates chemoresistant stemlike cells with low reactive oxygen species. J Biol Chem. 2011;286(43):37813–37829. [DOI] [PMC free article] [PubMed] [Google Scholar]
- 22. Velarde MC, Demaria M, Campisi J. Senescent cells and their secretory phenotype as targets for cancer therapy. Interdiscip Top Gerontol. 2013;38:17–27. [DOI] [PMC free article] [PubMed] [Google Scholar]
- 23. Sagiv A, Krizhanovsky V. Immunosurveillance of senescent cells: the bright side of the senescence program. Biogerontology. 2013;14(6):617–628. [DOI] [PubMed] [Google Scholar]
- 24. Ruffell B, Coussens LM. Macrophages and Therapeutic Resistance in Cancer. Cancer Cell. 2015;27(4):462–472. [DOI] [PMC free article] [PubMed] [Google Scholar]
- 25. Koya RC, Mok S, Otte N, et al. BRAF inhibitor vemurafenib improves the antitumor activity of adoptive cell immunotherapy. Cancer Res. 2012;72(16):3928–3937. [DOI] [PMC free article] [PubMed] [Google Scholar]
- 26. Yang J, Amiri KI, Burke JR, et al. BMS-345541 targets inhibitor of kappaB kinase and induces apoptosis in melanoma: involvement of nuclear factor kappaB and mitochondria pathways. Clin Cancer Res. 2006;12(3 Pt 1):950–960. [DOI] [PMC free article] [PubMed] [Google Scholar]
- 27. Bennett DC, Cooper PJ, Hart IR. A line of non-tumorigenic mouse melanocytes, syngeneic with the B16 melanoma and requiring a tumour promoter for growth. Int J Cancer. 1987;39(3):414–418. [DOI] [PubMed] [Google Scholar]
- 28. Wang D, Yang W, Du J, et al. MGSA/GRO-mediated melanocyte transformation involves induction of Ras expression. Oncogene. 2000;19(40):4647–4659. [DOI] [PMC free article] [PubMed] [Google Scholar]
- 29. Su Y, Vilgelm AE, Kelley MC, et al. RAF265 inhibits the growth of advanced human melanoma tumors. Clin Cancer Res. 2012;18(8):2184–2198. [DOI] [PMC free article] [PubMed] [Google Scholar]
- 30. Tusher VG, Tibshirani R, Chu G. Significance analysis of microarrays applied to the ionizing radiation response. Proc Natl Acad Sci U S A. 2001;98(9):5116–5121. [DOI] [PMC free article] [PubMed] [Google Scholar]
- 31. Wang J, Duncan D, Shi Z, et al. WEB-based GEne SeT AnaLysis Toolkit (WebGestalt): update 2013. Nucleic Acids Res. 2013;41(Web Server issue):W77–W83. [DOI] [PMC free article] [PubMed] [Google Scholar]
- 32. Cerami E, Gao J, Dogrusoz U, et al. The cBio cancer genomics portal: an open platform for exploring multidimensional cancer genomics data. Cancer Discov. 2012;2(5):401–404. [DOI] [PMC free article] [PubMed] [Google Scholar]
- 33. Haferkamp S, Borst A, Adam C, et al. Vemurafenib induces senescence features in melanoma cells. J Invest Dermatol. 2013;133(6):1601–1609. [DOI] [PubMed] [Google Scholar]
- 34. DeBenedette MA, Chu NR, Pollok KE, et al. Role of 4-1BB ligand in costimulation of T lymphocyte growth and its upregulation on M12 B lymphomas by cAMP. J Exp Med. 1995;181(3):985–992. [DOI] [PMC free article] [PubMed] [Google Scholar]
- 35. Day CL, Jr, Sober AJ, Kopf AW, et al. A prognostic model for clinical stage I melanoma of the upper extremity. The importance of anatomic subsites in predicting recurrent disease. Ann Surg. 1981;193(4):436–440. [DOI] [PMC free article] [PubMed] [Google Scholar]
- 36. Oble DA, Loewe R, Yu P, et al. Focus on TILs: prognostic significance of tumor infiltrating lymphocytes in human melanoma. Cancer Immun. 2009;9:3. [PMC free article] [PubMed] [Google Scholar]
- 37. Tumeh PC, Harview CL, Yearley JH, et al. PD-1 blockade induces responses by inhibiting adaptive immune resistance. Nature. 2014;515(7528):568–571. [DOI] [PMC free article] [PubMed] [Google Scholar]
- 38. Curti BD, Urba WJ. Clinical deployment of antibodies for treatment of melanoma. Mol Immunol. 2015;67(2 Pt A):18–27. [DOI] [PubMed] [Google Scholar]
- 39. Ascierto PA, Kalos M, Schaer DA, et al. Biomarkers for immunostimulatory monoclonal antibodies in combination strategies for melanoma and other tumor types. Clin Cancer Res. 2013;19(5):1009–1020. [DOI] [PubMed] [Google Scholar]
- 40. Hu-Lieskovan S, Mok S, Homet Moreno B, et al. Improved antitumor activity of immunotherapy with BRAF and MEK inhibitors in BRAF(V600E) melanoma. Sci Transl Med. 2015;7(279):279ra41. [DOI] [PMC free article] [PubMed] [Google Scholar]
- 41. Cervantes A, Elez E, Roda D, et al. Phase I pharmacokinetic/pharmacodynamic study of MLN8237, an investigational, oral, selective aurora a kinase inhibitor, in patients with advanced solid tumors. Clin Cancer Res. 2012;18(17):4764–4774. [DOI] [PubMed] [Google Scholar]
- 42. Xue W, Zender L, Miething C, et al. Senescence and tumour clearance is triggered by p53 restoration in murine liver carcinomas. Nature. 2007;445(7128):656–660. [DOI] [PMC free article] [PubMed] [Google Scholar]
- 43. Bonecchi R, Galliera E, Borroni EM, et al. Chemokines and chemokine receptors: an overview. Front Biosci (Landmark Ed). 2009;14:540–551. [DOI] [PubMed] [Google Scholar]
- 44. Hong M, Puaux AL, Huang C, et al. Chemotherapy induces intratumoral expression of chemokines in cutaneous melanoma, favoring T-cell infiltration and tumor control. Cancer Res. 2011;71(22):6997–7009. [DOI] [PubMed] [Google Scholar]
Associated Data
This section collects any data citations, data availability statements, or supplementary materials included in this article.