

Abstract
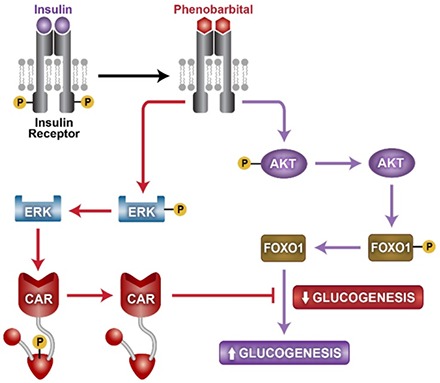
Phenobarbital (PB) antagonized insulin to inactivate the insulin receptor and attenuated the insulin receptor downstream protein kinase B (AKT)–forkhead box protein O1 and extracellular signal-regulated kinase 1/2 signals in mouse primary hepatocytes and HepG2 cells. Hepatic AKT began dephosphorylation in an early stage of PB treatment, and blood glucose levels transiently increased in both wild-type and constitutive androstane receptor (CAR) knockout (KO) mice. On the other hand, blood glucose levels increased in wild-type mice, but not KO mice, in later stages of PB treatment. As a result, PB, acting as an insulin receptor antagonist, elicited CAR-independent increases and CAR-dependent decreases of blood glucose levels at these different stages of treatment, respectively. Reciprocally, insulin activation of the insulin receptor repressed CAR activation and induction of its target CYP2B6 gene in HepG2 cells. Thus, PB and insulin cross-talk through the insulin receptor to regulate glucose and drug metabolism reciprocally.
Introduction
Phenobarbital (PB) treatment is known to improve insulin sensitivity and decrease blood glucose levels in patients (Lahtela et al., 1984, 1985). Reflecting what was observed in human studies, PB treatment decreased blood glucose levels in rats (Karvonen et al., 1989; Venkatesan et al., 1994). Moreover, in genetically engineered mice, the nuclear receptor constitutive androstane receptor (CAR; NR1I3) was found to mediate this PB-induced decrease in blood glucose levels (Dong et al., 2009; Jiang and Xie, 2013). Mechanistically, CAR directly interacts with forkhead box protein O1 (FOXO1) to suppress its binding to an insulin response sequence (IRS) and prevent gluconeogenic genes from being activated (Kodama et al., 2004). PB is also well known as the classic inducer of hepatic drug metabolism, first reported in 1962 (Kato et al., 1962). CAR regulates not only glucose but also this induction of drug metabolism. In fact, CAR was originally characterized as a PB-activated transcription factor that activates the classic PB-induced CYP2B gene (Honkakoski et al., 1998). Reciprocally, insulin is known to repress PB induction of cytochrome P450 2B (CYP2B) (Schenkman, 1991; Yoshida et al., 1996; Woodcroft and Novak, 1997; Kawamura et al., 1999). Here, we examined cross-talk between PB and insulin via the insulin receptor to regulate both glucose and drug metabolism and their molecular mechanisms.
In 1986, PB treatment was reported to inactivate hepatic insulin receptor (Hwang et al., 1986). However, the biologic consequences of this insulin receptor inactivation on PB actions to regulate either drug or glucose metabolism and, moreover, CAR activation had never been considered in this context. Recently, the cell signal–mediated mechanism by which PB, not a CAR ligand, indirectly activates CAR was determined. PB directly binds to epidermal growth factor (EGF) receptor (EGFR) and represses its downstream extracellular signal-regulated kinase 1/2 (ERK1/2) signaling; this repression becomes a CAR activation signal (Mutoh et al., 2009, 2013; Osabe and Negishi, 2011). Given the finding that PB attenuates EGFR signaling that activates CAR, we hypothesized and examined whether PB also interacts with other cell membrane receptors and regulates CAR activation.
For this study, the insulin receptor was chosen to examine this hypothesis. CAR knockout (KO) mice, mouse primary hepatocytes, and human hepatoma-derived HepG2 cells were used for experimental systems, and Western blot and reverse-transcriptase polymerase chain reaction (PCR) were used for analytical methods to investigate insulin receptor phosphorylation and its downstream signal molecules [protein kinase B (AKT), FOXO1, ERK1/2, and receptor for activated kinase C 1 (RACK1)] and the CYP2B, PEPCK1, and G6Pase genes as regulatory targets. Here, we present experimental results supporting that PB and insulin cross-talk via the insulin receptor to mutually regulate glucose and drug metabolism. PB treatment transiently caused CAR-independent increases of blood glucose levels during the early stage of treatment and CAR-dependent decreases in the later stage. Reciprocally, insulin repressed PB induction of CYP2B. These findings may provide insight into understanding functional interactions between drugs and insulin and their consequences in drug efficacy and/or toxicity.
Materials and Methods
Reagents and Materials.
Phenobarbital, 1,4-bis(3,5-dichloro-2-pyridinyloxy)benzene (TCPOBOP), 6-(4-chlorophenyl)imidazo(2,1-b)(1,3)thiazole-5-carbaldehyde O-(3,4-dichlorobenzyl)oxime (CITCO), and insulin were purchased from Sigma-Aldrich (St. Louis, MO). QuikChange site-directed mutagenesis kit was from Stratagene (La Jolla, CA). Protein L resins were from Pierce (Rockford, IL). Dynabeads Protein G were from Invitrogen (Carlsbad, CA). Antibodies against RACK1 and mouse normal IgM were from BD Biosciences (San Jose, CA). Antibodies against FOXO1, TATA-box binding protein, horseradish peroxidase (HRP)–conjugated rabbit or mouse IgG antibodies (raised in goat), and normal mouse IgG were from Santa Cruz Biotechnology (Dallas, TX). An antibody against CAR was from Perseus Proteomics (Tokyo, Japan). Antibodies against the insulin receptor, phosphorylated insulin receptor (Tyr1150+1151), AKT, phosphorylated AKT (Ser473), phosphorylated FOXO1 (Ser256), ERK1/2, and phosphorylated ERK1/2 (Thr202/Tyr204) were from Cell Signaling Technology (Danvers, MA). An antibody against phosphorylated insulin receptor (Tyr973) was from Abcam (Cambridge, UK). Enhanced chemiluminescence reagents were from Advansta (Menlo Park, CA). Polyvinylidene difluoride membranes were from GE Healthcare (Munich, Germany). Antibodies against the phosphorylated Tyr52 peptide of RACK1 and an antibody against the phosphorylated Thr38 peptide of CAR were produced and characterized in previous work (Osabe and Negishi, 2011; Mutoh et al., 2013). HepG2-derived Ym17 cells, which stably express mouse CAR, were described in our previous report (Swales et al., 2005).
Animal Treatments.
Nine- to 10-week-old Car+/+ C3He males were purchased from Charles River Laboratories (Wilmington, MA). Car−/− C3He males were bred in the National Institute of Environmental Health Sciences (NIEHS) animal facility. All mice were maintained in a temperature- and light-controlled facility and had free access to water and diet. All animal procedures were approved by the Animal Ethics Committee NIEHS, National Institutes of Health. In each experiment, mice were randomly divided into two groups and treated with phosphate-buffered saline (PBS) or phenobarbital at a dose of 100 mg/kg body weight. Phenobarbital was given by intraperitoneal injection in all treatment groups.
Measurement of Blood Glucose Level over Time.
Mice were treated with phenobarbital once a day for 2 days. Immediately after the second injection, mice were fasted and blood was collected from each mouse via tail vein 0, 6, 12, 18, and 24 hours after fasting. Blood glucose levels were determined using the AccuChek Active glucometer (Roche Diagnostics, Indianapolis, IN). The glucometer was calibrated and validated following the manufacturer’s guidelines. To delineate changes over time, data were fit to a cubic equation using GraphPad Prism 5 software (www.graphpad.com).
Cell Culture and Transfection.
Mouse primary hepatocytes were isolated from 6- to 8-week-old C57BL/6 male mice (Charles River) using a two-step collagenase perfusion and seeded on collagen-coated 24-well plates (BD Biosciences). Four hours after seeding, culture medium was changed to prewarmed Williams’ E medium containing 10% fetal bovine serum, 1 mM sodium pyruvate, 100 U/ml penicillin, and 100 μg/ml streptomycin. HepG2 and Ym17 cells were maintained in Dulbecco’s modified Eagle’s medium (Gibco BRL, Gaithersburg, MD) supplemented with 10% fetal bovine serum (Atlanta Biologicals, Flowery Branch, GA), 1 mM sodium pyruvate, 100 U/ml penicillin, and 100 μg/ml streptomycin. These cells (3 × 10⁵ cells/well) were placed on a 24-well plate. HepG2 cells plated on 24-well plate or 10-mm dish at a density of 5 × 10⁵ cells/ml were transfected with Lipofectamine 2000 (Invitrogen), according to the manufacturer’s instructions, for 24 hours prior to drug treatments.
Coimmunoprecipitation.
HepG2 cells after drug treatment were lysed by sonication in lysis buffer [20 mM Tris-HCl (pH 7.6), 1 mM EDTA, 200 mM NaCl, 1% Triton X-100] and centrifuged at 12,000g for 5 minutes. The resulting supernatant was incubated with the indicated antibody overnight at 4°C. Immunoprecipitates were prepared by incubation with Dynabeads Protein G or Protein L resin for 3 hours at 4°C. The precipitates were washed three times with lysis buffer and then added to sample buffer for SDS-PAGE.
Western Blots.
HepG2 cells or mouse primary hepatocytes were lysed by sonication in 50 mM Tris-HCl buffer saline (pH 7.6) containing 8 M urea and 0.1% SDS, and then centrifuged. Proteins were separated by SDS-PAGE and transferred onto a polyvinylidene difluoride membrane for Western blot analysis. The membrane was blocked in 5% nonfat milk or 5% bovine serum albumin in 25 mM Tris-HCl (pH 7.5) containing 137 mM NaCl and 0.1% Tween 20 for 1 hour, and then incubated for overnight at 4°C with a given primary or HRP-conjugated Flag antibody. HRP-conjugated anti-rabbit IgG or anti-mouse IgM was used as a secondary antibody. Finally, protein bands were visualized using enhanced chemiluminescence Western blotting detection reagent (Advansta).
Quantitative Real-Time PCR.
Total RNAs were isolated from HepG2 and Ym17 cells or hepatocytes using Trizol Reagent (Life Technologies, Carlsbad, CA) and subjected to cDNA synthesis using the High-Capacity cDNA Archive Kit (Life Technologies). Real-time PCR was performed using the ABI Prism 7700 Sequence Detection System (Life Technologies). Specific detection probes (Life Technologies) used for PCR with the TaqMan PCR Master Mix (Life Technologies) were human CYP2B6 mRNA (Hs00167937_m1), human G6Pase mRNA (Hs00609178_m1), mouse CYP2B10 mRNA (Mm00456591_m1), and mouse G6Pase mRNA (Mm00839363_m1). The TaqMan human and mouse glyceraldehyde-3-phosphate dehydrogenase probes (Life Technologies) were used as internal controls to normalize expression levels of a given mRNA.
Statistical Analysis.
Blood glucose and real-time PCR data were shown as the mean and analyzed with Student’s t test or one-way analysis of variance for all groups, followed by pairwise comparisons. Significant values are represented as P < 0.05, P < 0.01 and P < 0.001.
Results
Blood Glucose Levels after PB Treatment.
PB was administered to wild-type and CAR KO male mice 24 hours prior to taking blood samples and again administered at the time fasting began (10:00 a.m.). Blood samples were collected every 6 hours from those mice to determine glucose levels. Consistent with previous observations, 24-hour PB treatment lowered blood glucose levels about 16% in wild-type but not KO males (128.1 ± 2.35 in PB and 148.2 ± 6.32 in PBS), although levels remained constant in PBS-treated males (Fig. 1A). After fasting, blood glucose levels began a gradual decrease in both PBS-treated wild-type and KO males. PB treatment slowed down this decrease and kept blood glucose levels higher in both wild-type and KO males. Wild-type males attenuated the levels 18 hours after PB treatment to those observed in the PBS-treated males (75.2 ± 2.77 in PB and 77.3 ± 2.21 in PBS). On the other hand, PB-treated KO males retained higher glucose levels at all time points and never lowered them to the levels of PBS-treated males (100.7 ± 5.18 in PB and 78.2 ± 3.35 in PBS). These results suggest that PB caused a CAR-independent slowdown of the decrease in blood glucose levels in the early period of treatment as well as the CAR-dependent attenuation in the later period.
Fig. 1.

Time-dependent changes in blood glucose levels in PB-treated fasting mice. (A) Blood was collected from fasting CAR+/+ and CAR−/− mice at various times indicated after PB or PBS treatment and subjected to a glycometer. Values express the mean ± S.E. (n = 9 or 10). The data on blood glucose level were fit to a cubic equation. **P < 0.01 and ***P < 0.005 for significance in difference between PBS- and PB-treated samples at each time point. (B) Nuclear extracts prepared from the livers of CAR wild-type mice after PB treatment were subjected to Western blot analysis with anti-CAR or anti–TATA-box binding protein (TBP) antibodies. Hr, hours after treatment. (C and D) Hepatic RNA samples were prepared from CAR wild-type mice at various time points after PB treatment and were subjected to real-time PCR analysis. The relative expression values of CYP2B10 (C) or G6Pase (D) mRNAs were normalized to endogenous glyceraldehyde-3-phosphate dehydrogenase mRNA levels using the comparative cycle threshold method. Values express the mean ± S.D. (n = 4). *P < 0.05 and ***P < 0.005 for significance in difference compared with PB-injected mice at 0 hour.
Nuclear CAR accumulation was barely observed in the livers 30 minutes after PB treatment compared with that 18 hours after treatment (Fig. 1B). Consistent with this CAR accumulation, CYP2B10 mRNA induction was not detected 30 minutes after PB treatment (Fig. 1C). On the other hand, G6Pase mRNA was already increased at 30 minutes and then declined at 18 hours after PB treatment (Fig. 1D), which agreed with the blood glucose levels of Fig. 1A.
PB Actions to Repress the Insulin Receptor Signaling.
Mouse primary hepatocytes exhibited a concentration-dependent insulin activation of the insulin receptor, as indicated by phosphorylation of three tyrosine residues (Fig. 2A). PB treatment at 20 µM began to dephosphorylate activated insulin receptor in the presence of 10 nM insulin. CAR ligand TCPOBOP did not influence dephosphorylation. As the insulin receptor activated, the insulin receptor downstream AKT-FOXO1 signaling was also activated (i.e., phosphorylated) by insulin treatment (Fig. 2, B and C). Activation of this so-called insulin signaling leads to suppression of gluconeogenic genes and gluconeogenesis. As shown in Fig. 2, B and C, both phosphorylated AKT and FOXO1 were dephosphorylated after PB treatment, but not TCPOBOP treatment; the dephosphorylation by PB appeared to begin at 20 µM. These results indicated that PB antagonized insulin activation of the insulin receptor, thereby offsetting insulin activation of the AKT-FOXO1 signal. In addition, the insulin receptor activation by insulin also resulted in activation of mitogen-activated protein kinase kinase 1/2-ERK1/2 signaling, as indicated by ERK1/2 phosphorylation. PB treatment, but not TCPOBOP treatment, repressed ERK1/2 phosphorylation in the presence of 10 nM insulin (Fig. 2D). RACK1 is a signal scaffold protein involved in various signal transductions. RACK1 was phosphorylated by insulin and dephosphorylated after PB treatment (Fig. 2E). For both ERK1/2 and RACK1, their significant dephosphorylations began to occur at 200 µM PB. Dephosphorylation of ERK1/2 and RACK1 was previously characterized as the PB-induced signaling that indirectly activates nuclear receptor CAR.
Fig. 2.

PB antagonizes insulin-elicited insulin receptor (IR) phosphosphorylation and its downstream signals in mouse primary hepatocytes. Hepatocytes were prepared from C3H male mice and cultured as described in the Materials and Methods and were treated with various concentrations of insulin or cotreated with insulin (10 nM) and increased concentrations of PB or TCPOBOP for 30 minutes. Total extracts from these hepatocytes were subjected to Western blot analysis with anti–phospho-Tyr972 (p-Tyr972) or anti–phospho-Tyr1150+1151 (p-Tyr1150+51) antibody for the insulin receptor (A), anti–phospho-Ser473 antibody for AKT (p-AKT) (B), anti–phospho-Ser256 for FOXO1 (p-FOXO1) (C), anti–phospho-Thr202/Tyr204 antibody for ERK1/2 (p-ERK1/2) (D), and anti–phospho-Tyr52 antibody for RACK1 (p-RACK1) (E). Antibody that reacts both phosphorylated and nonphosphorylated protein was used to observe the total amount of each protein (A–E).
Transient Upsurge of Blood Glucose in Mice.
PB slowed down the decrease in blood glucose levels within the first 6 hours after treatment in wild-type (WT) and KO mice (Fig. 1). To further dissect this slowdown, blood glucose levels were examined 30 minutes after PB treatment; levels in both WT and KO mice surged from 160 ± 6 to nearly 186 ± 8 mg/dl in the former and from 154 ± 9 to 182 ± 7 mg/dl in the latter (Fig. 3A). At this treatment point, AKT was significantly dephosphorylated in the livers of both WT and KO mice (Fig. 3B). In addition, hepatic levels of G6Pase were elevated in both strains of mice (Fig. 3C). PEPCK1 mRNAs appeared to be increased also, although it was not statistically significant (Fig. 3C). These results indicate that an early action of PB treatment is to repress the AKT signal and increase gluconeogenesis, thereby causing a surge in blood glucose levels in a CAR-independent mechanism.
Fig. 3.

Transient upsurge of blood glucose shortly after PB treatment in mice. (A) Blood was collected from fasting males 30 minutes after PB or PBS treatment and subjected to a glycometer. Values of blood glucose levels are expressed as the mean ± S.E. (n = 4); *P < 0.05 for significance differences between PBS- and PB-treated mice. From the same mice, total liver extracts and RNAs were prepared for Western blot (B) and real-time PCR (C) analysis, respectively, for AKT and P6Pase and PEPCK1 mRNA as described in the Materials and Methods and Figs. 1 and 2. Values of PCR are expressed as the mean ± S.D. (n = 4); *P < 0.05 for significance in difference compared with PBS treatment.
PB Actions to Repress the Insulin Receptor Signal in HepG2 Cells.
As observed in mouse primary hepatocytes, insulin treatment activated (i.e., phosphorylated) the insulin receptor in a concentration-dependent manner in human hepatoma–derived HepG2 cells, whereas cotreatment with PB, but not a human CAR ligand CITCO, inactivated the insulin receptor via dephosphorylation (Fig. 4A). Competitive binding assays suggested that PB binding of the insulin receptor (Supplemental Fig. 1) revealed two different affinity values of about 21.5 ± 15.5 and 2.2 ± 1.4 mM, thereby indicating the possibility that PB may directly bind to the insulin receptor to antagonize insulin. Subsequently, repression of insulin (AKT-FOXO1) signaling was examined (Fig. 4, B and C). Both AKT and FOXO1 were activated (i.e., phosphorylated) after insulin treatment and repressed this phosphorylation after PB treatment, but not CITCO treatment. Insulin treatment decreased G6Pase mRNA levels in HepG2 cells in which endogenous CAR is barely present, and PB cotreatment restored those levels (Fig. 4D). On the other hand, cotreatment with PB failed to recover G6Pase mRNA levels decreased by insulin in Ym17 cells (Fig. 4E). These results indicate that PB could antagonize insulin signaling to stimulate gluconeogenesis in the absence of CAR.
Fig. 4.

PB antagonizes insulin-elicited insulin receptor (IR) phosphorylation and its downstream signals in HepG2-derived Ym17 cells stably expressed in mouse CAR. Ym17 cells were treated with insulin at various concentrations as indicated or cotreated with 10 nM insulin and either PB or CITCO at increasing concentrations as indicated for 30 minutes (A, B, C, and E). (D) HepG2 cells were treated with PB, insulin or PB or cotreated with PB and insulin. Total extracts and RNAs from these cells were subjected to Western blot and real-time PCR analysis, respectively, as described in Figs. 1 and 2. Values of PCR are expressed as the mean ± S.D. (n = 4); *P < 0.05 for significance in difference compared with PBS treatment. p-AKT, phospho-Ser473 antibody for AKT; p-FOXO1, phospho-Ser256 for FOXO1; p-Tyr1150+51, phospho-Tyr1150+1151 for IR; p-Tyr972, phospho-Tyr972 for IR.
CYP2B10 Induction through the Insulin Receptor.
The insulin receptor activation resulted in an increased phosphorylation of both RACK1 and ERK1/2, and as expected, the insulin receptor inactivation by PB caused them to be dephosphorylated in Ym17 cells, a line that stably expresses mouse CAR (Fig. 5, A and B). Our previous works determined RACK1 and ERK1/2 as two essential signal molecules that regulate CAR activation; phosphorylated ERK1/2 binds inactivated CAR, whereas dephosphorylated RACK1 binds CAR to activate it (Osabe and Negishi, 2011; Mutoh et al., 2013). Consistent with the ways by which insulin or PB regulates the insulin receptor and its downstream RACK1 and ERK1/2, insulin treatment decreased interactions between CAR and RACK1, whereas PB cotreatment increased this interaction. On the other hand, CAR interaction with ERK1/2 was increased and decreased after insulin treatment and PB cotreatment, respectively (Fig. 5C). These patterns of interactions were suggestive of insulin-PB cross-talk to regulate CAR-mediated transcription of the CYP2B6 gene. We used HepG2-derived Ym17 cells to examine this cross-talk and found that insulin repressed PB-induced CYP2B10 mRNA levels in a concentration-dependent manner (Fig. 5D). However, insulin did not repress levels induced by TCPOBOP. These results indicate that insulin activates the insulin receptor to suppress CYP2B10 mRNA, whereas PB, but not TCPOBOP, inactivates the insulin receptor to induce it.
Fig. 5.

PB antagonizes insulin activating the insulin receptor to elicit CAR activation signal. (A and B) Ym17 cells were pretreated with insulin (left) for 30 minutes prior to cotreatment with insulin (10 nM) and PB or CITCO at indicated concentrations for an additional 30 minutes. Phosphorylation of RACK1 (A) and ERK1/2 (B) was confirmed by Western blot as described in the Materials and Methods and Fig. 2, A and B. (C) HepG2 cells were transfected with Flag-CAR expression plasmid and treated with PBS or insulin or cotreated insulin and PB as mentioned earlier, from which total extracts were prepared for subsequent coimmunoprecipitation and Western blots. Coimmunoprecipitation was performed for RACK1 (top) or ERK1/2 (bottom) as described in the Materials and Methods. Western blot is described in Fig. 2. (D) Ym17 cells were cotreated with PB (2 mM) or TCPOBOP (250 nM) and various concentrations of insulin for 24 hours, from which RNAs were prepared for real-time PCR for CYP2B6 mRNA as described in Fig. 1. CYP2B6 expression levels were calculated relative to control levels without insulin. Values are expressed as the mean ± S.D. (n = 4); *P < 0.05 for significance in difference compared with mRNA level in the absence of insulin. IP, immunoprecipitation; p-ERK1/2, phospho-Thr202/Tyr204 antibody for ERK1/2; p-RACK1, phospho-Tyr52 antibody for RACK1.
Discussion
PB has been found to bind and antagonize the insulin receptor signal, similar to what our previous study demonstrated with EGF and EGFR (Mutoh et al., 2013). A role for EGF in the repression of CAR-mediated transactivation of the phenobarbital responsive enhancer module was first described in rat primary hepatocytes (Meyer et al., 1989). Subsequent works identified ERK1/2 as an essential downstream molecule of the EGFR signal that represses CAR activation and CYP2B induction (Koike et al., 2007; Mutoh et al., 2009; Osabe and Negishi, 2011). To activate CAR indirectly, PB binds to EGFR and antagonistically attenuates the EGF-ERK1/2 signal (Mutoh et al., 2013). Since PB also represses the insulin-ERK1/2 signal, PB and insulin reciprocally regulating CAR activation should have been expected. In fact, PB treatment was found to induce CYP2B6 mRNA in Ym17 cells, whereas insulin cotreatment diminished this induction in a concentration-dependent manner.
RACK1 is another signal molecule involved in CAR activation; upon PB treatment, RACK1 is dephosphorylated at threonine 57 to bind and activate PP2Ac on CAR for CAR activation (Mutoh et al., 2013). Insulin increases RACK1 phosphorylation, which prevents it from binding to CAR. PB reverses these insulin actions to elicit the CAR activation signal. Thus, insulin can regulate not only ERK1/2 but also RACK1 signal to repress CAR activation in the cytoplasm. Insulin also regulates FOXO1, which coactivates CAR-mediated transcription (Kodama et al., 2004). Consistent with this coactivation, CYP2B10 expression is upregulated in the livers of FOXO1 transgenic mice (Zhang et al., 2006). Since the insulin receptor-AKT signal stimulates FOXO1 phosphorylation to eliminate FOXO1 from the nucleus (Biggs et al., 1999; Rena et al., 2001; Zhang et al., 2002), insulin could repress CYP2B10 expression via FOXO1. Therefore, PB and insulin cross-talk could also occur in the nucleus; insulin-induced depletion of FOXO1 reduces CAR to transcriptionally activate its targets, such as CYP2B genes. Thus, PB and insulin cross-talk via the insulin receptor reciprocally regulates downstream ERK1/2, RACK1, and FOXO1 signals that activate CAR and induces CYP2B. This insulin receptor–mediated cross-talk mechanism has provided the molecular basis for understanding a long-standing question of how insulin represses hepatic drug metabolism.
In our present study, whereas blood glucose levels gradually declined after fasting in both CAR wild-type and KO mice, they remained higher 18 hours after PB treatment in CAR KO mice, compared with those in CAR wild-type mice. This finding is consistent with an already established notion that CAR interacts with FOXO1, preventing it from binding and enhancing IRS, thereby decreasing gluconeogenesis and blood glucose levels in mice (Kodama et al., 2004). FOXO1 activates IRS to induce gluconeogenic genes, and insulin stimulates FOXO1 phosphorylation to inactivate and exclude it from the nucleus and suppress gluconeogenesis during feeding. After prolonged fasting, FOXO1 is gradually imported back into the nucleus as insulin levels decline. Under conditions such as an 18-hour PB treatment, the CAR-FOXO1 complex greatly increased in the liver nuclear fractions (Supplemental Fig. 2); CAR accumulates in the nucleus, catches incoming FOXO1, and represses its transcriptional activity. Therefore, the function of CAR to repress gluconeogenesis is insulin-independent in nature.
Contrary to what was observed at later stages of PB treatment, blood glucose levels transiently increase shortly after treatment in both CAR wild-type and CAR KO mice. The fact that G6Pase, but not CYP2B10, mRNA levels increase indicates that, although PB already attenuates the gluconeogenic signal, the CAR activation signal has not been elicited in CAR wild-type mice within this short time of treatment. It is now understood that PB can either increase or decrease blood glucose levels, depending on treatment conditions.
TCPOBOP and CITCO are agonistic ligands of mouse and human CAR, respectively. Our previous experiments indicate that CITCO is unable to activate and translocate human CAR T38D mutant in mouse liver (Mutoh et al., 2009). Therefore, CAR must be dephosphorylated prior to ligand binding, or ligands promote dephosphorylation. It has now been found that, unlike PB, these lignds do not attenuate the insulin receptor signaling, nor does insulin repress CYP2B6 induction. Similarly, these ligands also did not inactivate EGFR (unpublished observation). Thus, CAR ligands do not use the cell membrane receptor-initiated CAR activation mechanism. Whether ligand binding recruits RACK1 and PP2Ac to CAR for dephosphorylation remains unknown at the present time. If it does, deciphering its molecular mechanism is an urgent target of future investigations.
In conclusion, PB treatment decreases blood glucose levels in mice and humans. The molecular basis underlying this PB action is PB interacting with the insulin receptor and antagonizing its signaling. PB attenuates the insulin receptor–ERK1 signal, and this attenuation elicits CAR activation. Once CAR is activated and accumulates in the nucleus, CAR forms a complex with FOXO1 to attenuate the gluconeogenic insulin receptor–AKT signal and decreases blood glucose levels in fasting mice in later stages of PB treatment. On the other hand, in early PB treatment stages where CAR is not activated, attenuation of the insulin receptor–AKT signal causes a transient upsurge of blood glucose levels. Our present study provides new insights into understanding how PB and CAR regulate gluconeogenesis and drug metabolism and may also have clinical implications for metabolic diseases caused by xenobiotic exposures.
Supplementary Material
Acknowledgments
The authors thank Comparative Medicine Branch and DNA Sequence Core at NIEHS for their assistance.
Abbreviations
- AKT
protein kinase B
- CAR
constitutive androstane receptor
- CITCO
6-(4-chlorophenyl)imidazo(2,1-b)(1,3)thiazole-5-carbaldehyde O-(3,4-dichlorobenzyl)oxime
- CYP
cytochrome P450
- EGF
epidermal growth factor
- EGFR
EGF receptor
- ERK1/2
extracellular signal-regulated kinase
- FOXO1
forkhead box protein O1
- HRP
horseradish peroxidase
- IRS
insulin response sequence
- KO
knockout
- NIEHS
National Institute of Environmental Health Sciences
- PB
phenobarbital
- PBS
phosphate-buffered saline
- PCR
polymerase chain reaction
- RACK1
receptor of activated protein kinase C 1
- TCPOBOP
1,4-bis(3,5-dichloro-2-pyridinyloxy)benzene
- WT
wild type
Authorship Contributions
Participated in research design: Negishi, Yasujima.
Conducted experiments: Yasujima, Saito, Moore.
Contributed new reagents or analytic tools: Yasujima, Saito, Moore.
Performed data analysis: Yasujima, Saito.
Wrote or contributed to the writing of the manuscript: Negishi, Yasujima, Saito.
Footnotes
This work was supported by the Intramural Research Program of the National Institutes of Health and National Institute of Environmental Health Sciences [Grant Z01ES71005-01].
 This article has supplemental material available at jpet.aspetjournals.org.
References
- Biggs WH, 3rd, Meisenhelder J, Hunter T, Cavenee WK, Arden KC. (1999) Protein kinase B/Akt-mediated phosphorylation promotes nuclear exclusion of the winged helix transcription factor FKHR1. Proc Natl Acad Sci USA 96:7421–7426. [DOI] [PMC free article] [PubMed] [Google Scholar]
- Dong B, Saha PK, Huang W, Chen W, Abu-Elheiga LA, Wakil SJ, Stevens RD, Ilkayeva O, Newgard CB, Chan L, et al. (2009) Activation of nuclear receptor CAR ameliorates diabetes and fatty liver disease. Proc Natl Acad Sci USA 106:18831–18836. [DOI] [PMC free article] [PubMed] [Google Scholar]
- Honkakoski P, Zelko I, Sueyoshi T, Negishi M. (1998) The nuclear orphan receptor CAR-retinoid X receptor heterodimer activates the phenobarbital-responsive enhancer module of the CYP2B gene. Mol Cell Biol 18:5652–5658. [DOI] [PMC free article] [PubMed] [Google Scholar]
- Hwang DL, Roitman A, Lev-Ran A, Carr BI. (1986) Chronic treatment with phenobarbital decreases the expression of rat liver EGF and insulin receptors. Biochem Biophys Res Commun 135:501–506. [DOI] [PubMed] [Google Scholar]
- Jiang M, Xie W. (2013) Role of the constitutive androstane receptor in obesity and type 2 diabetes: a case study of the endobiotic function of a xenobiotic receptor. Drug Metab Rev 45:156–163. [DOI] [PubMed] [Google Scholar]
- Karvonen I, Huupponen R, Niemelä KM, Sotaniemi E. (1989) Effects of phenobarbital on hepatic glucose metabolism and NADPH production in Zucker rats. Arch Int Pharmacodyn Ther 302:40–48. [PubMed] [Google Scholar]
- Kato R, Chiesara E, Vassanelli P. (1962) Factors influencing induction of hepatic microsomal drug-metabolizing enzymes. Biochem Pharmacol 11:211–220. [DOI] [PubMed] [Google Scholar]
- Kawamura A, Yoshida Y, Kimura N, Oda H, Kakinuma A. (1999) Phosphorylation/Dephosphorylation steps are crucial for the induction of CYP2B1 and CYP2B2 gene expression by phenobarbital. Biochem Biophys Res Commun 264:530–536. [DOI] [PubMed] [Google Scholar]
- Kodama S, Koike C, Negishi M, Yamamoto Y. (2004) Nuclear receptors CAR and PXR cross talk with FOXO1 to regulate genes that encode drug-metabolizing and gluconeogenic enzymes. Mol Cell Biol 24:7931–7940. [DOI] [PMC free article] [PubMed] [Google Scholar]
- Koike C, Moore R, Negishi M. (2007) Extracellular signal-regulated kinase is an endogenous signal retaining the nuclear constitutive active/androstane receptor (CAR) in the cytoplasm of mouse primary hepatocytes. Mol Pharmacol 71:1217–1221. [DOI] [PMC free article] [PubMed] [Google Scholar]
- Lahtela JT, Arranto AJ, Sotaniemi EA. (1985) Enzyme inducers improve insulin sensitivity in non-insulin-dependent diabetic subjects. Diabetes 34:911–916. [DOI] [PubMed] [Google Scholar]
- Lahtela JT, Särkkä P, Sotaniemi EA. (1984) Phenobarbital treatment enhances insulin mediated glucose metabolism in man. Res Commun Chem Pathol Pharmacol 44:215–226. [PubMed] [Google Scholar]
- Meyer SA, Gibbs TA, Jirtle RL. (1989) Independent mechanisms for tumor promoters phenobarbital and 12-O-tetradecanoylphorbol-13-acetate in reduction of epidermal growth factor binding by rat hepatocytes. Cancer Res 49:5907–5912. [PubMed] [Google Scholar]
- Mutoh S, Osabe M, Inoue K, Moore R, Pedersen L, Perera L, Rebolloso Y, Sueyoshi T, Negishi M. (2009) Dephosphorylation of threonine 38 is required for nuclear translocation and activation of human xenobiotic receptor CAR (NR1I3). J Biol Chem 284:34785–34792. [DOI] [PMC free article] [PubMed] [Google Scholar]
- Mutoh S, Sobhany M, Moore R, Perera L, Pedersen L, Sueyoshi T, Negishi M. (2013) Phenobarbital indirectly activates the constitutive active androstane receptor (CAR) by inhibition of epidermal growth factor receptor signaling. Sci Signal 6:ra31. [DOI] [PMC free article] [PubMed] [Google Scholar]
- Osabe M, Negishi M. (2011) Active ERK1/2 protein interacts with the phosphorylated nuclear constitutive active/androstane receptor (CAR; NR1I3), repressing dephosphorylation and sequestering CAR in the cytoplasm. J Biol Chem 286:35763–35769. [DOI] [PMC free article] [PubMed] [Google Scholar]
- Rena G, Prescott AR, Guo S, Cohen P, Unterman TG. (2001) Roles of the forkhead in rhabdomyosarcoma (FKHR) phosphorylation sites in regulating 14-3-3 binding, transactivation and nuclear targetting. Biochem J 354:605–612. [DOI] [PMC free article] [PubMed] [Google Scholar]
- Schenkman JB. (1991) Induction of diabetes and evaluation of diabetic state on P450 expression. Methods Enzymol 206:325–331. [DOI] [PubMed] [Google Scholar]
- Swales K, Kakizaki S, Yamamoto Y, Inoue K, Kobayashi K, Negishi M. (2005) Novel CAR-mediated mechanism for synergistic activation of two distinct elements within the human cytochrome P450 2B6 gene in HepG2 cells. J Biol Chem 280:3458–3466. [DOI] [PubMed] [Google Scholar]
- Venkatesan N, Davidson MB, Simsolo RB, Kern PA. (1994) Phenobarbital treatment enhances insulin-mediated glucose metabolism and improves lipid metabolism in the diabetic rat. Metabolism 43:348–356. [DOI] [PubMed] [Google Scholar]
- Woodcroft KJ, Novak RF. (1997) Insulin effects on CYP2E1, 2B, 3A, and 4A expression in primary cultured rat hepatocytes. Chem Biol Interact 107:75–91. [DOI] [PubMed] [Google Scholar]
- Yoshida Y, Kimura N, Oda H, Kakinuma A. (1996) Insulin suppresses the induction of CYP2B1 and CYP2B2 gene expression by phenobarbital in adult rat cultured hepatocytes. Biochem Biophys Res Commun 229:182–188. [DOI] [PubMed] [Google Scholar]
- Zhang W, Patil S, Chauhan B, Guo S, Powell DR, Le J, Klotsas A, Matika R, Xiao X, Franks R, et al. (2006) FoxO1 regulates multiple metabolic pathways in the liver: effects on gluconeogenic, glycolytic, and lipogenic gene expression. J Biol Chem 281:10105–10117. [DOI] [PubMed] [Google Scholar]
- Zhang X, Gan L, Pan H, Guo S, He X, Olson ST, Mesecar A, Adam S, Unterman TG. (2002) Phosphorylation of serine 256 suppresses transactivation by FKHR (FOXO1) by multiple mechanisms. Direct and indirect effects on nuclear/cytoplasmic shuttling and DNA binding. J Biol Chem 277:45276–45284. [DOI] [PubMed] [Google Scholar]
Associated Data
This section collects any data citations, data availability statements, or supplementary materials included in this article.