Abstract
Purpose
Network diffusion depends on both the pattern and timing of relations, but the relative effects of timing and structure remain unclear. Here we first show that concurrency (relations that overlap in time) increases epidemic potential by opening new routes in the network. Since this is substantively similar to adding contact paths, we next compare the effects of concurrency by observed levels of path redundancy (structural cohesion) to determine how the features interact.
Methods
We establish that concurrency increases exposure analytically and then use simulation methods to manipulate concurrency over observed networks that vary naturally on structural cohesion. This design allows us to compare networks across a wide range of concurrency holding constant features that might otherwise conflate concurrency and cohesion. We summarize the simulation results with general linear models.
Results
Our results indicate interdependent effects of concurrency and structural cohesion: although both increase epidemic potential, concurrency matters most when the graph structure is sparse, since the exposure created by concurrency is redundant to observed paths within structurally cohesive networks.
Conclusions
Concurrency works by opening new paths in temporally ordered networks. Because this is substantively similar to having additional observed paths, concurrency in sparse networks has the same effect as adding relations and will have the greatest effect on exposure potential in sparse networks.
Introduction
Social networks shape the extent and speed of disease diffusion, particularly for sexually transmitted infections like HIV (1, 2). For infection to spread there must be an unbroken contact chain exposing those who are uninfected to those who are infected. Since such networks change over time, understanding epidemic potential requires understanding the structural effects of relationship timing (3) particularly concurrent relations (4). Here, we examine how concurrency affects epidemic potential and how it is moderated by network connectivity.
Concurrency refers to relationships that overlap in time and has been linked to epidemic potential (4, 5, for detailed reviews, see 6, 7, 8), though debate continues as to the relative role of concurrency vis a vis other factors (9). Given data collection complexities with modeling disease diffusion in real settings, much of the work on concurrency uses simulations and recent data-grounded simulations extend such work to explain prevalence disparities across populations (8, 10).
We first show how concurrency affects epidemic potential by altering the constraints inherent in temporally ordered networks. We then examine how this effect is moderated by network structure. To do so, we distinguish observed contact networks from those that can carry infection given timing constraints, which we call the exposure network. Since the set of relations that carry an infection is a stochastic subset of the exposure network, the number of people ultimately infected will correlate with the density of the exposure network. Concurrency increases the density of the exposure network by creating symmetry that would not exist in networks without concurrent relations. Since concurrency creates multiple pathways in the exposure network, we explore whether the contact network structure moderates the effects of concurrency. We find that concurrency has the strongest effects when the contact network is sparse, while returns to concurrency are lower when connectivity is high, mainly because the proportion of people directly exposed is much higher. In low-cohesion networks, concurrency is equivalent to adding new independent paths in the contact network.
Formalizing the Problem
Diffusion potential in a network depends on relational timing, since pathogens cannot spread over relations that have ended: one can only pass infection to current or future partners, not past partners. To formalize this fundamental constraint, it helps to consider three related networks:
The contact network: Pairs of people linked by direct contact. Contact relations are timed by date of first and last contact.
The exposure network: A subset of the relations in the contact network where timing makes it possible for one person to infect another.
The transmission network: The subset of the exposure network where infection passes. This is a stochastic tree layered on (2) determined by the particular source individuals(s) and pairwise transmission probability.
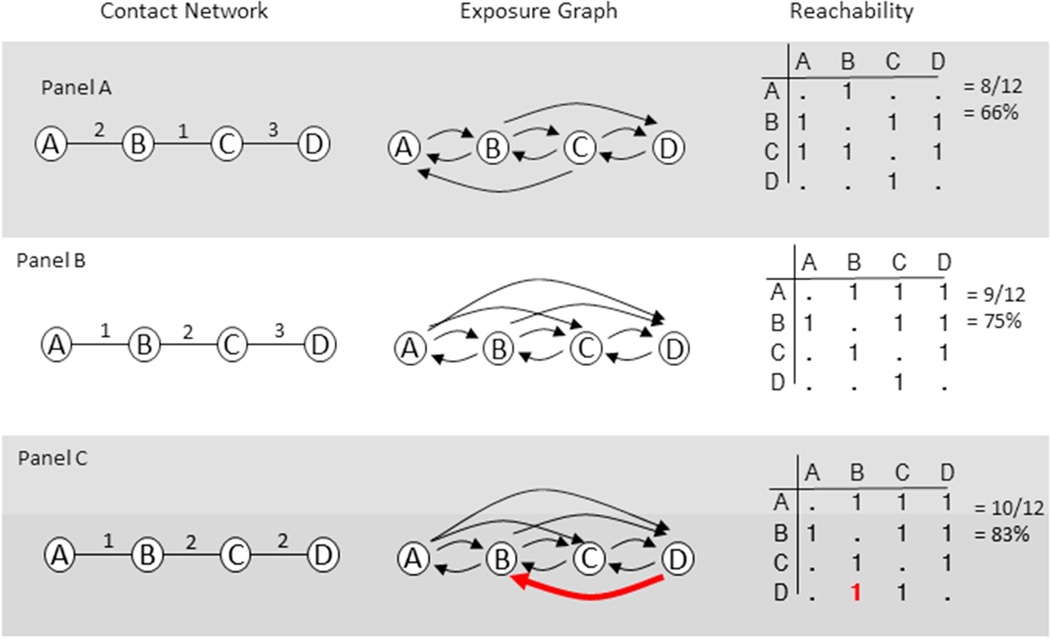
The timing of relations in the contact network determines the exposure network which in turn limits the number of people infected in the transmission network. Figure 1 illustrates how timing affects exposure on three identical contact networks.
Figure 1.
Illustrating the effect of timing on exposure
In figure 1, the first column presents the contact network, with numbers over the relations indicating timing. For example, person A in panel A has a relation with person B at time 2. A time-ordered path is a sequence of adjacent relations where, for each pair of relations in the sequence, the start time S() of the first relation is less than or equal to the end time E() of the second: S(R1) ≤ E(R2), and the set of all time-ordered paths defines the exposure network. The second column of figure 1 provides a graphical representation of the exposure network, representing all pairs reachable by time-ordered paths, recorded as an adjacency matrix in column 3. Diffusion can only occur given exposure; for example, we see that in panel A person B can infect person D, but because the BC relation ends before the AB relation starts, person D cannot infect B.
Adjacent relations are concurrent if they overlap in time, which occurs if S(R1) ≤ E(R2) and S(R2) ≤ E(R1). In figure 1 panels A and B, there are no concurrent relations, creating asymmetry in who can infect who. For example, in panel B, person B could infect person D but D cannot infect B, because the BC relation ended before the CD relation started. In panel C, the BC and CD relations are concurrent, which would allow D to infect B. In general, concurrency in the contact network creates symmetric exposure. The same contact structure with different timing can generate widely different sets of people at risk of infecting each other. A simple measure for the effect of timing on risk is the proportion of pairs in the population who could infect each other (column 3 in figure 1), which we call reachability. Here reachability in the concurrent case (83%, panel C) is about 1.25 times higher than that in the first case (66%, panel A).
These examples illustrate several ways that concurrency necessarily shapes epidemic potential. First, concurrent relations create symmetry in the exposure network by removing the protective temporal ordering created by serial monogamy. In serially monogamous settings, indirect exposure always flows down one path or another around a coupled pair, because in non-concurrent relations one relation must precede the other, and infection can only flow from preceding relations to later relations. Concurrency erases this constraint, opening exposure to a potentially much wider downstream population. Second, concurrency affects exposure to partners-of-partners by opening new exposure paths but does not necessarily affect people directly engaged in concurrent relations, since number of partners remains constant. This helps explain why associations between individual concurrency and infection risk is sometimes quite low (11). Third, as these are path-level features, there can be large non-linear effects: small changes in the path structure can potentially expose large portions of the network to new risk. As such, concurrency can increase the density of the exposure network even in cases where most people have non-concurrent relations. Since transmission is a stochastic function operating over the exposure network, any increase in the density of the exposure network will generate larger transmission trees,b all else constant.
Since concurrency shapes exposure by creating new paths for infection to flow over, we want to examine the interdependent effects of network structure and concurrency, asking whether concurrency is more or less important under different network structures. The contact structure most associated with multiple paths is structural cohesion (12), so our primary research question is how concurrency effects on epidemic potential vary by levels of structural cohesion.
Methods
Measurement
We measure the epidemic potential of a network as the proportion of (directed) pairs reachable in the time-ordered exposure network, called reachability (column 3 in figure 1). This is the proportion of pairs that could infect each other.
We measure concurrency as the proportion of adjacent relations that overlap in time.c Since all of our sample networks are connected, a network with 100% concurrency would also exhibit 100% reachability.
Structural cohesion captures the extent to which networks are connected by multiple independent pathways, which would provide multiple ways for disease to flow (12). Connectivity varies across pairs, so we measure total graph connectivity as the average of the highest k-connectivity for each pair, labeled “Avg k” in figures (see appendix 1 for details).
We also control for a number of more common network structural features. These include the network density (proportion of pairs directly connected), network centralization (inequality in closeness centrality, normalized, to capture long-tail effects common in the literature on sexual disease flow), and network diameter (number of steps connecting the most distant pair). We also calculate an indicator variable for networks with large fully connected cliques (“big clique”) which affects 4 sampled networks with more than 16 people directly connected in a single clique.
Network data
To test for interdependent effects of relational timing and network structure, we want wide variance in network contact structure. Since no such data exists for a wide sample of sexual networks, we select 4-step walks from random seeds within a large (N=68,285) collaboration network (13), drawing 100 network walks to create a population of networks to run concurrency simulations over. This procedure results in relatively small networks, which is important since measuring temporal reachability is computationally costly. The networks average 161 nodes (range 76–294); appendix 2 presents four example networks from this sample.
The advantage of these networks is that they have large heterogeneity in structural contact patterns, allowing us to examine the interplay of timing and structure in ways that are difficult in purely random networks. The networks have volume and degree patterns similar to those studied in disease transmission contexts, particularly with respect to generally low numbers of partners and very with large skew.d The disadvantage is that these are not sexual networks, so while having low volume and high centralization, they may also have features uncharacteristic of sexual networks. For example, some of these networks have dense cliques (as in the upper right of panel A, appendix 2). We also cannot independently manipulate structural cohesion via simulation in the same way we can timing, meaning there is natural correlation amongst the structural measures (but not with timing, by design), so we must use statistical models to identify marginal effects.
Simulation Design
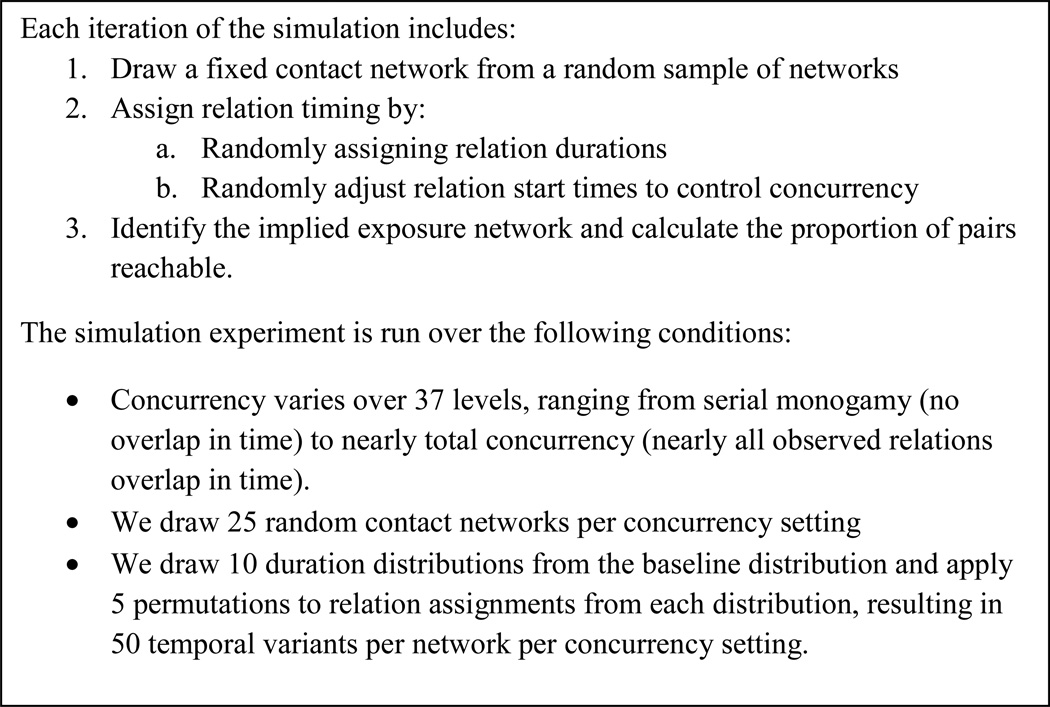
Figure 2 provides a summary of our simulation design. To manipulate concurrency, we first assign each relation a duration from a skewed distribution, reflecting populations where most relations are short but a few are long lasting.e We vary the start time for each relation based on a random uniform distribution with known variance. When the variance is small, many relations overlap in time and concurrency is high. If start time variance is high, the likelihood of temporal overlap is small and concurrency is low. Since we randomize relational timing, we ensure no correlation with structure.
Figure 2.
Simulation Design
This procedure generates 46250 observations; table 1 provides summary statistics for the achieved sample.
Table 1.
Descriptive Statistics
| VARIABLE | MEAN | STD. DEV |
MIN | MAX |
|---|---|---|---|---|
| Concurrency: Proportion of connected relations that overlap in time | 0.51 | 0.26 | 0.09 | 1.0 |
| Structural cohesion: pairwise average number of node-independent paths | 1.20 | 0.16 | 1.03 | 2.05 |
| Density: proportion of pairs connected | 0.03 | 0.02 | 0.01 | 0.09 |
| Diameter: minimum number of steps connecting most distant pair | 6.50 | 1.06 | 4.00 | 8.00 |
| Network Size: number of people in the networks | 160.26 | 65.11 | 76 | 294 |
| Closeness Centralization: inequality in distribution of distance | 0.33 | 0.07 | 0.20 | 0.50 |
| Reachability: proportion of pairs who can reach each other in time | 0.66 | 0.25 | 0.11 | 1.00 |
Models
We model reachability using a maximum likelihood GLM with a logit link function since the dependent variable ranges from 0–1. We test for nonlinear effects in concurrency as well as the interaction between concurrency and cohesion.
Results
Exemplar Cases
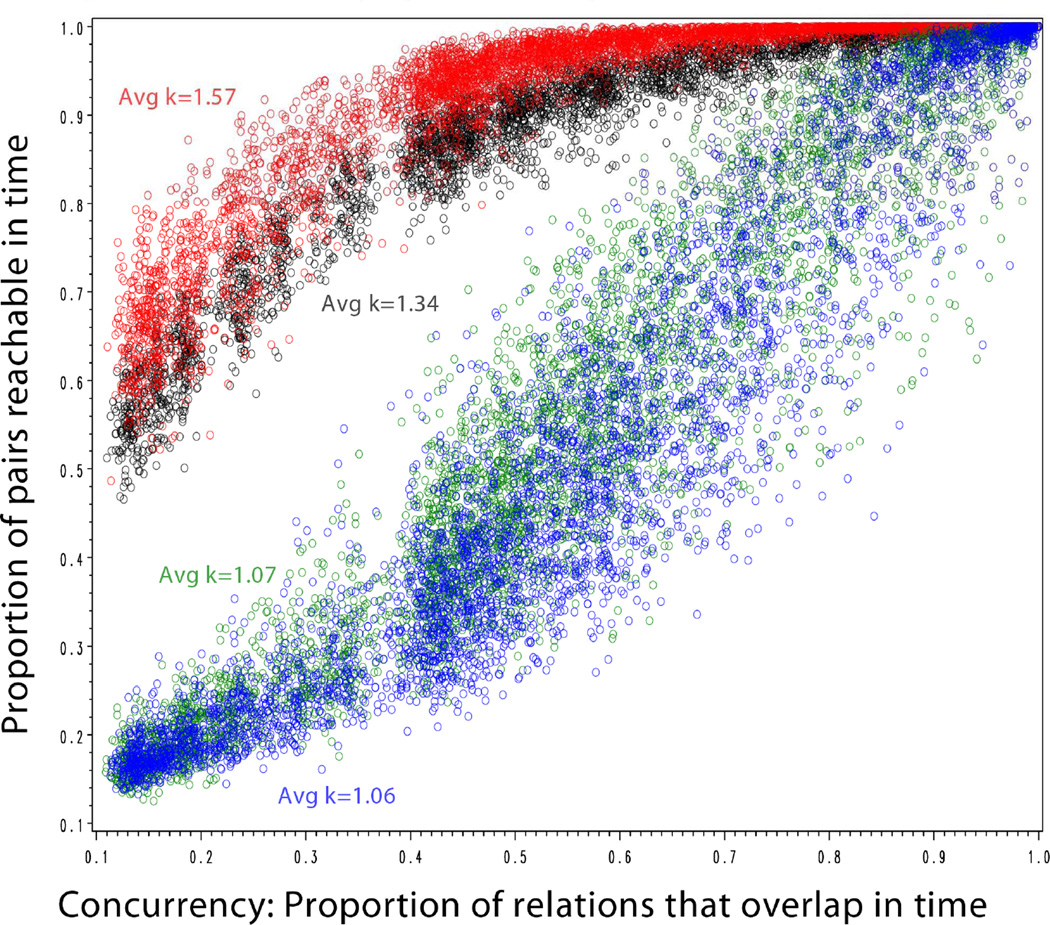
To build intuition, figure 3 presents the simulation results applied to four exemplar networks (details in Appendix 2); two networks with high cohesion and two with low cohesion. The figure shows a wide variability in reachability by concurrency, only converging (necessarily) when concurrency is 100%. Reachability increases with concurrency in both the low cohesion and high cohesion networks, but at a much steeper slope for the low-cohesion networks.
Figure 3.
Reachability by concurrency in four exemplar networks
Bivariate results
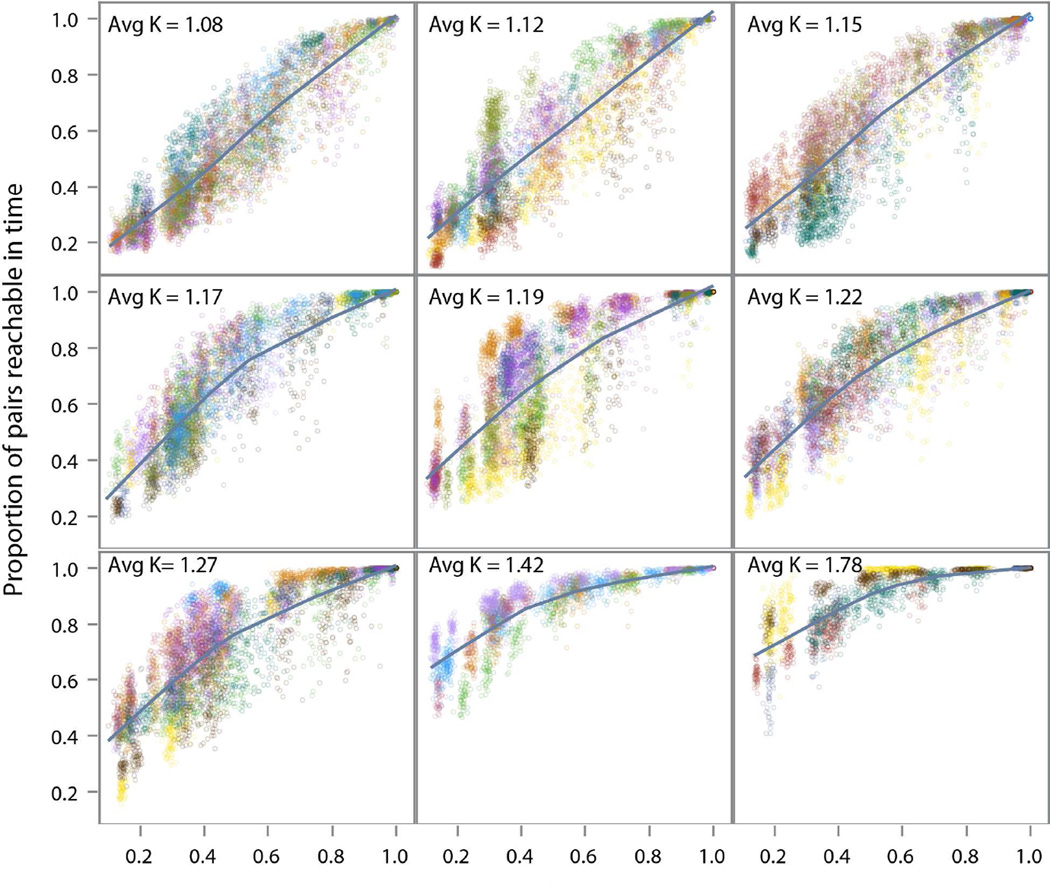
Figure 4 extends this scatterplot for the entire simulation experiment, with cases stratified by level of structural cohesion and colored by the network (colors repeated across panels).
Figure 4.
Reachability by Concurrency, stratified by Structural Cohesion
We see a strong positive association within each scatter that becomes less steep as structural cohesion increases. When cohesion is low (upper-left), the returns to concurrency are strong and nearly linear. As cohesion increases, the overall level of reachability also increases. As a result, concurrency effects are redundant to the multiple pathways already present in cohesive settings and there is comparatively less room for concurrency to make a difference, flattening out the relation.
Model Results
Since figure 4 is a bivariate result on naturally occurring networks, it is important to test whether this relation holds controlling for correlated network structural features. Table 2 provides a set of models with various specifications relating cohesion to exposure.
Table 2.
Effects of contact network structure and timing on exposure reachability. GLM regression with logit link-function.
| Parameter | Model 1 | Model 2 | Model 3 | Model 4* | Model 5 | Model 6 |
|---|---|---|---|---|---|---|
| Intercept | −8.38 (0.047) | −8.15 (0.075) | −8.04 (0.047) | −6.51 (0.113) | −6.00 (0.121) | −3.51 (0.172) |
| Concurrency | 4.73 (0.014) | 4.08 (0.164) | 2.99 (0.054) | −3.50 (0.562) | −3.39 (0.622) | −14.27 (0.869) |
| Concurrency2 | 1.88 (0.058) | 6.89 (0.713) | 6.05 (0.786) | 16.11 (1.007) | ||
| Cohesion | 3.99 (0.038) | 3.80 (0.060) | 3.89 (0.037) | 2.64 (0.094) | 4.11 (0.102) | 1.98 (0.146) |
| Concurrency × Cohesion | 0.57 (0.143) | 5.46 (0.484) | 5.47 (0.537) | 14.82 (0.750) | ||
| Concurrency2 × Cohesion | −4.16 (0.624) | −3.62 (0.691) | −12.31 (0.878) | |||
| Density | 19.63 (0.444) | 19.41 (0.447) | 20.43 (0.44) | 19.81 (0.44) | ||
| Diameter | −0.03 (0.003) | −0.03 (0.003) | −0.02 (0.003) | −0.02 (0.003) | ||
| Network Size | 0.004 (0.000) | 0.004 (0.000) | 0.004 (0.000) | 0.004 (0.000) | ||
| Closeness Centralization | 3.40 (0.048) | 3.40 (0.048) | 3.48 (0.047) | 3.48 (0.047) | ||
| Clique Dummies | Yes | Yes | Yes | Yes | Yes | No |
| R-squared+ | 0.878 | 0.879 | 0.881 | 0.882 | 0.853 | 0.853 |
| AIC | −93427 | −93442 | −94572 | −94847 | −84516 | −78384 |
All estimated coefficients significant at the p≤ 0.0001 level,
Calculated as square of correlation between predicted and observed.
Model 1 is a simple baseline model with linear effects and controls for network structure covariates. Models 2 – 4 add an interaction term between cohesion and concurrency and a curved (quadratic) term to concurrency. The first four models include structural controls, the coefficients for which vary little across specifications suggesting only minor dependence on the cohesion and concurrency specifications. These structural covariates move as we would expect, with higher epidemic potential in dense or centralized networks and lower epidemic potential in networks with large diameters. Models 5 and 6 are robustness checks, removing the controls for network structural covariates and clique outlier status respectively. Structural covariates make little difference. The indicators for having large cliques have a significant effect on the magnitude of the coefficients, but not the overall pattern of associations.f
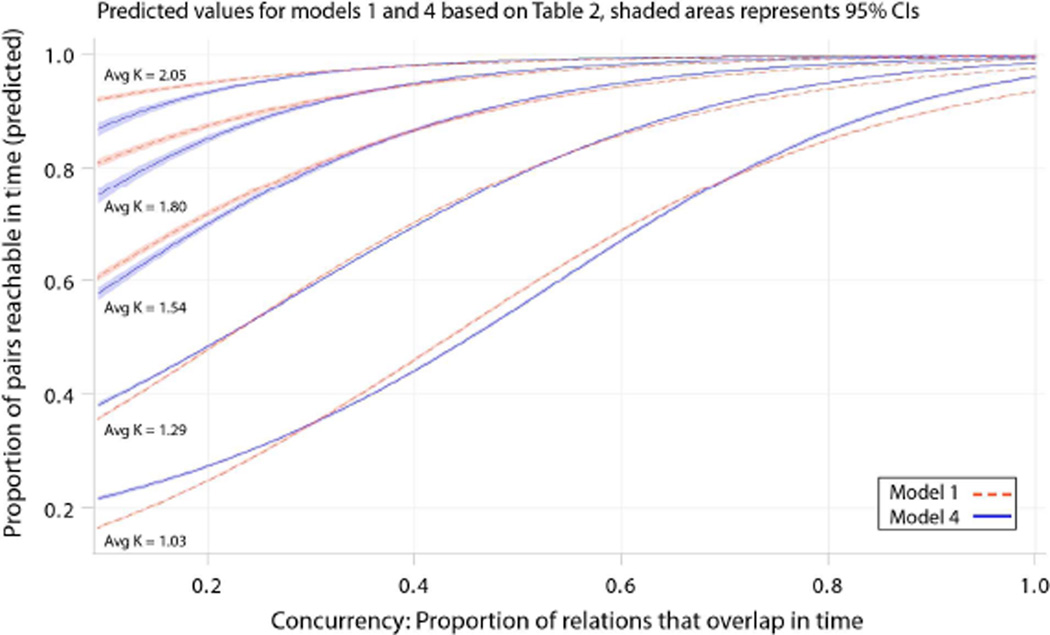
Since nonlinear models with curved interaction terms are difficult to interpret, figure 5 provides the model predictions . Holding constant other features of the settings, the fitted model mirrors the bivariate results: the slope for concurrency is steepest in networks that are the least cohesive and the slope flattens in more cohesive settings. We include model predictions for both model 1 and model 4 (best fitting according to AIC).
Figure 5.
Exposure Reachabilty by Concurrency
Summary and Conclusions
We contribute to debates about the effects of concurrency on epidemic potential by asking how concurrency affects exposure – the set of temporally ordered pairs capable of infecting each other. We have two primary results. First, we identify a necessary graph theoretic relationship between concurrency and temporal reachability: concurrency creates symmetry in exposure, opening paths that would be unavailable in networks with the same contact pattern but no concurrency. Since transmission can only occur over current and future relations, serial monogamy creates purely asymmetric flow across pairs of relations. Concurrent relations change this flow pattern and open additional paths in the exposure network. Because transmission is a stochastic function on the exposure network, creating new paths in the exposure network increases epidemic potential.
Second, we use simulations to evaluate how network path structure and concurrency interact. Controlling for other network characteristics, we find that structural cohesion—the number of node-independent paths connecting pairs in the network—boosts transmission directly, moderating the marginal returns to concurrency. While concurrency increases exposure under all structural conditions, the effect is strongest in low cohesion networks because cohesive networks have more contact paths generating higher reachability in the absence of concurrency. This means that concurrency makes the most difference on exposure in weakly connected networks.
Low-cohesion networks are likely a common feature of many heterosexual networks of interest for disease spread. The limitation to cross-sex ties forbids closed triads in the contact network, which dampens structural cohesion. For instance, the “Jefferson High” adolescent network is characterized by spanning-tree like structures with low-cohesion (14). The Colorado Springs “high risk” sexual contact network (as measured) is more mixed: 67% of the identified population are members of the largest component (weakly connected), with 41% of those in the largest 2-connected component (15). Since structural cohesion is bound by degree (number of relations for a given individual), any setting with low average degree is likely also low-cohesion. For example, recent work on partnering patterns in Shanghi suggest a very low-cohesion network (16). In these low-cohesion settings, knowing the extent of temporal overlap is critical for understanding exposure risk, since concurrency is equivalent to adding extra paths or increasing the average degree of the network.
Debates about the empirical effects of concurrency in populations suffering from HIV epidemics should consider the interplay between concurrency and network topology. The necessary relation between timing and exposure suggests that low empirical associations between concurrency and epidemic size must be due to other confounding features or incomplete data. Advancing our understanding of these epidemics requires that we start with the analytic features that must be true, and then assess how data and structural features might confound observations.
Limitation & Future Work
This paper is primarily an analytic exercise assessing how relational timing affects diffusion potential. The effects of concurrency on symmetry are necessary analytically, but the simulation results are limited by the scope of the simulation. The networks under consideration are small, and while small networks themselves are sometimes of interest (17), we are also fundamentally interested in larger networks. Since large epidemics must arise out of accumulations of small epidemic fronts, we think these results are telling for the case at hand. Moreover, we have examined networks an order of magnitude larger (1000s of nodes) and find similar results, though computational complexity limits us to much smaller sampling sizes. Still, it will be important to know how topology intersects with size to potentially moderate the effects of cohesion.
While our simulations run over real network structures that provide wide topological variability, these collaboration networks likely contain structural features that differ from the sexual networks of interest. Future work should move in two directions. First, it is important to draw on our (unfortunately limited) population of known sexual network structures to identify key features that characterize settings where diseases are endemic. Second, an ideal computational experiment would directly randomize both the timing (as we do) and the relevant structure of the network. Unfortunately there are no ready algorithms for manipulating structural cohesion independently of other network features, which is why we rely on running our simulations over extant networks and summarizing marginal effects with statistical models. Future algorithmic work on generating networks with non-local network features, such as structural cohesion, is needed to make this possible.
Given the range of contact topologies that might moderate timing, future work could extend this project in multiple ways. The path-generating effects of concurrency lead us to focus on the structure of redundant contact paths, but there are likely other moderators as well, and we expect that such features likely account for the variability identified within concurrency settings. Critically, identifying how exposure and timing interact with node level features (such as average degree or degree skew) would ease empirical verification, since such features are easier to measure in the populations of interest.
Acknowledgments
Thanks to Martina Morris, jimi adams, members of the DNAC lab, responses at the Southern Sociological Association meetings and International Network for Social Network Analysis conferences for earlier discussions related to this project. This work is partially supported by NIH grant HD075712 and a James S. McDonnell Foundation Complexity Scholars award.
Appendix 1
Measuring Structural Cohesion
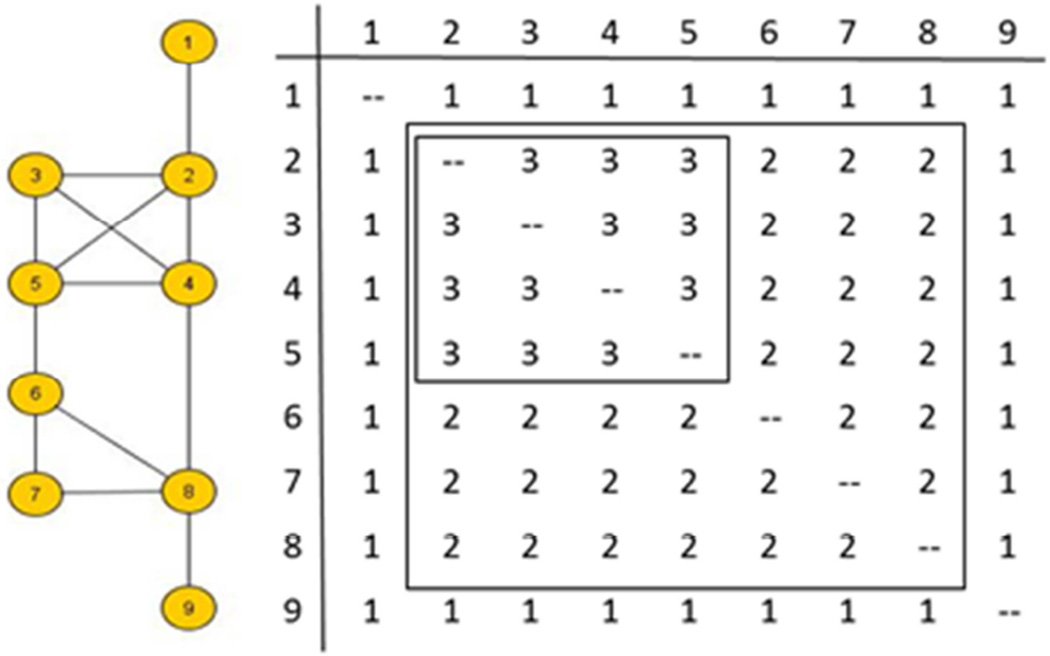
Structural cohesion captures path redundancy in a network. Formally, a k-connected component is defined as a maximal subset of the network where each pair is linked by at least k paths sharing only start and end nodes (called node independent paths, Moody & White 2003). Equivalently, k is the number of individuals who, if removed from the network, would disconnect it.
Figure A1. Measuring Network Structural Cohesion
Since structural cohesion defines a pattern of connectivity across the entire network, with some pairs more strongly connected than others, we measure total graph connectivity as the average of the highest connectivity for each pair. Figure A1 illustrates this measure. Persons 1 and 9 are 1-connected (removing persons 2 or 8 respectively would disconnect them from the rest of the network), the bulk of the network is 2-connected (persons 2 through 8), while 2,3,4 and 5 are 3-connected. The average k-connectivity of this network is 1.75.
Appendix 2
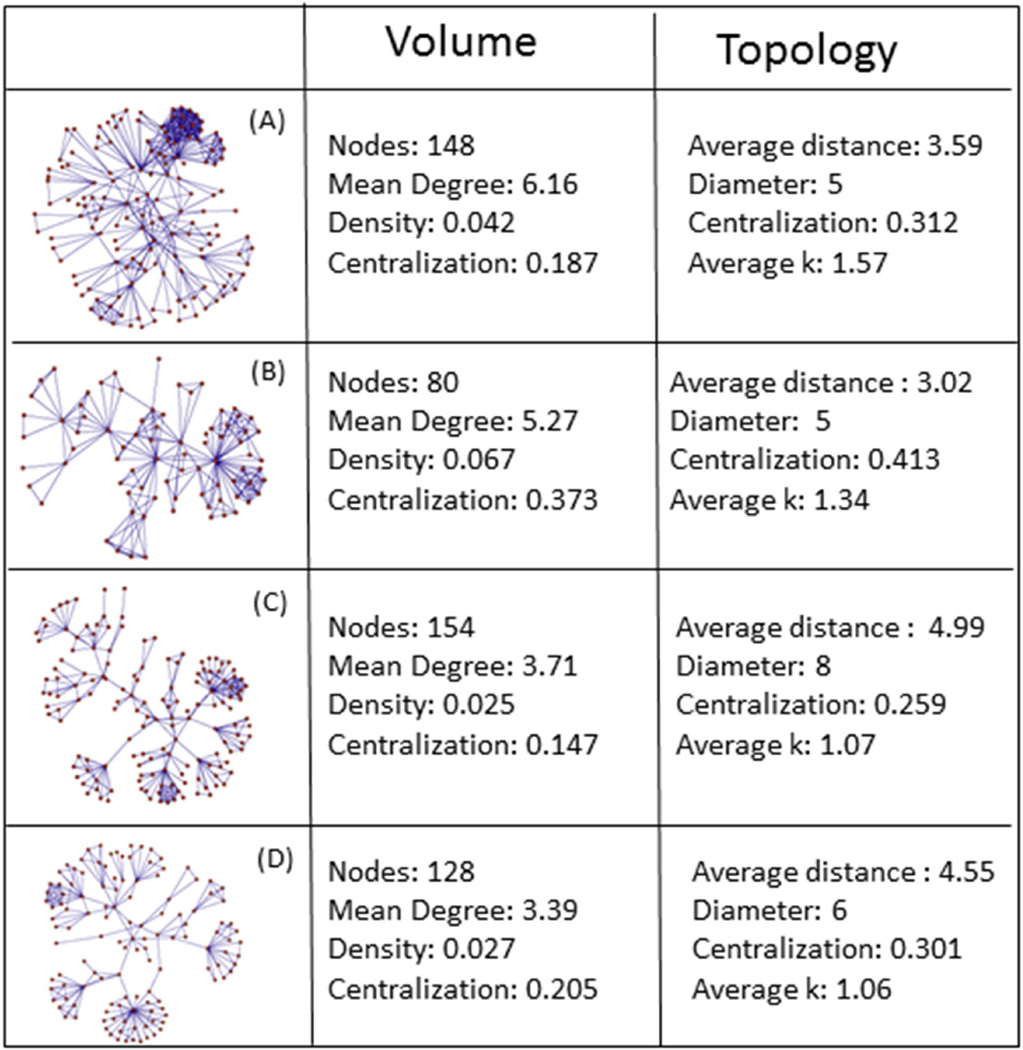
Sociograms and summary statistics for exemplar networks in figure 4.
Figure a2. Sociograms and summary statistics for networks in figure 3
Footnotes
Publisher's Disclaimer: This is a PDF file of an unedited manuscript that has been accepted for publication. As a service to our customers we are providing this early version of the manuscript. The manuscript will undergo copyediting, typesetting, and review of the resulting proof before it is published in its final citable form. Please note that during the production process errors may be discovered which could affect the content, and all legal disclaimers that apply to the journal pertain.
This is true for a fixed dyadic transmission level. It could be countered by other moderating factors, such as a negative correlation between the pairwise transmission dynamics and population concurrency or higher condom use in high concurrency settings than in low concurrency settings, but there is little empirical reason to expect such a pattern.
We also tested a valued version of this measure using the number of time periods adjacent edges overlap divided by the total length of the two relations durations. The results are substantively the same and we use the percent measure for simplicity.
An alternative design would be to simulate networks de novo, but algorithmically simulated networks always have more homogeneous topologies than that observed in real-life social networks. We have explored simple random (Erdos) graphs, as well as random networks generated by characteristic degree distributions; all of the results are qualitatively similar here, though the range of observed cohesion variability is much smaller (due to the homogeneity of the network generating functions). Since no algorithm exists for directly manipulating structural cohesion independent of other generating features, a key advantage of these real network walks is that variability in structural cohesion across networks of similar volume provides leverage for testing the moderation effects statistically.
The duration unit is arbitrary, since exposure is a function of the ordering not the magnitude of relations, so these could be days, weeks or months. This would have an effect on transmission dynamics, in which case one would want to build durations based closely on real data. Since we are not layering a transmission model over the network such considerations are not relevant here.
The main effect of having a large clique is an increase the variance of the results – because if one member of the clique is reachable all others will be too (because of the direct ties), this tends to create wide within-network variability.
References
- 1.Klovdahl A, Potterat J, Woodhouse D, Muth J, Muth S, Darrow W. Social Networks and Infectious Disease: The Colorado Springs Study. Social Science & Medicine. 1994;38(1):79–88. doi: 10.1016/0277-9536(94)90302-6. [DOI] [PubMed] [Google Scholar]
- 2.Newman M. Spread of Epidemic Disease on Networks. Physical Review E. 2002;66(1):016128. doi: 10.1103/PhysRevE.66.016128. [DOI] [PubMed] [Google Scholar]
- 3.Moody J. The Importance of Relationship Timing for Diffusion. Social Forces. 2000;81:25–56. [Google Scholar]
- 4.Morris M, Kretzschmar M. Concurrent Partnerships and Transmission Dynamics in Networks. Social Networks. 1995;17(3–4):299–318. [Google Scholar]
- 5.Morris M, Kretzschmar M. Concurrent Partnerships and the Spread of HIV. AIDS. 1997;11:641–648. doi: 10.1097/00002030-199705000-00012. [DOI] [PubMed] [Google Scholar]
- 6.Epstein H, Morris M. Concurrent Partnerships and HIV: An Inconvenient Truth. Journal of the International AIDS Society. 2011;14(1):1–11. doi: 10.1186/1758-2652-14-13. [DOI] [PMC free article] [PubMed] [Google Scholar]
- 7.Mah T, Halperin D. The Evidence for the Role of Concurrent Partnerships in Africa’s HIV Epidemics: A Response to Lurie and Rosenthal. AIDS and Behavior. 2010;14(1):25–28. doi: 10.1007/s10461-009-9583-5. [DOI] [PMC free article] [PubMed] [Google Scholar]
- 8.Morris M, Epstein H, Wawer M. Timing Is Everything: International Variations in Historical Sexual Partnership Concurrency and HIV Prevalence. PLoS ONE. 2010;5(11):e14092. doi: 10.1371/journal.pone.0014092. [DOI] [PMC free article] [PubMed] [Google Scholar]
- 9.Sawers L. Measuring and modelling concurrency. Journal of the International AIDS Society. 2013;16:17431–17451. doi: 10.7448/IAS.16.1.17431. [DOI] [PMC free article] [PubMed] [Google Scholar]
- 10.Johnson L, Dorrington R, Bradshaw D, Van Wyk V, Rehle T. Sexual behavior patterns in South Africa and their association with the spread of HIV: Insights from a mathematical model. Demographic Research. 2009;21:289–339. [Google Scholar]
- 11.Lurie M, Rosenthal S. The Concurrency Hypothesis in Sub-Saharan Africa: Convincing Empirical Evidence Is Still Lacking. Response to Mah and Halperin, Epstein, and Morris. AIDS and Behavior. 2010;14(1):34–37. doi: 10.1007/s10461-009-9640-0. [DOI] [PMC free article] [PubMed] [Google Scholar]
- 12.Moody J, White D. Structural Cohesion and Embeddedness: A Hierarchical Concept of Social Groups. American Sociological Review. 2003;68(1):103–127. [Google Scholar]
- 13.Moody J. The Structure of a Social Science Collaboration Network: Disciplinary Cohesion from 1963 to 1999. American Sociological Review. 2004;69(2):213–238. [Google Scholar]
- 14.Bearman P, Moody J, Stovel K. Chains of Affection: The Structure of Adolescent Romantic and Sexual Networks. American Journal of Sociology. 2004;110(1):44–91. [Google Scholar]
- 15.adams j, Moody J, Muth S, Morris M. Quantifying the benefits of link-tracing designs for partnership network studies. Field Methods. 2012 May;24:175–193. doi: 10.1177/1525822X11433997. [DOI] [PMC free article] [PubMed] [Google Scholar]
- 16.Merli G, Moody J, Mendelsohn J, Gauthier R. Heterosexual mixing in Shanghai: Are heterosexual contact patterns in China compatible with an HIV/AIDS epidemic? Demography. 2015;52:919–942. doi: 10.1007/s13524-015-0383-4. [DOI] [PMC free article] [PubMed] [Google Scholar]
- 17.Carnegie N, Morris M. Size Matters: Concurrency and the Epidemic Potential of HIV in Small Networks. PLoS ONE. 2012;7(8):e43048. doi: 10.1371/journal.pone.0043048. [DOI] [PMC free article] [PubMed] [Google Scholar]


