

Abstract
Background
Staphylococcus aureus gene expression has been sparsely studied in deep-sited infections in humans. Here, we characterized the staphylococcal transcriptome in vivo and the joint fluid metabolome in a prosthetic joint infection with an acute presentation using deep RNA sequencing and nuclear magnetic resonance spectroscopy, respectively. We compared our findings with the genome, transcriptome and metabolome of the S. aureus joint fluid isolate grown in vitro.
Result
From the transcriptome analysis we found increased expression of siderophore synthesis genes and multiple known virulence genes. The regulatory pattern of catabolic pathway genes indicated that the bacterial infection was sustained on amino acids, glycans and nucleosides. Upregulation of fermentation genes and the presence of ethanol in joint fluid indicated severe oxygen limitation in vivo.
Conclusion
This single case study highlights the capacity of combined transcriptome and metabolome analyses for elucidating the pathogenesis of prosthetic infections of major clinical importance.
Electronic supplementary material
The online version of this article (doi:10.1186/s12866-016-0695-6) contains supplementary material, which is available to authorized users.
Keywords: Staphylococcus aureus, Joint infection, Prosthesis, In vivo gene expression, Virulence, Metabolism, Siderophore, RNA-seq, NMR, Metabolomics
Background
Staphylococcus aureus is one of the leading causes of community- and hospital-acquired infections worldwide. The clinical spectrum ranges from superficial skin lesions to deep-sited or generalized infections. Besides acute infections, S. aureus can adapt to a biofilm mode of growth in response to certain environmental cues and thereby infections become persistent and recurrent, particularly in association with prosthetic implants [1]. Moreover, the emergence and spread of resistance to many classes of antibiotics pose an increasing threat to public health. Consequently, staphylococci have been studied extensively both in vitro and in vivo with special focus on resistance and virulence. An arsenal of virulence factors has been identified including toxins, cell surfaces proteins that facilitate attachment and colonization, and factors that contribute to immune evasion and tissue damage [2]. However, few studies have investigated nutrient acquisition and metabolism of S. aureus in vivo during infection, which is an important aspect of S. aureus pathophysiology.
Recently, the increasing number of genome sequences of S. aureus have provided deeper insights into its virulence, antibiotic resistance and physiology in general [3]. It is recognized that the success of S. aureus depends not only on its virulence genes and development of antibiotic resistance, but also on a coordinated and timely expression of genes upon infection of its host. To elucidate this complicated orchestration of gene expression, the transcriptome has been studied in vitro and in vivo using rabbit [4] and mouse [5, 6] infection models. However, pathogens are likely to make host-specific adaptions by altering gene expression, which necessitates studies in humans. To our knowledge, Date et al. [6] is the only published investigation of the transcriptome of S. aureus in humans with cutaneous infections caused by the methicillin-resistant USA300 strain.
The aim of this study was to compare the in vivo expression of virulence and metabolic genes of S. aureus in a prosthetic joint infection in a human subject with growth in vitro as reference using RNA sequencing (RNA-seq). Moreover, using nuclear magnetic resonance (NMR) spectroscopy we analyzed the metabolites in the joint fluid and in culture supernatants in order to determine the biochemical composition of the environments.
Results and discussion
S. aureus infection: culture, genome and transcriptome
Standard culture of joint fluid, tissue biopsies, and prosthesis components revealed a pure growth of S. aureus with a pansusceptible antibiogram (see case history in Methods). Amplicon sequencing was used for detection of bacteria in fluid obtained by sonication of prosthesis components (all joint fluid was used for RNA-seq). Approximately 44000 reads were obtained, all of which were clustered into operational taxonomic units (OTUs) identified as S. aureus (data not shown).
The joint infection had an acute presentation although a previous indolent period cannot be precluded (see case history). Assuming an acute infection [7], we chose to compare gene expression of the in vivo sample with the isolate in an exponential growth phase. Additionally, we sequenced the genome of the isolate (SAU060112) to gain insight into the virulence and antibiotic resistance capacity and to facilitate high fidelity RNA-seq read mapping.
To reconstruct the genome 17.8 million reads were generated. The assembly resulted in 17 contigs with an average coverage of 729 and N50 of 601492 bp. The total length of contigs was 2.68 Mb which is close to the average (2.86 Mb) gapless chromosome length of S. aureus (currently 66 strains in total available at NCBI, May 2015). No plasmids were found. The genome assembly is predicted to contain 2562 protein-coding genes. Details of the assembly and analysis of the COG classification distribution of the protein-coding sequences can be found in Additional file 1: Tables S1, Additional file 2: Table S2 and Additional file 3: Figure S1. The isolate was spa type t908 and belonging to Clonal Complex 45. Interestingly, according to Driebe et al. [8] CC45 show less homoplasy density than other S. aureus clades indicating little recombination with other clonal complexes. Furthermore, in contrast to other CC45 strains included in the study, but similar to USA600-BAA1754 (spa type t671), the entererotoxin genes entC, sel and sen is present in SAU060112. We thus believe that within the CC45 complex, SAU060112 is relative closely related to USA600-BAA1754 despite the different spa type. Approximately 25 and 350 million RNA-seq reads were obtained for in vitro cultures and the in vivo sample, respectively (Table 1). Between 26.8 and 37.8 % of total reads from the in vitro cultures were mapped to the protein-coding sequences of the genome with the mapping criteria employed (95 % similarity, 80 % length fragment). Relaxation of the mapping criteria led to increased mapping efficiency (data not shown), however, this also increased the risk of erroneous mapping of human host transcripts to the bacterial genome. Thus, this conservative approach was chosen for all samples. As expected, the majority of the sequences from the in vivo sample originated from the human host, and only 1.2 % (4.1 million) reads were mapped to the S. aureus genome and 0.086 % (0.3 million) to the protein-coding sequences. While 0.3 million reads might be considered a relative low number of reads compared to modern RNA-Seq studies that frequently have many millions of reads per sample, it is still expected to be enough to detect reads from about 85 % of bacterial genes according to [9]. It is possible that other methods of purification of bacterial RNA from background host RNA than the one we employed can yield a higher proportion of bacterial RNA. A total of 430 genes (17 % of total) were found to be differentially expressed, of which 317 were upregulated and 113 downregulated in vivo. The complete list of differentially expressed genes is available in Additional file 4: Complete list of differentially expressed genes.
Table 1.
Summary of RNA-seq mapping statistics (numbers of reads are in millions)
| Sample | No of sequences | No of aligned reads (% of total sequence) | No of rRNA reads (% of aligned reads) | No of aligned mRNA reads (% of aligned reads) | R-value (biological replicates) |
|---|---|---|---|---|---|
| Joint fluid | 348.4 | 4.1 (1.2) | 3.8 (92.7) | 0.3 (7.3) | - |
| LB culture | |||||
| 1 | 26.7 | 18.1 (67.8) | 8 (44.2) | 10.1 (55.8) | >0.95 |
| 2 | 26.5 | 17.7 (66.8) | 10.1 (57.1) | 7.1 (40.1) | |
| 3 | 23.1 | 15.7 (68.0) | 7.8 (49.7) | 7.5 (47.8) | |
Antibiotic resistance genes
SAU060112 was susceptible to β-lactams (including penicillin and methicillin) and 5 additional antibiotic classes. Analysis of the genome by the Resistance Gene Identifier (RGI) at the Comprehensive Antibiotic Research Database [10] predicted absence of resistance genes to β-lactams, macrolides and aminoglycosides in accordance with the antibiogram, but identified several efflux pumps related to other antibiotics (Additional file 5: Figure S2). Some of the efflux pumps (tet38 40-fold, p-val = 8.2*10−40; mepA 7-fold, p-val = 2.5*10−5) and cell wall biosynthesis genes (mgt 12-fold, p-val = 4.0*10−10; pbp2 5-fold, p-val = 0.0027; murZ 8-fold, p-val = 5.8*10−6) had increased expression in vivo, possibly induced by antibiotic treatment received by the patient for two days. The peptidoglycan biosynthesis pathway has been shown to be upregulated in S. aureus treated with subinhibitory doses of cell wall active antibiotics [11, 12]. However, several studies [12–14] have shown responses in bacteria is a global process not only involving proteins directly affected by antibiotics, but also proteins with no apparent relationship to the antibiotics. Therefore, it is unknown to which extent the differentially regulated genes found in this study was induced by antibiotic treatment or an in vivo response.
Virulence
A total of 131 known or proposed virulence genes were found in the genome (Table 2, Additional file 6: Table S3), of which 47 were upregulated in vivo, including many toxins, several adhesins and immune evasion molecules. The highest upregulated toxin was γ-hemolysin (hlgA 776-fold, p-val = 1.6*10−28, hlgB 482-fold, p-val = 1.4*10−29, and hlgC 701-fold, p-val = 3.5*10−31), which has previously been found among the most overexpressed toxins in S. aureus cultivated in human blood in vitro [15] and in human cutaneous abscesses [6]. Among the in vivo upregulated extracellular matrix binding proteins, major histocompatibility complex (MHC) analogous protein (map) had the highest expression (458-fold, p-val = 2.7*10−26). Map was found significantly expressed in S. aureus during the acute phase of murine osteomyelitis [16] and the protein has been linked to severity of arthritis and osteomyelitis in this animal model [17].
Table 2.
Differentially expressed virulence genes in vivo compared to in vitro. The RNA-seq data are compared with the microarray data of Staphylococcus aureus subsp. aureus USA300_FPR3757 (community-acquired methicillin-resistant) infected cutaneous abscesses in humans retrieved from Date et al. [6]
| SAU060112 | USA300 | Gene name | Product | Fold change | Number/100000 mapped mRNA reads | Fold change during human cutaneous abscesses | |
|---|---|---|---|---|---|---|---|
| Infection | LB | ||||||
| Toxins | |||||||
| SAU060112_40253 | SAUSA300_2365 | hlgA | Gamma-hemolysin component A | 776 | 574 | 1 | 12.56 |
| SAU060112_40254 | SAUSA300_2366 | hlgC | Gamma-hemolysin component C | 701 | 524 | 1 | 5.76 |
| SAU060112_20343 | SAUSA300_0396 | Superantigen-like protein | 503 | 78 | 0 | 1.48 | |
| SAU060112_40255 | SAUSA300_2367 | hlgB | Gamma-hemolysin component B | 482 | 531 | 2 | 17.65 |
| SAU060112_50039 | SAUSA300_1974 | Uncharacterized leukocidin-like protein 1 | 376 | 453 | 2 | 9.72 | |
| SAU060112_50038 | SAUSA300_1975 | Uncharacterized leukocidin-like protein 2 | 140 | 198 | 2 | 14.42 | |
| SAU060112_20344 | SAUSA300_0398 | Toxin, beta-grasp domain protein. superantigen-like protein | 128 | 29 | 0 | 1.65 | |
| SAU060112_20345 | - | Toxin, beta-grasp domain protein, superantigen-like protein | 109 | 41 | 1 | ||
| SAU060112_20347 | SAUSA300_0399 | set | Exotoxin 3 | 104 | 23 | 0 | 1.1 |
| SAU060112_10176 | SAUSA300_1058 | hly | Alpha-hemolysin | 91 | 136 | 2 | 2.08 |
| SAU060112_20348 | SAUSA300_0401 | set | Exotoxin 1 | 80 | 21 | 0 | 1.33 |
| SAU060112_20350 | SAUSA300_0403 | ssl7nm | Enterotoxin-like toxin | 56 | 8 | 0 | 1.34 |
| SAU060112_110014 | SAUSA300_1918 | Truncated beta-hemolysin | 36 | 2 | 0 | 7.84 | |
| SAU060112_10172 | SAUSA300_1061 | Superantigen-like protein | 21 | 9 | 1 | 4.93 | |
| SAU060112_10173 | SAUSA300_1060 | Beta-grasp domain toxin protein, superantigen-like protein | 17 | 9 | 1 | 2.64 | |
| SAU060112_10457 | - | entC | Enterotoxin type C-2 | 15 | 72 | 7 | |
| SAU060112_10174 | SAUSA300_1059 | putative superantigen-like protein | 11 | 10 | 1 | 2.35 | |
| SAU060112_20351 | SAUSA300_0404 | Superantigen-like protein | 9 | 6 | 1 | 1.39 | |
| SAU060112_10456 | SAUSA300_0800 | sel | Extracellular enterotoxin L | 3 | 5 | 2 | 1.13 |
| Exoenzymes | |||||||
| SAU060112_20156 | SAUSA300_0224 | coa | Staphylocoagulase | 12 | 55 | 7 | 1.5 |
| SAU060112_40510 | SAUSA300_2603 | lip | Lipase 1 | 4 | 95 | 32 | 0.51 |
| Adhesins | |||||||
| SAU060112_110015 | SAUSA300_1917 | map | MHC analogous protein | 458 | 2894 | 10 | No data |
| SAU060112_10448 | SAUSA300_0774 | emp | Extracellular matrix protein-binding protein emp | 77 | 50 | 1 | 2.02 |
| SAU060112_40332 | SAUSA300_2441 | fnbA | Fibronectin-binding protein A | 17 | 116 | 10 | 1.73 |
| SAU060112_40330 | SAUSA300_2440 | fnbB | Fibronectin-binding protein B | 5 | 108 | 31 | 1.67 |
| SAU060112_10180 | SAUSA300_1055 | fib | Fibrinogen-binding protein | 5 | 6 | 2 | 1.02 |
| SAU060112_70131 | SAUSA300_1327 | ebh | Extracellular matrix-binding protein ebh | 3 | 28 | 14 | 1.08 |
| Immune evasion | |||||||
| SAU060112_110009 | SAUSA300_1920 | chp | Chemotaxis inhibitory protein | 29 | 11 | 1 | 6.1 |
| SAU060112_10179 | SAUSA300_1056 | scn | Staphylococcal complement inhibitor | 26 | 5 | 0 | 0.91 |
| SAU060112_40252 | SAUSA300_2364 | sbi | Immunoglobulin-binding protein sbi | 15 | 230 | 22 | 1.9 |
| SAU060112_110010 | SAUSA300_1919 | scn | Staphylococcal complement inhibitor | 3 | 27 | 15 | 1.55 |
| SAU060112_20047 | SAUSA300_0113 | spa | Immunoglobulin G-binding protein A | −6 | 63 | 618 | 1.48 |
| SAU060112_10182 | SAUSA300_1053 | flr | FPRL1 inhibitory protein | 26 | 2 | 0 | 3.16 |
| Exopolysaccharides | |||||||
| SAU060112_20094 | - | cap8J | Capsular polysaccharide synthesis enzyme Cap8J | −16 | 0 | 8 | |
| Secretion system | |||||||
| SAU060112_20221 | SAUSA300_0285 | esxB | Virulence factor EsxB | −10 | 1 | 382 | 0.85 |
| SAU060112_20220 | SAUSA300_0284 | esaC | Protein EsaC | −9 | 1 | 9 | 0.83 |
| SAU060112_20216 | SAUSA300_0280 | essA | Protein EssA | −9 | 1 | 9 | 1.3 |
| SAU060112_20218 | SAUSA300_0282 | essB | Protein EssB | −8 | 1 | 12 | 0.86 |
| SAU060112_20215 | SAUSA300_0279 | esaA | Protein EsaA | −6 | 6 | 56 | 0.61 |
| SAU060112_20219 | SAUSA300_0283 | essC | Protein EssC | −5 | 10 | 81 | 0.79 |
| Iron acquisition | |||||||
| SAU060112_20052 | SAUSA300_0118 | sbnA | putative siderophore biosynthesis protein SbnA | 27 | 14 | 1 | 7.02 |
| SAU060112_20056 | SAUSA300_0122 | sbnE | IucA/IucC family siderophore biosynthesis protein | 20 | 34 | 3 | 1.99 |
| SAU060112_20055 | SAUSA300_0121 | sbnD | Transporter, major facilitator family protein | 15 | 20 | 2 | 5.02 |
| SAU060112_20057 | SAUSA300_0123 | sbnF | Siderophore biosynthesis protein | 14 | 44 | 5 | 2.9 |
| SAU060112_20053 | SAUSA300_0119 | sbnB | Ornithine cyclodeaminase | 13 | 15 | 2 | 6.35 |
| SAU060112_20054 | SAUSA300_0120 | sbnC | Siderophore biosynthesis protein, IucA/IucC family | 11 | 24 | 3 | 5.17 |
| SAU060112_20060 | SAUSA300_0126 | sbnI | conserved protein of unknown function | 9 | 22 | 4 | 4.25 |
| SAU060112_20059 | SAUSA300_0125 | sbnH | Conserved protein of unknown function | 7 | 33 | 8 | 4.33 |
| SAU060112_20058 | SAUSA300_0124 | sbnG | Conserved protein of unknown function | 4 | 14 | 5 | 4 |
| Virulence regulators | |||||||
| SAU060112_110071 | SAUSA300_1866 | vraS | Sensor protein VraS | 28 | 275 | 15 | 1.14 |
| SAU060112_10560 | SAUSA300_0691 | saeR | Response regulator SaeR | 19 | 309 | 24 | 3.72 |
| SAU060112_110072 | SAUSA300_1865 | vraR | Response regulator protein VraR | 14 | 141 | 15 | 0.63 |
| SAU060112_10561 | SAUSA300_0690 | saeS | Histidine protein kinase SaeS | 8 | 394 | 75 | 2.53 |
| SAU060112_20048 | SAUSA300_0114 | sarS | HTH-type transcriptional regulator SarS | −13 | 1 | 18 | 0.35 |
The extraordinary ability of S. aureus to adapt to different physiological niches (e.g. the nares, skin, joints, blood, etc.) and cause a variety of clinical pictures is partly attributed to its many virulence determinants, which are tightly regulated and involve complex networks of regulatory factors [18]. Knowledge of its regulatory networks during colonization and infection in vivo remains limited due to the inherent complexity. Among the many virulence regulators, only saeRS (saeR 19-fold, p-val = 3.0*10−10; saeS 8-fold, p-val = 5.8*10−6) and vraSR (vraS 28-fold, p-val = 8.4*10−13; vraR 14-fold, p-val = 8.5*10−11) were highly induced in vivo (Table 2, Additional file 6: Table S3). Cell-wall-affecting antibiotics are known to induce vraSR and saeRS [19]. Thus, expression of both systems could be partly induced by β-lactams prior to surgery (see case history). VraSR positively regulates cell-wall peptidoglycan synthesis in S. aureus [20, 21]. SaeRS has a global impact on expression of virulence factors [22, 23] and is important for innate immune evasion by S. aureus [24]. Several virulence genes controlled by saeRS were highly upregulated, including map, α-(91-fold, p-val = 7.5*10−27), β- (36-fold, p-val = 2.1*10−7), γ-hemolysins (hlgA 776-fold, p-val = 1.6*10−28, hlgB 482-fold, p-val = 1.4*10−29, and hlgC 701-fold, p-val = 3.5*10−31), chp (29-fold, p-val = 9.2*10−17), 2 loci for scn (26-fold, p-val = 3.9*10−10; 3-fold, p-val = 0.004), coagulase (coa) (12-fold, p-val = 5.1*10−14), sbi (15-fold, p-val = 1.4*10−9), extracellular matrix protein-binding protein (emp) (77-fold, p-val = 8.1*10−36), and two fibronectin binding proteins (17-fold, p-val = 3.7*10−13; 5-fold, p-val = 0.00011) [22, 23] (Table 2). SaeRS was also overexpressed in cutaneous abscesses in humans [6], murine osteomyelitis [16] as well as during incubation with human blood or serum [15].
Notably, the expression of 32 virulence genes present in the genome was negligible (≤5 reads/100,000 mapped mRNA reads) in vivo. Also, 9 virulence genes were found downregulated including transcription regulator sarS (13-fold, p-val = 6.1*10−6) [25], immunoglobulin G-binding protein A (spa) (6-fold, p-val = 0.005), and six of eight genes in the putative ESAT-6-secretion system, while expression of these genes was reported unchanged in [6] (Table 2). SarS belongs to the SarA protein family, global regulators of virulence gene expression in S. aureus [26]. SarS, which is controlled by many regulators, activates spa expression and represses α-hemolysin [18, 27]. This correlates with the finding in this study of expression of spa being reduced while expression of α-hemolysin is increased (91-fold) in vivo. ESAT-6 proteins have been reported to be important for staphylococcal infection in mice, but their functions during human infection remain unclear [28].
Siderophores
In response to iron limitation, S. aureus has two known iron acquisition mechanisms: one is the iron-regulated surface determinant (isd) gene set that mediates heme acquisition from mammalian heme-containing proteins, and the other is a Fe(III)-siderophore acquisition system, which is capable of removing iron from human transferrin and lactoferrin. S. aureus produces two distinct siderophores: staphyloferrin A and staphyloferrin B [29]. The Ferric Uptake Regulator (Fur) controls expression of genes encoding all these systems [30], but mechanisms for fine-tuning of expression of these systems are unknown. We found 3-fold upregulation of fur (p-val = 0.004) during in vivo infection, but no difference in expression of isd and staphyloferrin A genes. However, the sbn operon (locus SAU060112_20052 – 20060) encoding staphyloferrin B was upregulated in vivo (3- to 27-fold, p-val = 6.9*10−5 – 2.3*10−17) in this study. The ninth protein SbnI encoded by the sbn operon is recently found to play an important role in transcription control of the sbn operon [31]. Staphyloferrin B production has been found to be important for S. aureus growth in iron-limited medium and for its pathogenicity in a murine kidney abscess model [32]. In human cutaneous abscesses expression of both isd and sbn operons was elevated as well as two genes of the staphyloferrin A operon [6].
Metabolism
We observed upregulation of several genes related to anaerobic/hypoxic conditions, which include the genes involved in pyruvate to ethanol fermentation (pflB 23-fold, p-val = 8.3*10−7; aldA 4-fold, p-val = 7.9*10−3; ADH 25-fold, p-val = 2.9*10−13; adhP 16-fold, p-val = 1*10−8) and acetoin reductase (23-fold, p-val = 2.4*10−10) involved in pyruvate to acetoin fermentation as well as the upregulation of the arginine deiminase (ADI) pathway (arcA 156-fold, p-val = 1.0*10−19; arcB 279-fold, p-val = 4.3*10−26; arcC 67-fold, p-val = 3.5*10−16; arcD-230 fold, p-val = 1.2*10−22; argI 126-fold, p-val = 3.8*10−35) (Fig. 1) and pyruvate formate-lyase-activating enzyme (pflA) (63-fold, p-val = 7.3*10−10). The anaerobic/hypoxic condition was further supported by the high concentration of lactate (~40 mM) and presence of ethanol in the infected joint fluid (Fig. 2).
Fig. 1.
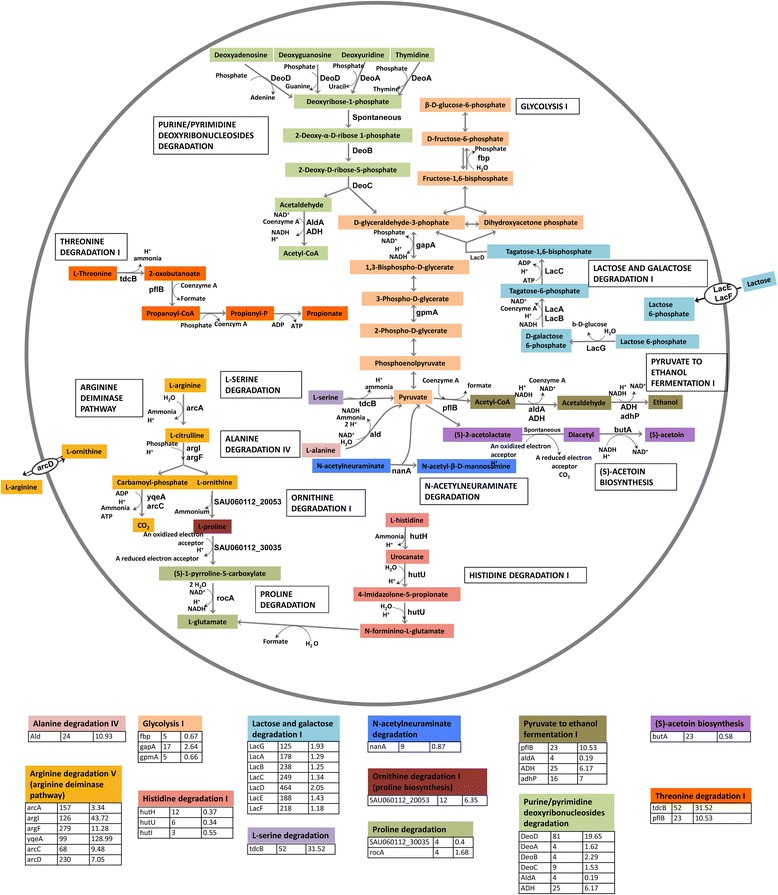
Overexpressed metabolic pathways in the infection. Pathway names are according to the MetaCyc database. Each pathway is assigned with a specific color and the upregulated enzymes in each pathway are indicated. On the bottom, under each pathway fold change of the upregulated enzymes in the current study are listed in the second column while fold change of these enzymes in the human cutaneous abscesses study [6] are in the third column
Fig. 2.
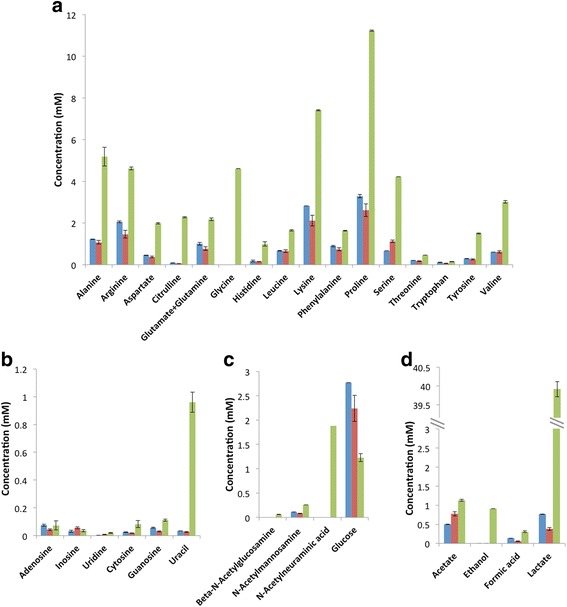
Concentration of metabolites determined by NMR analysis. In vitro (OD600 = 0) (blue) and joint fluid (green) were analyzed in technical triplicates while in vitro (OD600 = 0.5) (red) was done in biological replicates. The detection limit of NMR is ~ 2 μM. a: amino acids. b: nucleobases. c: glycans. d: metabolites
The ADI operon was the most upregulated amino acid catabolic pathway in the current study as well as in human cutaneous abscesses [6] and chronic human and murine osteomyelitis [16]. This operon also includes arginine/ornithine antiporter arcD, which is the only transporter for free arginine [33]. Arginine is utilized by S. aureus as a source of energy under anaerobic conditions [34]. We think that this pathway is essential for the direct production of ATP without generating organic acids under anaerobic conditions. This hypothesis is indirectly supported by the overexpression of the ethanol fermentation pathway. Under microaerophilic or anaerobic conditions, S. aureus ferments the majority of pyruvate to lactic acid in vitro [33]. However, lactic acid concentration was nearly 40 mM in the joint fluid (Fig. 2), which was higher than average lactate level in septic arthritides and probably was produced mainly by human host cells under hypoxic condition [35]. To avoid the unfavorable production of additional lactic acid while still oxidizing NADH to NAD+ for continuation of glycolysis and ATP generation, genes promoting pyruvate fermentation to ethanol were upregulated instead.
Besides ADI, high expression of catabolic threonine dehydratase tdcB (52-fold, p-val = 2.5*10−19), alanine dehydrogenase ald (24-fold, p-val = 1.3*10−14) and several additional amino acids catabolic enzymes were observed (Fig. 1), while several genes involved in amino acid synthesis including tryptophan, arginine, cysteine and histidine were among the 113 downregulated genes in vivo. Moreover, NMR data showed high concentration of free amino acids in the infected joint fluid compared to LB culture (Fig. 2). Taken together, our data suggest that free amino acids were a major source of carbon and energy for S. aureus in vivo.
Besides amino acids, several genes involved in carbohydrate catabolism had increased expression in vivo, including N-acetylneuraminate lyase nanA (9-fold, p-val = 8.9*10−7) and the lac operon (125- to 464-fold, p-val = 2.4*10−43-2.7*10−23). The enzyme NanA catalyzes the cleavage of N-acetylneuraminic acid (Neu5Ac), which is the predominant sialic acid in humans and is present as a terminal sugar on a wide range of glycoproteins and glycolipids. Host glycoproteins can be used as nutrient for bacteria [36], for example, Streptococcus pneumoniae can utilize human glycoconjugates as the sole source of carbon for growth [37]. The increased expression of nanA is consistent with the higher concentration of Neu5Ac in the joint fluid than the in vitro supernatant where it was undetectable (Fig. 2). The S. aureus lac operon is inducible by galactose and suppressed by glucose [38]. The concentration of galactose in vivo was at the baseline level in the NMR spectra, hence, it is unknown to which extent galactose is used as a nutrient.
The increased expression of purine and pyrimidine deoxyribonucleoside degradation pathways (deoA 5-fold, p-val = 0.0001; deoB 4-fold, p-val = 0.001; deoC 9-fold, p-val = 5.8*10−8 and deoD 81-fold, p-val = 8.3*10−10) indicated that the pathogen probably also acquired nucleosides as nutrients. The end products of these pathways are acetyl-CoA, a central metabolic intermediate, and D-glyceraldehyde-3-phosphate, an intermediate of glycolysis (Fig. 1). The metabolite measurement shows increased levels of nucleosides, particularly uracil, in vivo (Fig. 2). Uracil has been found elevated in joint fluid from rheumatoid arthritis patients [39]; however, the mechanism behind this is unknown.
Although the concentration of free amino acids, some glycans and nucleosides were higher in the joint fluid, the expression level of all hydrolytic exoenzymes but lipases remained low in vivo (Additional file 6: Table S3). This is in contrast to findings reported by Szafranska et al., who observed upregulation of many genes encoding secreted proteolytic enzymes in S. aureus during acute and chronic murine osteomyelitis [16]. A possible explanation for the low expression of hydrolytic exoenzymes in the current study is that hydrolysis of proteins and glycans might have been done by host enzymes as part of the inflammatory response. Neutrophils both release proteases themselves and activate proteases expressed by cells resident in tissues. Thus, the host response could provide S. aureus with the free amino acids, the glycans and other nutrients needed for growth in vivo.
Among the transport systems, oligopeptide permease (opp) transporters encoded by the opp-1 operon (locus SAU060112_40296 – 40300) were the most overexpressed transporter system (up to 101-fold, p-val = 2.2*10−21) along with the genes surrounding the operon (locus SAU060112_40295 – 40303). This operon was also highly overexpressed in cutaneous abscesses in humans [6]. The exact role of opp-1 remains unknown, although it was found to impact in vivo growth of S. aureus in mouse and rabbit infection models [40].
A major limitation of our study is the lack of biological replicates, as we did not obtain other samples of S. aureus infected joint fluid during the study period. In an attempt to find similarities of S. aureus gene expression in infections in human subjects, thus corroborating the findings in independent experiments, we compared our RNA-seq data extensively with microarray data from S. aureus cutaneous abscesses in humans [6]. Although the two studies differed in type of infections, genetic background of S. aureus isolates, experimental setups and analytic methods, they had 113 upregulated and 13 downregulated genes in common, which correspond to 36 % upregulated and 12 % downregulated genes found in this study. The upregulated virulence genes included saeRS, a few toxins (particularly γ-hemolysin and two uncharacterized leukocidin-like proteins), and chp (Table 2). With regard to nutrient acquisition and metabolism, the elevated transcripts were those of the sbn operon, ADI operon, tdcB, ald, and several enzymes involved in nucleoside catabolism as well as ethanol fermentation (Fig. 1). Additionally, the opp-1 operon was overexpressed in both studies. The 13 downregulated genes in both studies included the virulence regulator sarS (13-fold, p-val = 6.1*10−6), cystathionine γ-lyase (mccB 6-fold, p-val = 0.001, glyoxal reductase (yvgN 5-fold, p-val = 0.004), glycosyl-4,4′-diaponeurosporenoate acyltransferase (crtO 668-fold, p-val = 0.004), phosphoribosylformylglycinamidine synthase 1 (purQ 5 fold, p-val = 0.002), and a few conserved proteins of unknown function. All in all, the biological function and regulation of these up- and down- regulated genes need to be investigated by future in vivo studies.
Conclusions
This single case study highlights the capacity of combined transcriptome and metabolome analyses for elucidating the pathogenesis of deep-sited infections with and without a foreign body. Future research should explore the in vivo physiology and virulence of S. aureus, which may ultimately lead to new strategies to combat S. aureus infections.
Methods
Case history
The patient was an adult male with a sero-negative polyarthritis since his youth. Debut of psoriasis led to a diagnosis of psoriatic arthritis after approximately two decades. He had undergone numerous surgical procedures and had joint implants in one hip, both knees, one elbow and one shoulder. Immunomodulatory therapy with adalimumab (Humira, Abbott US), a tumor necrosis factor (TNF)-α antibody , was started 26 months before the admission. The patient was admitted after a fall with subsequent swelling of the right knee. He was febrile (38.8 °C) and had marginal leukocytosis (12.0*109/L) and highly elevated C-reactive protein (304 μg/mL, reference interval <10 μg/mL). A joint puncture revealed serous joint fluid (60 % mononuclear leukocytes) and 104–105 colony forming units of S. aureus, susceptible to penicillin, methicillin and 5 antibiotic classes other than β-lactam [41]. Intra-venous dicloxacillin was commenced on the 2nd day of admission, but changed to cefuroxim in combination with gentamicin due to spiking fever. S. aureus with the same antibiogram was obtained from blood culture and biopsies obtained during revision surgery with removal of the implant on the 4th day of admission. On the same day intravenous therapy was switched to penicillin G. The blood culture isolate was referred to Statens Serum Institut (Copenhagen, Denmark) for spa-typing as part of national surveillance (t908, annotated to Clonal Complex 45). Several months later the patient underwent surgical revision and removal of implants from the left elbow and the left hip. S. aureus infection with the same antibiogram was confirmed.
Culture and antibiotic resistance test
Joint fluid, biopsies and prosthetic components were cultured according to [42] with an incubation period of 14 days (see Additional file 7). Species identification was done with a MALDI Biotyper CA System (Bruker Daltonics, Germany). Antimicrobial susceptibility testing was carried out as above [41]. The S. aureus isolate from prosthetic components was designated SAU060112.
16S rRNA gene amplicon sequencing and data analysis
DNA extraction was done using MolYsis complete5 (Molzym, Germany) according to the manufacturer’s instructions. For 16S rRNA amplicon sequencing, the V1-3 region was PCR amplified with bacterial primers 27 F and 534R in accordance with the protocol used by the Human Microbiome Project [43] and sequenced on a MiSeq DNA sequencer (Illumina, CA) [44]. The 16S rRNA amplicon data were analyzed using QIIME toolkit [45]. Raw sequences were demultiplexed and quality-filtered using the default parameters. Sequences were then clustered into OTUs based on 99 % sequence similarity and taxonomy assignment was done using the Greengenes database [46].
Genome sequencing and annotation
S. aureus SAU060112 was grown overnight in LB medium. DNA was extracted using UltraClean® Microbial DNA Isolation kit (MO BIO Laboratories, Inc, CA) according to the manufacturer’s instructions. From 1 μg of DNA, a library for Illumina paired-end (PE) sequencing was constructed using NEBNext® UltraTM DNA Library Prep Kit for Illumina®(New England Biolabs, MA) according to the manufacturer’s instructions. Libraries were sequenced (2 × 150 bp) using Truseq SBS Kit v.3-HS Sequencing Kit (Illumina Inc.) on an Illumina HiSeq 2000 (Illumina Inc). Sequenced PE reads were imported into CLC genomics workbench v.6.5.1 (CLC Bio, Aarhus, Denmark) for assembly. Contigs were annotated using the web interface Magnifying Genomes (MaGe) of the MicroScope platform from GenoScope [47]. Automatic annotations provided by MaGe were curated manually to validate the presence or absence of genes of interest. Based on the annotations, the protein coding genes were classified into the Cluster of Orthologous Groups (COG) [48] functional categories using COG automatic classification tool at MaGe. Details of genome sequencing and annotation can be found in Additional file 7.
RNA sample collection, extraction and sequencing
Immediately following aspiration the joint fluid was centrifuged at 12100 g for 2 min at room temperature and the pellet and supernatant were snap-frozen separately in liquid nitrogen. RNA from in vitro cultures (3 biological replicates) were isolated from cultures grown to exponential phase (OD600 ~ 0.5) in LB medium. The cell suspension was centrifuged and supernatant and pellet were snap-frozen separately. All samples were stored at −80 °C until RNA extraction or NMR analysis.
RNA was extracted using RiboPure™ Bacteria Kit (Ambion®, Life Technologies) except that the in vivo sample was homogenized in a mortar (precooled in liquid nitrogen) before RNA extraction. The RNA solutions were purified and concentrated using the MinElute PCR Purification Kit (Qiagen).
Twenty micrograms of in vivo-derived RNA was sequentially treated with the MICROBEnrich™ and MICROBExpress™ kits (Ambion®) to deplete mammalian RNA and enrich bacterial mRNA, respectively. Four to six micrograms of in vitro-derived RNA was used. Sequencing libraries were prepared with the enriched microbial RNA using Illumina® TruSeq® RNA Sample Preparation Kit v2 according to the manufacturer’s instructions. Libraries were PE sequenced (2 × 150 bp) using Truseq SBS Kit v.3-HS Sequencing Kit on an Illumina HiSeq 2000.
Differential gene expression analysis
Using the RNA-Seq analysis function in CLC Genomics Workbench, reads were aligned to the annotated SAU060112 genome allowing a minimum length fraction of 0.8 and minimum similarity fraction of 0.95. A table of read counts was used as input for differential gene expression analysis using edgeR using default settings [49]. Only genes with false discovery rate <0.05 using Benjamini and Hochberg’s algorithm [50] were classified as differentially expressed.
NMR spectroscopy analysis
Prior to NMR measurements, samples were centrifuged at 4 °C for 5 min at 12100 g and kept on ice thereafter. Aliquots of 500 μL of supernatants were mixed with 100 μL 0.2 M phosphate buffer (pH 7.4, 99 % 2H2O, 0.3 mM DSA-d6 (4,4-dimethyl-4-silapentane-1-ammonium trifluoroacetate)). 600 μL of the mixture was transferred to a 5-mm NMR tube and analysis was performed immediately using a Bruker 600-MHz NMR spectrometer (Bruker BioSpin, Germany) equipped with a TCI (1H, 13C, 15N, and 2H lock) cryogenic probe operating at 600.13 MHz for 1H at 298.1 K. For the analysis, a T2 relaxation-edited Carr-Purcell-Meiboom-Gill (CPMG) [51] experiment was used (“cpmgpr1d” in Bruker library, spectral width 12019.23 Hz, time domain 65 K, relaxation delay 4 s, acquisition time 2.72 s, total spin-echo time 67.4 ms, 64 scans). Data was exponentially multiplied corresponding to a line broadening of 0.3 Hz, Fourier transformed, manually phase- and baseline- corrected, and calibrated to the chemical shift of the methyl signal of L-alanine at 1.48 ppm. Subsequently, spectra were overlapped and normalized to the reference peak of DSA-d6 at 0.01 ppm. Peaks showing differences in intensity were quantified using TopSpin v3.1 (Bruker BioSpin, Germany). For metabolite identification, we used an in-house metabolite database, Chenomx NMR library (suite 7.6), Human Metabolome Database [52], Madison Metabolomics Consortium Database from MetaboHunter [53], AMIX (v. 3.9.10, Bruker BioSpin), BRUKER BBIOREFCODE database (v. 2.7.0), and literature references [54, 55].
Availability of supporting data
The annotated genome sequence data was submitted to the European Nucleotide Archive (accession nos. CCXN01000001-CCXN01000017). The RNA-seq data discussed in this publication have been deposited in NCBI’s Gene Expression Omnibus [56] and are accessible through GEO Series accession number GSE62091 (http://www.ncbi.nlm.nih.gov/geo/query/acc.cgi?acc=GSE62091).
Ethics statement
This study was conducted within the framework of the ‘Prosthesis-Related Infection and Pain’ (PRIS) - Innovation project, a Danish multidisciplinary project. The ‘PRIS’ project was approved by the Regional Research Ethics Committee for North Denmark (N-20110022). The patient described in the study has given informed consent to participate in the study and the publication of data.
Availability of data and materials
The sample that this case story is built upon does not exist anymore, since all have been used during this study. Raw data can be forwarded to interested parties by contacting the corresponding author.
Acknowledgements
We thank Reinhard Wimmer for providing the NMR spectroscopy, the PRIS study group for general input and surgeon Andreas Kappel for providing the patient sample.
Funding
This study was prepared within the framework of the ‘Prosthesis-Related Infection and Pain’ (PRIS) Innovation project, http://www.joint-prosthesis-infection-pain.dk, supported by a grant from The Danish Council for Technology and Innovation (no. 09–052174). The NMR laboratory at Aalborg University is supported by the Obel, Carlsberg and SparNord foundations.
Abbreviations
- ADI
arginine deiminase
- coa
coagulase
- COG
Cluster of Orthologous Groups
- emp
extracellular matrix protein-binding protein
- Fur
Ferric Uptake Regulator
- isd
iron-regulated surface determinant
- MaGe
Magnifying Genomes
- MHC
major histocompatibility complex
- Neu5Ac
N-acetylneuraminic acid
- NMR
nuclear magnetic resonance
- opp
oligopeptide permease
- OTUs
operational taxonomic units
- pflA
pyruvate formate-lyase-activating enzyme
- RGI
Resistance Gene Identifier
- RNA-seq
RNA sequencing
- spa
immunoglobulin G-binding protein A
Additional files
Genome assembly details. (DOCX 12 kb)
Details of the contigs from genome assembly. (DOCX 13 kb)
Clusters of Orthologous Groups (COG) classification distribution of the protein-coding genes and the number of up- and down- regulated genes in vivo in each category. (PPTX 55 kb)
Complete list of differentially expressed genes computed using EdgeR. FC: fold change; CPM: count per million; FDR: false discovery rate. (XLSX 84 kb)
Resistance wheel including the resistance genes predicted by the Resistance Gene Identifier (RGI) at the Comprehensive Antibiotic Research Database. (PPTX 425 kb)
List of known and putative virulence genes in SAU060112. (DOCX 26 kb)
Supplemental methods. (DOCX 22 kb)
Footnotes
Competing interests
The authors declare that they have no competing interests.
Authors’ contributions
KLN, TRT, YX, JLN and PHN designed the study. YX and VQL collected the samples, YX did the molecular biology-, LHL the antibiotics-, and RGM the NMR experiments. YX analyzed the sequence data and RGM the NMR data. YX, PHN, TRT, HCS and KLN wrote the manuscript. All authors have read and approved the final manuscript.
References
- 1.Otto M. Staphylococcal biofilms. Curr Top Microbiol Immunol. 2008;322:207–228. doi: 10.1007/978-3-540-75418-3_10. [DOI] [PMC free article] [PubMed] [Google Scholar]
- 2.Gordon RJ, Lowy FD. Pathogenesis of methicillin‐resistant Staphylococcus aureus infection. Clin Infect Dis. 2008;46(S5):S350–S359. doi: 10.1086/533591. [DOI] [PMC free article] [PubMed] [Google Scholar]
- 3.Kuroda M, Ohta T, Uchiyama I, Baba T, Yuzawa H, Kobayashi I, et al. Whole genome sequencing of meticillin-resistant Staphylococcus aureus. Lancet. 2001;357(9264):1225–1240. doi: 10.1016/S0140-6736(00)04403-2. [DOI] [PubMed] [Google Scholar]
- 4.Yarwood JM, McCormick JK, Paustian ML, Kapur V, Schlievert PM. Repression of the Staphylococcus aureus accessory gene regulator in serum and in vivo. J Bacteriol. 2002;184(4):1095–1101. doi: 10.1128/jb.184.4.1095-1101.2002. [DOI] [PMC free article] [PubMed] [Google Scholar]
- 5.Chaffin DO, Taylor D, Skerrett SJ, Rubens CE. Changes in the Staphylococcus aureus transcriptome during early adaptation to the Lung. PLoS One. 2012;7(8):e41329. doi: 10.1371/journal.pone.0041329. [DOI] [PMC free article] [PubMed] [Google Scholar]
- 6.Date SV, Modrusan Z, Lawrence M, Morisaki JH, Toy K, Shah IM, et al. Global gene expression of methicillin-resistant Staphylococcus aureus USA300 during human and mouse infection. J Infect Dis. 2014;209(10):1542–1550. doi: 10.1093/infdis/jit668. [DOI] [PubMed] [Google Scholar]
- 7.Fux C, Costerton J, Stewart P, Stoodley P. Survival strategies of infectious biofilms. Trends Microbiol. 2005;13:34–40. doi: 10.1016/j.tim.2004.11.010. [DOI] [PubMed] [Google Scholar]
- 8.Driebe EM, Sahl JW, Roe C, Bowers JR, Schupp JM, Gillece JD, et al. Using whole genome analysis to examine recombination across diverse sequence types of Staphylococcus aureus. PLoS One. 2015;10:e0130955. doi: 10.1371/journal.pone.0130955. [DOI] [PMC free article] [PubMed] [Google Scholar]
- 9.Haas BJ, Chin M, Nusbaum C, Birren BW, Livny J. How deep is deep enough for RNA-Seq profiling of bacterial transcriptomes? BMC Genomics. 2012;13:734. doi: 10.1186/1471-2164-13-734. [DOI] [PMC free article] [PubMed] [Google Scholar]
- 10.McArthur AG, Waglechner N, Nizam F, Yan A, Azad MA, Baylay AJ, et al. The comprehensive antibiotic resistance database. Antimicrob Agents Chemother. 2013;57(7):3348–3357. doi: 10.1128/AAC.00419-13. [DOI] [PMC free article] [PubMed] [Google Scholar]
- 11.Dengler V, Meier PS, Heusser R, Berger-Bächi B, McCallum N. Induction kinetics of the Staphylococcus aureus cell wall stress stimulon in response to different cell wall active antibiotics. BMC Microbiol. 2011;11:1–11. doi: 10.1186/1471-2180-11-16. [DOI] [PMC free article] [PubMed] [Google Scholar]
- 12.Liu X, Hu Y, Pai P-J, Chen D, Lam H. Label-free quantitative proteomics analysis of antibiotic response in Staphylococcus aureus to oxacillin. J Proteome Res. 2014;13:1223–1233. doi: 10.1021/pr400669d. [DOI] [PubMed] [Google Scholar]
- 13.Kohanski MA, Dwyer DJ, Hayete B, Lawrence CA, Collins JJ. A common mechanism of cellular death induced by bactericidal antibiotics. Cell. 2007;130:797–810. doi: 10.1016/j.cell.2007.06.049. [DOI] [PubMed] [Google Scholar]
- 14.Kohanski MA, Dwyer DJ, Collins JJ. How antibiotics kill bacteria: from targets to networks. Nat Rev Microbiol. 2010;8:423–435. doi: 10.1038/nrmicro2333. [DOI] [PMC free article] [PubMed] [Google Scholar]
- 15.Malachowa N, Whitney AR, Kobayashi SD, Sturdevant DE, Kennedy AD, Braughton KR, et al. Global changes in Staphylococcus aureus gene expression in human blood. PLoS One. 2011;6(4):e18617. doi: 10.1371/journal.pone.0018617. [DOI] [PMC free article] [PubMed] [Google Scholar]
- 16.Szafranska AK, Oxley APA, Chaves-Moreno D, Horst SA, Roßlenbroich S, Peters G, et al. High-resolution transcriptomic analysis of the adaptive response of Staphylococcus aureus during acute and chronic phases of osteomyelitis. mBio. 2014;5:e01775–14. doi: 10.1128/mBio.01775-14. [DOI] [PMC free article] [PubMed] [Google Scholar]
- 17.Lee LY, Miyamoto YJ, McIntyre BW, Höök M, McCrea KW, McDevitt D, et al. The Staphylococcus aureus Map protein is an immunomodulator that interferes with T cell-mediated responses. J Clin Invest. 2002;110(10):1461–1471. doi: 10.1172/JCI0216318. [DOI] [PMC free article] [PubMed] [Google Scholar]
- 18.Bronner S, Monteil H, Prévost G. Regulation of virulence determinants in Staphylococcus aureus: complexity and applications. FEMS Microbiol Rev. 2004;28:183–200. doi: 10.1016/j.femsre.2003.09.003. [DOI] [PubMed] [Google Scholar]
- 19.Kuroda H, Kuroda M, Cui L, Hiramatsu K. Subinhibitory concentrations of beta-lactam induce haemolytic activity in Staphylococcus aureus through the SaeRS two-component system. FEMS Microbiol Lett. 2007;268(1):98–105. doi: 10.1111/j.1574-6968.2006.00568.x. [DOI] [PubMed] [Google Scholar]
- 20.Kuroda M, Kuroda H, Oshima T, Takeuchi F, Mori H, Hiramatsu K. Two-component system VraSR positively modulates the regulation of cell-wall biosynthesis pathway in Staphylococcus aureus. Mol Microbiol. 2003;49(3):807–821. doi: 10.1046/j.1365-2958.2003.03599.x. [DOI] [PubMed] [Google Scholar]
- 21.Gardete S, Wu SW, Gill S, Tomasz A. Role of VraSR in antibiotic resistance and antibiotic-induced stress response in Staphylococcus aureus. Antimicrob Agents Chemother. 2006;50(10):3424–3434. doi: 10.1128/AAC.00356-06. [DOI] [PMC free article] [PubMed] [Google Scholar]
- 22.Rogasch K, Rühmling V, Pané-Farré J, Höper D, Weinberg C, Fuchs S, et al. Influence of the two-component system SaeRS on global gene expression in two different Staphylococcus aureus strains. J Bacteriol. 2006;188(22):7742–7758. doi: 10.1128/JB.00555-06. [DOI] [PMC free article] [PubMed] [Google Scholar]
- 23.Novick RP, Jiang D. The staphylococcal saeRS system coordinates environmental signals with agr quorum sensing. Microbiology. 2003;149(10):2709–2717. doi: 10.1099/mic.0.26575-0. [DOI] [PubMed] [Google Scholar]
- 24.Voyich JM, Vuong C, DeWald M, Nygaard TK, Kocianova S, Griffith S, et al. The SaeR/S gene regulatory system is essential for innate immune evasion by Staphylococcus aureus. J Infect Dis. 2009;199:1698–1706. doi: 10.1086/598967. [DOI] [PMC free article] [PubMed] [Google Scholar]
- 25.Li R, Manna AC, Dai S, Cheung AL, Zhang G. Crystal structure of the SarS protein from Staphylococcus aureus. J Bacteriol. 2003;185(14):4219–4225. doi: 10.1128/JB.185.14.4219-4225.2003. [DOI] [PMC free article] [PubMed] [Google Scholar]
- 26.Cheung AL, Bayer AS, Zhang G, Gresham H, Xiong Y-Q. Regulation of virulence determinants in vitro and in vivo in Staphylococcus aureus. FEMS Immunol Med Microbiol. 2004;40:1–9. doi: 10.1016/S0928-8244(03)00309-2. [DOI] [PubMed] [Google Scholar]
- 27.Cheung AL, Nishina KA, Pous MPT, Tamber S. The SarA protein family of Staphylococcus aureus. Int J Biochem Cell Biol. 2008;40:355–361. doi: 10.1016/j.biocel.2007.10.032. [DOI] [PMC free article] [PubMed] [Google Scholar]
- 28.Korea CG, Balsamo G, Pezzicoli A, Merakou C, Tavarini S, Bagnoli F, et al. Staphylococcal Esx proteins modulate apoptosis and release of intracellular Staphylococcus aureus during infection in epithelial cells. Infect Immun. 2014;82:4144–4153. doi: 10.1128/IAI.01576-14. [DOI] [PMC free article] [PubMed] [Google Scholar]
- 29.Hammer ND, Skaar EP. Molecular mechanisms of Staphylococcus aureus iron acquisition. Annu Rev Microbiol. 2011;65(1):129–147. doi: 10.1146/annurev-micro-090110-102851. [DOI] [PMC free article] [PubMed] [Google Scholar]
- 30.Fillat MF. The FUR, (ferric uptake regulator) superfamily: diversity and versatility of key transcriptional regulators. Arch Biochem Biophys. 2014;546:41–52. doi: 10.1016/j.abb.2014.01.029. [DOI] [PubMed] [Google Scholar]
- 31.Laakso HA, Marolda CL, Pinter TB, Stillman MJ, Heinrichs DE. A heme-responsive regulator controls synthesis of staphyloferrin B in Staphylococcus aureus. J Biol Chem. 2016;291:27-40. [DOI] [PMC free article] [PubMed]
- 32.Dale SE, Doherty-Kirby A, Lajoie G, Heinrichs DE. Role of siderophore biosynthesis in virulence of Staphylococcus aureus: identification and characterization of genes involved in production of a siderophore. Infect Immun. 2003;72(1):29–37. doi: 10.1128/IAI.72.1.29-37.2004. [DOI] [PMC free article] [PubMed] [Google Scholar]
- 33.Zhu Y, Weiss EC, Otto M, Fey PD, Smeltzer MS, Somerville GA. Staphylococcus aureus biofilm metabolism and the influence of arginine on polysaccharide intercellular adhesin synthesis, biofilm formation, and pathogenesis. Infect Immun. 2007;75(9):4219–4226. doi: 10.1128/IAI.00509-07. [DOI] [PMC free article] [PubMed] [Google Scholar]
- 34.Makhlin J, Kofman T, Borovok I, Kohler C, Engelmann S, Cohen G, et al. Staphylococcus aureus ArcR controls expression of the arginine deiminase operon. J Bacteriol. 2007;189(16):5976–5986. doi: 10.1128/JB.00592-07. [DOI] [PMC free article] [PubMed] [Google Scholar]
- 35.Gobelet C, Gerster JC. Synovial fluid lactate levels in septic and non-septic arthritides. Ann Rheum Dis. 1984;43(5):742–745. doi: 10.1136/ard.43.5.742. [DOI] [PMC free article] [PubMed] [Google Scholar]
- 36.Garbe J, Collin M. Bacterial hydrolysis of host glycoproteins - powerful protein modification and efficient nutrient acquisition. J Innate Immun. 2012;4(2):121–131. doi: 10.1159/000334775. [DOI] [PMC free article] [PubMed] [Google Scholar]
- 37.Burnaugh AM, Frantz LJ, King SJ. Growth of Streptococcus pneumoniae on human glycoconjugates is dependent upon the sequential activity of bacterial exoglycosidases. J Bacteriol. 2008;190(1):221–230. doi: 10.1128/JB.01251-07. [DOI] [PMC free article] [PubMed] [Google Scholar]
- 38.Oskouian B, Stewart GC. Repression and catabolite repression of the lactose operon of Staphylococcus aureus. J Bacteriol. 1990;172(7):3804. doi: 10.1128/jb.172.7.3804-3812.1990. [DOI] [PMC free article] [PubMed] [Google Scholar]
- 39.Kim S, Hwang J, Xuan J, Jung YH, Cha H-S, Kim KH. Global metabolite profiling of synovial fluid for the specific diagnosis of rheumatoid arthritis from other inflammatory arthritis. PLoS One. 2014;9(6):e97501. doi: 10.1371/journal.pone.0097501. [DOI] [PMC free article] [PubMed] [Google Scholar]
- 40.Coulter SN, Schwan WR, Ng EYW, Langhorne MH, Ritchie HD, Westbrock-Wadman S, et al. Staphylococcus aureus genetic loci impacting growth and survival in multiple infection environments. Mol Microbiol. 1998;30(2):393–404. doi: 10.1046/j.1365-2958.1998.01075.x. [DOI] [PubMed] [Google Scholar]
- 41.Matuschek E, Brown DFJ, Kahlmeter G. Development of the EUCAST disk diffusion antimicrobial susceptibility testing method and its implementation in routine microbiology laboratories. Clin Microbiol Infect Off Publ Eur Soc Clin Microbiol Infect Dis. 2014;20(4):O255–266. doi: 10.1111/1469-0691.12373. [DOI] [PubMed] [Google Scholar]
- 42.Xu Y, Rudkjøbing VB, Simonsen O, Pedersen C, Lorenzen J, Schønheyder HC, et al. Bacterial diversity in suspected prosthetic joint infections: an exploratory study using 16S rRNA gene analysis. FEMS Immunol Med Microbiol. 2012;65(2):291–304. doi: 10.1111/j.1574-695X.2012.00949.x. [DOI] [PubMed] [Google Scholar]
- 43.Jumpstart Consortium Human Microbiome Project Data Generation Working Group. 16S 454 Sequencing protocol, HMP Consortium. 2010. http://hmpdacc.org/doc/16S_Sequencing_SOP_4.2.2.pdf. Accessed 10 Apr 2015.
- 44.Caporaso JG, Lauber CL, Walters WA, Berg-Lyons D, Huntley J, Fierer N, et al. Ultra-high-throughput microbial community analysis on the Illumina HiSeq and MiSeq platforms. ISME J. 2012;6(8):1621–1624. doi: 10.1038/ismej.2012.8. [DOI] [PMC free article] [PubMed] [Google Scholar]
- 45.Caporaso JG, Kuczynski J, Stombaugh J, Bittinger K, Bushman FD, Costello EK, et al. QIIME allows analysis of high-throughput community sequencing data. Nat Methods. 2010;7(5):335–336. doi: 10.1038/nmeth.f.303. [DOI] [PMC free article] [PubMed] [Google Scholar]
- 46.DeSantis TZ, Hugenholtz P, Larsen N, Rojas M, Brodie EL, Keller K, et al. Greengenes, a chimera-checked 16S rRNA gene database and workbench compatible with ARB. Appl Environ Microbiol. 2006;72(7):5069–5072. doi: 10.1128/AEM.03006-05. [DOI] [PMC free article] [PubMed] [Google Scholar]
- 47.Vallenet D, Belda E, Calteau A, Cruveiller S, Engelen S, Lajus A, et al. MicroScope--an integrated microbial resource for the curation and comparative analysis of genomic and metabolic data. Nucleic Acids Res. 2013;41(Database issue):D636–647. doi: 10.1093/nar/gks1194. [DOI] [PMC free article] [PubMed] [Google Scholar]
- 48.Tatusov RL, Koonin EV, Lipman DJ. A genomic perspective on protein families. Science. 1997;278(5338):631–637. doi: 10.1126/science.278.5338.631. [DOI] [PubMed] [Google Scholar]
- 49.Robinson MD, McCarthy DJ, Smyth GK. edgeR: a Bioconductor package for differential expression analysis of digital gene expression data. Bioinforma Oxf Engl. 2010;26(1):139–140. doi: 10.1093/bioinformatics/btp616. [DOI] [PMC free article] [PubMed] [Google Scholar]
- 50.Benjamini Y, Hochberg Y. Controlling the false discovery rate: a practical and powerful approach to multiple testing. J R Stat Soc Ser B Methodol. 1995;57(1):289–300. [Google Scholar]
- 51.Meiboom S, Gill D. Modified spin‐echo method for measuring nuclear relaxation times. Rev Sci Instrum. 1958;29(8):688–691. doi: 10.1063/1.1716296. [DOI] [Google Scholar]
- 52.Wishart DS, Tzur D, Knox C, Eisner R, Guo AC, Young N, et al. HMDB: the Human Metabolome Database. Nucleic Acids Res. 2007;35(Database issue):D521–526. doi: 10.1093/nar/gkl923. [DOI] [PMC free article] [PubMed] [Google Scholar]
- 53.Tulpan D, Léger S, Belliveau L, Culf A, Cuperlović-Culf M. MetaboHunter: an automatic approach for identification of metabolites from 1H-NMR spectra of complex mixtures. BMC Bioinformatics. 2011;12:400. doi: 10.1186/1471-2105-12-400. [DOI] [PMC free article] [PubMed] [Google Scholar]
- 54.Foxall PJ, Spraul M, Farrant RD, Lindon LC, Neild GH, Nicholson JK. 750 MHz 1H-NMR spectroscopy of human blood plasma. J Pharm Biomed Anal. 1993;11(4–5):267–276. doi: 10.1016/0731-7085(93)80017-U. [DOI] [PubMed] [Google Scholar]
- 55.Piñero-Sagredo E, Nunes S, de Los Santos MJ, Celda B, Esteve V. NMR metabolic profile of human follicular fluid. NMR Biomed. 2010;23(5):485–495. doi: 10.1002/nbm.1488. [DOI] [PubMed] [Google Scholar]
- 56.Edgar R, Domrachev M, Lash AE. Gene Expression Omnibus: NCBI gene expression and hybridization array data repository. Nucleic Acids Res. 2002;30(1):207–210. doi: 10.1093/nar/30.1.207. [DOI] [PMC free article] [PubMed] [Google Scholar]
Associated Data
This section collects any data citations, data availability statements, or supplementary materials included in this article.
Data Availability Statement
The sample that this case story is built upon does not exist anymore, since all have been used during this study. Raw data can be forwarded to interested parties by contacting the corresponding author.