Abstract
Background
Mitochondrial reactive oxygen species (ROS) are associated with metabolic heart disease (MHD). However, the mechanism by which ROS cause MHD is unknown. We tested the hypothesis that mitochondrial ROS are a key mediator of MHD.
Methods and Results
Mice fed a high‐fat high‐sucrose (HFHS) diet develop MHD with cardiac diastolic and mitochondrial dysfunction that is associated with oxidative posttranslational modifications of cardiac mitochondrial proteins. Transgenic mice that express catalase in mitochondria and wild‐type mice were fed an HFHS or control diet for 4 months. Cardiac mitochondria from HFHS‐fed wild‐type mice had a 3‐fold greater rate of H2O2 production (P=0.001 versus control diet fed), a 30% decrease in complex II substrate–driven oxygen consumption (P=0.006), 21% to 23% decreases in complex I and II substrate–driven ATP synthesis (P=0.01), and a 62% decrease in complex II activity (P=0.002). In transgenic mice that express catalase in mitochondria, all HFHS diet–induced mitochondrial abnormalities were ameliorated, as were left ventricular hypertrophy and diastolic dysfunction. In HFHS‐fed wild‐type mice complex II substrate–driven ATP synthesis and activity were restored ex vivo by dithiothreitol (5 mmol/L), suggesting a role for reversible cysteine oxidative posttranslational modifications. In vitro site‐directed mutation of complex II subunit B Cys100 or Cys103 to redox‐insensitive serines prevented complex II dysfunction induced by ROS or high glucose/high palmitate in the medium.
Conclusion
Mitochondrial ROS are pathogenic in MHD and contribute to mitochondrial dysfunction, at least in part, by causing oxidative posttranslational modifications of complex I and II proteins including reversible oxidative posttranslational modifications of complex II subunit B Cys100 and Cys103.
Keywords: metabolic heart disease, mitochondria, obesity, oxidative protein modifications, oxidative stress
Subject Categories: Metabolic Syndrome, Contractile function, Animal Models of Human Disease, Oxidant Stress
Introduction
One‐third of Americans have obesity‐related metabolic syndrome with type 2 diabetes, hypertension, and dyslipidemia.1, 2, 3 An important consequence of metabolic syndrome is metabolic heart disease (MHD), which is associated with left ventricular (LV) hypertrophy, diastolic dysfunction, and impaired cardiac energetics.4, 5, 6, 7 We previously showed that feeding mice a high‐fat, high‐sucrose (HFHS) diet for 8 months leads to obesity, metabolic syndrome, and a cardiac phenotype typical of MHD with LV hypertrophy, diastolic dysfunction, and cardiac mitochondrial dysfunction.8, 9
Several findings in HFHS‐fed mice suggest a central role for reactive oxygen species (ROS) in the development of MHD. Markers of oxidative stress are increased in the myocardium,8 and oxidative posttranslational modifications (OPTMs) are found in multiple target proteins, many of which are in the mitochondria.10 A role for ROS is further supported by our demonstration in isolated mitochondria from HFHS‐fed mice that there is impaired complex II–driven ATP generation, which is restored ex vivo by dithiothreitol (DTT).9 The cardiac phenotype of hypertrophy and diastolic dysfunction is also prevented by polyphenols,8 which may exert antioxidant effects. Finally, ROS production is increased in isolated cardiac mitochondria from these mice,9 suggesting that mitochondria may be a source of ROS with HFHS feeding.
Together, these observations led to our thesis that mitochondrial ROS play a key role in mediating MHD in HFHS‐fed mice. These observations, though suggestive, are circumstantial. A primary goal of the present study was to test the thesis in vivo using an intervention that is specific for mitochondrial ROS. Accordingly, in mice fed a HFHS diet for 4 months, we studied the effects of decreasing mitochondrial ROS by transgenic expression of mitochondrial catalase on (1) ATP production and respiration in isolated cardiac mitochondria and (2) cardiac structural and functional remodeling. The mechanistic role of cysteine oxidation was assessed ex vivo in isolated mitochondria by examining the effects of exposure to a reducing environment on complex II oxidation and function. The role of specific oxidative cysteine modifications of complex II in mediating dysfunction was assessed in vitro by site‐directed mutation to redox‐insensitive serines in HEK‐293T cells exposed to ROS or high glucose/high palmitate in the medium.
Methods
Experimental Animals
Mitochondrially targeted catalase overexpressing (mCAT) and wild‐type (WT) littermate control mice (C57BL/6NJ background) 9 weeks of age were fed ad libitum either a control chow diet (CD; Research Diets, product No. D09071703, 10% kcal lard, 0% sucrose) or an HFHS diet (Research Diets, product No. D09071702; 58% kcal lard, 13% kcal sucrose) for 4 months. mCAT mice were obtained from the Jackson Laboratory [strain: B6.Cg‐Tg(CAG‐OTC/CAT)4033Prab/J; stock No. 016197]. These mice were originally developed by Dr Peter Rabinovitch's group (University of Washington), and their characteristics are published.11 Diet compositions were matched for caloric value (Table S1). Mice were weighed and killed at the end of the study. A total of 20 animals were used for the experiments: WT/CD (n=6), WT/HFHS (n=4), mCAT/CD (n=5), and mCAT/HFHS (n=5). HFHS diet caused obesity to similar extents in WT and mCAT mice (Figure S1). We have previously shown that HFHS diet leads to insulin resistance by 2 months on the diet with hyperglycemia and elevated Homeostatic Model Assessment of Insulin Resitance (HOMA‐IR),12 while plasma free fatty acids and triglycerides are not elevated up to 8 months on the diet.8
The protocol was approved by the Institutional Animal Care and Use Committee at Boston University School of Medicine. A 4‐month HFHS diet duration was chosen to avoid the potential confounding effects of renal impairment and hypertension that appear after 4 months on the HFHS diet.8, 12
Two‐Dimensional and M‐Mode Echocardiography
LV dimensions and systolic function were measured in nonanesthetized mice with use of an Acuson Sequoia C‐256 echocardiograph machine equipped with a 15‐MHz linear transducer (model 15L8), as we have previously described.8 Briefly, the heart was imaged in the 2‐dimensional parasternal short‐axis view, and an M‐mode echocardiogram of the mid‐ventricle was recorded at the level of papillary muscles. Anterior wall thickness, posterior wall thickness, and LV end‐diastolic and end‐systolic dimensions were measured from the M‐mode image. LV fractional shortening was calculated as follows: [(end‐diastolic dimension−end‐systolic dimension)/end‐diastolic dimension×100].
Doppler Echocardiography
LV diastolic function was assessed with transmitral and tissue Doppler echocardiography with the use of a VisualSonics Vevo 770 high‐resolution imaging system equipped with a 30‐MHz RMV‐707B transducer.8 Briefly, mice were anesthetized with isoflurane via facemask at a concentration of 2.5% for induction and then 1.5% for maintenance. Pulsed‐wave Doppler images were collected in the apical 4‐chamber view to record the mitral Doppler flow spectra. Peak early (E) and late (A) mitral inflow velocities, E/A ratio, deceleration time of early filing, and isovolumetric relaxation time were measured. Tissue Doppler images were collected in the parasternal short‐axis view, and myocardial peak early diastolic velocity was measured. Doppler spectra were recorded for 12 to 14 cardiac cycles, from which at least 5 consecutive cardiac cycles were selected, and the values were averaged in accordance with the American Society of Echocardiography guidelines.13 Data analysis was performed offline with the use of a customized version of Vevo 770 Analytic software.
Mitochondrial Isolation
Heart mitochondria were isolated as previously described by us with minor modifications.9, 14, 15 All steps were performed at 4°C. Briefly, tissues were rinsed in a buffer containing 100 mmol/L KCl, 5 mmol/L EGTA, and 5 mmol/L HEPES, pH 7.0, and thereafter homogenized in 2 mL of HES buffer (HEPES 5 mmol/L, EDTA 1 mmol/L, sucrose 0.25 mol/L, pH 7.4 adjusted with KOH 1 mol/L) by using a Teflon‐on‐glass electric homogenizer. The homogenate was centrifuged at 500g for 10 minutes at 4°C. The supernatant was then centrifuged at 9000g for 15 minutes at 4°C, and the mitochondrial pellet was resuspended in 100 μL of HES buffer with 0.3% of BSA fatty acid free. Protein was quantified with the use of BCA (Pierce), and the value of HES‐BSA buffer alone was subtracted. This isolation method captures predominantly subsarcolemmal mitochondria.
Mitochondrial H2O2 Production
Mitochondrial H2O2 production was measured by using the Amplex Ultra Red horseradish peroxidase method (Invitrogen) as we described previously with minor modifications.9 This assay is based on the horseradish peroxidase (2 units/mL) H2O2‐dependent oxidation of nonfluorescent Amplex Ultra Red (50 μmol/L) to fluorescent resorufin red. In short, 10 μg mitochondria was diluted in 50 μL of reaction buffer (125 mmol/L KCl, 10 mmol/L HEPES, 5 mmol/L MgCl2, 2 mmol/L K2HPO4, pH 7.44) to determine complex I (pyruvate/malate, 5 mmol/L) or complex II (succinate, 5 mmol/L)–driven H2O2 production with and without inhibitor (rotenone 2 μmol/L). Mitochondrial H2O2 production was measured after the addition of 50 μL of reaction buffer containing horseradish peroxidase and Amplex Ultra Red. Fluorescence was followed at an excitation wavelength of 545 nm and an emission wavelength of 590 nm for 20 minutes. The slope of the increase in fluorescence is converted to the rate of H2O2 production with the use of a standard curve. All of the assays were performed at 25°C. The results are reported as picomoles per minute per milligrams of protein.
ATP Production in Isolated Mitochondria
ATP synthesis rates in isolated heart mitochondria were determined by using the luciferin/luciferase–based ATP Bioluminescence Assay Kit CLS II (Roche) as we previously described with minor modifications.9 In short, 10 μg of heart mitochondria was suspended in 75 μL of buffer A (125 mmol/L KCl, 10 mmol/L HEPES, 5 mmol/L MgCl2, and 2 mmol/L K2HPO4, pH 7.44) to determine complex I (pyruvate/malate, 5 mmol/L final) or complex II (succinate, 5 mmol/L final)–driven ATP synthesis. Following standard practice, succinate‐driven ATP generation was measured in the presence of complex I inhibitor rotenone (2 μmol/L) to avoid the reverse electron transfer effect.16 The assays were performed in the presence and absence of DTT 5 mmol/L. Measurements with substrates were repeated in the presence of oligomycin, an inhibitor of ATP synthase, to determine the rates of nonmitochondrial ATP production. The background of the assay was determined with mitochondria alone. The measurements for all samples were started simultaneously by adding 75 μL of luciferin/luciferase buffer containing 1 mmol/L ADP (0.5 mmol/L final). The initial slope of the increase in ATP‐supported luciferase chemiluminescence was used to determine the rate of ATP production after subtraction of the background and nonmitochondrial values. With use of an ATP standard provided in the kit, the slopes were converted in nanomoles per minute per milligrams of protein.
Mitochondrial Electron Transport Chain Complex II Activity
Complex II enzyme activity of isolated mitochondria was measured by using a microplate assay kit (Abcam/Mitosciences ab109908/MS241), as we previously described.9 In this assay kit, complex II is immunocaptured within the wells of the microplate. The production of ubiquinol by complex II is coupled to the reduction of the dye DCPIP (2,6‐diclorophenolindophenol), and decreases in its absorbance at 600 nm are measured spectrophotometrically. The assay is performed in the presence of succinate as a substrate. The assay was performed in the presence and absence of 5 mmol/L DTT. Enzymatic activity was normalized to mitochondrial protein concentration.
Mitochondrial Oxygen Consumption Rate
Oxygen consumption rates were monitored by using a Seahorse XF24 oxygen flux analyzer as we previously described.14, 15 Isolated mitochondria were loaded in a 24‐well Seahorse plate on ice (5–12.5 μg/well) and 500 μL of ice‐cold mitochondrial assay solution (MAS: 70 mmol/L sucrose, 220 mmol/L mannitol, 5 mmol/L KH2PO4, 5 mmol/L MgCl2, 2 mmol/L HEPES, 1 mmol/L EGTA, 0.3% BSA fatty acid free, pH 7.4) were added on top. The 4 sequential injection ports of the Seahorse cartridge contained the following: port A, 50 μL of 10× substrate (complex I: 50 mmol/L pyruvate and 50 mmol/L malate; complex II: 50 mmol/L succinate and 20 μmol/L rotenone in MAS) and 2.5 mmol/L ADP; port B, 55 μL of 20 μmol/L oligomycin; port C, 60 μL of 40 μmol/L Carbonyl cyanide‐4‐(trifluoromethoxy)phenylhydrazone (FCCP); and port D 65 μL of 40 μmol/L antimycin A. State III was determined after port A injection, state IV after port B, and uncoupled after port C. Antimycin A was used as a control because it blocks the electron transport chain to minimize mitochondrial oxygen consumption. The results are reported as ρmol oxygen per minute per microgram of protein.
Immunoblotting for Mitochondrial Proteins
Immunoblots were performed on frozen LV that was homogenized in tissue lysis buffer (HEPES, pH 7.4, 20 mmol/L, B‐glycerol phosphate 50 mmol/L, EGTA 2 mmol/L, DTT 1 mmol/L, NaF 10 mmol/L, NaVO4 1 mmol/L, Triton X‐100 1%, glycerol 10%, and 1 protease inhibitor complete mini tablet, EDTA free, 20 mL [Roche]). Total protein (25 μg) was separated via sodium dodecyl sulfate–polyacrylamide gel electrophoresis and transferred to polyvinylidene fluoride membranes. Blots were incubated with mouse total OXPHOS Rodent WB Antibody cocktail (containing 5 antibodies, 1 each against complex I subunit [NDUFB8], complex II subunit B [SDHB], complex III core protein 2 [UQCRC2], complex IV subunit I [MTCO1], and complex V alpha subunit [ATP5A]) (Abcam; ab110413), anti‐VDAC1 (Abcam; ab15895), and anti‐GAPDH (Abcam; ab8245) and detected with the use of the Licor Odyssey 2‐color infrared imaging system.
Biotin Switch Assay
Labeling with biotin iodoacetamide (BIAM; Life Technologies; B‐1591) was used in a biotin switch assay to detect reversibly oxidized cysteines, as we previously described with minor modifications.9, 17 Freshly isolated LV sections were immediately snap‐frozen and stored in liquid nitrogen. Tissue was thawed and lysed in RIPA buffer containing 100 mmol/L N‐ethylmaleimide (NEM) to block all free thiols and prevent further oxidation. Excess NEM was removed by passing the lysates over Zeba spin columns. NEM‐labeled proteins are treated with 5 mmol/L DTT at room temperature for 15 minutes to reduce reversible oxidations to free thiols and again column cleaned to eliminate DTT. Samples are incubated with 4 mmol/L BIAM for 2 hours at room temperature in the dark, labeling any reactive free thiols that were previously oxidized. BIAM‐labeled proteins are isolated from total protein pool with the use of streptavidin magnetic beads (50 μL) for 1 hour at room temperature in the dark, washed, and cleaved from beads by boiling in 30 μL of 2× nonreducing Laemmli buffer for 10 minutes. Entire BIAM‐labeled and unlabeled protein fractions are subjected to Western blotting and probed with anti‐SDHB (Abcam; ab14714) antibodies, and bands were detected by using near‐infrared dye‐conjugated secondary antibodies and quantified with the Licor Odyssey 2‐color infrared imaging system. Ratio of labeled to total (labeled plus unlabeled) proteins represents percentage of reversibly oxidized cysteines in SDHB.
Construction of SDHB Cysteine Mutants and Expression in HEK‐293T Cells
Full‐length mouse SDHB construct in pCMV‐sport6 was obtained from American Type Culture Collection (ATCC; MGC: 19177; IMAGE: 4225025) and used as the template for site‐directed mutagenesis. The Cys→Ser mutants were prepared by introducing a single base exchange (Cys100Ser, TGT→TCT; Cys103Ser, TGT→TCT; Cys115Ser, TGT→TCT) with use of the QuikChange II XL site‐directed mutagenesis kit. Mutants were confirmed by DNA sequencing (Tufts Medical Center, Sequencing Core, Boston, MA). Constructs or empty vector, serving as control, were transfected into HEK‐293T cells by using polyethyleneimine “MAX” transfection reagent (Polysciences, Inc).
In Vitro Exposure to H2O2 or High‐Glucose/High‐Palmitate Medium
Cells were then cultured for an additional 42 to 48 hours in DMEM supplemented with 10% fetal bovine serum. At the end of that period, cells were treated with either 500 μmol/L H2O2 or vehicle for 10 minutes. In other experiments, cells were cultured for 14 hours in high‐glucose/high‐palmitate (HGHP) medium (25 mmol/L glucose, 0.4 mmol/L palmitic acid, 0.67% BSA) or control media (5 mmol/L glucose, 0.67% BSA), as previously described.17 Cells were then lyzed, and complex II activity was measured as described earlier with the use of the Abcam/Mitosciences kit ab109908/MS241.
Statistical Analysis
Data are presented as mean±SEM. Comparisons between groups were performed by using 1‐way ANOVA with Bonferroni posttests for multiple comparisons. All statistical analyses were performed with GraphPad Prism version 6 software (GraphPad Software Inc). A value of P<0.05 was considered statistically significant.
Results
Mitochondrial H2O2 Production Is Increased After 4 Months of HFHS Diet and Corrected in mCAT Mice
In cardiac mitochondria from WT mice fed an HFHS diet versus the CD, H2O2 production was increased with either complex I (pyruvate+malate; Figure 1A) or complex II (succinate+rotenone; Figure 1B) substrates. The HFHS‐induced increases in H2O2 production with both complex I and II substrates were prevented in mCAT mice (Figure 1).
Figure 1.
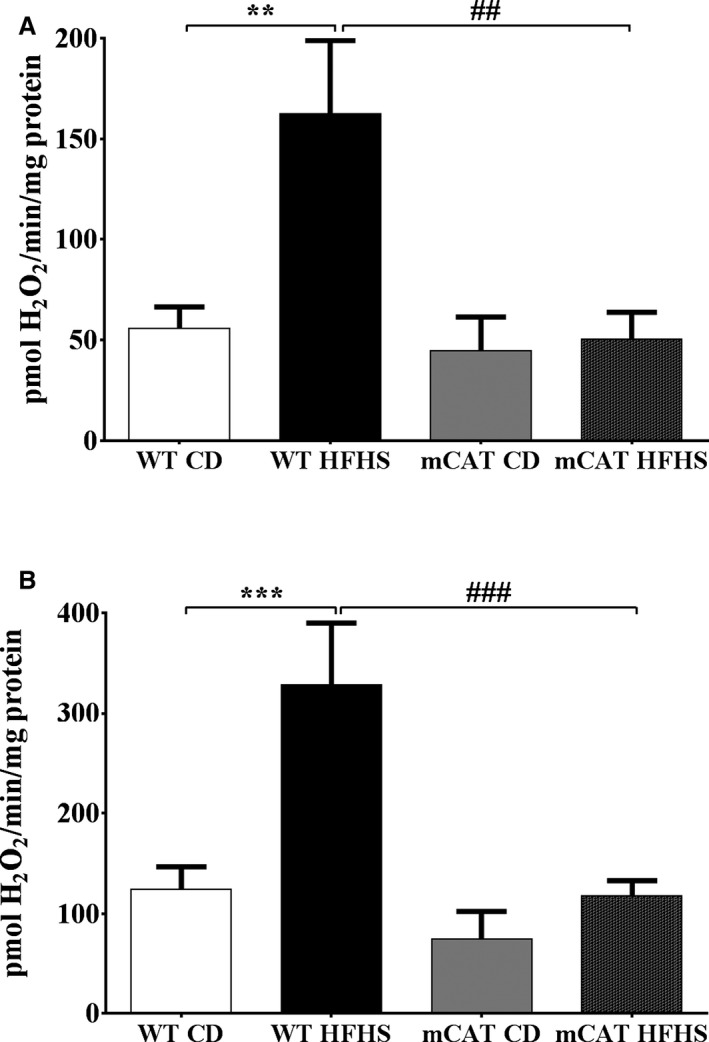
Increased cardiac mitochondrial H2O2 production in high‐fat high‐sucrose (HFHS) diet–fed mice is prevented by transgenic expression of mitochondrial catalase (mCAT). The mitochondrial H2O2 production rate is increased in cardiac mitochondria from wild‐type (WT) but not mCAT mice. A, H2O2 production rate with a complex I substrate (5 mmol/L pyruvate+5 mmol/L malate); (B) H2O2 production rate with a complex II substrate (5 mmol/L succinate) and inhibition of reverse electron transport (2 μmol/L rotenone). Values are mean±SEM; n=4 to 5; **P<0.01 vs WT control diet (CD); ***P<0.001 vs WT CD; ## P<0.01 vs WT HFHS; ### P<0.001 vs WT HFHS.
Effects of HFHS Diet and mCAT Expression on Maximal ATP Synthesis Rate
In mitochondria from HFHS‐fed WT mice, the maximal rates of ATP synthesis were decreased by 21% and 23% for complex I (Figure 2A) and complex II (Figure 2B) substrates, respectively. The HFHS‐induced decreases in ATP synthesis rates for complex I and complex II substrates were both prevented in mCAT mice (Figure 2). The HFHS‐induced decreases in complex I and II function were not associated with a change in the protein expression of the representative subunits of complexes I, II, III, IV, or V (Table S2). Thus, decreased complex I and II ATP production in HFHS‐fed mice is not the result of decreased expression of complex I or II proteins.
Figure 2.
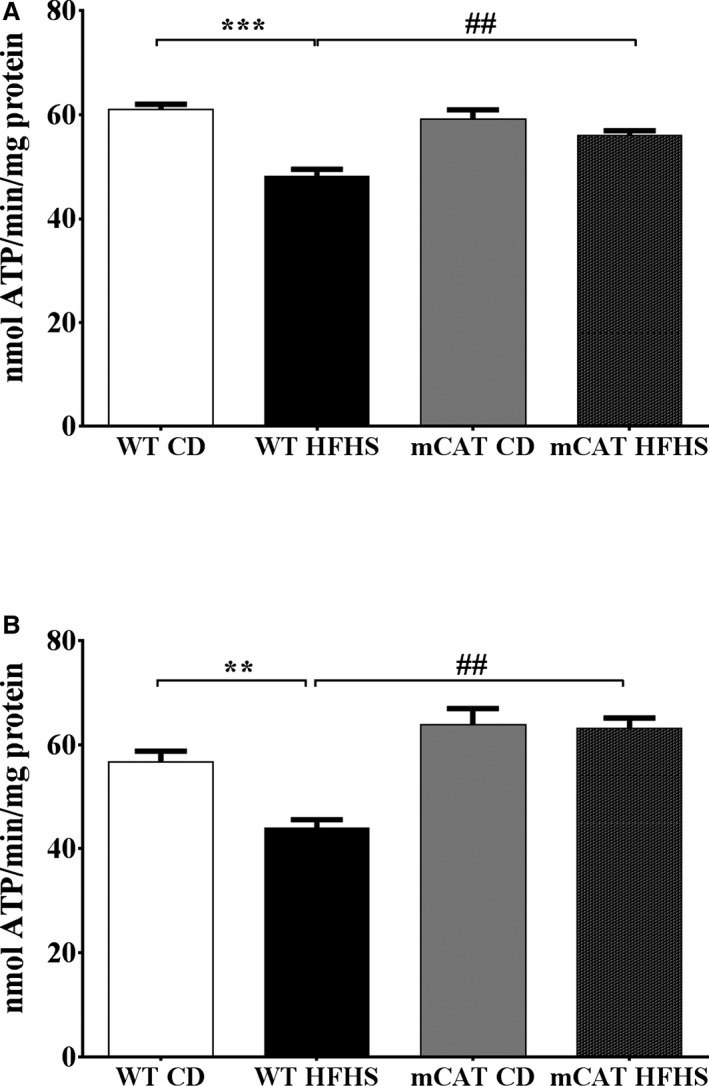
Decreases in complex I and II substrate–driven cardiac mitochondrial ATP synthesis rates in high‐fat high‐sucrose (HFHS) diet–fed mice are prevented in mitochondrial catalase (mCAT) mice. Cardiac mitochondrial complex I and II substrate–driven ATP synthesis rates are decreased in HFHS‐fed wild‐type (WT) but not mCAT mice. A, Complex I substrate–driven ATP synthesis rate (5 mmol/L pyruvate+5 mmol/L malate). B, Complex II substrate–driven ATP synthesis rate (5 mmol/L succinate+2 μmol/L rotenone). Values are mean±SEM; n=4 to 6; **P<0.01 vs WT control diet (CD); ***P<0.001 vs WT CD; ## P<0.01 vs WT HFHS.
Effects of HFHS Diet and mCAT on Mitochondrial Oxygen Consumption
To further assess the mechanism responsible for decreased ATP production with HFHS feeding, oxygen consumption rate was measured in isolated mitochondria by using a Seahorse XF24 oxygen flux analyzer. In WT mice, complex I–mediated respiration linked to maximal ATP synthesis rate (state III) and proton leak (state IV) both tended to be lower in HFHS‐fed mice but did not reach statistical significance (Figure 3A and 3B). Likewise, complex I substrate state III and IV oxygen consumption rates tended to be higher in HFHS‐fed mCAT (versus WT) mice but did not reach statistical significance (Figure 3A and 3B). Both complex II–mediated state III and state IV, oxygen consumption rates were significantly decreased in mitochondria from HFHS‐fed WT mice, and the HFHS‐mediated decreases in both state III and state IV oxygen consumption rates were prevented in mCAT mice (Figure 3C and 3D). The parallel decreases in state III and IV respiration with HFHS feeding suggests that the observed decreases in complex I and II–mediated ATP production are the result of impaired electron transport chain function rather than proton leak. The ability of mCAT to correct both ATP production and respiration suggests that catalase‐sensitive ROS mediates the observed electron transport chain dysfunction. To control for mitochondrial integrity we derived respiratory control ratios for state III/IV oxygen consumption rate values. There were no differences in respiratory control ratios between CD, HFHS, or mCAT groups (Figure S2).
Figure 3.
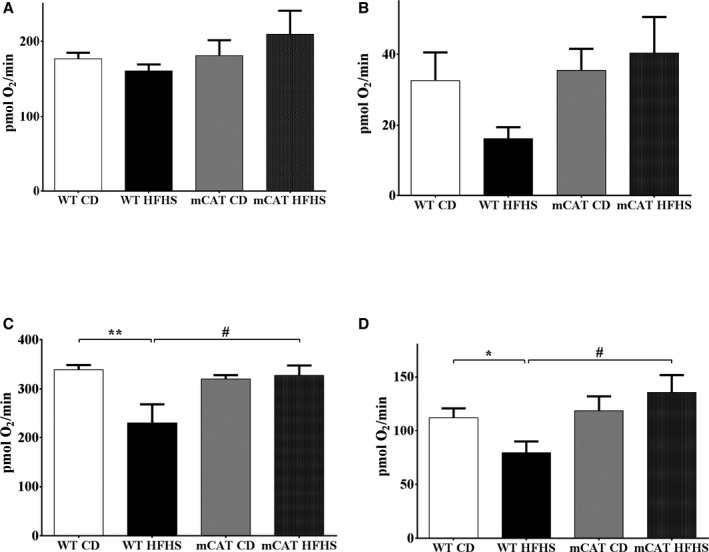
Decreased cardiac mitochondrial maximal and uncoupled oxygen consumption in high‐fat high‐sucrose (HFHS) diet–fed mice is normalized in mitochondrial catalase (mCAT) mice. A, Complex I substrate–driven maximal oxygen consumption rate (state III). B, Complex I substrate–driven uncoupled (oligomycin 2 μmol/L) oxygen consumption rate (state IV). C, Complex II substrate–driven maximal oxygen consumption rate (state III). D, Complex II substrate–driven uncoupled (oligomycin 2 μmol/L) oxygen consumption rate (state IV). Values are mean±SEM; n=4 to 6; *P<0.05 vs wild‐type (WT) control diet (CD); **P<0.01 vs WT CD; # P<0.05 vs WT HFHS.
Differential Effects of DTT on Complex I and II–Mediated ATP Production
We previously observed that with 8 months of HFHS feeding, complex II dysfunction is reversed by DTT ex vivo, while complex I dysfunction is not.9 Likewise, in mitochondria from HFHS‐fed WT mice, preincubation with DTT (5 mmol/L) had no effect on complex I substrate–mediated ATP synthesis (Figure S3A) but restored complex II substrate–mediated ATP synthesis to that of WT CD‐fed mice (Figure S3B). In mitochondria from mCAT mice, DTT had no effect on either complex I or complex II substrate–mediated ATP synthesis rate, regardless of diet (Figure S4A and S4B). These observations suggest that mCAT fully normalizes complex I and II function in HFHS‐fed mice.
The HFHS Diet‐–Induced Decrease in Complex II Activity Is Reversible
We further assessed complex II directly by measuring the reduction of ubiquinone to ubiquinol. In WT mice, HFHS feeding decreased complex II activity by 62% (Figure 4A). DTT completely restored complex II activity in HFHS‐fed mice (Figure 4A). The HFHS‐induced decrease in complex II activity was prevented in mCAT mice (Figure 4B), and accordingly, DTT had no further effect on complex II activity in HFHS‐fed mCAT mice (Figure 4C). These observations confirm that the HFHS feeding–induced decrease in complex II function, as reflected by ATP production, is prevented by mCAT in vivo and reversed by DTT ex vivo.
Figure 4.
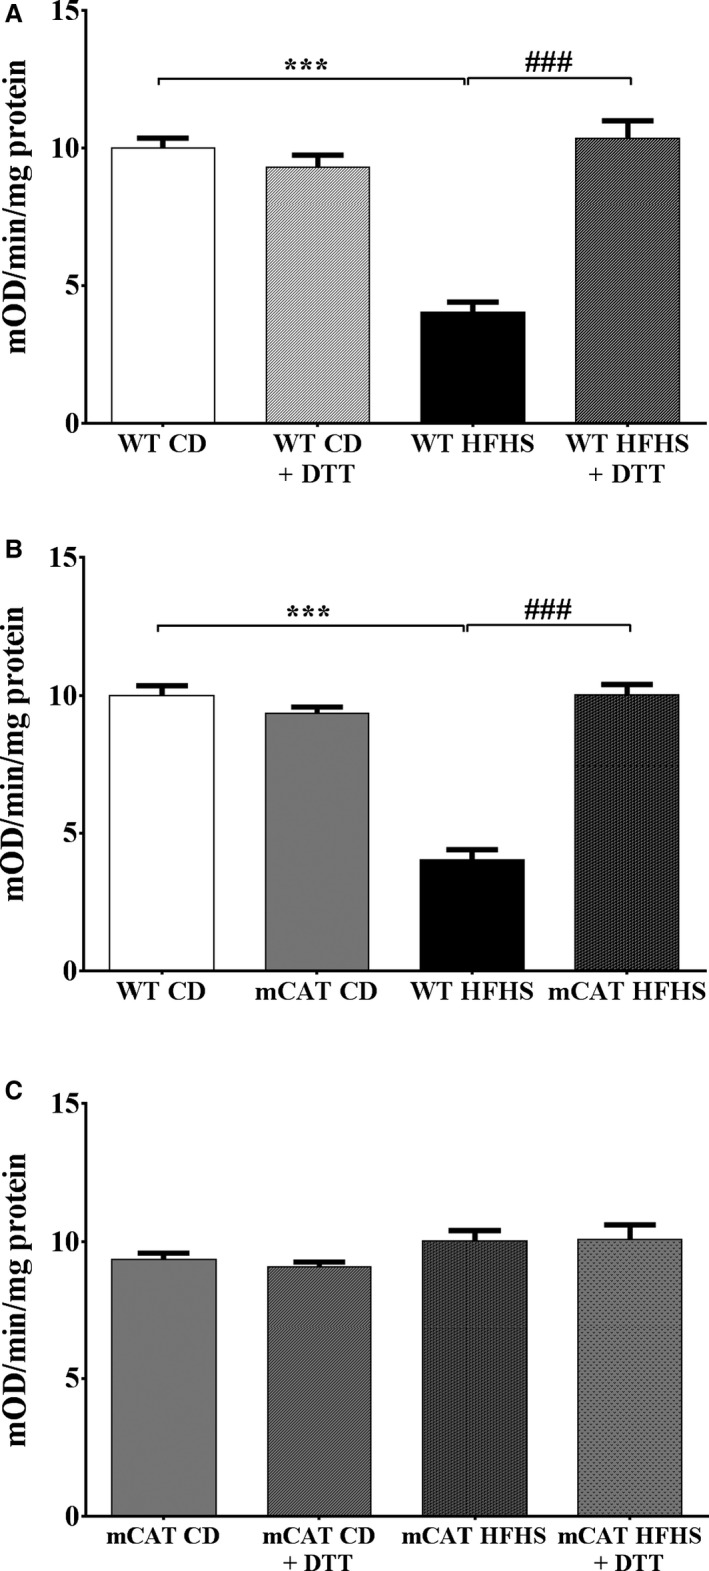
Decreased cardiac mitochondrial complex II activity in high‐fat high‐sucrose (HFHS) diet–fed mice is corrected by exposure to dithiothreitol (DTT; 5 mmol/L) ex vivo and prevented by overexpression of mitochondrial catalase (mCAT) in vivo. A, In wild‐type (WT) mice, complex II activity assessed by the reduction of ubiquinone to ubiquinol is decreased by HFHS feeding and restored by exposure to DTT (5 mmol/L) ex vivo. B, In mCAT mice, the HFHS‐induced decrease in complex II activity is prevented. C, In mCAT mice, DTT exposure ex vivo has no effect irrespective of diet. Values are mean±SEM; n=4 to 5; ***P<0.001 vs WT control diet (CD); ### P<0.001 vs WT HFHS.
HFHS Feeding Causes Reversible Cysteine OPTMs in Complex II
We previously used iodoacetamide‐based cysteine‐reactive tandem mass tags to identify 3 cysteines in SDHB that undergo reversible oxidation with HFHS feeding for 8 months.9, 10 To determine whether reversible cysteine oxidation occurs in the SDHB subunit of complex II with HFHS feeding for only 4 months, we performed a biotin‐switch assay in LV homogenates. Free thiols were blocked with N‐ethylmaleimide; reversibly oxidized thiols were then reduced with DTT (as in the ATP and complex II activity assays), labeled with BIAM and immunoblotted for SDHB. The quantity of reversibly oxidized thiols in SDHB was increased by HFHS feeding, and this increase was prevented in mCAT mice (Figure 5). Thus, ≥1 reversible OPTMs of complex II subunit B are associated with HFHS feeding–induced complex II dysfunction and are prevented by mCAT.
Figure 5.
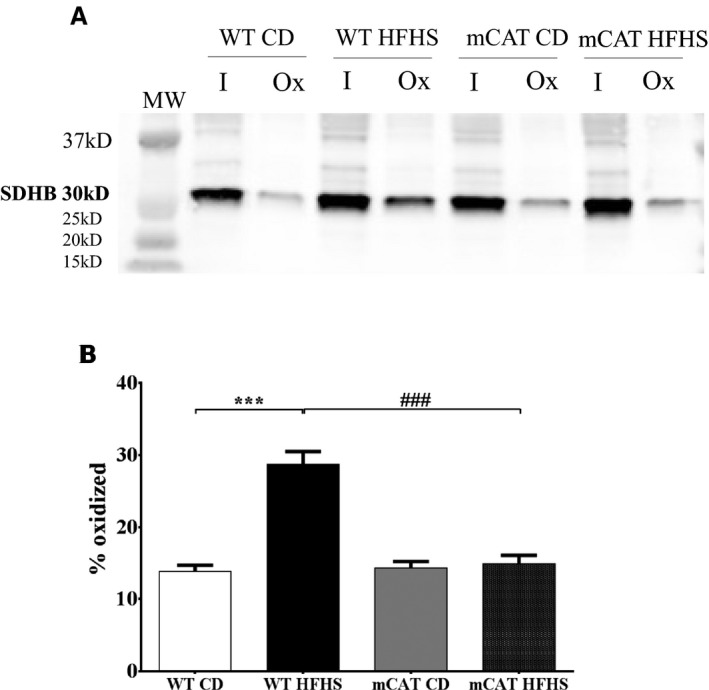
Reversible cysteine oxidative posttranslational modifications (OPTMs) of cardiac mitochondrial complex II subunit B (succinate dehydrogenase B; SDHB) are increased in high‐fat high‐sucrose (HFHS) diet–fed wild‐type (WT) mice and prevented in mitochondrial catalase (mCAT) mice. A biotin switch assay was used to detect reversibly oxidized cysteines on SDHB. A, Representative blot in which “I” represents protein labeled by the antibody for SDHB and “Ox” represents the portion of total protein containing a reversible cysteine OPTM. B, Bar graph showing the mean values for the ratio of oxidized (Ox) to total (I+Ox) SDHB, reflecting the proportion of reversibly oxidized cysteines. MW, molecular weight. Values are mean±SEM; n=4 to 5; ***P<0.001 vs WT control diet (CD); ### P<0.001 vs WT HFHS.
SDHB Redox‐Insensitive Mutants Protect Complex II Activity From ROS‐ and HGHP‐Mediated Inhibition
To test whether cysteine OPTMs could mediate the complex II inhibition in HFHS‐fed mice, we used HEK‐293T cells as a model system. Exposure of HEK cells to H2O2 (500 μmol/L, 10 minutes) caused an ≈55% decrease complex II activity, which was restored by the ex vivo addition of (DTT 5 mmol/L) (Figure 6A), consistent with the DTT‐reversible inhibition of complex II function that we observed with HFHS feeding (see Figure 4). Based on our prior observation that Cys100, Cys103, and Cys115 undergo reversible oxidation in HFHS‐fed mice,9 we used site‐directed mutagenesis to generate SHDB constructs in which these cysteines are replaced by serine and therefore no longer redox sensitive. Baseline complex II activity in the HEK cells transfected with SDHB mutants was not different from that in HEK cells transfected with a control empty vector (Figure 6B through 6D). HEK cells transfected with the Cys100Ser and Cys103Ser SDHB mutants were each protected from the H2O2‐mediated decrease in complex II activity (Figure 6B and 6C), whereas HEK cells transfected with Cys115Ser mutant remained susceptible (Figure 6D).
Figure 6.
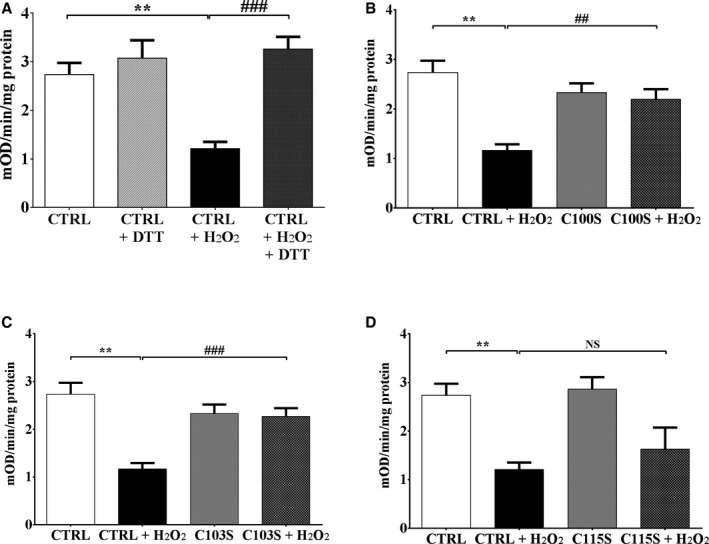
Oxidation of succinate dehydrogenase B (SDHB) Cys100 and Cys103 inhibits mitochondrial complex II activity. Exposure of cells to H2O2 (500 μmol/L, 10 minutes) decreased complex II activity, measured as per Figure 4, in HEK 293T cells. SDHB in which Cys100Ser (C100S), Cys103Ser (C103S), or Cys115Ser (C115S) was mutated to a redox‐insensitive serine was expressed in HEK 293T cells, and complex II activity was measured after exposure to H2O2. A, H2O2 decreased complex II activity in HEK cells transfected with empty vector (CTRL), and activity was restored after incubation of cell lysate with dithiothreitol (DTT; 5 mmol/L). B, Expression of the SDHB C100S mutant prevents the H2O2‐mediated decrease in complex II activity. C, Expression of the SDHB C103S mutant prevents the H2O2‐mediated decrease in complex II activity. D, Expression of the SDHB C115S mutant has no effect on the H2O2‐mediated decrease in complex II activity. Values are mean±SEM; n=5; **P<0.01 vs CTRL; ## P<0.01 vs CTRL+H2O2; ### P<0.001 vs CTRL+H2O2.
To further assess the relevance of the effects of H2O2 on complex II activity, HEK‐293T cells were incubated in media containing high concentrations of glucose (25 mmol/L) and palmitate (0.4 mmol/L). As with H2O2, there was an ≈60% decrease in complex II activity, which was fully reversed by DTT exposure ex vivo (Figure 7A). As with H2O2, the HGHP‐mediated decrease in complex II activity was prevented in cells expressing the Cys100Ser and Cys103Ser mutants but not Cys115Ser mutant (Figure 7B through 7D).
Figure 7.
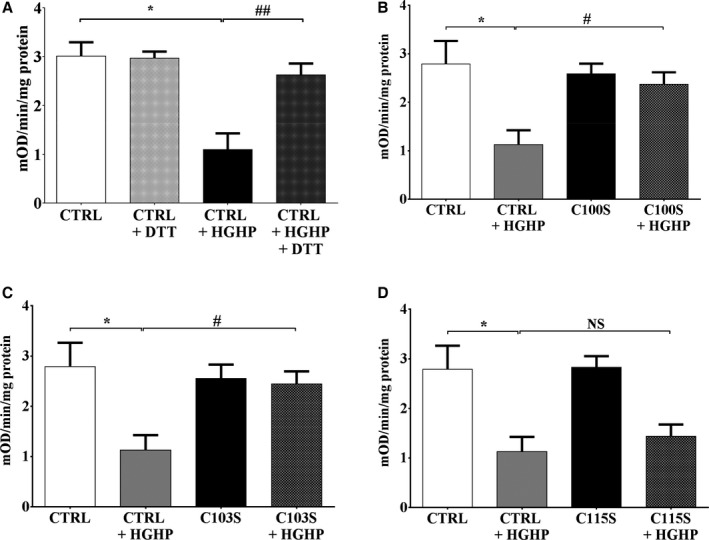
Oxidation of succinate dehydrogenase B (SDHB) Cys100 and Cys103 inhibits mitochondrial complex II activity. Exposure of cells to high‐glucose/high‐palmitate (HGHP) media (14 hours) decreased complex II activity, measured as per Figure 4, in HEK 293T cells. SDHB in which Cys100Ser (C100S), Cys103Ser (C103S), or Cys115Ser (C115S) was mutated to a redox‐insensitive serine was expressed in HEK 293T cells, and complex II activity was measured after exposure to HGHP media. A, HGHP treatment decreased complex II activity in HEK cells transfected with empty vector (CTRL), and activity was restored after incubation of cell lysate with dithiothreitol (DTT; 5 mmol/L). B, Expression of the SDHB C100S mutant prevents the HGHP‐mediated decrease in complex II activity. C, Expression of the SDHB C103S mutant prevents the HGHP‐mediated decrease in complex II activity. D, Expression of the SDHB C115S mutant has no effect on the HGHP‐mediated decrease in complex II activity. Values are mean±SEM; n=3 to 4; *P<0.05 vs CTRL; # P<0.05 vs CTRL+HGHP; ## P<0.01 vs CTRL+HGHP.
mCAT Prevents HFHS Diet–Mediated LV Hypertrophy and Diastolic Dysfunction
As we previously observed,8 WT mice fed an HFHS diet developed LV hypertrophy as reflected by increased LV weight/tibia length (Table) and increased LV wall thickness (Table; Figure 8A). The HFHS diet–induced increase in LV wall thickness in WT mice (0.27±0.02 mm) was less in mCAT mice (0.09±0.008 mm; P<0.01 versus WT HFHS) (Figure 8A). Likewise, although the heart weight tends to be increased in mCAT mice (versus WT) on the CD, the HFHF diet‐induced increase in LV weight/tibia length in WT mice (1.6±0.07 mg/mm) was less in mCAT mice (0.5±0.03 mg/mm; P<0.01 versus WT HFHS).
Table 1.
Body and Organ Weights and Echocardiographic Parameters
| WT/CD | WT/HFHS | mCAT/CD | mCAT/HFHS | |
|---|---|---|---|---|
| Body and organ weights | ||||
| Body weight, g | 29.5±3.1 | 47.5±1.0* | 29.5±4.2 | 46.9±2.5† |
| Heart weight, mg | 116.5±4.0 | 144.6±7.4* | 131.6±13.0 | 151.3±12.7 |
| Tibia length, mm | 18.2±0.4 | 17.9±0.1 | 17.7±0.3 | 18.0±0.3 |
| Heart weight/body weight, mg/g | 4.12±0.37 | 3.05±0.13 | 4.56±0.24 | 3.22±0.16† |
| Heart weight/tibia length, mg/mm | 6.5±0.3 | 8.1±0.4* | 7.4±0.6 | 7.9±0.5 |
| Echocardiographic measurements | ||||
| LV EDD | 2.87±0.03 | 2.93±0.03 | 2.90±0.06 | 3.08±0.04 |
| LV ESD | 1.17±0.02 | 1.20±0.01 | 1.15±0.03 | 1.24±0.02 |
| FS | 59.5±0.3 | 59.4±0.6 | 60.5±0.5 | 60.0±0.5 |
| TWT | 1.53±0.04 | 1.80±0.06* | 1.50±0.04 | 1.59±0.06‡ |
| E/A | 1.66±0.04 | 1.24±0.07§ | 1.74±0.06 | 1.82±0.07׀׀ |
| Em | 25.6±0.8 | 17.9±0.9§ | 26.0±0.7 | 25.1±0.3׀׀ |
| E/Em | 28.8±0.8 | 43.8±2.0** | 28.8±2.8 | 32.8±1.0## |
Values are mean±SEM; n=4 to 7. CD indicates control diet; E/A, ratio of early‐to‐late diastolic mitral inflow velocity; E/Em, ratio of peak early mitral inflow velocity to myocardial peak early diastolic velocity; EDD, end‐diastolic dimension; Em, myocardial peak early diastolic velocity; ESD, end‐systolic dimension; FS, fractional shortening; HFHS, high‐fat high‐sucrose diet; LV, left ventricular; mCAT, mitochondrial catalase; TWT, total wall thickness; WT, wild‐type.
*P<0.01 vs WT CD; † P<0.01 vs mCAT CD; ‡ P<0.05 vs WT HFHS; § P<0.001 vs WT/CD; ׀׀ P<0.005 vs WT HFHS.
Figure 8.
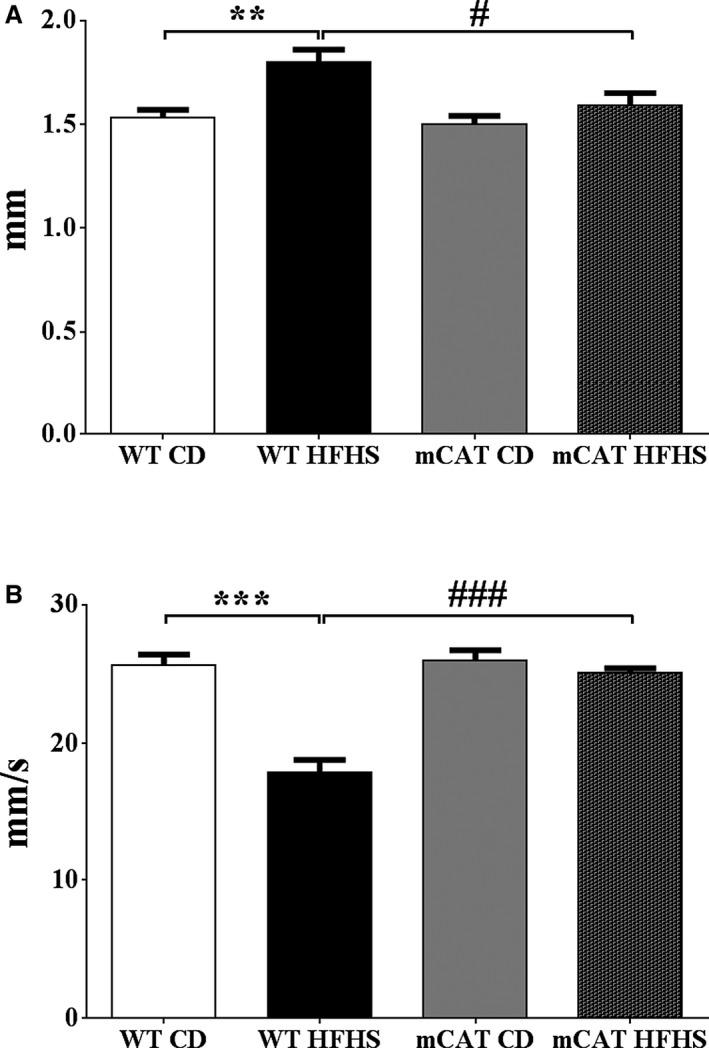
Left ventricular hypertrophy and diastolic dysfunction induced by high‐fat high‐sucrose (HFHS) diet feeding for 4 months is prevented in mitochondrial catalase (mCAT) mice. A, Total wall thickness. B, Myocardial peak early diastolic velocity (Em). Values are mean±SEM; n=4 to 5; **P<0.01 vs wild‐type (WT) control diet (CD); ***P<0.001 vs WT CD; # P<0.05 vs WT HFHS; ### P<0.001 vs WT HFHS.
While systolic function was preserved in HFHS‐fed mice, there was LV diastolic dysfunction as assessed by both transmitral flow velocity (E/A; Table) and myocardial peak early diastolic velocity (Em; Table; Figure 8B). The HFHS diet‐induced decreases in both E/A and Em were prevented in mCAT mice (Table; Figure 8B). Thus, in mCAT mice the structural and functional effects of HFHS feeding were ameliorated.
Discussion
In the present study we show that in mice with diet‐induced obesity mitochondrial ROS impair mitochondrial electron transport via irreversible OPTMs of complex I and reversible cysteine OPTMs of complex II. We further demonstrate that reversible oxidation of complex II subunit B Cys100 and Cys103, for which we previously identified OPTMs in HFHS‐fed mice,9 causes reversible inhibition of enzyme activity. Finally, we show that in HFHS‐fed mice scavenging mitochondrial ROS inhibits cardiac hypertrophy and improves diastolic function.
HFHS Feeding Causes Irreversible Inhibition of Complex I and Reversible Inhibition of Complex II
We previously showed that HFHS feeding for 8 months caused inhibition of complex I that was not reversed by DTT ex vivo.9 In contrast, inhibition of complex II was partially reversed by DTT ex vivo and associated with reversible cysteine OPTMs as identified by iodoacetamide‐based cysteine‐reactive tandem mass tag labeling10 and with a biotin switch assay.9, 18 In the present study, mice were fed the HFHS diet for only 4 months, which resulted in mitochondrial dysfunction and a cardiac phenotype that was similar to that observed at 8 months except that the inhibition of complex II at 4 months was fully reversible ex vivo by DTT but only partially reversible at 8 months.9 As with HFHS feeding for 8 months, there was no change in the expression of electron transport chain proteins. Taken together, these observations suggest that complex II dysfunction with HFHS feeding is caused initially (eg, 4 months) by ≥1 reversible cysteine OPTM. With more prolonged exposure (eg, 8 months) to HFHS diet, this reversible OPTM may be superseded by irreversible and/or noncysteine OPTMs.
mCAT Prevents HFHS‐Induced Complex I and II Dysfunction
HFHS‐induced dysfunction of both complexes I and II, as reflected by respiration and ATP production, was completely prevented by mCAT in vivo, and subsequent exposure to DTT ex vivo had no further effect. Based on the ability of mCAT to protect mitochondrial function, we conclude that ROS play an important role in mediating mitochondrial dysfunction in this model of MHD.
We cannot determine the relative contributions of complex I and II OPTMs to overall mitochondrial dysfunction, nor can we exclude a role for OPTMs of other proteins involved in electron transport chain function. For example, complex V is inhibited by glutathiolation in the setting of chronic heart failure.19 However, because DTT did not increase complex I substrate–mediated ATP production, which also requires complex V, the effects of DTT and mCAT are unlikely to be caused by increased complex V activity. Likewise, although uncoupling protein 3 can be regulated by oxidative cysteine modification,20 we found that proton leak‐driven respiration for both complex I and complex II was decreased in HFHS‐fed mice and restored by mCAT. Thus, in contrast to genetic models of obesity and/or diabetes (ob/ob and db/db mice),21, 22 uncoupling does not play a major role in HFHS‐fed mice.
The mCAT mouse used in this study is also protected from the cardiac effects of aortic constriction23 and aging.11 In mice with reduced expression of mitofusin II, mitochondrial function and cardiac phenotype were also improved by mCAT expression sufficient to normalize mitochondrial ROS, although supersuppression of mitochondrial ROS by a higher level of mCAT was deleterious.24 In this regard, the beneficial effects of mCAT on mitochondrial function in the present study were associated with normalization of mitochondrial ROS measured ex vivo in isolated mitochondria. While this observation suggests that mitochondrial ROS are suppressed in the mCAT mouse, it does not allow conclusions about the extent of its suppression in vivo.
Cysteine OPTM Inhibit Complex II Function
Complex II, which couples the oxidation of succinate to fumarate in the matrix with the reduction of ubiquinone in the membrane,25 consists of 4 nuclear‐encoded proteins—SDH subunits A, B, C, and D. SDHA and SDHB are exposed to the matrix, while SDHC and SDHD are in the inner membrane.26 To evaluate the role of cysteine OPTM in regulating complex II function, we used HEK‐293 cells in culture. In this system, exposure to both H2O2 and high concentrations of glucose and palmitate in the media inhibited complex II activity, and importantly, the inhibition was reversed by the subsequent ex vivo addition of DTT, thus replicating the ability of DTT to restore complex II function in mitochondria from HFHS‐fed mice. We previously identified Cys100, Cys103, and Cys115 in SDHB as undergoing reversible oxidative modification in HFHS‐fed mice.9 While the functional significance of these OPTM is not known, all 3 of these cysteines are components of the 2Fe‐2S iron–sulfur cluster, which is critical for enzyme activity.27
The cysteine‐to‐serine mutation of either Cys100 or Cys103 fully protected complex II from the H2O2‐induced decrease in activity in HEK cells. In contrast, mutation of Cys115 to serine had no effect. Given the roles of Cys100 and Cys103 in the complex II iron–sulfur cluster, it is likely that their oxidative modification leads to changes in conformation of the cluster that affect its ability to bind iron and/or participate in electron transfer. To our knowledge, this is the first demonstration that Cys100 and Cys103 play a critical role in redox regulation of complex II function. Incubation in HGHP medium caused inhibition of complex II activity, was reversed by ex vivo exposure to DTT and was prevented in cells overexpressing the Cys100 and Cys103 mutants—thus replicating the effects of H2O2. This observation in an in vitro model of nutrient excess thus supports the relevance of this mechanism to the mitochondrial dysfunction we observed in HFHS‐fed mice.
Of note, mutations of some, but not all, cysteines involved in the iron–sulfur cluster of fumarate reductase, an enzyme that is related to SDH, decreased enzyme activity and altered growth in bacteria.27 We previously observed reversible oxidation of SDHA Cys89 in HFHS‐fed mice.9 However, S‐glutathiolation of rat SDHA at Cys90 (Cys89 in the mouse proteome) increases complex II activity,28 and therefore is not likely to be the cause of decreased complex II activity with HFHS feeding.
A limitation of this study is that it does not address the relative importance of impaired complex II activity in mediating overall mitochondrial dysfunction in this model. The importance of complex II for cardiac function has been well established under conditions of ischemia–reperfusion, where succinate accumulation drives increased mitochondrial ROS,29 and in human genetic cardiomyopathies resulting from complex II deficiency.30 Modeling of succinate dehydrogenase flux supports the notion of its important contribution to cardiac ATP generation.31 Additionally, while pyruvate levels are not thought to be increased in cardiac hypertrophy, succinate is increased, suggesting that its use may be increased.32
Mitochondrial ROS Mediate Cardiac Dysfunction in Obesity‐Related MHD
Our observation of increased mitochondrial ROS production with an HFHS diet is consistent with several prior reports.5, 33, 34, 35 A possible role for ROS in mediating myocardial hypertrophy and diastolic dysfunction with HFHS feeding was raised by our initial study in which polyphenols effectively prevented the cardiac phenotype.8 However, polyphenols have pleiotropic actions that preclude this conclusion. In the present study, mCAT inhibited the HFHS feeding–associated development of LV hypertrophy and largely prevented diastolic dysfunction. Heart size assessed as heart weight normalized to tibia length or LV wall thickness by echocardiography tended to be larger in mCAT (versus WT mice) fed the CD. However, the HFHS‐induced increases in both heart weight and wall thickness were decreased in mCAT (versus WT) mice. Likewise, HFHS diet–induced LV diastolic dysfunction was improved in mCAT (versus WT) mice as assessed by both transmitral and tissue Doppler examinations. These finding, taken together with the demonstration that mitochondrial ROS production is increased with HFHS feeding, suggests that mitochondrial ROS plays a key role in mediating these key aspects of the cardiac phenotype in MHD.
The mechanism by which mitochondrial ROS mediate LV hypertrophy and diastolic dysfunction in HFHS‐fed mice remains to be determined (Figure 9). It is possible that the mitochondrial effects of ROS shown here contribute to diastolic dysfunction by decreasing the supply of ATP necessary for sarcoplasmic reticulum Ca2+‐ATPase–mediated reuptake of calcium into the sarcoplasmic reticulum.36 Because H2O2 is freely permeable through biologic membranes, mitochondrial ROS may also mediate LV structure and function via extramitochondrial signaling cascades that could affect multiple targets and pathways involved in the regulation of myocyte growth, fibrosis, and excitation–contraction coupling.23, 24, 37, 38 In addition, mCAT mice are protected from insulin resistance induced by a high‐fat diet,39 which might correct the delivery of energy substrates. Our findings suggest that these features of cardiac phenotype exhibit a plasticity that is mediated by diet‐related metabolic factors and that may be ameliorated by dietary intervention.
Figure 9.
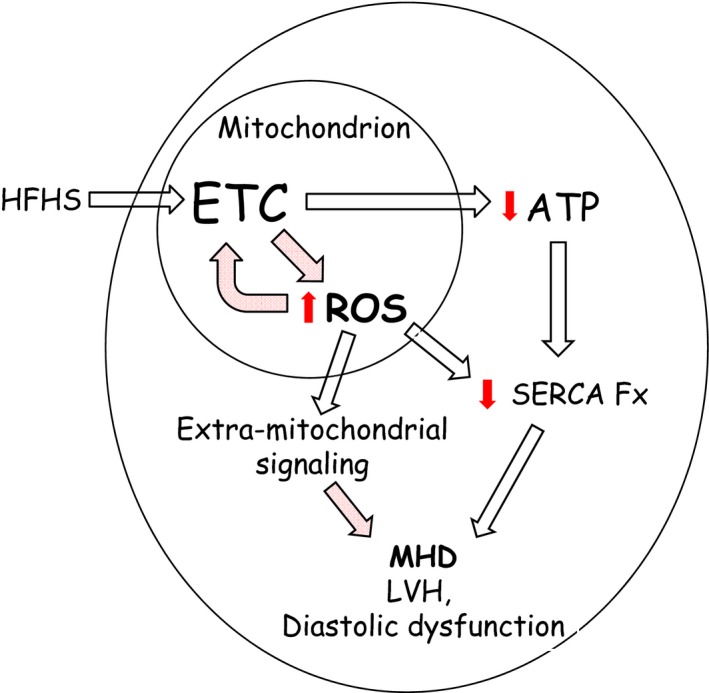
Schematic overview of the adverse effects of a high‐fat high‐sucrose (HFHS) diet on mitochondrial and cardiac function. HFHS diet feeding was associated with impaired ATP production and increased reactive oxygen species (ROS) generation in cardiac mitochondria. Decreased ATP production may contribute to diastolic dysfunction by limiting the function of highly ATP‐dependent enzymes such as sarcoplasmic reticulum Ca2+ ATPase (SERCA) that are needed for normal diastolic calcium homeostasis. ROS may also trigger multiple extramitochondrial signaling cascades involved in myocyte hypertrophy and the regulation of diastolic function.
Conclusion
Catalase targeted to the mitochondria ameliorated both mitochondrial dysfunction and the cardiac phenotype (LV hypertrophy and diastolic dysfunction) caused by HFHS feeding. These structural and functional effects were associated with protection of complexes I and II from OPTMs, including reversible OPTMs of complex II that mediate complex II dysfunction in vitro. In this regard, we identified 2 cysteines in SDHB (Cys100 and Cys103) that regulate complex II function in a redox‐dependent manner. These findings suggest that efforts to decrease mitochondrial ROS or their effects on target proteins may be of value in the therapy of MHD.
Sources of Funding
This work was supported by National Institutes of Health grants HL‐064750 (Dr Colucci), HL031607 (Dr Cohen), and 1R01DK103750 (Dr Bachschmid) and the National Heart, Lung, and Blood Institute–sponsored Boston University Cardiovascular Proteomics Center (contract No. N01‐HV‐28178, Drs Cohen and Colucci). Dr Sverdlov was funded by a C.J. Martin Fellowship from the National Health and Medical Research Council of Australia (APP1037603), the Marjorie Hooper Overseas Fellowship from the Royal Australasian College of Physicians, and American Heart Association Postdoctoral Fellowship (14POST20490003). Dr Luptak is the recipient of an American Heart Association Fellow‐to‐Faculty Award (15FTF25890062).
Disclosures
None.
Supporting information
Table S1. Composition of High‐Fat High‐Sucrose (HFHS) and Control Diets. D09071702 is HFHS diet and D09071703 is control diet.
Table S2. Expression of Informative Subunits From Each of the 5 Electron Transport Chain Complexes as Measured by Immunoblotting
Figure S1. Both wild‐type and mitochondrial catalase (mCAT) mice on high‐fat high‐sucrose (HFHS) diet exhibit the same degree of total body weight gain (n=4 to 5 per group).
Figure S2. Respiratory control ratios (RCR) obtained during oxygen consumption measurements. High‐fat high‐sucrose (HFHS) diet had no effect on RCR values (obtained by dividing state III by state IV oxygen consumption).
Figure S3. Exposure to the reducing agent dithiothreitol (DTT, 5 mmol/L) ex vivo corrects ATP synthesis for complex II, but not complex I, substrates. A, Complex I substrate–driven ATP synthesis rate (5 mmol/L pyruvate+5 mmol/L malate). B, Complex II substrate–driven ATP synthesis rate (5 mmol/L succinate+2 μmol/L rotenone). Values are mean±SEM; n=4 to 5; # P<0.05 vs WT high‐fat high‐sucrose (HFHS) diet.
Figure S4. Neither complex I nor Complex II substrate‐driven ATP synthesis rates in cardiac mitochondria from mitochondrial catalase (mCAT) mice fed a high‐fat high‐sucrose (HFHS) diet are effected ex‐vivo by DTT (5 mmol/L). A, Complex I substrate‐driven ATP synthesis rate (5 mmol/L pyruvate+5 mmol/L malate); (B) Complex II substrate‐driven ATP synthesis rate (5 mmol/L succinate+2 μmol/L rotenone).
(J Am Heart Assoc. 2016;5:e002555 doi: 10.1161/JAHA.115.002555)
Accompanying Tables S1 and S2 and Figures S1 through S4 are available at http://jaha.ahajournals.org/content/5/1/e002555/suppl/DC1
References
- 1. Heidenreich PA, Albert NM, Allen LA, Bluemke DA, Butler J, Fonarow GC, Ikonomidis JS, Khavjou O, Konstam MA, Maddox TM, Nichol G, Pham M, Pina IL, Trogdon JG; American Heart Association Advocacy Coordinating C, Council on Arteriosclerosis T, Vascular B, Council on Cardiovascular R, Intervention, Council on Clinical C, Council on E, Prevention, Stroke C . Forecasting the impact of heart failure in the United States: a policy statement from the American Heart Association. Circ Heart Fail. 2013;6:606–619. [DOI] [PMC free article] [PubMed] [Google Scholar]
- 2. Main ML, Rao SC, O'Keefe JH. Trends in obesity and extreme obesity among US adults. JAMA. 2010;303:1695; author reply 1695‐1696. [DOI] [PubMed] [Google Scholar]
- 3. Thomas DM, Weedermann M, Fuemmeler BF, Martin CK, Dhurandhar NV, Bredlau C, Heymsfield SB, Ravussin E, Bouchard C. Dynamic model predicting overweight, obesity, and extreme obesity prevalence trends. Obesity (Silver Spring). 2014;22:590–597. [DOI] [PMC free article] [PubMed] [Google Scholar]
- 4. Ayalon N, Gopal DM, Mooney DM, Simonetti JS, Grossman JR, Dwivedi A, Donohue C, Perez AJ, Downing J, Gokce N, Miller EJ, Liang CS, Apovian CM, Colucci WS, Ho JE. Preclinical left ventricular diastolic dysfunction in metabolic syndrome. Am J Cardiol. 2014;114:838–842. [DOI] [PMC free article] [PubMed] [Google Scholar]
- 5. Bugger H, Abel ED. Molecular mechanisms of diabetic cardiomyopathy. Diabetologia. 2014;57:660–671. [DOI] [PMC free article] [PubMed] [Google Scholar]
- 6. Huynh K, Bernardo BC, McMullen JR, Ritchie RH. Diabetic cardiomyopathy: mechanisms and new treatment strategies targeting antioxidant signaling pathways. Pharmacol Ther. 2014;142:375–415. [DOI] [PubMed] [Google Scholar]
- 7. Scheuermann‐Freestone M, Madsen PL, Manners D, Blamire AM, Buckingham RE, Styles P, Radda GK, Neubauer S, Clarke K. Abnormal cardiac and skeletal muscle energy metabolism in patients with type 2 diabetes. Circulation. 2003;107:3040–3046. [DOI] [PubMed] [Google Scholar]
- 8. Qin F, Siwik DA, Luptak I, Hou X, Wang L, Higuchi A, Weisbrod RM, Ouchi N, Tu VH, Calamaras TD, Miller EJ, Verbeuren TJ, Walsh K, Cohen RA, Colucci WS. The polyphenols resveratrol and S17834 prevent the structural and functional sequelae of diet‐induced metabolic heart disease in mice. Circulation. 2012;125:1757–1764, S1751–1756. [DOI] [PMC free article] [PubMed] [Google Scholar]
- 9. Sverdlov AL, Elezaby A, Behring JB, Bachschmid MM, Luptak I, Tu VH, Siwik DA, Miller EJ, Liesa M, Shirihai OS, Pimentel DR, Cohen RA, Colucci WS. High fat, high sucrose diet causes cardiac mitochondrial dysfunction due in part to oxidative post‐translational modification of mitochondrial complex II. J Mol Cell Cardiol. 2015;78:165–173. [DOI] [PMC free article] [PubMed] [Google Scholar]
- 10. Behring JB, Kumar V, Whelan SA, Chauhan P, Siwik DA, Costello CE, Colucci WS, Cohen RA, McComb ME, Bachschmid MM. Does reversible cysteine oxidation link the western diet to cardiac dysfunction? FASEB J. 2014;28:1975–1987. [DOI] [PMC free article] [PubMed] [Google Scholar]
- 11. Schriner SE, Linford NJ, Martin GM, Treuting P, Ogburn CE, Emond M, Coskun PE, Ladiges W, Wolf N, Van Remmen H, Wallace DC, Rabinovitch PS. Extension of murine life span by overexpression of catalase targeted to mitochondria. Science. 2005;308:1909–1911. [DOI] [PubMed] [Google Scholar]
- 12. Weisbrod RM, Shiang T, Al Sayah L, Fry JL, Bajpai S, Reinhart‐King CA, Lob HE, Santhanam L, Mitchell G, Cohen RA, Seta F. Arterial stiffening precedes systolic hypertension in diet‐induced obesity. Hypertension. 2013;62:1105–1110. [DOI] [PMC free article] [PubMed] [Google Scholar]
- 13. Schaefer A, Klein G, Brand B, Lippolt P, Drexler H, Meyer GP. Evaluation of left ventricular diastolic function by pulsed Doppler tissue imaging in mice. J Am Soc Echocardiogr. 2003;16:1144–1149. [DOI] [PubMed] [Google Scholar]
- 14. Elezaby A, Sverdlov AL, Tu VH, Soni K, Luptak I, Qin F, Liesa M, Shirihai OS, Rimer J, Schaffer JE, Wilson SC, Edward JM. Mitochondrial remodeling in mice with cardiomyocyte‐specific lipid overload. J Mol Cell Cardiol. 2015;79:275–283. [DOI] [PMC free article] [PubMed] [Google Scholar]
- 15. Liesa M, Luptak I, Qin F, Hyde BB, Sahin E, Siwik DA, Zhu Z, Pimentel DR, Xu XJ, Ruderman NB, Huffman KD, Doctrow SR, Richey L, Colucci WS, Shirihai OS. Mitochondrial transporter ATP binding cassette mitochondrial erythroid is a novel gene required for cardiac recovery after ischemia/reperfusion. Circulation. 2011;124:806–813. [DOI] [PMC free article] [PubMed] [Google Scholar]
- 16. Sahin E, Colla S, Liesa M, Moslehi J, Muller FL, Guo M, Cooper M, Kotton D, Fabian AJ, Walkey C, Maser RS, Tonon G, Foerster F, Xiong R, Wang YA, Shukla SA, Jaskelioff M, Martin ES, Heffernan TP, Protopopov A, Ivanova E, Mahoney JE, Kost‐Alimova M, Perry SR, Bronson R, Liao R, Mulligan R, Shirihai OS, Chin L, DePinho RA. Telomere dysfunction induces metabolic and mitochondrial compromise. Nature. 2011;470:359–365. [DOI] [PMC free article] [PubMed] [Google Scholar]
- 17. Shao D, Fry JL, Han J, Hou X, Pimentel DR, Matsui R, Cohen RA, Bachschmid MM. A redox‐resistant sirtuin‐1 mutant protects against hepatic metabolic and oxidant stress. J Biol Chem. 2014;289:7293–7306. [DOI] [PMC free article] [PubMed] [Google Scholar]
- 18. Pimentel D, Haeussler DJ, Matsui R, Burgoyne JR, Cohen RA, Bachschmid MM. Regulation of cell physiology and pathology by protein S‐glutathionylation: lessons learned from the cardiovascular system. Antioxid Redox Signal. 2012;16:524–542. [DOI] [PMC free article] [PubMed] [Google Scholar]
- 19. Wang SB, Foster DB, Rucker J, O'Rourke B, Kass DA, Van Eyk JE. Redox regulation of mitochondrial ATP synthase: implications for cardiac resynchronization therapy. Circ Res. 2011;109:750–757. [DOI] [PMC free article] [PubMed] [Google Scholar]
- 20. Mailloux RJ, Seifert EL, Bouillaud F, Aguer C, Collins S, Harper ME. Glutathionylation acts as a control switch for uncoupling proteins UCP2 and UCP3. J Biol Chem. 2011;286:21865–21875. [DOI] [PMC free article] [PubMed] [Google Scholar]
- 21. Boudina S, Sena S, O'Neill BT, Tathireddy P, Young ME, Abel ED. Reduced mitochondrial oxidative capacity and increased mitochondrial uncoupling impair myocardial energetics in obesity. Circulation. 2005;112:2686–2695. [DOI] [PubMed] [Google Scholar]
- 22. Boudina S, Sena S, Theobald H, Sheng X, Wright JJ, Hu XX, Aziz S, Johnson JI, Bugger H, Zaha VG, Abel ED. Mitochondrial energetics in the heart in obesity‐related diabetes: direct evidence for increased uncoupled respiration and activation of uncoupling proteins. Diabetes. 2007;56:2457–2466. [DOI] [PubMed] [Google Scholar]
- 23. Dai DF, Hsieh EJ, Liu Y, Chen T, Beyer RP, Chin MT, MacCoss MJ, Rabinovitch PS. Mitochondrial proteome remodelling in pressure overload‐induced heart failure: the role of mitochondrial oxidative stress. Cardiovasc Res. 2012;93:79–88. [DOI] [PMC free article] [PubMed] [Google Scholar]
- 24. Song M, Chen Y, Gong G, Murphy E, Rabinovitch PS, Dorn GW II. Super‐suppression of mitochondrial reactive oxygen species signaling impairs compensatory autophagy in primary mitophagic cardiomyopathy. Circ Res. 2014;115:348–353. [DOI] [PMC free article] [PubMed] [Google Scholar]
- 25. Wojtovich AP, Smith CO, Haynes CM, Nehrke KW, Brookes PS. Physiological consequences of complex II inhibition for aging, disease, and the mKATP channel. Biochim Biophys Acta. 2013;1827:598–611. [DOI] [PMC free article] [PubMed] [Google Scholar]
- 26. Yankovskaya V, Horsefield R, Tornroth S, Luna‐Chavez C, Miyoshi H, Leger C, Byrne B, Cecchini G, Iwata S. Architecture of succinate dehydrogenase and reactive oxygen species generation. Science. 2003;299:700–704. [DOI] [PubMed] [Google Scholar]
- 27. Werth MT, Cecchini G, Manodori A, Ackrell BA, Schroder I, Gunsalus RP, Johnson MK. Site‐directed mutagenesis of conserved cysteine residues in Escherichia coli fumarate reductase: modification of the spectroscopic and electrochemical properties of the [2Fe‐2S] cluster. Proc Natl Acad Sci USA. 1990;87:8965–8969. [DOI] [PMC free article] [PubMed] [Google Scholar]
- 28. Chen YR, Chen CL, Pfeiffer DR, Zweier JL. Mitochondrial complex II in the post‐ischemic heart: oxidative injury and the role of protein S‐glutathionylation. J Biol Chem. 2007;282:32640–32654. [DOI] [PubMed] [Google Scholar]
- 29. Chouchani ET, Pell VR, Gaude E, Aksentijevic D, Sundier SY, Robb EL, Logan A, Nadtochiy SM, Ord EN, Smith AC, Eyassu F, Shirley R, Hu CH, Dare AJ, James AM, Rogatti S, Hartley RC, Eaton S, Costa AS, Brookes PS, Davidson SM, Duchen MR, Saeb‐Parsy K, Shattock MJ, Robinson AJ, Work LM, Frezza C, Krieg T, Murphy MP. Ischaemic accumulation of succinate controls reperfusion injury through mitochondrial ROS. Nature. 2014;515:431–435. [DOI] [PMC free article] [PubMed] [Google Scholar]
- 30. Reichmann H, Angelini C. Single muscle fibre analyses in 2 brothers with succinate dehydrogenase deficiency. Eur Neurol. 1994;34:95–98. [DOI] [PubMed] [Google Scholar]
- 31. Smith AC, Robinson AJ. A metabolic model of the mitochondrion and its use in modelling diseases of the tricarboxylic acid cycle. BMC Syst Biol. 2011;5:102. [DOI] [PMC free article] [PubMed] [Google Scholar]
- 32. Kolwicz SC Jr, Tian R. Glucose metabolism and cardiac hypertrophy. Cardiovasc Res. 2011;90:194–201. [DOI] [PMC free article] [PubMed] [Google Scholar]
- 33. Ilkun O, Boudina S. Cardiac dysfunction and oxidative stress in the metabolic syndrome: an update on antioxidant therapies. Curr Pharm Des. 2013;19:4806–4817. [DOI] [PMC free article] [PubMed] [Google Scholar]
- 34. Mellor KM, Ritchie RH, Delbridge LM. Reactive oxygen species and insulin‐resistant cardiomyopathy. Clin Exp Pharmacol Physiol. 2010;37:222–228. [DOI] [PubMed] [Google Scholar]
- 35. Roul D, Recchia FA. Metabolic alterations induce oxidative stress in diabetic and failing hearts: different pathways, same outcome. Antioxid Redox Signal. 2015;22:1502–1514. [DOI] [PMC free article] [PubMed] [Google Scholar]
- 36. Kammermeier H. High energy phosphate of the myocardium: concentration versus free energy change. Basic Res Cardiol. 1987;82(suppl 2):31–36. [DOI] [PubMed] [Google Scholar]
- 37. Qin F, Siwik DA, Pimentel DR, Morgan RJ, Biolo A, Tu VH, Kang YJ, Cohen RA, Colucci WS. Cytosolic H2O2 mediates hypertrophy, apoptosis, and decreased SERCA activity in mice with chronic hemodynamic overload. Am J Physiol Heart Circ Physiol. 2014;306:H1453–H1463. [DOI] [PMC free article] [PubMed] [Google Scholar]
- 38. Sawyer DB, Sverdlov AL, Colucci WS. Chapter 8—oxidative stress in heart failure In: Mann DL, Felker MG, eds. Heart Failure: A Companion to Braunwald's Heart Disease. 3rd ed Philadelphia: W.B. Saunders; 2016:127–139. [Google Scholar]
- 39. Anderson EJ, Lustig ME, Boyle KE, Woodlief TL, Kane DA, Lin CT, Price JW III, Kang L, Rabinovitch PS, Szeto HH, Houmard JA, Cortright RN, Wasserman DH, Neufer PD. Mitochondrial H2O2 emission and cellular redox state link excess fat intake to insulin resistance in both rodents and humans. J Clin Invest. 2009;119:573–581. [DOI] [PMC free article] [PubMed] [Google Scholar]
Associated Data
This section collects any data citations, data availability statements, or supplementary materials included in this article.
Supplementary Materials
Table S1. Composition of High‐Fat High‐Sucrose (HFHS) and Control Diets. D09071702 is HFHS diet and D09071703 is control diet.
Table S2. Expression of Informative Subunits From Each of the 5 Electron Transport Chain Complexes as Measured by Immunoblotting
Figure S1. Both wild‐type and mitochondrial catalase (mCAT) mice on high‐fat high‐sucrose (HFHS) diet exhibit the same degree of total body weight gain (n=4 to 5 per group).
Figure S2. Respiratory control ratios (RCR) obtained during oxygen consumption measurements. High‐fat high‐sucrose (HFHS) diet had no effect on RCR values (obtained by dividing state III by state IV oxygen consumption).
Figure S3. Exposure to the reducing agent dithiothreitol (DTT, 5 mmol/L) ex vivo corrects ATP synthesis for complex II, but not complex I, substrates. A, Complex I substrate–driven ATP synthesis rate (5 mmol/L pyruvate+5 mmol/L malate). B, Complex II substrate–driven ATP synthesis rate (5 mmol/L succinate+2 μmol/L rotenone). Values are mean±SEM; n=4 to 5; # P<0.05 vs WT high‐fat high‐sucrose (HFHS) diet.
Figure S4. Neither complex I nor Complex II substrate‐driven ATP synthesis rates in cardiac mitochondria from mitochondrial catalase (mCAT) mice fed a high‐fat high‐sucrose (HFHS) diet are effected ex‐vivo by DTT (5 mmol/L). A, Complex I substrate‐driven ATP synthesis rate (5 mmol/L pyruvate+5 mmol/L malate); (B) Complex II substrate‐driven ATP synthesis rate (5 mmol/L succinate+2 μmol/L rotenone).


