

Abstract
Background
Muscle wasting during cancer cachexia contributes to patient morbidity. Cachexia‐induced muscle damage may be understood by comparing its symptoms with those of other skeletal muscle diseases, but currently available data are limited.
Methods
We modelled cancer cachexia in mice bearing Lewis lung carcinoma/colon adenocarcinoma and compared the associated muscle damage with that in a murine muscular dystrophy model (mdx mice). We measured biochemical and immunochemical parameters: amounts/localization of cytoskeletal proteins and/or Ca2+ signalling proteins related to muscle function and abnormality. We analysed intracellular Ca2+ mobilization and compared results between the two models. Involvement of Ca2+‐permeable channel transient receptor potential vanilloid 2 (TRPV2) was examined by inoculating Lewis lung carcinoma cells into transgenic mice expressing dominant‐negative TRPV2.
Results
Tumourigenesis caused loss of body and skeletal muscle weight and reduced muscle force and locomotor activity. Similar to mdx mice, cachexia muscles exhibited myolysis, reduced sarcolemmal sialic acid content, and enhanced lysosomal exocytosis and sarcolemmal localization of phosphorylated Ca2+/CaMKII. Abnormal autophagy and degradation of dystrophin also occurred. Unlike mdx muscles, cachexia muscles did not exhibit regeneration markers (centrally nucleated fibres), and levels of autophagic proteolytic pathway markers increased. While a slight accumulation of TRPV2 was observed in cachexia muscles, Ca2+ influx via TRPV2 was not elevated in cachexia‐associated myotubes, and the course of cachexia pathology was not ameliorated by dominant‐negative inhibition of TRPV2.
Conclusions
Thus, cancer cachexia may induce muscle damage through TRPV2‐independent mechanisms distinct from those in muscular dystrophy; this may help treat patients with tumour‐induced muscle wasting.
Keywords: TRPV2, transient receptor potential vanilloid type 2; DGC, dystrophin glycoprotein complex; Cancer cachexia; Muscular dystrophy; LLC, Lewis lung carcinoma
Introduction
Cancer cachexia, also known as muscle wasting syndrome, is a multifactorial syndrome characterized by progressive loss of skeletal muscle mass, fatigue, weakness, anorexia, and persistent erosion of host body cell mass, which cannot be completely reversed by conventional nutritional support and leads to progressive functional impairment.1, 2, 3, 4 Cachexia is present in up to 80% of patients with advanced cancer and in 60–80% of those diagnosed with gastrointestinal, pancreatic, and lung cancers.5 This condition causes severe fatigue and reduces mobility, leading to a loss of functional independence and reduction in overall quality of life.6 Furthermore, cachexia is associated with reduced efficacy of anti‐neoplastic treatments as well as an increased risk of post‐surgical complications and accounts for more than 20% of all cancer‐related deaths.7 Effective treatments are therefore needed to improve patient quality of life and reduce mortality. However, cancer cachexia is a complex metabolic process characterized by breakdown of skeletal muscle, and the mechanisms underlying the associated muscle wasting have remained unclear.
An important strategy to understand the reduced muscle performance caused by cancer cachexia would be to compare its symptoms with other well‐known skeletal muscle diseases. Muscular dystrophy is a well‐characterized genetic disease, and in a subset of patients, this disorder is caused by a mutation or a deletion in the gene encoding one of the compounds of the dystrophin glycoprotein complex (DGC). The DGC spans the sarcolemma to structurally link the extracellular matrix and actin cytoskeleton. The strong mechanical link mediated by the DGC protects cells from contraction‐induced injuries. Conversely, functional disruption of DGC components can induce Duchenne/Becker forms of skeletal muscle dystrophy. A previous study8 reported that tumour‐induced dysfunction in DGC occurs in cachexia, suggesting that cachexia‐induced and muscular dystrophy‐induced muscle damage might proceed via a common mechanism.
Excess Ca2+ influx across the sarcolemma causes skeletal muscle damage associated with muscular dystrophy.9, 10, 11, 12, 13, 14 We previously identified transient receptor potential vanilloid type 2 (TRPV2) as a candidate mediator of such Ca2+ influx.15 By preventing abnormal Ca2+ handling, transgenic (Tg) or adenoviral expression of dominant‐negative TRPV2 ameliorates muscle pathology in δ‐sarcoglycan‐deficient BIO14.6 hamsters and dystrophin‐deficient mdx mice, which are genetic homologs of human limb‐girdle and Duchenne forms of muscular dystrophy, respectively.16 These results demonstrated a relationship between TRPV2 activation and muscle degeneration and the therapeutic potential of targeting TRPV2 in muscular dystrophy patients. By extension, if DGC dysregulation is the common mechanism that underlies skeletal muscle damage in both cachexia and muscular dystrophy, it could be inferred that TRPV2 also plays a crucial pathological role in cachexia‐induced muscle atrophy via intracellular Ca2+‐abnormality.
In this study, we generated a cancer cachexia model in mice bearing Lewis lung carcinoma (LLC) or colon adenocarcinoma (colon‐26) and examined whether cancer cachexia and muscular dystrophy produce similar muscle damage by comparing cachexic mice and mdx mice. We also set out to determine whether TRPV2 is involved in cachexia‐induced muscle damage using transgenic mice expressing dominant‐negative TRPV2.
Methods
Materials
Dulbecco's modified Eagle's medium (DMEM) high glucose (Sigma‐Aldrich, St. Louis, MO) containing 10% foetal bovine serum, penicillin G sodium sulfate, streptomycin sulfate, and 0.05% trypsin/0.53 mM EDTA 4Na (Life Technologies, Carlsbad, CA) were used for cell culture. For immunohistochemical and immunoblotting analyses, mouse monoclonal anti‐glyceraldehyde‐3‐phosphate‐dehydrogenase, mouse monoclonal anti‐dystrophin, rabbit polyclonal anti‐neuraminidase1 (Neu1) (Sigma‐Aldrich), mouse monoclonal anti‐β‐dystroglycan (Novocastra Laboratories, Newcastle, UK), rabbit polyclonal anti‐Ca2+/calmodulin‐dependent protein kinase II (CaMKII), anti‐ganglioside neuraminidase3 (Neu3), mouse monoclonal anti‐Lysosome‐associated membrane protein 1 (Lamp1) (Santa Cruz Biotechnology, Inc., Dallas, TX), mouse monoclonal anti‐phosphorylated CaMKII (ABR, Golden, CO), mouse monoclonal anti‐neuraminidase (Neu2) (Abnova), Alexa Fluor 647 goat anti‐mouse IgG (Life Technologies), anti‐Pax‐7 antibody (Developmental Biology Hybridoma Bank), and in‐house prepared rabbit polyclonal anti‐α‐sarcoglycan and anti‐TRPV2 antibodies16 were used. For the lectin staining, biotinylated peanut agglutinin (PNA) lectin, Amaranthus caudatus lectin (ACL), and fluorescein isothiocyanate (FITC)‐PNA (Vector Laboratories, Burlingame, CA) were used according to the manufacturer's instructions. Interferon gamma (IFNγ) and Tumor necrosis factor alpha (TNFα) were obtained from R&D systems (Minneapolis, MN).
In vivo tumour studies
Eight male transgenic mice expressing the dominant‐negative TRPV2 (E604K) (DN‐Tg mice, C57/BL6J background)16 and male wild‐type mice on C57BL/6J (n = 16) or CD2F1 (Balb/c x DBA/2) (n = 10) backgrounds (Japan SLC, Hamamatsu, Japan) were used for tumour inoculation experiments. Inoculation of tumour cells was started at 10 weeks of age. The animals were individually housed in a temperature‐controlled room (19–25°C) with a diurnal 12 h light cycle and provided with tap water and standard rodent chow ad libitum (FR‐2, Funabashi Farm). All animal experiments were performed in accordance with the animal experimentation guidelines of the National Cerebral and Cardiovascular Center, Japan, and procedures were carried out in accordance with the Guide for the Care and Use of Laboratory Animals published by the US National Institutes of Health (NIH Publication, 8th Edition, 2011).
Lewis lung carcinoma cells (ATCC CRL‐1642; lung cancer cell line) and colon‐26 cells (Japanese Foundation for Cancer Research; mouse carcinoma cells) were used for transplantation to induce cancer cachexia as previously reported.17 Cells were maintained in DMEM supplemented with 10% fetal bovine serum in an incubator with a humidified atmosphere of 95% air and 5% CO2 at 37°C. Tumour cells were grown to 80% confluency, trypsinized, and resuspended in phosphate buffered saline (PBS).
DN‐Tg mice and wild‐type mice were divided into two groups (tumour‐bearing and non‐tumour‐bearing). At the beginning of the experiment, there were no significant differences in body weight between these four groups. In tumour‐bearing groups, mice were subcutaneously injected into the right thigh with LLC cells (5 × 10⁶)/PBS (100 μL) while under anesthesia induced by 50 mg/kg of pentobarbital. In non‐tumour‐bearing groups, mice were injected (subcutaneously) with PBS only. Two days after inoculation of tumour cells or PBS, body weight and food intake were measured daily until the end of the experiment. Grip strength and locomotor activity were measured on 3, 6, 10, 13, 17, 20, and 24 days after inoculation by a grip strength measuring device for small animals (GPM‐100B, Mel Quest Ltd., Toyama, Japan) and Supermex (CompACT AMS ver. 3, Muromachi Kikai, Osaka, Japan). Twenty‐four days after inoculation, all animals were sacrificed by bleeding under anesthesia induced by 50 mg/kg of pentobarbital. Skeletal muscles (right gastrocnemius and soleus muscles), epididymal and retroperitoneal fat, and tumours (only for cancer‐bearing mice) were extirpated and weighed. Throughout this paper, we refer to non‐tumour‐bearing or non‐treated mice as ‘controls’. Each control was used corresponding strain.
Muscle and serum samples for the comparative study between Lewis lung carcinoma cachexia mice and mdx mice
To compare LLC cachexia mice and mdx mice on the basis of biochemical and histochemical methods, we used serum and gastrocnemius muscle samples from four normal wild‐type C57BL/6J mice (male, 12 weeks old), four LLC‐transplanted wild‐type C57BL/6J mice (male, 12 weeks old), four DN‐Tg mice (male, 12 weeks old), and four LLC‐transplanted DN‐Tg mice (male, 12 weeks old) and mdx mice (male, 8–12 weeks old). LLC cachexia mice were prepared by the same method as mentioned in the previous text and sacrificed 2 weeks after tumour inoculation.
Histopathological analysis
Gastrocnemius muscle tissues were fixed in PBS containing 10% formalin and embedded in paraffin. Serial sections (5 µm thick) were stained with haematoxylin and eosin or Masson's trichrome for morphological analysis. To detect apoptosis, formalin‐fixed muscle fibres were TdT‐mediated dUTP Nick‐End Labeling (TUNEL)‐stained using an apoptosis detection kit (Takara Biomedical, Otsu, Japan). These samples were observed using a light microscope (Olympus BX41; Olympus, Tokyo, Japan).
Frozen muscle sections (5–6 µm thick) were immunostained with anti‐TRPV2 or anti‐dystrophin antibody, followed by further incubation with FITC‐conjugated or rhodamine‐conjugated secondary antibody, respectively.
The sugar chain properties in frozen sections were analysed by the binding of biotinylated PNA or ACL to detect muscle cell membrane damage, as described previously.18 Frozen sections were fixed in 100% ethanol for 10 min at room temperature (RT). The sections were incubated with each biotinylated lectin (10 µg/mL) for 15 min at RT. These lectins were visualized by incubating the sections with 20 µg/mL of FITC‐avidin D for 5 min at RT. Immunostained and lectin‐stained samples were observed with a confocal laser scanning microscope (FLUOVIEW FV1000, Olympus).
Cachexia‐mimetic and dystrophic myotubes
The immortalized human myogenic cell lines Hu5/KD3 (KD3), established previously from healthy muscles,19, 20, 21 and D4P4, established from human patients with Duchenne muscular dystrophy, were cultured as described previously.19 To trigger their differentiation, myogenic cells were switched from a DMEM media containing 20% foetal bovine serum to a DMEM media containing 2% horse serum and insulin–transferrin–selenium‐A, as described previously.19 At 10 days after induction of differentiation, resultant myotubes were treated with or without a combination of IFNγ (100 U/mL) and TNFα (20 ng/mL) for 24–48 h to generate cells that recapitulated the cachexia phenotype.
Ca2+ measurement
Myotubes were loaded with 4 μM fura‐2 acetoxymethyl ester for 30 min at 37°C and maintained in balanced salt solution (146 mM NaCl, 4 mM KCl, 2 mM MgCl2, 0.5 mM CaCl2, 10 mM glucose, 0.1% bovine serum albumin, and 10 mM 2‐[4‐(2‐Hydroxyethyl)‐1‐piperazinyl]ethanesulfonic Acid (HEPES)/Tris, pH 7.4); fura‐2 fluorescence was measured by a ratiometric fluorescence method using a fluorescence image processor (Aquacosmos, Hamamatsu Photonics). The excitation wavelength was alternated at 340 and 380 nm (1 Hz), and the emitted fluorescence light was detected at 510 nm. The fluorescence ratio at 340/380 nm was calculated and [Ca2+]i was determined using a K d of 135 nM for the dissociation of fura‐2/Ca2+ complex.22 Myotubes were stimulated with high Ca2+‐containing (5 mM) balanced salt solution and then 38 μM TRPV2 activator probenecide.23 All Ca2+ measurements were carried out at RT.
Immunoblotting
Immunoblotting of gastrocnemius muscle tissues was carried out as previously described.15 Briefly, after blotting, membranes were blocked with PBS containing 5% non‐fat milk and incubated with the appropriate primary and horseradish peroxidase‐conjugated secondary antibodies. The immunoblots were then visualized using an enhanced chemiluminescence detection system (GE Healthcare, Chalfont St. Giles, UK).
Serum creatine kinase activity assay
Creatine kinase (CK) activity is measured to evaluate the extent of muscle tissue damage in myopathies such as progressive Duchenne muscular dystrophy. CK activity in the serum was evaluated using an in vitro colorimetric assay kit (CK test kit; Wako Pure Chem. Co., Osaka, Japan) according to the protocol provided by the manufacturer.
Statistical analysis
After the F‐test, Student's t‐test (in cases where the F‐test did not indicate significant differences) or Aspin–Welch test (in cases where the F‐test indicated significant differences) were performed. Unless otherwise stated, data are represented as means ± standard error (SE) of at least three determinations. We used an unpaired t‐test, one‐way analysis of variance, and Dunnett's test for statistical analyses. Values of P < 0.05 were considered statistically significant.
Results
Monitoring cancer cachexia in mice with Lewis lung carcinoma xenografts
Body weight and food intake were automatically measured prior to and following inoculation of LLC. The body weight began to rapidly increase 15 days after LLC inoculation because of tumour formation (Figure 1A), while food consumption was essentially the same in control and LLC‐inoculated mice (Figure 1B). At the end of experiment, tumours were removed from tumour‐bearing mice, and the weights of tumour and the tumour‐removed bodies were separately measured. The tumour weight was 6.4 ± 0.4 g (mean ± SE, n = 8). The tumour‐free body weight of the tumour‐bearing wild‐type group was reduced compared with control groups, indicating that tumour formation resulted in an overall lean body because of cachexia (Figure 1C). In the wild‐type mice, weights of skeletal muscles such as gastrocnemius and soleus (Figure 1D and E, respectively) and epididymal and retroperitoneal fats (Figure S1A and B, respectively) in the tumour‐bearing group were significantly reduced compared with those of the control group. Concomitant with the onset of cachexia, we observed a remarkable reduction of grip force and locomotor activity in the tumour‐bearing group as compared with the control group (Figure S2); this was also the case at the end of the experiment (Figure 1F and G). Cancer cachexia was also similarly produced by inoculation of colon‐26 cells into CD2F1 mice (Balb/c x DBA/2); in this case, we used CD2F1 strain as a control.
Figure 1.
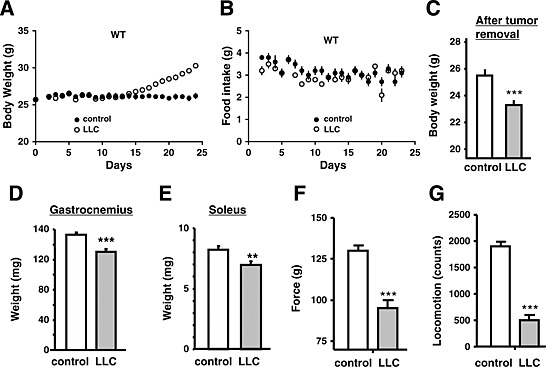
Cachexia phenotype of Lewis lung carcinoma‐bearing (LLC) mice. Time‐dependent changes in body weight (A) and food intake (B) in phosphate buffered saline (PBS) (control) or LLC‐injected mice. LLC cells (5 × 10⁶ cells) or PBS (control) were subcutaneously injected into wild‐type (WT) (n = 8) mice. The data represent the mean ± standard error. *P < 0.05, **P < 0.01, and *** P < 0.001 compared with control mice. Body weights (C), weights of gastrocnemius (D) and soleus muscles (E), grip force (F), and locomotor activity (G) in control (PBS‐injected) or LLC‐injected mice at 24 days post‐injection. In (C), tumour‐removed body weight was represented for LLC mice.
Muscle injury observed in tumour‐bearing mice
We next determined whether skeletal muscle damage occurred during cancer cachexia, and to what degree this overlapped with the muscle damage in the mdx muscular dystrophy mouse model. In contrast to mdx mice, the serum CK levels were not different between control and cancer cachexia mice (Figure 2A). We employed another more sensitive method18 using PNA and/or ACL staining, which was recently developed by us, to detect muscle damage in the mice. The PNA lectin specifically binds to non‐sialylated galactose‐(β1,3)‐N‐acetylgalactosamine (Galβ1,3GalNAc) moieties on oligosaccharide groups on glycoproteins or glycolipids, but not to sialylated sugar moieties. In contrast, another type of lectin (ACL) can interact with both sialylated and non‐sialylated forms of Galβ1,3GalNAc structures. While muscles from all groups were stained with ACL (Figure 2B, left panels), control muscles were not stained with PNA (Figure 2B, right panel), indicating that the sarcolemma of normal muscles is highly sialylated. In contrast, and similar to skeletal muscles from mdx mice, those from cancer‐bearing mice (LLC and colon‐26) were well stained with PNA (Figure 2B and C), indicating that muscles from cancer cachexia contain higher levels of non‐sialylated sugars. These data suggest that some extent of muscle injury occur during cancer cachexia.
Figure 2.
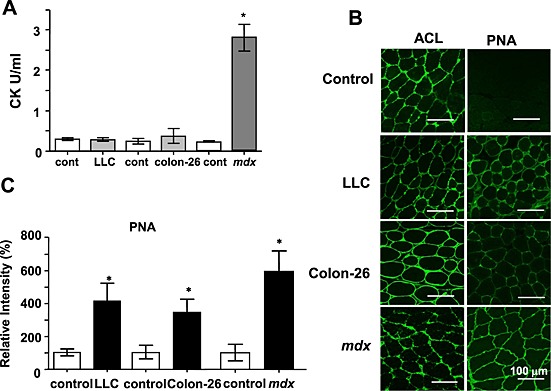
Increased peanut agglutinin (PNA) staining of cancer cachexia muscles. (A) Comparison of serum creatine kinase (CK) levels. Serum CK levels were measured in 8‐ to 12‐week‐old mice. The data represent the mean ± standard error (n = 4). * P < 0.05 compared with control mice. (B) Representative images of muscle frozen sections stained with PNA or Amaranthus caudatus lectin (ACL). Frozen sections of gastrocnemius muscles from phosphate buffered saline (control), Lewis lung carcinoma (LLC) cells (5 × 10⁶ cells), or colon‐26 cells (10 × 106 cells) injected (24 days) mice and mdx mice were stained with biotinylated PNA or ACL followed by fluorescein isothiocyanate‐avidin D. C57BL/6 data were represented as control. Scale bar, 100 µm. (C) Summarized data for PNA staining. Data indicate the mean ± standard error (n = 3–4). *P < 0.05 vs. control. The staining of tumour‐bearing or mdx mice was compared with each control mouse of the same strain.
Histopathological analysis of the gastrocnemius muscles was performed. Apparent muscle myolysis and dysgenesis were observed in some fibres of LLC or colon‐26 muscles stained with haematoxylin and eosin. However, infiltration of immune cells or centrally nucleated fibres, which were often seen in mdx muscles, were not observed (Figure 3A). Fibrosis, which was clearly seen as a blue colour in mdx muscle tissue, was not pronounced in mice bearing LLC or colon‐26 xenografts (Figure 3B). Consistent with these phenomena, expression of M‐cadherin or pax7 (markers of satellite cells) and periostin (a marker of fibrosis) were increased in mdx mice, but not in mice with cancer cachexia (Figure S3). These results suggest that unlike mdx mice, the muscle regenerative process that begins with satellite cells does not increase in cachexia mice. Although a high incidence of apoptosis was seen in the mdx mouse muscle, few TUNEL‐positive apoptotic cells were observed in the muscle of cachexia mice (data not shown). In mdx mice, in addition to dystrophin, dystrophin‐associated proteins such as α‐sarcoglycan and β‐DG were much reduced in skeletal muscles (Figure S4A). In contrast, in cachexia mice, total expression of these proteins was apparently unchanged. However, we observed that expression of dystrophin was markedly reduced in some muscle fibres from cachexia mice (Figure S4B). We analysed the muscle fibre size using photographs taken for sarcolemmal staining of the muscle sections. Detailed measurements of fibre size revealed that the median value of the cross‐sectional area of fibres was 46.3% or 24% lower in the gastrocnemius muscles from colon‐26‐bearing or LLC‐bearing mice compared with the corresponding non‐cancer‐bearing control mice (P < 0.001), respectively (Figure S5). These results show that muscle atrophy did occur, although the actual level of atrophy was small.
Figure 3.
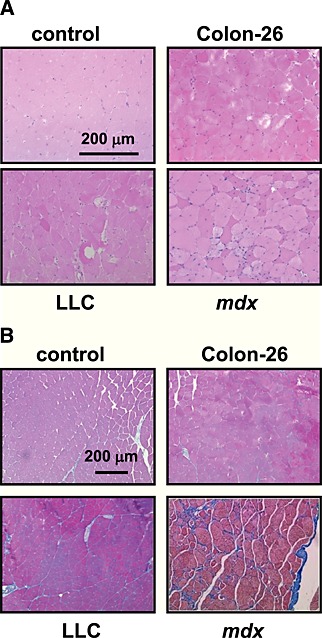
Histological features of cancer cachexia muscles. Representative images of haematoxylin and eosin staining (A) and Masson's trichrome staining (B) of gastrocnemius muscles sections from cancer‐bearing mice or mdx mice. Scale bar, 200 µm. Although C57BL/6 data were represented as control, a similar result was obtained from other control strain (CD2F1). LLC, Lewis lung carcinoma.
Transient receptor potential vanilloid 2 is concentrated in a part of fibres but not involved in skeletal muscle atrophy during cachexia
We previously reported that abnormal Ca2+‐handling via the TRPV2 ion channel was involved in muscle degeneration associated with muscular dystrophy.15 We therefore examined whether TRPV2 was also involved in muscle atrophy during cancer cachexia. In contrast to mdx mice, TRPV2 expression was not markedly elevated upon onset of cachexia (Figure 4A). However, we did observe a slight accumulation of TRPV2, particularly in the sarcolemma and intracellular vesicles of some muscle fibres, in cachexia mice. To test the functional significance of this, we utilized transgenic mice expressing a dominant‐negative form of TRPV2 (DN‐Tg), in which the activity of endogenous TRPV2 in the skeletal muscles is blocked through forming the inactive tetrameric channels.15 LLC cells were inoculated into DN‐Tg mice to induce cachexia; the tumours that developed in these mice were similar in size (7.4 ± 0.5 g, mean ± SE, n = 4) to those in wild‐type animals. We found that similar to the wild‐type mice, typical phenotypes of cancer cachexia are also observed in DN‐Tg mice, that is, decreased body weight (tumour‐free) (Figure 5A and C), decreased skeletal muscle weight (Figure 5D and E), reduced muscle force (Figures 5F and S2A), reduced locomotion (Figures 5G and S2B), and decreased weight of fat tissues (Figure S1A and B). There was no significant improvement of cachexia symptoms in LLC‐inoculated DN‐Tg mice compared with wild‐type animals.
Figure 4.
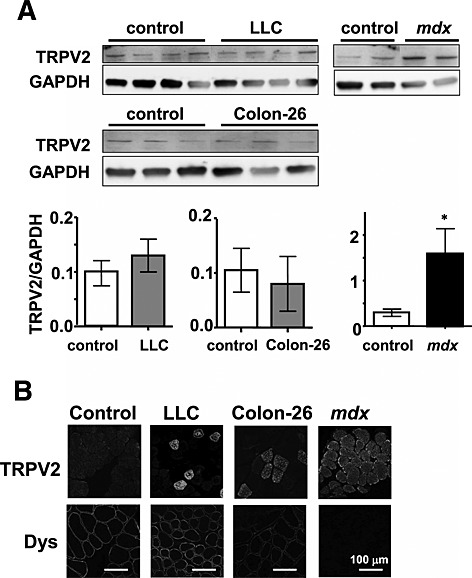
Transient receptor potential vanilloid 2 (TRPV2) expression pattern in cancer cachexia muscles. (A) Immunoblot analysis of TRPV2 and glyceraldehyde‐3‐phosphate‐dehydrogenase (GAPDH) in skeletal muscle homogenates from control, Lewis lung carcinoma (LLC), colon‐26, and mdx mice. The relative amount of TRPV2 was normalized to a GAPDH internal control. Data indicate the mean ± standard error (n = 3–4). *P < 0.05 vs. control. (B) Immunohistochemical analysis of TRPV2 and dystrophin in frozen cross sections of skeletal muscles. Double immunostaining was performed using rabbit anti‐TRPV2 and mouse anti‐dystrophin followed by fluorescein isothiocyanate‐conjugated or rhodamine‐conjugated secondary antibodies, respectively. Scale, 100 µm.
Figure 5.
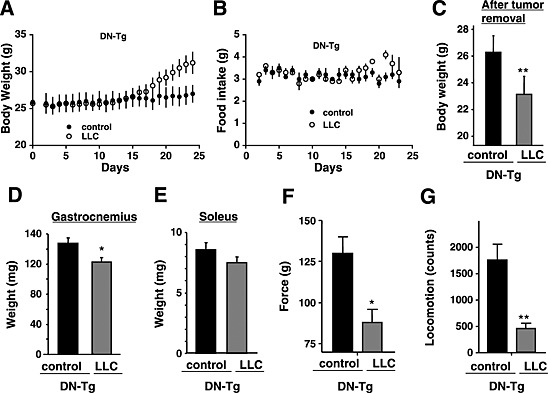
Cachexia phenotype of Lewis lung carcinoma‐bearing (LLC) transgenic mice expressing the dominant‐negative transient receptor potential vanilloid 2 (TRPV2). Time‐dependent changes in body weight (A) and food intake (B) in phosphate buffered saline (PBS) (control) or LLC‐injected mice. LLC cells (5 × 10⁶ cells) or PBS (control) were subcutaneously injected into transgenic mice expressing dominant‐negative TRPV2 (DN‐Tg) (n = 4). The data represent the mean ± standard error. *P < 0.05, **P < 0.01, and *** P < 0.001 compared with control mice. Body weights (C), weights of gastrocnemius (D) and soleus muscles (E), grip force (F), or locomotor activity (G) in control (PBS‐injected) or LLC‐injected transgenic mice expressing dominant‐negative TRPV2 (DN‐Tg) at 24 days post‐injection. In (A), tumour‐removed body weight is represented for LLC‐injected DN‐Tg mice.
To further analyse the relationship between TRPV2 and Ca2+ abnormality in cachexia muscle, we used in vitro cachexia models. We exploited the finding that treatment of myotubes with IFNγ and TNFα mimics cachexia24 in order to produce mouse or human cachexia models. Myotubes produced from the immortalized human myogenic cell line (KD3) from healthy human skeletal muscle were treated for 48 h with IFNγ /IFNg /TNFα (I/T), and compared with a myopathic cell model based on myotubes derived from human Duchenne muscular dystrophy patients (D4P4). Although dystrophin was detected in the sarcolemma of I/T‐treated KD3 myotubes (Figure S6A), its level was slightly decreased (Figure S6B). The expression of myosin heavy chain was also decreased (Figure S6B), probably owing to some myolysis in I/T‐treated KD3 myotubes. While TRPV2 was highly localized in the sarcolemma of D4P4 myotubes, such a membrane accumulation of TRPV2 was virtually absent in I/T‐induced KD3 myotubes (Figure S6A).
Next, we measured the intracellular Ca2+ response in these myotubes. Because human TRPV2 is refractory to the commonly used activator 2‐APB,25, 26 we used probenecid to activate TRPV2 following stimulation of myotubes with high Ca2+ and hypo‐osmotic stressor. When D4P4 mytotubes were perfused with high Ca2+‐containing medium and then 70% hypo‐osmotic medium, the cytosolic [Ca2+]i was slightly increased (Figure S6C, right panel). Thereafter, probenecid treatment massively increased [Ca2+]i, which was almost completely inhibited by the TRPV2 inhibitor tranilast (Figure S6C and D). In contrast, these treatments did not induce such large [Ca2+]i increases in control and I/T‐induced KD3 myotubes (Figure S6C and D). Similar results were seen in mouse cell models (data not shown).
Comparison of additional phenotypes in cachexia and dystrophic muscles
Because we excluded a role for TRPV2, we decided to examine the expression of several other signalling proteins that are implicated in muscle pathologies. Because activation of CaMKII is a critical event in Ca2+‐induced muscle dysgenesis,16 we evaluated the levels of phosphorylated CaMKII, using immunoblot analysis with antibody against phosphorylated CaMKII. In contrast to the marked increase of CaMKII phosphorylation in mdx muscles, there was no significant increase in muscle tissue of mice with LLC or colon‐26‐induced cachexia (Figure S7A). CaMKII was intracellularly localized in all types of myotubes (Figure S7B, lower panels). Interestingly, a major fraction of phosphorylated CaMKII was localized to the sarcolemma of both cachexia and mdx mice (Figure S7B, upper panels), suggesting that its activation in the subsarcolemmal space is common in these muscles.
In addition to aberrant Ca2+ handling, autophagy is a hallmark of cancer cachexia reportedly.27 Small ubiquitin‐like proteins such as microtubule‐associated protein 1 light chain 3B (LC3B) are involved in the formation of autophagosomes by fusing with lysosomes. Autophagy activation leads to conversion of the cytosolic‐soluble LC3B‐I to its lipidated autophagosome‐bound form LC3B‐II (i.e. a higher LC3B‐II/I ratio indicates an increased number of autophagosomes).28 Furthermore, the p62 protein recognizes ubiquitinated substrates and transports them to the autophagosome via its interaction with LC3B‐II.29 Although p62 can be degraded during autophagy, its levels increase with long‐term starvation or in the initial stages of autophagy.27, 30 The LC3B‐II/I ratio was increased in samples from mice with LLC‐induced cachexia but decreased in mdx mice, while p62 was increased in mice with colon‐26 cell‐induced cachexia (Figure S8).
Finally, we examined marker proteins of vesicle trafficking in cachexia muscles, because dystrophin deficiency is reported to lead to its dysregulation.31 We observed a dramatic decrease in the expression of lysosomal neuraminidase 1 (Neu1) in cancer cachexia as well as mdx skeletal muscles, which was detected by the immunoblot analysis (Figure S9A), while the expression of cytosolic neuraminidase (Neu2) and ganglioside neuraminidase (Neu3) was less affected in all cases. We found that lysosomal membrane protein, Lamp1, was clearly detected in the sarcolemma of both cachexia and mdx muscles (Figure S9B), suggesting an enhanced lysosomal exocytosis in both cases.
Discussion
Our study provides new insight into the similarities and differences of muscle wasting in two pathological states. In muscles of mice with cachexia and muscular dystrophy, some degree of myolysis was observed, and this was concomitant with a marked reduction in muscle force. Additionally, sialic acid in the sarcolemma was reduced as a consequence of muscle damage‐induced leak of cytosolic neuraminidase. At the molecular levels, phosphorylated CaMKII (the active form) was localized in the sarcolemma, and abnormal TRPV2 localization was observed. In both diseases, dysregulation of autophagy was observed, and lysosomal exocytosis was enhanced as evidenced by a reduction of lysosomal neuraminidase Neu1 and increased sarcolemmal Lamp1 localization. Finally, dystrophin was partly destroyed in some LLC‐induced cachexia muscle fibres, while it is genetically deleted in the case of mdx mice. However, there are some differences between the two mice. Unlike mdx mice, cachexia mice did not exhibit increase in serum CK level, and signs of regeneration were absent. Additionally, while changes in phospho‐CaMKII localization were evident in cachexia mice, there was no increase in its level. Another important difference is that expression of dominant‐negative TRPV2 did not improve the cachexia‐induced phenotypes, in contrast to our earlier findings in muscular dystrophy.15 Finally, molecular markers of autophagy such as LC3B‐II were induced by cachexia but were not present in mdx mice. These findings suggest that distinct mechanisms underlie cachexia‐induced and dystrophy‐induced muscle damage.
In muscular dystrophy, satellite cells are activated to proliferate, differentiate, and fuse into multinucleated myotubes in response to stress or injury.32 Mediators of this activation include insulin‐like growth factor and hepatic growth factor.33, 34 In contrast, in cancer cachexia, some humoral factors reportedly block the regeneration process. For example, TNFα was reported to induce cachexia and inhibit muscle regeneration,30 while angiotensin II was recently shown to inhibit satellite cell proliferation.35 The lack of regeneration in cachexia muscle tissue most likely exacerbates the process of atrophy. Thus, distinct compositions of circulating factors may explain the difference in the regenerative potential of satellite cells between cachexia and dystrophic muscles.
We observed that dystrophin was degraded in some muscle fibres of cachexia mice, consistent with another report.8 In muscular dystrophy, DGC dysfunction induces a mechanical weakness of the sarcolemma, which in turn results in abnormal Ca2+ influx, leading to activation of Ca2+‐dependent protease and subsequent muscle injury.10 TRPV2 is a candidate Ca2+‐permeable channel that has been implicated in such pathological process.16 Consistent with this, TRPV2 was concentrated in the sarcolemma of some muscle fibres of cachexia mice (Figure 4B). However, expression of dominant‐negative TRPV2 did not ameliorate LLC‐induced muscle wasting symptoms (Figure 5). Furthermore, in our in vitro cachexia model, expression of TRPV2 was nearly absent in the sarcolemma, and probenecid‐induced increase in [Ca2+]i was not detected (Figure S6C and D). Thus, our results suggest that abnormal Ca2+‐handling via TRPV2 plays only a minor role in cachexia‐induced membrane abnormality or atrophy.
We suggest that CaMKII may contribute to the pathology of cachexia. Although we did not observe abnormal global Ca2+ increase and/or enhanced phosphorylation (activation) of CaMKII in cachexia models, this form was relocalized to the sarcolemma of cachexia muscles, as also seen in mdx muscles. The subcellular localization of phospho‐CaMKII does change in response to various stimulants.36 For instance, in rat cardiomyocytes, CaMKII is normally exclusively located just beneath the sarcolemma but relocalizes to transverse tubules when the l‐type Ca2+ channel is activated in response to α1‐adrenargic receptor stimulation.37 This suggests that CaMKII localization may create a spatial restriction for substrate phosphorylation in concert with kinase‐anchoring proteins. Thus, CaMKII may play an important role in phosphorylating plasma membrane targets in cachexia muscles.
Furthermore, we found that the sarcolemmal sialic acid content was significantly lower in cachexia muscles, where serum CK level was not elevated in cachexia. Recently, we reported that a decrease in the sarcolemmal sialic acid caused by the action of cytosolic neuraminidase (Neu 2) (also called sialidase) released from damaged muscles is a more sensitive indicator of muscle injury.18 Our present data indicate that at least a fraction of muscle fibres is considerably membrane damaged to allow the release of neuraminidase. We propose that the muscle damage‐induced release of trace amounts of neuraminidase would be sufficient to remove sialic acids from the sarcolemma.
In addition to Neu2, which is thought to be released through damaged sarcolemma, the amount of lysosomal neuraminidase (Neu1) was markedly reduced in cachexia and mdx muscles (Figure S9A). Muscle damage likely promoted Ca2+‐induced exocytosis of lysosomes and secretion of Neu1, and thus consequently, the content of Neu1 was reduced. Although it is reported that Neu1 can work only in an acidic medium,38 the secreted Neu1 with acidic contents would function in the surface membrane near secreted vesicles. In fact, we detected the surface expression of Lamp1 and decrease of extracellular fluid pH in mouse cachexia myotubes models (unpublished observation). Genetic ablation of Neu1 results in muscle degeneration due to infiltration of muscle fibres by expanded connective tissues.39 Enhanced exocytosis of lysosomes would result in increased proteolytic activity in the extracellular fluid, leading to muscle dysgenesis. Ultimately, this would result in an atrophic phenotype in cachexia muscles.
Muscle hypertrophy and atrophy are the consequences of changes to the balance between protein synthesis and protein degradation.40 Cachexia‐induced muscle wasting is intimately linked to known proteolytic pathways, autophagy‐lysosome27, 41, 42 caspase‐dependent apoptosis,43 and Ca2+‐dependent protease calpain.44 Our data suggest that increased autophagy and exocytosis of lysosomes may be involved in cachexia‐induced muscle atrophy, while decreased autophagy may occur in muscular dystrophy.
In this study, we could not detect a significant increase in Pax7 expression in the cachectic muscles (Figure 3). A previous study demonstrated that Pax7 expression was decreased in rat cachexia models,45 whereas other studies demonstrated that Pax7 expression was up‐regulated in the cachectic muscles in both LLC and C26 tumour‐bearing mouse models as well as in cancer patients.46, 47 The specific reason for these variable results among studies remains unclear. One possibility is that the lack of an apparent change in Pax7 may indicate that our models are in the early stage of cachexia, similar to the pre‐cachectic stage in patients.48
In conclusion, we studied cancer cachexia‐induced muscle damage and compared it with that of muscular dystrophy. We detected a reduced level of sarcolemmal sialic acid (a sensitive indicator of muscle injury) in cachexia mice. In contrast to muscular dystrophy, such muscle damage was not accompanied by regenerative processes. Importantly, dominant‐negative TRPV2 was totally ineffective against cachexia, suggesting that the muscle damage in cachexia and muscular dystrophy is caused by different molecular mechanisms. Our present data provide some new molecular indicators associated with cancer cachexia and may help the development of therapeutic strategies to relieve patients of the debilitating effects of tumour‐induced muscle wasting.
Conflict of interest
Y.I., N.S., H.O., S.K., N.H., T.K., and S.W. declare that they have no conflict of interest.
Acknowledgements
The authors certify that they comply with the ethical guidelines for authorship and publishing of the Journal of Cachexia, Sarcopenia, and Muscle 2010;1:7–8 (von Haehling S, Morley JE, Coats AJ, and Anker SD).
Supporting information
Supporting info item
Acknowledgements
This work was supported by a grant‐in‐aid for Priority Areas 18077015 (to S.W.); Grants‐in‐Aid 19390080, 17659241 (to S.W.), 18590796, and 20590874 (to Y.I.); a grant for the Cooperative Link for Unique Science and Technology for Economy Revitalization (to S.W.) from the Japanese Ministry of Education, Culture, Sports, Science and Technology; a grant for the Promotion of Fundamental Studies in Health Sciences of the National Institute of Biomedical Innovation; and research grants for Cardiovascular Diseases (17A‐1; to S.W.) and Nervous and Mental Disorders (16B‐2, 19A‐7, and 22‐5; to Y.I.) from the Japanese Ministry of Health, Labour and Welfare.
Iwata, Y. , Suzuki, N. , Ohtake, H. , Kamauchi, S. , Hashimoto, N. , Kiyono, T. , and Wakabayashi, S. (2016) Cancer cachexia causes skeletal muscle damage via transient receptor potential vanilloid 2‐independent mechanisms, unlike muscular dystrophy. Journal of Cachexia, Sarcopenia and Muscle, 7: 366–376. doi: 10.1002/jcsm.12067.
References
- 1. Fearon K, Strasser F, Anker SD, Bosaeus I, Bruera E, Fainsinger RL, et al. Definition and classification of cancer cachexia: an international consensus. Lancet Oncol 2011;12:489–495. [DOI] [PubMed] [Google Scholar]
- 2. Fox KM, Brooks JM, Gandra SR, Markus R, Chiou CF. Estimation of cachexia among cancer patients based on four definitions. J Oncol 2009;2009:693458. [DOI] [PMC free article] [PubMed] [Google Scholar]
- 3. Morley JE, Thomas DR, Wilson MM. Cachexia: pathophysiology and clinical relevance. Am J Clin Nutr 2006;83:735–743. [DOI] [PubMed] [Google Scholar]
- 4. Prado CM, Lieffers JR, McCargar LJ, Reiman T, Sawyer MB, Martin L, et al. Prevalence and clinical implications of sarcopenic obesity in patients with solid tumours of the respiratory and gastrointestinal tracts: a population‐based study. Lancet Oncol 2008;9:629–635. [DOI] [PubMed] [Google Scholar]
- 5. Bruera E. ABC of palliative care. Anorexia, cachexia, and nutrition. BMJ 1997;315:1219–1222. [DOI] [PMC free article] [PubMed] [Google Scholar]
- 6. Murphy KT, Lynch GS. Update on emerging drugs for cancer cachexia. Expert Opin Emerg Drugs 2009;14:619–632. [DOI] [PubMed] [Google Scholar]
- 7. Skipworth RJ, Stewart GD, Dejong CH, Preston T, Fearon KC. Pathophysiology of cancer cachexia: much more than host–tumour interaction? Clin Nutr 2007;26:667–676. [DOI] [PubMed] [Google Scholar]
- 8. Acharyya S, Butchbach ME, Sahenk Z, Wang H, Saji M, Carathers M, et al. Dystrophin glycoprotein complex dysfunction: a regulatory link between muscular dystrophy and cancer cachexia. Cancer Cell 2005;8:421–432. [DOI] [PubMed] [Google Scholar]
- 9. Fong PY, Turner PR, Denetclaw WF, Steinhardt RA. Increased activity of calcium leak channels in myotubes of Duchenne human and mdx mouse origin. Science 1990;250:673–676. [DOI] [PubMed] [Google Scholar]
- 10. Iwata Y, Katanosaka Y, Shijun Z, Kobayashi Y, Hanada H, Shigekawa M, et al. Protective effects of Ca2+ handling drugs against abnormal Ca2+ homeostasis and cell damage in myopathic skeletal muscle cells. Biochem Pharmacol 2005;70:740–751. [DOI] [PubMed] [Google Scholar]
- 11. Mallouk N, Jacquemond V, Allard B. Elevated subsarcolemmal Ca2+ in mdx mouse skeletal muscle fibers detected with Ca2+‐activated K+ channels. Proc Natl Acad Sci U S A 2000;97:4950–4955. [DOI] [PMC free article] [PubMed] [Google Scholar]
- 12. Nakamura TY, Iwata Y, Sampaolesi M, Hanada H, Saito N, Artman M, et al. Stretch‐activated cation channels in skeletal muscle myotubes from sarcoglycan‐deficient hamsters. Am J Physiol Cell Physiol 2001;281:C690–C699. [DOI] [PubMed] [Google Scholar]
- 13. Robert V, Massimino ML, Tosello V, Marsault R, Cantini M, Sorrentino V, et al. Alteration in calcium handling at the subcellular level in mdx myotubes. J Biol Chem 2001;276:4647–4651. [DOI] [PubMed] [Google Scholar]
- 14. Vandebrouck C, Martin D, Colson‐Van Schoor M, Debaix H, Gailly P. Involvement of TRPC in the abnormal calcium influx observed in dystrophic (mdx) mouse skeletal muscle fibers. J Cell Biol 2002;158:1089–1096. [DOI] [PMC free article] [PubMed] [Google Scholar]
- 15. Iwata Y, Katanosaka Y, Arai Y, Komamura K, Miyatake K, Shigekawa M. A novel mechanism of myocyte degeneration involving the Ca2+‐permeable growth factor‐regulated channel. J Cell Biol 2003;161:957–967. [DOI] [PMC free article] [PubMed] [Google Scholar]
- 16. Iwata Y, Katanosaka Y, Arai Y, Shigekawa M, Wakabayashi S. Dominant‐negative inhibition of Ca2+ influx via TRPV2 ameliorates muscular dystrophy in animal models. Hum Mol Genet 2009;18:824–834. [DOI] [PubMed] [Google Scholar]
- 17. Das SK, Eder S, Schauer S, Diwoky C, Temmel H, Guertl B, et al. Adipose triglyceride lipase contributes to cancer‐associated cachexia. Science 2011;333:233–238. [DOI] [PubMed] [Google Scholar]
- 18. Iwata Y, Suzuki O, Wakabayashi S. Decreased surface sialic acid content is a sensitive indicator of muscle damage. Muscle Nerve 2013;47:372–378. [DOI] [PubMed] [Google Scholar]
- 19. Hashimoto N, Kiyono T, Wada MR, Shimizu S, Yasumoto S, Inagawa M. Immortalization of human myogenic progenitor cell clone retaining multipotentiality. Biochem Biophys Res Commun 2006;348:1383–1388. [DOI] [PubMed] [Google Scholar]
- 20. Hashimoto N, Kiyono T, Wada MR, Umeda R, Goto Y, Nonaka I, et al. Osteogenic properties of human myogenic progenitor cells. Mech Dev 2008;125:257–269. [DOI] [PubMed] [Google Scholar]
- 21. Shiomi K, Kiyono T, Okamura K, Uezumi M, Goto Y, Yasumoto S, et al. CDK4 and cyclin D1 allow human myogenic cells to recapture growth property without compromising differentiation potential. Gene Ther 2011;18:857–866. [DOI] [PubMed] [Google Scholar]
- 22. Grynkiewicz G, Poenie M, Tsien RY. A new generation of Ca2+ indicators with greatly improved fluorescence properties. J Biol Chem 1985;260:3440–3450. [PubMed] [Google Scholar]
- 23. Vriens J, Appendino G, Nilius B. Pharmacology of vanilloid transient receptor potential cation channels. Mol Pharmacol 2009;75:1262–1279. [DOI] [PubMed] [Google Scholar]
- 24. Acharyya S, Ladner KJ, Nelsen LL, Damrauer J, Reiser PJ, Swoap S, et al. Cancer cachexia is regulated by selective targeting of skeletal muscle gene products. J Clin Invest 2004;114:370–378. [DOI] [PMC free article] [PubMed] [Google Scholar]
- 25. Neeper MP, Liu Y, Hutchinson TL, Wang Y, Flores CM, Qin N. Activation properties of heterologously expressed mammalian TRPV2: evidence for species dependence. J Biol Chem 2007;282:15894–15902. [DOI] [PubMed] [Google Scholar]
- 26. Juvin V, Penna A, Chemin J, Lin YL, Rassendren FA. Pharmacological characterization and molecular determinants of the activation of transient receptor potential V2 channel orthologs by 2‐aminoethoxydiphenyl borate. Mol Pharmacol 2007;72:1258–1268. [DOI] [PubMed] [Google Scholar]
- 27. Penna F, Costamagna D, Pin F, Camperi A, Fanzani A, Chiarpotto EM, et al. Autophagic degradation contributes to muscle wasting in cancer cachexia. Am J Pathol 2013;182:1367–1378. [DOI] [PubMed] [Google Scholar]
- 28. Levine B, Kroemer G. Autophagy in the pathogenesis of disease. Cell 2008;132:27–42. [DOI] [PMC free article] [PubMed] [Google Scholar]
- 29. Arndt V, Dick N, Tawo R, Dreiseidler M, Wenzel D, Hesse M, et al. Chaperone‐assisted selective autophagy is essential for muscle maintenance. Curr Biol 2010;20:143–148. [DOI] [PubMed] [Google Scholar]
- 30. Sahani MH, Itakura E, Mizushima N. Expression of the autophagy substrate SQSTM1/p62 is restored during prolonged starvation depending on transcriptional upregulation and autophagy‐derived amino acids. Autophagy 2014;10:431–441. [DOI] [PMC free article] [PubMed] [Google Scholar]
- 31. Duguez S, Duddy W, Johnston H, Laine J, Le Bihan MC, Brown KJ, et al. Dystrophin deficiency leads to disturbance of LAMP1‐vesicle‐associated protein secretion. Cell Mol Life Sci 2013;70:2159–2174. [DOI] [PMC free article] [PubMed] [Google Scholar]
- 32. Shi X, Garry DJ. Muscle stem cells in development, regeneration, and disease. Genes Dev 2006;20:1692–1708. [DOI] [PubMed] [Google Scholar]
- 33. Hill M, Wernig A, Goldspink G. Muscle satellite (stem) cell activation during local tissue injury and repair. J Anat 2003;203:89–99. [DOI] [PMC free article] [PubMed] [Google Scholar]
- 34. Allen RE, Sheehan SM, Taylor RG, Kendall TL, Rice GM. Hepatocyte growth factor activates quiescent skeletal muscle satellite cells in vitro . J Cell Physiol 1995;165:307–312. [DOI] [PubMed] [Google Scholar]
- 35. Yoshida T, Galvez S, Tiwari S, Rezk BM, Semprun‐Prieto L, Higashi Y, et al. Angiotensin II inhibits satellite cell proliferation and prevents skeletal muscle regeneration. J Biol Chem 2013;288:23823–23832. [DOI] [PMC free article] [PubMed] [Google Scholar]
- 36. Schulman H. Activity‐dependent regulation of calcium/calmodulin‐dependent protein kinase II localization. J Neurosci 2004;24:8399–8403. [DOI] [PMC free article] [PubMed] [Google Scholar]
- 37. Vinogradova TM, Zhou YY, Bogdanov KY, Yang D, Kuschel M, Cheng H, et al. Sinoatrial node pacemaker activity requires Ca(2+)/calmodulin‐dependent protein kinase II activation. Circ Res 2000;87:760–767. [DOI] [PubMed] [Google Scholar]
- 38. Fanzani A, Zanola A, Faggi F, Papini N, Venerando B, Tettamanti G, et al. Implications for the mammalian sialidases in the physiopathology of skeletal muscle. Skelet Muscle 2012;2:23. [DOI] [PMC free article] [PubMed] [Google Scholar]
- 39. Zanoteli E, van de Vlekkert D, Bonten EJ, Hu H, Mann L, Gomero EM, et al. Muscle degeneration in neuraminidase 1‐deficient mice results from infiltration of the muscle fibers by expanded connective tissue. Biochim Biophys Acta 2010;1802:659–672. [DOI] [PMC free article] [PubMed] [Google Scholar]
- 40. Sandri M. Signaling in muscle atrophy and hypertrophy. Physiology (Bethesda) 2008;23:160–170. [DOI] [PubMed] [Google Scholar]
- 41. Bonaldo P, Sandri M. Cellular and molecular mechanisms of muscle atrophy. Dis Model Mech 2013;6:25–39. [DOI] [PMC free article] [PubMed] [Google Scholar]
- 42. Baracos VE, DeVivo C, Hoyle DH, Goldberg AL. Activation of the ATP‐ubiquitin‐proteasome pathway in skeletal muscle of cachectic rats bearing a hepatoma. Am J Physiol 1995;268:E996–E1006. [DOI] [PubMed] [Google Scholar]
- 43. Coletti D, Yang E, Marazzi G, Sassoon D. TNFalpha inhibits skeletal myogenesis through a PW1‐dependent pathway by recruitment of caspase pathways. EMBO J 2002;21:631–642. [DOI] [PMC free article] [PubMed] [Google Scholar]
- 44. Costelli P, De Tullio R, Baccino FM, Melloni E. Activation of Ca(2+)‐dependent proteolysis in skeletal muscle and heart in cancer cachexia. Br J Cancer 2001;84:946–950. [DOI] [PMC free article] [PubMed] [Google Scholar]
- 45. Toledo M, Busquets S, Ametller E, Lopez‐Soriano FJ, Argiles JM. Sirtuin 1 in skeletal muscle of cachectic tumour‐bearing rats: a role in impaired regeneration? J Cachexia Sarcopenia Muscle 2011;2:57–62. [DOI] [PMC free article] [PubMed] [Google Scholar]
- 46. He WA, Berardi E, Cardillo VM, Acharyya S, Aulino P, Thomas‐Ahner J, et al. NF‐kappaB‐mediated Pax7 dysregulation in the muscle microenvironment promotes cancer cachexia. J Clin Invest 2013;123:4821–4835. [DOI] [PMC free article] [PubMed] [Google Scholar]
- 47. Penna F, Costamagna D, Fanzani A, Bonelli G, Baccino FM, Costelli P. Muscle wasting and impaired myogenesis in tumor bearing mice are prevented by ERK inhibition. PLoS One 2010;5:e13604. [DOI] [PMC free article] [PubMed] [Google Scholar]
- 48. Vaughan VC, Martin P, Lewandowski PA. Cancer cachexia: impact, mechanisms and emerging treatments. J Cachexia Sarcopenia Muscle 2013;4:95–109. [DOI] [PMC free article] [PubMed] [Google Scholar]
Associated Data
This section collects any data citations, data availability statements, or supplementary materials included in this article.
Supplementary Materials
Supporting info item