

The absence of ZO-2 promotes an increase in cell size by two mechanisms: an increase in cyclin D, which extends the time that the cells spend in the G1 phase of the cell cycle, and an accumulation of YAP at the nucleus, which promotes its transcriptional activity, triggering the activation of the mTORC1 complex and its target, S6K1.
Abstract
Renal compensatory hypertrophy (RCH) restores normal kidney function after disease or loss of kidney tissue and is characterized by an increase in organ size due to cell enlargement and not to cell proliferation. In MDCK renal epithelial cells, silencing of the tight junction protein zona occludens 2 (ZO-2 KD) induces cell hypertrophy by two mechanisms: prolonging the time that cells spend at the G1 phase of the cell cycle due to an increase in cyclin D1 level, and augmenting the rate of protein synthesis. The latter is triggered by the nuclear accumulation and increased transcriptional activity of Yes-associated protein (YAP), the main target of the Hippo pathway, which results in decreased expression of phosphatase and tensin homologue. This in turn increased the level of phosphatidylinositol (3,4,5)-triphosphate, which transactivates the Akt/mammalian target of rapamycin pathway, leading to activation of the kinase S6K1 and increased synthesis of proteins and cell size. In agreement, in a rat model of uninephrectomy, RCH is accompanied by decreased expression of ZO-2 and nuclear expression of YAP. Our results reveal a novel role of ZO-2 as a modulator of cell size.
INTRODUCTION
Hypertrophy is a process in which the increase in cell mass is not due to cell proliferation but to cell enlargement. In the kidney, growth of residual renal tissue in response to loss of other renal tissue is termed renal compensatory hypertrophy (RCH). This is reflected by an increase in protein per cell, protein per DNA, and cell size (Fine and Norman, 1989). Because the majority of the kidney mass corresponds to the proximal tubule, this section of the nephron contributes mostly to hypertrophy (Hayslett et al., 1968). RCH occurs in a variety of conditions, including loss of renal mass by the removal of one kidney, known as uninephrectomy (UNX), the destruction of nephron units in the same kidney due to natural disease, diabetes mellitus, high-protein feeding, chronic metabolic acidosis, and chronic potassium deficiency (Fine et al., 1992). Although RCH develops as a response to restore normal kidney function, in some cases, it is excessive and leads to tubular atrophy, interstitial fibrosis, and progressive decline of renal function (Fogo and Ichikawa, 1991; Hostetter, 1995). Therefore there is a need for a better understanding of the factors that modulate renal hypertrophy.
We found that in an epithelial cell line derived from canine kidney (Madin–Darby [MDCK] cells) in which the expression of the tight junction (TJ) protein zona occludens 2 (ZO-2) was stably silenced due to the transfection of a short hairpin RNA (shRNA; ZO-2 KD), the cells grew conspicuously in size. This observation prompted us to study the mechanisms that induce cell hypertrophy triggered by the lack of ZO-2.
TJs are cell–cell adhesion structures present at the uppermost portion of the lateral membranes of epithelial cells. They regulate the passage of ions and molecules through the paracellular pathway and maintain cell polarity, blocking the free diffusion of lipids and protein within the plasma membrane from the apical to the basolateral domains and vice versa. TJs are formed by a complex array of integral proteins such as claudins, occludin, tricellulin, and junction adhesion molecules (JAMs) and a group of peripheral proteins, including members of the membrane-associated guanylate kinase (MAGUK) protein family (for reviews, see Gonzalez-Mariscal et al., 2003, 2011b). ZO-2 is a 160-kDa MAGUK protein that links the integral TJ proteins to the actin cytoskeleton (Wittchen et al., 1999) and is crucial for the polymerization of claudins into TJ strands (Umeda et al., 2006). In proliferating cells, ZO-2 is also present at the nucleus (Islas et al., 2002) and is involved in the regulation of gene transcription (Betanzos et al., 2004; Huerta et al., 2007). In particular, ZO-2 inhibits cell proliferation by blocking the entry of cells into the cell cycle via inhibition of cyclin D transcription and increased degradation of this protein (Tapia et al., 2009). In humans, ZO-2 is crucial for the proper sealing of TJs in the biliary ducts, as mutations in the ZO-2 gene (TJP2) are associated with familial hypercholanemia, a disease characterized by leakage of bile into serum (Carlton et al., 2003), whereas genomic duplication and overexpression of TJP2/ZO-2 induces progressive nonsyndromic hearing loss due to increased expression of apoptosis genes in the cells of the inner ear (Walsh et al., 2010).
Here we show that in ZO-2 KD cells, hypertrophy is triggered in part by a cell cycle–related mechanism via an increase in the amount of cyclin D1 (CD1), which increases the time ZO-2 KD cells spent in the G1 phase of the cell cycle. Hypertrophy is also induced by an increase in rate of protein synthesis. This point is explored by testing whether the absence of ZO-2 affects the activity of the mammalian target of rapamycin complex 1 (mTORC1) pathway, which promotes protein synthesis (for review, see Laplante and Sabatini, 2012) and that of its upstream regulator, Yes-associated protein (YAP), the main target of the Hippo signaling pathway (Tumaneng et al., 2012b). We find that the absence of ZO-2 triggers the accumulation of YAP at the nucleus and stimulates its transcriptional activity, which results in decreased expression of phosphatase and tensin homologue (PTEN) and increased concentration of phosphatidylinositol (3,4,5)-triphosphate (PIP3), which in turn transactivates the Akt/mTORC1 signaling pathway and its downstream target, the kinase S6K1, which promoted an increase in cell size. Moreover, in a rat model of UNX, we find that RCH is accompanied by decreased expression of ZO-2 and increased nuclear expression of YAP. Taken together, our results reveal a novel role of ZO-2 as a modulator of cell size and suggest that ZO-2 could become a therapeutic target for the control of renal hypertrophy.
RESULTS
Absence of ZO-2 results in increased cell size in epithelial cells
We observed that ZO-2 KD MDCK clone IC5 cells look conspicuously bigger than parental cells (Figure 1A). This observation prompted us to estimate cell size by using flow cytometry to compare the forward scatter (FSC) of light by ZO-2 KD and parental MDCK cells with that of reference microspheres with known diameter. Figure 1B shows that whereas 73% of parental MDCK cells have a diameter of 35–40 μm, 67% of ZO-2 KD cells have a diameter of 55–60 μm. In addition, we determined the membrane surface of ZO-2 KD and parental MDCK cells by measuring the electrical capacitance in a whole-cell clamp configuration as previously reported (Gonzalez-Mariscal et al., 1990). Figure 1C shows that ZO-2 KD MDCK cells have a significantly higher (63%) amount of membrane surface than parental MDCK cells.
FIGURE 1:

The absence of ZO-2 altered the cytoarchitecture of epithelial cells. (A) ZO-2 KD cells are bigger than parental MDCK cells. MDCK cells were fixed and processed for immunofluorescence with antibodies against ZO-1 and ZO-2. (B) ZO-2 KD MDCK cells have a bigger diameter than parental cells. The diameter of cells was estimated by comparing in a flow cytometer the FSC signals with those of the reference microspheres. Results from three independent experiments. Statistical analysis done with two-way analysis of variance (ANOVA) followed by Bonferroni’s multiple comparison test. *p < 0.05, ***p < 0.001. (C) The amount of membrane surface is bigger in ZO-2 KD than in parental MDCK cells. Membrane surface was estimated by measuring the electrical capacitance in a whole-cell clamp configuration. The membrane surface of 33 parental cells and 36 ZO-2 KD cells was evaluated. Statistical analysis was done with Student’s t test, ****p < 0.0001. (D) Left, the FSC of light in a flow cytometer shows that three different clones of ZO-2 KD cells exhibit an increased cell size in comparison to parental cells. Right, the increase in cell size in ZO-2 KD cell clone IC5, evaluated by the FSC of light in a flow cytometer, was partially rescued by expressing a ZO-2 construct with altered shRNA-binding sites. (E) The amount of microvilli varies among cells of the parental MDCK clone (left), but in ZO-2 KD MDCK cells, microvilli density is significantly higher than in parental cells. Long membrane extensions are observed covering some ZO-2 KD cells (right, arrow).
To exclude the possibility that the observed phenotypic change is caused by shRNA off-target effects, we analyzed the size of two additional clones of ZO-2 KD cells, named IC6 and 2D1. Figure 1D (left) shows, using the FSC of light in a flow cytometer, that the three clones of ZO-2 KD cells (IC5, IC6, and 2D1) display the same phenotype of increased cell size in comparison to parental cells. Then we analyzed whether the phenotype in ZO-2 KD cell clone IC5 could be rescued by expressing a ZO-2 construct with altered shRNA-binding sites. Figure 1D (right) shows, based on the FSC of light in a flow cytometer, that transfection of ZO-2 partially reverses the increase in size observed in ZO-2–depleted cells. The reversal of size is partial instead of complete, since not all of the cells in the ZO-2 KD culture were transfected after Lipofectamine treatment with the ZO-2 construct. Hereafter, all the ZO-2 KD cells used in the study were of the clone IC5 and are referred only as ZO-2 KD cells.
Because we previously showed that ZO-2 siRNA–transfected monolayers display an atypical profile, with regions where the apical surface appears overgrown (Hernandez et al., 2007), we next analyzed by scanning electron microscopy the surface of confluent cultures of ZO-2 KD and parental MDCK cells. Figure 1E shows that although the amount of microvilli varied among cells of the same clone, in ZO-2 KD MDCK cells, there was a notable increase in microvilli density in comparison to parental MDCK cells. Furthermore, some ZO-2 KD cells were covered by clusters of long membrane extensions (Figure 1E, inset) that resembled those previously described in ZO-1 and ZO-2 double-KD cells (Fanning et al., 2012). We also analyzed whether the number of cilia per cell was modified due to the absence of ZO-2 and found, by staining the nuclei with 4′,6-diamidino-2-phenylindole (DAPI) and the cilia with an antibody against acetylated tubulin, that it was reduced in ZO-2 KD cells (Table 1).
TABLE 1:
Amount of cilia detected by immunofluorescence in ZO-2 KD and parental MDCK cells.
| Cells | Number of cellsa | Number of ciliab | Cilia/100cells |
|---|---|---|---|
| Parental | 381 | 25 | 6.7 |
| ZO-2 KD | 614 | 22 | 3.4 |
aThe number of cells studied was determined by counting the nuclei that were stained with DAPI.
bCilia were identified by staining with an antibody against acetylated tubulin.
Absence of ZO-2 triggers cell hypertrophy by a cell cycle–dependent mechanism
Next we analyzed whether the lack of ZO-2 had an effect on cell proliferation. Figure 2A shows no significant difference in the number of proliferating cells between ZO-2 KD and parental MDCK cells. This result suggested that a process of hypertrophy and not of hyperplasia was occurring in ZO-2 KD cells. To confirm this, we measured the protein/DNA ratio and observed that it was 52% higher in ZO-2 KD MDCK cells than in parental cells (Figure 2B).
FIGURE 2:

The absence of ZO-2 had no effect on epithelial cell proliferation and instead increased the protein/DNA ratio and decreased the entry of cells into the S phase of the cell cycle. (A) The number of proliferating ZO-2 KD and parental MDCK cells treated or not with 100 nM rapamycin, an inhibitor of the mTORC1 complex, was measured with a tetrazolium salt assay. The absence of ZO-2 had no effect on cell proliferation, and ZO-2 KD and parental MDCK cells were equally sensitive to rapamycin inhibition of cell proliferation. Results from three independent experiments. Statistical analysis done with two-way ANOVA followed by Bonferroni’s comparison test. (B) The protein/DNA ratio was 52% higher in ZO-2 KD cells than in parental MDCK cells. Protein and DNA concentrations were respectively quantitated using a BCA protein assay kit and in a spectrophotometer at 260 nm in suspensions derived from the same cell samples. Statistical analysis was done with Student’s t test, *p < 0.05. (C) ZO-2 KD cells moved through the cell cycle at a slower pace than parental cells. Cells were incubated with cDMEM for 24 h. Then the cultures were transferred to DMEM with 0.1% serum for 48 h. Next cell cycle entry was triggered by addition of cDMEM. The percentage of cells at each stage of the cell cycle was determined by flow cytometry in cells stained with propidium iodide at different times after cDMEM addition. (D) In comparison to parental cells, a lower percentage of ZO-2 KD cells were present in the S phase 14 h after the transfer to media with 10% serum. Values are relative to the percentage of cells present in the S phase at time 0. Statistical analysis was done with a two-way ANOVA followed by Bonferroni’s multiple comparison test; *p < 0.05. (E) ZO-2 KD cells expressed a higher level of CD1 than parental MDCK cells after their transfer from medium with 0.1-10% serum. Left, representative Western blot; right, densitometric analysis of three independent experiments. Statistical analysis was done with a two-way ANOVA followed by Bonferroni’s multiple comparison test; *p < 0.05, **p < 0.01, ***p < 0.001.
Two distinct mechanisms have been identified as triggers of hypertrophy in renal cells. The first, which is cell-cycle dependent, involves the coordinated action of a mitogen-like epidermal growth factor and an antiproliferative agent such as transforming growth factor β (Wolf et al., 1993; Franch et al., 1995; Liu and Preisig, 1999) or the CIP/KIP family of cyclin kinase inhibitors, such as p21 and p27, which inhibit the G1/S-phase cyclin-dependent kinase complexes (Monkawa et al., 2002; Wolf et al., 2003). The mitogenic stimulus induces quiescent cells into the G1 phase of the cell cycle, the activation of cdk4/cyclin D, and the stimulation of protein synthesis, whereas the antiproliferative agent arrests cell cycle progression before the restriction point, preventing the activation of cdk2/cyclin E and blocking the movement of cells into the S phase. In this way, the cells become hypertrophic by undergoing an increase in physical growth in early G1 without subsequent entry into S phase (Liu and Preisig, 1999).
To test whether a cell cycle–dependent mechanism is involved in the increase in size in ZO-2 KD cells, we used flow-cytometric analysis to analyze the distribution of parental and ZO-2 KD cells during the cell cycle. We incubated sparse ZO-2 KD and parental MDCK cells with DMEM with 10% serum (cDMEM) for 24 h. Then we transferred the cultures to DMEM with 0.1% serum for arrest at the G0 stage of the cell cycle. After 48 h, cell cycle entry was triggered by addition of cDMEM, and the percentage of cells at each stage of the cell cycle was determined at different time points by the addition of propidium iodide. Figure 2C shows that both parental and ZO-2 KD MDCK cells moved through the cell cycle after the monolayers were transferred from media with 0.1–10% serum. However, ZO-2 KD cells moved at a slower pace. This is more evident in Figure 2D, where a lower percentage of ZO-2 KD cells are in S phase 14 h after transfer to medium with 10% serum.
Previously we demonstrated that ZO-2 inhibits the transcription of the cyclin D gene and promotes the degradation of the cyclin D protein (Huerta et al., 2007; Tapia et al., 2009). Because renal hypertrophy has been associated with the activation of CD without concurrent up-regulation of cyclin E (Liu and Preisig, 2002), we next analyzed the level of expression of CD1 in ZO-2 KD and parental MDCK cells. Figure 2E shows that ZO-2 KD cells have a higher increase in level of CD1 than parental MDCK as time proceeds after the monolayers were transferred from medium with 0.1–10% serum. These results suggest that the hypertrophy observed in ZO-2 KD MDCK cells was due to a cell cycle–dependent mechanism by which the absence of ZO-2 produced an increase in the amount of CD1, which increased the time that the cells spent in the G1 phase of the cell cycle.
Increase in cells size observed in ZO-2 KD cells is also a response to activation of mTORC1 complex and its downstream target, S6K1
The second mechanism identified as a trigger of RCH involves a disparity between the rates of protein synthesis and degradation (Jurkovitz et al., 1992; Ling et al., 1996). Because protein synthesis increases when the kidney size increases (Rabkin and Dahl, 1990), we next analyzed in ZO-2 KD cells the activation of the mTORC1 pathway, which promotes protein synthesis (Chen et al., 2005) via phosphorylation of its target, S6K1 (Chen et al., 2009). Activation of kinase S6K1 is critical for RCH (Chen et al., 2009) and control of cell size in Drosophila (Montagne et al., 1999) and mammals (Shima et al., 1998; Ohanna et al., 2005) but has no effect on cell proliferation and cell cycle distribution (Montagne et al., 1999; Ohanna et al., 2005).
We analyzed mTOR phosphorylation in S2448 because active mTOR, integrated into mTORC1, is predominantly phosphorylated in this residue (Copp et al., 2009). Figure 3A shows a similar phosphorylation level of mTOR S2448 in ZO-2 KD and parental MDCK cells. Next we analyzed S6K1 and not S6K2, since the former is essential for cells to increase in size, whereas both are dispensable for cell proliferation (Ohanna et al., 2005). We used antibodies that detect the two isoforms of S6K1—p70S6K and p85S6K—as well as antibodies that detect the mTORC1-dependant phosphorylation of sites that activate S6K1 via relief of pseudosubstrate suppression. Figure 3A shows that in ZO-2 KD cells, there is an increase in phosphorylation of S6K1 in comparison to parental cells of 12- and 2-fold in T389 and T421/S424, respectively. These results suggest that the increase in cell size triggered by the absence of ZO-2 is mediated by the activation of mTORC1 and its downstream target, S6K1.
FIGURE 3:

The lack of ZO-2 activated the PI3K-Akt pathway, which in turn transactivates mTORC1 and its final effector, S6K1, which controls cell size. (A) In the absence of ZO-2, S6K1 is activated. Western blot of parental and ZO-2 KD MDCK cells done with specific antibodies against mTOR, P-mTOR S2448, p70S6K1/p85S6K1, P-p70S6K1 T389/ P-p85S6K1 T421/S424, and P-p70S6K1 T421/S424 /P-p85S6K1 T444/S447, and GAPDH as loading control. Left, representative images; right, densitometric analysis. Statistical analysis was done with Student’s t test. *p < 0.05; ns, nonsignificant. (B) The inhibition of mTORC1 with rapamycin (left), of PI3K with LY294002 (middle), and of Akt with Akt VIII (right) abolishes the increase in cell size observed in ZO-2 KD cells. Size of ZO-2 KD and parental MDCK cells was determined by the FSC of light in a flow cytometer after 12 h of incubation with rapamycin (100 nM), LY294002 (50 mM), and Akt VIII (2.12 μM). At least 1000 cells were analyzed per experimental condition in each graph. (C) Silencing of Raptor with a specific siRNA reversed the increase in size of ZO-2 KD MDCK cells to a value similar to that of parental cells. Left, top, Western blot of Raptor in parental and ZO-2 KD cells treated or not with Raptor siRNA. Lamin B1 was used as load control. Right, densitometric quantification of three independent Western blot experiments. Statistical analysis done with one-way ANOVA followed by Bonferroni’s multiple comparison test; **p < 0.01, ***p < 0.001. Left, bottom, FSC of light, a measure of cell size, of parental and ZO-2 KD cells transfected or not with a siRNA for Raptor. (D) In ZO-2 KD cells, GSK-3β, a target of Akt, is highly phosphorylated at S9 in comparison to parental MDCK cells. Left, representative image; right, densitometric analysis. Statistical analysis done with Student’s t test; *p < 0.05.
To further pursue this point, we next analyzed the effect of rapamycin, an allosteric mTORC1 inhibitor, on cell proliferation and cell size. Our results showed that cell proliferation in ZO-2 KD and parental MDCK cells was equally sensitive to rapamycin (Figure 2A) and that treatment of ZO-2 KD cells with rapamycin reversed the increase in cell size, as evaluated by the FSC of light in a flow cytometer, to a value similar to that of parental cells (Figure 3B, left). To validate these results in greater depth, we silenced in ZO-2 KD cells with a specific small interfering RNA (siRNA), the expression of Raptor, an essential component of the mTORC1 complex. The Western blot in Figure 3C (top) shows that Raptor siRNA decreased the expression of Raptor in ZO-2 KD cells, and by measuring the FSC of light in a flow cytometer, we found that Raptor silencing induced a reversal of size in ZO-2 KD cells to values present in parental cells (Figure 3C, bottom). Taken together, these results indicate that loss of ZO-2 results in mTORC1 activation, which mediates the increase in cell size.
The phosphatidylinositol 3 kinase (PI3K)-Akt pathway is a key upstream activator of mTORC1: the activation of Akt by PI3K inactivates by phosphorylation the tuberous sclerosis complex (TSC) protein TSC2. This makes the TSC1-TSC2 complex unable to inactivate Rheb, promoting mTORC1 activation (for review, see Tumaneng et al., 2012a). Therefore we next analyzed whether PI3K inhibition with LY294002 and the Akt inhibitor Akt VIII reversed the increase in cell size observed in ZO-2 KD cells. Figure 3B shows that both LY294002 and Akt VIII returned the size of ZO-2 KD cells to that of parental MDCK cells. To further demonstrate the activation of Akt in ZO-2 KD cells, we evaluated the phosphorylation of GSK-3β at S9, a known target of Akt (Cross et al., 1995). Figure 3D shows that in ZO-2 KD cells, phosphorylation of GSK3β at S9 increased fivefold, confirming the activation of Akt in the absence of ZO-2. Taken together, these results suggested that ZO-2 KD cells turned on the consecutive activity of PI3K-Akt and TORC1, which ultimately activated S6K1 and promoted an increase in cell size.
Absence of ZO-2 induces transcriptional activity of YAP, which results in transactivation of Akt/mTOR signaling pathway and increase in cell size
The final determination of cell size is the result of cross-talk between the Hippo and mTOR pathways (Csibi and Blenis, 2012). Yes-associated protein (YAP), the main downstream target of the mammalian Hippo pathway, is an upstream regulator of mTOR, as it induces, independently of growth factors or amino acids, the expression of miR-29, which inhibits the translation of PTEN. This lipid phosphatase negatively regulates the PI3K-Akt axis by reducing the level of phosphatidylinositol (3,4,5)-triphosphate (PIP3) (Tumaneng et al., 2012b). Therefore we next analyzed the state of YAP in parental and three different clones of ZO-2 KD MDCK cells. Figure 4A shows that, as previously reported (Zhao et al., 2007), cell density regulated YAP localization, as it was present in the nucleus of cells in sparse but not in confluent cultures. Note that the absence of ZO-2 induced the nuclear accumulation of YAP in both culture conditions; however, in confluent ZO-2–depleted cells, YAP also appeared to be associated with the nuclear envelope and the endoplasmic reticulum (ER). A similar pattern of YAP expression was found in the three clones of ZO-2 KD cells. The large tumor suppressor (LATS) kinase of the Hippo pathway directly phosphorylates YAP on S127 (Zhao et al., 2007) and creates a 14-3-3–binding site (Basu et al., 2003), which promotes YAP cytoplasmic localization and hence inhibits the transcriptional activity of the protein (Zhao et al., 2007). In accordance, the Western blots in Figure 4B show that in ZO-2 KD cells, there was a 70% decrease in YAP S127 phosphorylation in comparison to parental cells, whereas no change was detected in the total amount of YAP. These results suggest the inactivation of the Hippo signaling pathway in ZO-2 KD cells.
FIGURE 4:

The absence of ZO-2 favored the nuclear recruitment of YAP and promoted its transcriptional activity. (A) In parental confluent cultures of MDCK cells, ZO-2 is not detected in the nucleus, whereas in three different clones of ZO-2 KD cells, YAP was detected in the nucleus in speckles and along the nuclear envelope and the ER. In sparse cultures, YAP nuclear staining was more conspicuous in ZO-2 KD cells than in parental cells. Parental and ZO-2 KD MDCK cells were plated at sparse and confluent density, and the distribution of YAP was observed by immunofluorescence using a specific YAP antibody. (B) In ZO-2 KD cells, YAP was less phosphorylated at S127 than in parental cells. The Western blot was done with parental and ZO-2 KD cell lysates using an antibody against YAP and p-YAP S127. Top, representative image; bottom, densitometric analysis. Statistical analysis was done with Student’s t test; *p < 0.05. (C) The lack of ZO-2 augmented the activity of an artificial promoter regulated by eight TEAD-binding sites, whereas ZO-2 overexpression repressed this promoter activity. A reporter gene assay was done in parental and ZO-2 KD MDCK cells by transfecting them with 0.5 μg/well (200 mm2) 8xGTIIC-Luc construct with or without the cotransfection of 0.8 μg/well pTRE- hZO-2. (D) The absence of ZO-2 increased the activity of hCTGF promoter, whereas the cotransfection of ZO-2 reduced the promoter activity in both parental and ZO-2 KD cells. MDCK cells were transiently transfected with hCTGF-Luc at a concentration of 0.5 μg/well (200 mm2) with or without the cotransfection of pTRE- hZO-2 at 0.8 μg/well. (E) ZO-2 negatively modulated the amount of CTGF mRNA present in MDCK cells. Total RNA was isolated to analyze CTGF expression by RT-qPCR using gene-specific probes. Expression was normalized to GAPDH. Parental cells were transfected or not with 0.5 μg/well pTRE-hZO-2. (F) In ZO-2 KD cells, the transcriptional activity of β-catenin was much higher than in parental cells. Reporter gene assay done in parental and ZO-2 KD MDCK cells with TOPFLASH/FOPFLASH reporter construct with and without the cotransfection of pTRE-hZO-2 construct. In C–F, one-way ANOVA was performed followed by Bonferroni’s post hoc comparisons test. *p < 0.05, **p < 0.01, and ***p < 0.001.
At the nucleus, YAP serves as a cofactor for TEA-domain (TEAD) transcription factors, which promote the epithelial-to-mesenchymal transition (Li et al., 2008). Therefore we next analyzed the effect of ZO-2 absence on the activity of a reporter construct in which luciferase expression was driven by eight artificial TEAD-binding sites. Figure 4C shows that in the absence of ZO-2, the relative activity of the promoter increased in comparison to parental cells and that overexpression of ZO-2 abolished the promoter activity. The connective tissue growth factor (CTGF) is a direct YAP target gene (Li et al., 2008), and hence we explored whether ZO-2 affects the activity of CTGF promoter. Figure 4D shows that in ZO-2 KD cells, CTGF promoter is more active than in parental cells and that the cotransfection of ZO-2 reduces promoter activity in both parental and ZO-2 KD cells. To strengthen this observation, we analyzed by reverse transcription quantitative PCR (RT-qPCR) whether the endogenous expression of CTGF was affected by the lack of ZO-2. Figure 4E shows that the absence of ZO-2 increased by twofold the amount of CTGF mRNA relative to the housekeeping glyceraldehyde-3-phosphate dehydrogenase (GAPDH) and that overexpression of ZO-2 reduced by 63% the amount of CTGF in parental cells. Taken together, these results indicate that lack of ZO-2 induces the transcriptional activity of YAP.
It was recently shown that YAP docks the ubiquitin ligase β-TrCP to the β-catenin destruction complex when the Wnt signaling pathway is inactive and that treatment with Wnt dislodges YAP from this complex and causes its nuclear accumulation (Azzolin et al., 2014). Because ZO-2 KD cells display a nuclear accumulation of YAP, we next tested whether ZO-2 KD cells exhibit a higher β-catenin/TCF transcriptional activity than parental cells. We carried out a reporter gene assay in parental and ZO-2 KD MDCK cells with the TOPFLASH/FOPFLASH reporter construct regulated by three TCF-binding sites. Figure 4F shows that in ZO-2 KD cells, the transcriptional activity of β-catenin was much higher than in parental cells. This result confirmed that the absence of ZO-2 facilitated β-catenin/TCF transcriptional activity and is in agreement with our previous observation that ZO-2 overexpression abolished β-catenin transcriptional activity (Tapia et al., 2009).
At the nucleus, YAP induces the generation of miRNA29, which targets the 3′ untranslated region of PTEN and inhibits its translation (Tumaneng et al., 2012b). Therefore we analyzed whether ZO-2 KD cells exhibited a decrease in the amount of PTEN, which could explain the increase in cell size as a result of mTORC1 activation. The Western blot in Figure 5A shows that in comparison to parental cells, in ZO-2 KD cells, there was a 62% decrease in the amount of PTEN together with a threefold increase in Akt phosphorylation at T308 and S473. To provide experimental confirmation of the importance of the cross-talk between YAP and the PTEN/Akt/mTORC1 pathway for the increase in cell size observed in MDCK ZO-2 KD cells, we used a siRNA against Dicer, the RNase III enzyme that plays a fundamental role in small RNA biogenesis by cleaving dsRNA substrates into functional small RNAs (for review, see Lau et al., 2012). Figure 5B (top left and right) shows that treatment of ZO-2–depleted cells with siRNA against Dicer increased PTEN expression. Then we analyzed whether Dicer silencing affected cell size. The histograms in Figure 5B (bottom left) show that treatment of ZO-2– depleted cells with siRNA against Dicer decreased cell size, as measured by flow cytometry, to a value similar to that of parental cells.
FIGURE 5:

The absence of ZO-2 stimulated the cross-talk between Hippo and mTOR signaling pathways. (A) ZO-2 KD MDCK cells displayed a lower amount of PTEN than parental cells and instead showed increased phosphorylation of Akt at S473 and T308. Left, representative Western blots of three independent experiments done with a specific antibody against PTEN, pAkt-T308, and pAkt-S473. Right, densitometric analysis. Statistical analysis was done on three independent experiments with Student’s t test; *p < 0.05. (B) The cross-talk between YAP and PTEN, mediated by a small RNA, is critical for the increase in cell size observed in MDCK ZO-2 KD cells. Top, in ZO-2 KD cells, the expression of PTEN increased only after transfection with siRNA against Dicer and not with the sole transfection of PTEN. Statistical analysis done on three independent experiments with a one-way ANOVA followed by Bonferroni’s multiple comparison test; **p < 0.01, ***p < 0.001. Bottom, cell size measured by flow cytometry. Treatment of ZO-2–depleted cells with siRNA against Dicer decreased cell size to a value similar to that of parental cells (left), whereas no effect was observed after PTEN transfection (right). (C) The amount of PIP3 present in ZO-2 KD cells is higher than in parental cells. PIP3 was measured in parental and ZO-2 KD cells using a competitive enzyme-linked immunosorbent assay. Results from three independent experiments. Statistical analysis with Student’s t test; **p < 0.01
To explore further the role of a small RNA in the down-regulation of PTEN and the increase in cell size observed in ZO-2–depleted cells, we transfected ZO-2 KD cells with PTEN and observed no increase in the amount of PTEN (Figure 5B, top left and right) and no decrease in cell size (Figure 5B, bottom right). However, when ZO-2 KD cells were cotransfected with PTEN and a siRNA against Dicer, PTEN was expressed at a level similar to that in parental cells. These results agree with evidence showing that PTEN in cells exhibiting nuclear YAP is down-regulated by miRNA29 (Tumaneng et al., 2012b). Taken together, these observations indicate that the increase of cell size in ZO-2–depleted cells is regulated by the nuclear accumulation of YAP, which induces mTORC1 activation through a process mediated by a microRNA that downregulates PTEN expression.
Another link between the Hippo and PI3K signaling pathways has recently been found. Pik3cb, a gene that encodes for the catalytic subunit p110 of PI3K, is a direct transcriptional target of YAP (Lin et al., 2015). This finding, together with the observation that ZO-2 KD cells exhibit a decreased amount of PTEN, prompted us to explore whether ZO-2 KD cells had an altered expression level of PIP3. For this purpose, we quantitated the amount of PIP3 in parental and ZO-2 KD cells and observed that it was 78% higher in ZO-2 KD cells (Figure 5C). In summary, these results indicate that the absence of ZO-2 stimulates the transcriptional activity of YAP, which leads to the increase in PIP3 concentration that activates the Akt/mTOR signaling pathway and promotes the observed increase in cell size.
In compensatory renal hypertrophy, ZO-2 expression is silenced and YAP is concentrated at cell nuclei
Our results indicate that the absence of ZO-2 promoted an increase in cell size due to the accumulation of YAP at the nucleus and the subsequent activation of the mTORC1 pathway. To further confirm these observations, we studied the expression of ZO-2 and YAP in an in vivo model of hypertrophy. We chose the UNX because it has long been known that a reduction in the number of functional nephrons triggers RCH, in which the remaining nephrons grow in order to restore normal kidney function (Brenner and Rector, 2008). Figure 6A shows the increase in size in the remaining kidney from an 11-wk-old rat 3 wk after UNX compared to the kidney of an 11-wk-old control rat. Table 2 shows the increase in weight in the remaining kidneys 1–3 wk after the UNX in comparison to the removed kidneys. Next we used confocal microscopy in 11-wk-old rats to confirm the increase in size of renal tubules in remaining kidneys 3 wk after UNX compared to control kidneys from 11-wk-old rats. To facilitate the observation of the increase in size, in Figure 6B the apical brush border and basolateral surfaces of proximal renal tubules were respectively stained with specific antibodies against dipeptidyl peptidase IV (Dpp IV; Girardi et al., 2001) and β-catenin. Figure 6C shows the increase in area of the proximal tubules as a function of time after UNX.
FIGURE 6:

Uninephrectomy triggered an increase in the size of the remaining kidney. (A) Images of kidneys from 11-wk-old rats. Left, kidney from a control animal; right, kidney from a rat in which the contralateral kidney had been removed 3 wk earlier. (B) Kidney frozen sections from 11-wk-old rats in control condition or that had experimented UNX 1–3 wk earlier. The apical brush border of proximal tubules is stained with specific antibodies against Dpp IV and the basolateral surface with anti–β-catenin. (C) Quantification of the area of proximal tubule cells from kidneys of 11-wk-old rats (control) or that had experimented UNX 1–3 wk earlier. Area analysis was done using ImageJ on confocal images of frozen kidney sections stained with Dpp IV and anti–β-catenin. A minimum of 53 cells was evaluated for each condition. Statistical analysis with one-way ANOVA, followed by Dunnett’s test; *p < 0.05, ***p < 0.001. (D) ZO-2 expression is lost in the remaining kidneys of rats subjected to UNX. Frozen sections of kidneys from 11-wk-old rats that had been subjected or not to UNX 3 wk earlier were processed for immunofluorescence with an antibody against ZO-2, and the nuclei were stained with DAPI.
TABLE 2:
Weight of rat kidneys before and after UNX.
| Weight of removed kidney (g) | Time after UNX (wk) | Weight of remaining kidney (g) |
|---|---|---|
| 0.78 ± 0.11 (n = 10) | 1 | 1.02 ± 0.16*** (n = 10) |
| 2 | 1.46 ± 0.06*** (n = 10) | |
| 3 | 1.89 ± 0.11*** (n = 10) |
One-way ANOVA followed by Dunnett’s test, *** p < 0.001.
Then we explored whether this increase in kidney cell size was accompanied by changes in YAP and ZO-2 expression. We observed by Western blot that the amount of total YAP (Figure 7A), as well as of nuclear YAP (Figure 7B), in kidney homogenates increased with time after UNX and in comparison to that in kidneys of 11-wk-old rats that had not undergone UNX (control; total YAP, 1.4-, 1.6-, and 1.8-fold increase at 1, 2, and 3 wk after UNX, respectively; nuclear YAP, 2.2-, 2.2-, and 3.0-fold increase at 1, 2, and 3 wk after UNX, respectively). Moreover, we observed by immunofluorescence that in frozen kidney sections, the expression of ZO-2 at the cell borders was significantly reduced 3 wk after the UNX, whereas in control kidneys from 11-wk-old rats, ZO-2 gave a clear tubular staining pattern as previously reported (Gonzalez-Mariscal et al., 2000; Figure 6D).
FIGURE 7:
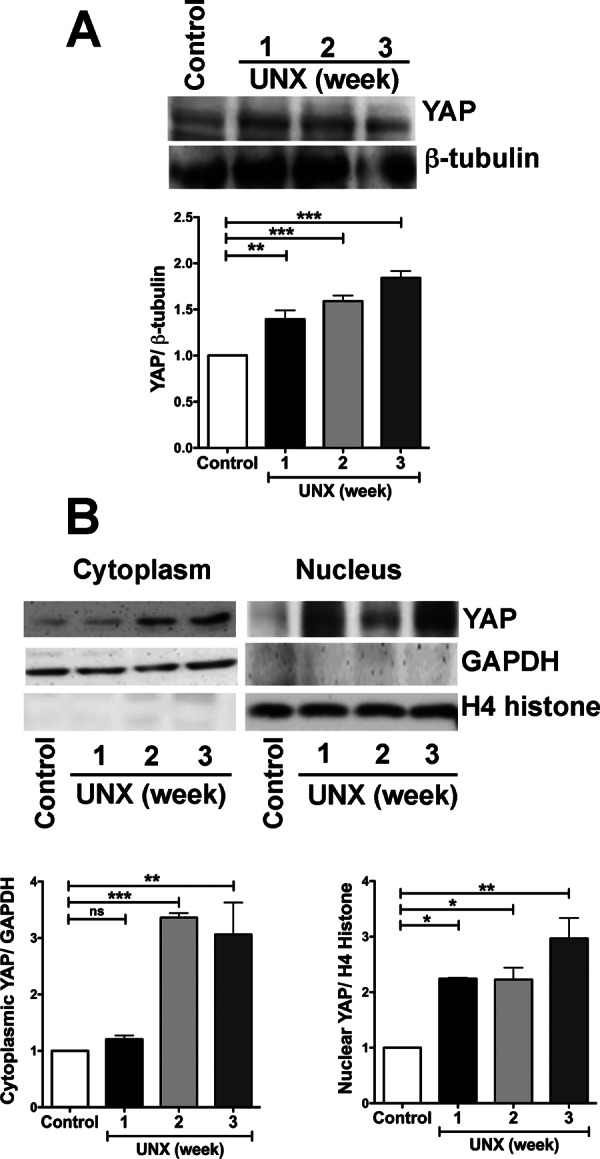
In an in vivo model of renal hypertrophy, the expression of YAP increased, while the protein concentrated at the nucleus. After UNX, the amount of total YAP (A) and nuclear YAP (B) increased in the remaining kidney. Lysates derived from kidneys from 11-wk-old rats (control) and rats that at 8 wk of age had been subjected to UNX were tested 1, 2, and 3 wk later. Representative blots from three independent experiments with the corresponding densitometric analysis. Statistical analysis was done with ANOVA and Dunnett’s test; *p < 0.05, **p < 0.01, ***p < 0.001.
In summary, these results indicated that RCH was accompanied by decreased expression of ZO-2 and increased nuclear expression of YAP. These observations, together with the results obtained in the MDCK epithelial kidney cell line, highlight the crucial and novel role of ZO-2 as a modulator of cell size through the inhibition of the Hippo pathway and the relocalization of YAP at the nucleus, which triggers the activation of mTORC1 and its target S6K.
DISCUSSION
In this work, we showed that silencing of the TJ protein ZO-2 in MDCK renal epithelial cells induced a significant increase in cell size. Because this increase was accompanied by a higher protein/DNA ratio, we conclude that the lack of ZO-2 triggered a hypertrophy process.
We observed that the absence of ZO-2 increased the level of CD1, which in turn increased the time that the cells spent in the G1 phase of the cell cycle, thus showing for the first time that the absence of ZO-2 triggers cell hypertrophy by a cell cycle–dependent mechanism. The increase in CD1 expression triggered by ZO-2 silencing was expected, since we previously demonstrated that ZO-2 overexpression inhibits CD1 transcription and promotes CD1 protein degradation (Huerta et al., 2007; Tapia et al., 2009).
An imbalance between the rates of protein synthesis and degradation is also known to induce renal hypertrophy (Jurkovitz et al., 1992; Ling et al., 1996). Therefore we analyzed whether the absence of ZO-2 triggered the activation of the mTOR pathway, which increases the rate of protein synthesis and its target, S6K1, which regulates cell size in Drosophila (Montagne et al., 1999) and mammals (Shima et al., 1998; Ohanna et al., 2005). Here we found a greater phosphorylation of S6K1 in MDCK ZO-2 KD cells than in parental cells and showed that treatment of ZO-2 KD cells with rapamycin or siRNA against Raptor reversed the increase in cell size. We conclude that an increased rate of protein synthesis due to the activation of mTORC1, as well as the activation of its downstream target, S6K1, is another way in which the lack of ZO-2 induces hypertrophy in renal cells.
To understand how the lack of ZO-2 activated mTORC1, we analyzed the Hippo signaling pathway, the upstream regulator of mTOR. In the Hippo pathway, the activation of MST1/2 kinases promotes the interaction with the scaffold protein salvador-family WW domain–containing protein 1 (SAV1), which allows the phosphorylation and activation of LATS 1/2 kinases, which in turn associate with cofactor MOB1 to phosphorylate and inactivate the oncogenic protein YAP. When the Hippo pathway is inactivated, YAP accumulates at the nucleus and promotes gene transcription (for review, see Hong and Guan, 2012). Here we observed that in ZO-2 KD cells, YAP is less phosphorylated at serine 127 and accumulates at the nucleus. Hence we conclude that the lack of ZO-2 inactivates the Hippo signaling pathway.
Recent evidence reveals that adenomatous polyposis coli (APC), a scaffold protein of the β-catenin destruction complex (Markowitz and Bertagnolli, 2009), also functions at the Hippo pathway by enhancing the interaction between the kinase LATS1 and the scaffold protein SAV1. This function of APC is regulated by GSK-3β, as the inhibition of GSK-3β activity decreases the phosphorylation of LATS1 and YAP due to reduced physical interactions among APC, SAV1, and LATS1 (Cai et al., 2015). These observations hence suggested that in ZO-2 KD cells, the inhibition of GSK-3β reduced the phosphorylation of YAP and favored its nuclear accumulation.
Because YAP is a cofactor for TEAD transcription factors, we then demonstrated that the activity of an artificial promoter with TEAD-binding sites and of CTGF promoter—a natural promoter regulated by TEAD sites—increased in MDCK ZO-2 KD cells in comparison to parental cells and that the overexpression of ZO-2 abolished this promoter activity. Moreover, we observed that the absence of ZO-2 increased the amount of CTGF mRNA and that overexpression of ZO-2 reduced the amount of CTGF mRNA in parental cells. Our results hence indicate that the lack of ZO-2 induces the transcriptional activity of YAP and show for the first time that ZO-2 modulates transcription mediated by TEAD sites.
We also demonstrated that in MDCK ZO-2 KD cells, the transcriptional activity of β-catenin is much higher than in parental cells. Because β-catenin/TCF transcriptional activity targets genes that induce the epithelial-to-mesenchymal transformation (for review, see Gonzalez and Medici, 2014), our results help to explain why hypertrophy when excessive, leads to the development of fibrosis (Fogo and Ichikawa, 1991; Hostetter, 1995).
At the nucleus, YAP induces the expression of miR-29, which inhibits the translation of PTEN, a negative regulator of the PI3K-Akt signaling pathway (Tumaneng et al., 2012b), and promotes the transcription of Pik3cb, the gene for the catalytic subunit of PI3K (Lin et al., 2015). In MDCK ZO-2 KD cells, we observed a decrease in the amount of PTEN together with an increase in PIP3 and in Akt phosphorylation at S473 and T308. In addition, we observed that the inhibition of PI3K and Akt, as well as treatment with siRNA against Dicer, reversed the increase in cell size observed in ZO-2 KD cells. Therefore we conclude that the absence of ZO-2 stimulates the transcriptional activity of YAP, which results in transactivation of the Akt/mTOR signaling pathway and thereby promotes the observed increase in cell size.
The relation between YAP2 and ZO-2 was previously explored in MDCK cells, showing that YAP2 overexpression increased cell proliferation, whereas ZO-2 inhibited this effect (Oka et al., 2010). These results agree with our previous observation that ZO-2 overexpression blocks cell proliferation (Gonzalez-Mariscal et al., 2009). Here, in ZO-2 KD cells, we did not observe any change in cell proliferation in comparison to parental cells, and cells moved through the cell cycle, albeit with a delay in their entry into the S phase. In addition, ZO-2 has been found to associate through its first PDZ domain with YAP2, facilitating the nuclear localization and proapoptotic function of YAP2 (Oka et al., 2010). Here we observed nuclear accumulation of YAP in cells depleted of ZO-2, suggesting that the interaction between YAP and ZO-2 is not critical for the entrance of YAP into the nucleus.
We chose the model of hypertrophy generated by UNX because it fulfills the criteria of an increase in cell size and RNA and protein synthesis, together with minimal changes in cell number and DNA replication (for review, see Fine and Norman, 1989) and because, in contrast to the hyperplasia observed in liver regeneration (Friedman et al., 1984), renal hypertrophy triggers the expression of gene products required for ribosomal synthesis (Ouellette, 1978), which are induced during mTORC1 activation. In addition, mTORC1 (Chen et al., 2005) and S6K1 (Chen et al., 2009) have been identified as critical players in RCH induced by UNX.
We performed UNX in adult animals because in them, total DNA content increases only marginally, whereas in the neonatal animal, compensatory renal growth after UNX occurs by hyperplasia (Celsi et al., 1986). We found the expected increase in size and weight in the remaining kidney 3 wk after UNX and observed that these changes were accompanied by an increase in YAP expression and localization in the nucleus and obliteration of ZO-2 expression. These in vivo observations confirmed that cell hypertrophy was accomplished by ZO-2 silencing and highlighted the newly found role of ZO-2 as a modulator of cell size. Although CRH emerges as a response to reestablish kidney function after disease or experimental damage, it can lead, when excessive, to fibrosis and progressive decay of renal function (Fogo and Ichikawa, 1991; Hostetter, 1995). Our results suggest that ZO-2 can be used as a novel therapeutic target to regulate renal hypertrophy.
Here we showed the importance of YAP for renal cell hypertrophy; other studies have revealed the crucial role of YAP for cardiomyocyte proliferation. For example, the expression of active YAP in the adult heart stimulates cardiomyocyte proliferation and improves contractility after myocardial infarction (Xin et al., 2013) and was sufficient to stimulate proliferation of cardiomyocytes in culture and in fetal and infant hearts without generating hypertrophic growth (von Gise et al., 2012), whereas YAP deletion impedes neonatal heart regeneration (Xin et al., 2013) and decreases cardiomyocyte proliferation (von Gise et al., 2012). Therefore we can conclude that the mechanism by which YAP regulates organ size varies according to the tissue: in the heart, YAP promotes cell proliferation or hyperplasia, whereas in the kidney, YAP triggers an increase in cell size or hypertrophy.
In summary, our results indicate that the absence of ZO-2 promotes an increase in cell size due to two mechanisms: an increase in the amount of cyclin D, which increases the time that the cells spend in the G1 phase of the cell cycle, and the accumulation of YAP in the nucleus, which promotes the transcriptional activity that triggers subsequent activation of the mTORC1 complex and its downstream target, S6K1 (Figure 8).
FIGURE 8:

Scheme of the mechanisms by which the lack of ZO-2 triggered cell hypertrophy. The absence of ZO-2 promoted an increase in cell size by two mechanisms: an increase in the time that the cells spent in the G1 phase of the cell cycle, and the accumulation of YAP at the nucleus, which promoted the transcriptional activity that triggered subsequent activation of the PI3K/Akt/mTORC1 complex and its downstream target, S6K1, which increased protein synthesis. The increased inhibitory phosphorylation of GSK3β due to Akt activation inhibited the interactions of the SAV/APC/LATS1 complex in the Hippo pathway and thereby reduced the phosphorylation of YAP and promoted its transcriptional activity. Purple arrows, changes observed in MDCK ZO-2 KD cells; blue arrows, cross-talk between YAP and PI3K/Akt signaling pathways; green arrows, GSK-3β regulation of β-catenin transcriptional activity and the Hippo pathway.
MATERIALS AND METHODS
Cell culture
Parental and ZO-2 KD MDCK cells were kindly provided by Alan Fanning (University of North Carolina, Chapel Hill, NC) and cultured as previously described (Van Itallie et al., 2009). The three clones of ZO-2 KD cells used in this study, IC5, IC6, and 2D1, stably expressed a mixture of three different specific shRNAs against ZO-2 in the pSuper vector, whereas parental cells only expressed the empty vector. Stable clonal MDCK cell lines were isolated on the basis of Zeocin resistance. The pSUPER shRNA construct used to make the ZO-KD cells was previously described (Van Itallie et al., 2008). Rescue of the phenotype was done by transfecting ZO-2 KD MDCK cells with a ZO-2 construct resistant to the anti–ZO-2 shRNAs (kindly provided by Alan Fanning).
Immunofluorescence
Immunofluorescence of MDCK cells was done by standard methods as previously described (Quiros et al., 2013). We used the following primary antibodies: a rat monoclonal against ZO-1 (R26.4C; Developmental Studies Hybridoma Bank, Iowa City, IA), a mouse monoclonal anti–acetyl-α-tubulin (32-2700; Thermo Fischer Scientific, Waltham, MA), and rabbit polyclonals against ZO-2 (711400; Invitrogen, Carlsbad, CA) or against YAP (generously provided by Marius Sudol, Mechanobiology Institute, National University of Singapore, Singapore). As secondary antibodies, we used an anti-rat polyclonal antibody coupled to Alexa Fluor 594 (A21209, dilution 1:300; Life Technologies, Eugene, OR) and an anti-rabbit polyclonal antibody coupled to Alexa Fluor 488 (A11008, dilution 1:300; Life Technologies). In kidney frozen sections derived from control and UNX 11-wk-old rats, the immunofluorescence was done as previously described (Gonzalez-Mariscal et al., 2011a) with rabbit polyclonals against ZO-2 and mouse monoclonals anti Dpp-IV (MCA924, dilution 1:50; Serotec, Raleigh, NC) and β-catenin (13-8400, dilution 1:100; Invitrogen). As secondary antibodies, we used a donkey anti-rabbit immunoglobulin G (IgG) coupled to Alexa Fluor 488 (A21206, dilution 1:100; Invitrogen) and a donkey anti-mouse IgG coupled to Alexa Fluor 594 (A21203, dilution 1:100; Invitrogen).
Determination of cell area
Area analysis of proximal tubule cells stained with antibodies against Dpp-IV and β-catenin was done by converting the scale bar of known linear distance to the number of pixels corresponding to its length using ImageJ (20 μm = 288 pixels; National Institutes of Health, Bethesda, MD). Then the border of each cell within the tubule was delineated, and the software automatically converted pixel number into square micrometers, as previously described (Agley et al., 2012).
Determination of cell volume
The size of ZO-2 KD and parental MDCK cells was determined using a flow cytometry size calibration kit (F-13838; Molecular Probes, Eugene, OR) containing six suspensions of unstained polystyrene microspheres, each with a known diameter. The size of the cells in the experimental sample was estimated by comparing the FSC signals with those of the reference microspheres. For this purpose, confluent cultures of ZO-2 KD and parental MDCK cells were trypsinized and resuspended in phosphate-buffered saline (PBS).
Membrane surface measurements
Membrane surface was estimated from capacitance currents recorded from cells in mature monolayers using the whole-cell patch-clamp technique, as described elsewhere (Gonzalez-Mariscal et al., 1990). Patch pipettes were made from borosilicate glass tubing (Kimax-51; Kimble Chase, Vineland, NJ) in a P87 Flaming/Brown puller (Sutter Instruments, Novato, CA). Pulling parameters were set to obtain a tip resistance of 3–5 MΩ. Before recording, pipettes were backfilled with a saline solution composed of 120 mM KCl, 5 mM NaCl, 1 mM MgCl2, 5 mM 4-(2-hydroxyethyl)-1-piperazineethanesulfonic acid (HEPES), and 2 mM ethylene glycol tetraacetic acid–K, pH 7.4 and attached to a piezoelectric micromanipulator (PCS-250; Burleigh, Fishers, NY). MDCK monolayers were grown on glass coverslips placed on a recording chamber bathed with an extracellular recording solution containing 110 mM NaCl, 5 mM KCl, 1 mM CaCl2, 1 mM MgCl2, 10 mM HEPES, and 10 mM glucose at pH 7.4. The approaching and ultimate touching of cells by pipettes was monitored with a Nikon Diaphot-300 inverted microscope (Nikon, Tokyo, Japan). Voltage control protocols and electrical current recordings were made with a DAGAN 8900 amplifier (DAGAN, Minneapolis, MN), controlled by the dedicated program Clampex, of the PClamp suite 6.0 (Axon Instruments, Union City, CA) on a PC. Trials having a seal resistance <3 GΩ were discarded. Once the whole-cell configuration was set, capacitive currents were induced by step voltage pulses from −80 to −100 mV, low-pass filtered at 30 MHz, and recorded at 10 MHz. Membrane capacitance measurements were obtained by integrating the area under the curve of capacitive current transients and then dividing such integral by the voltage pulse amplitude (–20 mV). This procedure was performed off-line with the program Clampfit of Pclamp. The membrane surface was further calculated assuming a membrane capacitance of 1 pF/cm2.
Scanning electron microscopy
MDCK monolayers grown on cover slides covered with a thin layer of collagen were fixed for 1 h with 2.5% glutaraldehyde in 0.1 M sodium cacodylate buffer, pH 7.2. Samples were washed in the same buffer and dehydrated in crescent concentrations of ethanol to reach 100%. Monolayers were incubated for 20 min with hexamethyldisilazane (HMDS; 692 Polysciences, Warrington, PA). After a second 10-min incubation in HMDS, the excess of reactive was eliminated and left to air-dry for 30 min. Samples were mounted in specimen metal mounts and gold coated in an ion sputtering device (JFC-1100; JEOL, Peabody, MA). Samples were examined in a JEOL JSM-7100-F field emission scanning electron microscope.
Protein/DNA ratio determination
Parental and ZO-2 KD MDCK cells were plated at confluence (4 × 10⁵ cells/cm2) in 12-well plates. After 24 h, the monolayers were washed with PBS and then scraped with a rubber policeman in 0.5 ml of hypotonic lysis buffer (50 mM NaH2PO4, pH 7.4) containing protease inhibitors. Half of the resulting suspension was diluted with the same volume (0.25 ml) of hypotonic lysis buffer containing 2 mmol/l EDTA and used to measure DNA content in a spectrophotometer (NanoDrop 2000; Thermo Scientific, Waltham, MA) reading at 260 nm. The other half of the suspension was used to measure protein content using a BCA Protein Assay Kit (23227; Pierce, Rockford, IL).
Flow-cytometric analysis of the cell cycle
Synchronization of cell cultures and flow-cytometric analysis of the cell cycle with propidium iodide were done as previously reported (Tapia et al., 2009).
Western blots
Western blots were done according to standard procedures as previously reported (Quiros et al., 2013), using the rabbit polyclonal antibodies against cyclin D1 (orb10496, dilution 1:300; Biorbyt, San Francisco, CA), mTOR (2983, dilution 1:1000; Cell Signaling, Danvers, MA), P-mTOR S2448 (2971, dilution 1:1000; Cell Signaling), p70S6K1/p85S6K1 (9202, dilution 1:1000; Cell Signaling), P-p70S6K1 T389/P-p85S6K1 T412 (9502, dilution 1:1000; Cell Signaling), P-p70S6K1 T421/S424 /P-p85S6K1 T444/S447 (9204, dilution 1:1000; Cell Signaling), GAPDH (2118, dilution 1:1000; Cell Signaling), p-YAP S127 (A0757, dilution 1:1000; Assay Biotech, Sunnyvale, CA), pAkt-T308 (Sc-135650, dilution 1:1000; Santa Cruz Biotechnology, Dallas, TX), pAkt-S473 (Sc-7985-R, dilution 1:1000; Santa Cruz Biotechnology), and YAP (generously provided by Marius Sudol) with a mouse monoclonal antibody against PTEN (Sc-7974, dilution 1:1000; Santa Cruz Biotechnology) or Akt (610876, dilution 1:1000; BD Biosciences San Jose, CA), or with a rabbit monoclonal antibody against Raptor (2280, dilution 1:1000; Cell Signaling) followed by peroxidase-conjugated goat antibodies against rabbit IgG (62-6120, dilution 1:5000; Zymed Laboratories, South San Francisco, CA) or mouse IgG (26-6520, dilution 1:8000; Life Technologies, Carlsbad, CA) and a chemiluminescence detection system (ECL+, WBKLS 0500; Merck Millipore, Darmstadt, Germany).
Transfections and reporter gene assays
Parental and ZO-2 KD MDCK cells were plated in 24-well plates at a density of 5 × 10⁴ cells/well. After 24 h, cells were transfected using Lipofectamine 2000 (11668-019; Life Technologies) with 0.75 μg of the construct pTRE-hZO-2, which contains human ZO-2 full length with altered shRNA-binding sites (generously provided by Alan Fanning); with 0.5 μg of construct pRZ21xdZ PTEN (kindly provided by Frank Furnari and Webster Cavenee, Ludwig Institute for Cancer Research, University of California at San Diego, La Jolla, CA); with 0.5 μg of plasmid 8xGTIIC-luciferase (plasmid 34615; Addgene Cambridge, MA), which was derived from the 4XGTIIC-Lux made from Ian Farrance by adding four more TEAD-binding sites (Dupont et al., 2011); with 0.8 μg of a construct of the human CTGF promoter region that contains three putative TEAD-binding sites cloned into the basic luciferase reporter vector pGL3-6xOSE-Luc (Li et al., 2008; generously provided by Kun-Liang Guan, Moors Cancer Center, University of California at San Diego); or with 0.5 μg of the TOPFLASH/FOPFLASH reporter construct regulated by three TCF-binding sites (21-170/169; Merck Millipore). After 6 h, transfection medium was removed and replaced with fresh culture medium. After 24 h, cells were harvested and suspended in lysis solution for reporters (E3971; Promega, Madison, WI). Protein extraction was done by a heat-shock lysis cycle of 5 min at 70°C followed by 1 min at 37°C and 3 min in agitation. Finally, luciferase activity was determined using the Luciferase Assay System (E1500; Promega) and the Infinite M200 PRO series (Tecan, Männedorf, Switzerland) equipment. Luciferase activity values were normalized to protein content and expressed relative to those recorded in parental cells without transfected ZO-2.
The siRNAs for canine Raptor and Dicer were custom synthesized by Thermo Scientific Dharmacon (Lafayette, CO; Raptor: sense, 5′AGGACAACGGUCACAAAUA3′; antisense, 5′UAUUUGUGACCGUUGUCCU3′; Dicer: sense, 5′GGGAAAGUGUGCAGAAUAAUU3′; antisense, 5′UUAUUCUGCAGACUUUCCCUU3′) and transfected into ZO-2 KD MDCK cells with Lipofectamine RNAiMAX (13778-150; Invitrogen) following the manufacturer’s instructions.
qRT-PCR
Total RNA was extracted from parental and ZO-2 KD MDCK cells using the TRIzol reagent (15596–026; Invitrogen). RT-qPCR was performed by a two-step method. cDNA was generated from 1 μg of total RNA by the Improm-II reverse transcription system (A3800; Promega, Fitchburg, WI) with oligo (dt) as a primer according to the manufacturer’s instructions. PCR was performed with the QuantiTect SYBR Green PCR Kit (204143; Qiagen, Hilden, Germany) in a volume of 25 μl. Triplicate samples were subjected to qPCR by using the Step One plus Real Time PCR system (4376600; Applied Biosystems, Carlsbad, CA). The PCR conditions were as follows: after an initial cycle of 10 min at 94°C, 40 cycles of amplification (30 s at 94°C, 1 min at 60°C, 30 s at 72°C) and a melt curve (15 s at 95°C, 1 min at 60°C, 15 s at 95°C). Primers used for amplification were as follows: forward, GACTTTAGGAACAGTGGGAGAGCACC; and reverse, CCTCATGAAGAAGGCTGGAGAACAC. The relative abundance of CTGF mRNA was expressed in comparison to GAPDH mRNA and was calculated using the 2ΔCt method.
Quantitative determination of PIP3 from epithelial cells
Monolayers of parental and ZO-2 KD cells plated at confluence in three plates of 60 cm2 were treated with 5 ml of 0.5 M trichloroacetic acid (TCA) at 4°C before being manually scraped with a rubber policeman. The cell suspension was next centrifuged at 800 × g for 5 min. The supernatant was discarded, and the pellet was resuspended for 2 min with 3 ml of 1 mM EDTA in 5% TCA. The amount of protein in this suspension was quantitated. Then the suspension was centrifuged again at 800 × g for 5 min and the supernatant discarded. Three milliliters of ethanol:chloroform (2:1) was added to the pellet, followed by 30 min of mechanical agitation. The amount of phosphorus of the phospholipids was quantitated after digestion with Mg(NO3)2 and HCl with ammonium molybdate according to Ame’s method (Bartlett, 1959). The samples were next centrifuged at 800 × g for 5 min, and the supernatant containing the neutral lipids was discarded. Acidic lipids were next extracted by the addition to the pellets of 2.25 ml of methanol:chloroform:HCl (12 M; 80:40:1) followed by 15 min of mechanical agitation. The samples were next centrifuged at 800 × g for 5 min. The supernatants containing the acidic lipids were recovered, and 0.75 ml of chloroform and 1.35 ml of 0.1 M HCl were added to them. Samples were then centrifuged at 800 × g for 5 min. Then the upper organic phase was recovered with a pipette and placed in a vial that was dried with liquid nitrogen and kept at −20°C until further analysis. The amount of PIP3 present within the lipid extracts was quantitated using a competitive PIP3 Mass ELISA assay (K-2500s; Echelon, Salt Lake City, UT).
Unilateral nephrectomy
The model of RCH explored in this work is based on UNX. As previously described (Jaramillo-Juarez et al., 2000), adult (8 wk of age) male Wistar rats with a body weight between 200 and 300 g were anesthetized with isoflurane. Then an incision was done in the abdominal wall under sterile conditions to expose the right kidney. The renal pedicle was isolated, and the right kidney was removed. After surgery, the rats were returned to their cages and given food and water access ad libitum. At 1–3 wk after surgery, the remaining kidney, undergoing RCH, was removed and the animal killed with pentobarbital sodium (100 mg/kg intraperitoneal). These kidneys undergoing RCH were compared with control kidneys from 11-wk-old rats. The kidneys were frozen in liquid nitrogen, and half of each one was later processed for Western blot experiments and the rest for immunofluorescence determinations as previously described (Gonzalez-Mariscal et al., 2011a).
Isolation of cytosolic and nuclear fractions from kidney tissue
We adapted for kidney tissue a technique described previously for the isolation of cytosolic and nuclear fractions (Fuentes-Mera et al., 2006). Briefly, kidneys were unfrozen and cut into small rectangles with a sharp knife. Slices were incubated for 30 min in ice-cold PBS containing Complete inhibitor cocktail (04693132001; Roche Applied Science, Madison, WI), 50 mM Tris-HCl (pH 8), and 0.1% (wt/vol) DNase1. Samples were sonicated for 30 s, and protein concentrations were determined by the Bradford protein dye banding method, using bovine serum albumin as standard. The homogenates were then incubated for 30 min in cold buffer I (0.32 M sucrose, 10 mM Tris-HCl, pH 8, 3 mM CaCl2, 2 mM magnesium acetate, 0.1 mM EDTA, 1 mM dithiothreitol [DTT], 0.5 mM phenylmethylsulfonyl fluoride [PMSF], 0.5% (vol/vol) NP-40, and Complete protease inhibitor mixture; Cai et al., 2015). Then the homogenate was centrifuged at 200 × g for 10 min at 4°C. The supernatant corresponding to the cytosolic fraction was removed and kept frozen at −70°C, and the pellet was resuspended in 200 μl of buffer I plus 200 μl of buffer II (2 M sucrose, 10 mM Tris-HCl, pH 8, 5 mM magnesium acetate, 0.1 mM EDTA, 1 mM DTT, 0.5 mM PMSF, and Complete protease inhibitor mixture) and centrifuged at 30,000 × g for 50 min at 4°C. The supernatant was eliminated, and the pellet containing the purified nucleus was resuspended in Complete inhibitor mixture with 3% (vol/vol) Triton X-100, 3% (wt/vol) SDS, and 0.5% (wt/vol) DNase I and sonicated twice for 30 s. The nuclear extracts were kept frozen at −70°C until further use.
Acknowledgments
This work was supported by Grant 237241 of the Mexican National Council of Science and Technology (Conacyt). A.D.C. and H.G.G. were recipients of doctoral fellowships from Conacyt (233211, 282075).
Abbreviations used:
- CD1
cyclin D1
- CTGF
connective tissue growth factor
- Dpp IV
dipeptidyl peptidase IV
- FSC
forward scatter of light
- JAMs
junction adhesion molecules
- MAGUK
membrane-associated guanylate kinase
- MDCK
Madin–Darby canine kidney
- mTORC1
mammalian target of rapamycin complex 1
- PI3K
phosphatidylinositol 3 kinase
- PIP3
phosphatidylinositol (3,4,5)-triphosphate
- PTEN
phosphatase and tensin homologue
- RCH
renal compensatory hypertrophy
- siRNA
small interfering RNA
- TEAD
TEA-domain
- TJ
tight junction
- shRNA
short hairpin RNA
- TSC
tuberous sclerosis complex
- UNX
uninephrectomy
- YAP
Yes-associated protein
- ZO-2
zona occludens 2.
Footnotes
This article was published online ahead of print in MBoC in Press (http://www.molbiolcell.org/cgi/doi/10.1091/mbc.E15-08-0598) on March 23, 2016.
REFERENCES
- Agley CC, Velloso CP, Lazarus NR, Harridge SD. An image analysis method for the precise selection and quantitation of fluorescently labeled cellular constituents: application to the measurement of human muscle cells in culture. J Histochem Cytochem. 2012;60:428–438. doi: 10.1369/0022155412442897. [DOI] [PMC free article] [PubMed] [Google Scholar]
- Azzolin L, Panciera T, Soligo S, Enzo E, Bicciato S, Dupont S, Bresolin S, Frasson C, Basso G, Guzzardo V, et al. YAP/TAZ incorporation in the beta-catenin destruction complex orchestrates the Wnt response. Cell. 2014;158:157–170. doi: 10.1016/j.cell.2014.06.013. [DOI] [PubMed] [Google Scholar]
- Bartlett GR. Phosphorus assay in column chromatography. J Biol Chem. 1959;234:466–468. [PubMed] [Google Scholar]
- Basu S, Totty NF, Irwin MS, Sudol M, Downward J. Akt phosphorylates the Yes-associated protein, YAP, to induce interaction with 14-3-3 and attenuation of p73-mediated apoptosis. Mol Cell. 2003;11:11–23. doi: 10.1016/s1097-2765(02)00776-1. [DOI] [PubMed] [Google Scholar]
- Betanzos A, Huerta M, Lopez-Bayghen E, Azuara E, Amerena J, Gonzalez-Mariscal L. The tight junction protein ZO-2 associates with Jun, Fos and C/EBP transcription factors in epithelial cells. Exp Cell Res. 2004;292:51–66. doi: 10.1016/j.yexcr.2003.08.007. [DOI] [PubMed] [Google Scholar]
- Brenner BM, Rector FC. Brenner & Rector’s The Kidney. 8th ed. Philadelphia: Saunders Elsevier; 2008. [Google Scholar]
- Cai J, Maitra A, Anders RA, Taketo MM, Pan D. beta-Catenin destruction complex-independent regulation of Hippo-YAP signaling by APC in intestinal tumorigenesis. Genes Dev. 2015;29:1493–1506. doi: 10.1101/gad.264515.115. [DOI] [PMC free article] [PubMed] [Google Scholar]
- Carlton VE, Harris BZ, Puffenberger EG, Batta AK, Knisely AS, Robinson DL, Strauss KA, Shneider BL, Lim WA, Salen G, et al. Complex inheritance of familial hypercholanemia with associated mutations in TJP2 and BAAT. Nat Genet. 2003;34:91–96. doi: 10.1038/ng1147. [DOI] [PubMed] [Google Scholar]
- Celsi G, Jakobsson B, Aperia A. Influence of age on compensatory renal growth in rats. Pediatr Res. 1986;20:347–350. doi: 10.1203/00006450-198604000-00018. [DOI] [PubMed] [Google Scholar]
- Chen JK, Chen J, Neilson EG, Harris RC. Role of mammalian target of rapamycin signaling in compensatory renal hypertrophy. J Am Soc Nephrol. 2005;16:1384–1391. doi: 10.1681/ASN.2004100894. [DOI] [PubMed] [Google Scholar]
- Chen JK, Chen J, Thomas G, Kozma SC, Harris RC. S6 kinase 1 knockout inhibits uninephrectomy- or diabetes-induced renal hypertrophy. Am J Physiol Renal Physiol. 2009;297:F585–F593. doi: 10.1152/ajprenal.00186.2009. [DOI] [PMC free article] [PubMed] [Google Scholar]
- Copp J, Manning G, Hunter T. TORC-specific phosphorylation of mammalian target of rapamycin (mTOR): phospho-Ser2481 is a marker for intact mTOR signaling complex 2. Cancer Res. 2009;69:1821–1827. doi: 10.1158/0008-5472.CAN-08-3014. [DOI] [PMC free article] [PubMed] [Google Scholar]
- Cross DA, Alessi DR, Cohen P, Andjelkovich M, Hemmings BA. Inhibition of glycogen synthase kinase-3 by insulin mediated by protein kinase B. Nature. 1995;378:785–789. doi: 10.1038/378785a0. [DOI] [PubMed] [Google Scholar]
- Csibi A, Blenis J. Hippo-YAP and mTOR pathways collaborate to regulate organ size. Nat Cell Biol. 2012;14:1244–1245. doi: 10.1038/ncb2634. [DOI] [PubMed] [Google Scholar]
- Dupont S, Morsut L, Aragona M, Enzo E, Giulitti S, Cordenonsi M, Zanconato F, Le Digabel J, Forcato M, Bicciato S, et al. Role of YAP/TAZ in mechanotransduction. Nature. 2011;474:179–183. doi: 10.1038/nature10137. [DOI] [PubMed] [Google Scholar]
- Fanning AS, Van Itallie CM, Anderson JM. Zonula occludens-1 and -2 regulate apical cell structure and the zonula adherens cytoskeleton in polarized epithelia. Mol Biol Cell. 2012;23:577–590. doi: 10.1091/mbc.E11-09-0791. [DOI] [PMC free article] [PubMed] [Google Scholar]
- Fine LG, Norman JT, Kujubu DA, Knecht A. Renal hypertrophy. In: Seldin DW, Geibisch G, editors. The Kidney, Physiology and Pathophysiology, 2nd ed. New York: Raven Press; 1992. pp. 3113–3134. [Google Scholar]
- Fine LG, Norman J. Cellular events in renal hypertrophy. Annu Rev Physiol. 1989;51:19–32. doi: 10.1146/annurev.ph.51.030189.000315. [DOI] [PubMed] [Google Scholar]
- Fogo A, Ichikawa I. Evidence for a pathogenic linkage between glomerular hypertrophy and sclerosis. Am J Kidney Dis. 1991;17:666–669. doi: 10.1016/s0272-6386(12)80347-7. [DOI] [PubMed] [Google Scholar]
- Franch HA, Shay JW, Alpern RJ, Preisig PA. Involvement of pRB family in TGF beta-dependent epithelial cell hypertrophy. J Cell Biol. 1995;129:245–254. doi: 10.1083/jcb.129.1.245. [DOI] [PMC free article] [PubMed] [Google Scholar]
- Friedman JM, Chung EY, Darnell JE., Jr Gene expression during liver regeneration. J Mol Biol. 1984;179:37–53. doi: 10.1016/0022-2836(84)90305-x. [DOI] [PubMed] [Google Scholar]
- Fuentes-Mera L, Rodriguez-Munoz R, Gonzalez-Ramirez R, Garcia-Sierra F, Gonzalez E, Mornet D, Cisneros B. Characterization of a novel Dp71 dystrophin-associated protein complex (DAPC) present in the nucleus of HeLa cells: members of the nuclear DAPC associate with the nuclear matrix. Exp Cell Res. 2006:3023–3035. doi: 10.1016/j.yexcr.2006.06.002. 312. [DOI] [PubMed] [Google Scholar]
- Girardi AC, Degray BC, Nagy T, Biemesderfer D, Aronson PS. Association of Na(+)-H(+) exchanger isoform NHE3 and dipeptidyl peptidase IV in the renal proximal tubule. J Biol Chem. 2001;276:46671–46677. doi: 10.1074/jbc.M106897200. [DOI] [PubMed] [Google Scholar]
- Gonzalez DM, Medici D. Signaling mechanisms of the epithelial-mesenchymal transition. Sci Signal. 2014;7:re8. doi: 10.1126/scisignal.2005189. [DOI] [PMC free article] [PubMed] [Google Scholar]
- Gonzalez-Mariscal L, Betanzos A, Nava P, Jaramillo BE. Tight junction proteins. Prog Biophys Mol Biol. 2003;81:1–44. doi: 10.1016/s0079-6107(02)00037-8. [DOI] [PubMed] [Google Scholar]
- Gonzalez-Mariscal L, Contreras RG, Bolivar JJ, Ponce A, Chavez De Ramirez B, Cereijido M. Role of calcium in tight junction formation between epithelial cells. Am J Physiol. 1990;259:C978–986. doi: 10.1152/ajpcell.1990.259.6.C978. [DOI] [PubMed] [Google Scholar]
- Gonzalez-Mariscal L, Garay E, Quiros M. Identification of claudins by western blot and immunofluorescence in different cell lines and tissues. Methods Mol Biol. 2011a;762:213–231. doi: 10.1007/978-1-61779-185-7_15. [DOI] [PubMed] [Google Scholar]
- Gonzalez-Mariscal L, Namorado MC, Martin D, Luna J, Alarcon L, Islas S, Valencia L, Muriel P, Ponce L, Reyes JL. Tight junction proteins ZO-1, ZO-2, and occludin along isolated renal tubules. Kidney Int. 2000;57:2386–2402. doi: 10.1046/j.1523-1755.2000.00098.x. [DOI] [PubMed] [Google Scholar]
- Gonzalez-Mariscal L, Quiros M, Diaz-Coranguez M. ZO proteins and redox-dependent processes. Antioxid Redox Signal. 2011b;15:1235–1253. doi: 10.1089/ars.2011.3913. [DOI] [PubMed] [Google Scholar]
- Gonzalez-Mariscal L, Tapia R, Huerta M, Lopez-Bayghen E. The tight junction protein ZO-2 blocks cell cycle progression and inhibits cyclin D1 expression. Ann NY Acad Sci. 2009;1165:121–125. doi: 10.1111/j.1749-6632.2009.04024.x. [DOI] [PubMed] [Google Scholar]
- Hayslett JP, Kashgarian M, Epstein FH. Functional correlates of compensatory renal hypertrophy. J Clin Invest. 1968;47:774–799. doi: 10.1172/JCI105772. [DOI] [PMC free article] [PubMed] [Google Scholar]
- Hernandez S, Chavez Munguia B, Gonzalez-Mariscal L. ZO-2 silencing in epithelial cells perturbs the gate and fence function of tight junctions and leads to an atypical monolayer architecture. Exp Cell Res. 2007;313:1533–1547. doi: 10.1016/j.yexcr.2007.01.026. [DOI] [PubMed] [Google Scholar]
- Hong W, Guan KL. The YAP and TAZ transcription co-activators: key downstream effectors of the mammalian Hippo pathway. Semin Cell Dev Biol. 2012;23:785–793. doi: 10.1016/j.semcdb.2012.05.004. [DOI] [PMC free article] [PubMed] [Google Scholar]
- Hostetter TH. Progression of renal disease and renal hypertrophy. Annu Rev Physiol. 1995;57:263–278. doi: 10.1146/annurev.ph.57.030195.001403. [DOI] [PubMed] [Google Scholar]
- Huerta M, Munoz R, Tapia R, Soto-Reyes E, Ramirez L, Recillas-Targa F, Gonzalez-Mariscal L, Lopez-Bayghen E. Cyclin D1 is transcriptionally down-regulated by ZO-2 via an E box and the transcription factor c-Myc. Mol Biol Cell. 2007;18:4826–4836. doi: 10.1091/mbc.E07-02-0109. [DOI] [PMC free article] [PubMed] [Google Scholar]
- Islas S, Vega J, Ponce L, Gonzalez-Mariscal L. Nuclear localization of the tight junction protein ZO-2 in epithelial cells. Exp Cell Res. 2002;274:138–148. doi: 10.1006/excr.2001.5457. [DOI] [PubMed] [Google Scholar]
- Jaramillo-Juarez F, Rodriguez-Vazquez ML, Namorado MC, Martin D, Reyes JL. Acidosis and weight loss are induced by cyclosporin A in uninephrectomized rats. Pediatr Nephrol. 2000;14:122–127. doi: 10.1007/s004670050026. [DOI] [PubMed] [Google Scholar]
- Jurkovitz CT, England BK, Ebb RG, Mitch WE. Influence of ammonia and pH on protein and amino acid metabolism in LLC-PK1 cells. Kidney Int. 1992;42:595–601. doi: 10.1038/ki.1992.323. [DOI] [PubMed] [Google Scholar]
- Laplante M, Sabatini DM. mTOR signaling in growth control and disease. Cell. 2012;149:274–293. doi: 10.1016/j.cell.2012.03.017. [DOI] [PMC free article] [PubMed] [Google Scholar]
- Lau PW, Guiley KZ, De N, Potter CS, Carragher B, MacRae IJ. The molecular architecture of human Dicer. Nat Struct Mol Biol. 2012;19:436–440. doi: 10.1038/nsmb.2268. [DOI] [PMC free article] [PubMed] [Google Scholar]
- Li L, Li M, Zhao D, Liu X. A new triterpenoid saponin from Artemisia sphaerocephala. Nat Prod Res. 2008;22:1633–1636. doi: 10.1080/14786410701869564. [DOI] [PubMed] [Google Scholar]
- Lin Z, Zhou P, von Gise A, Gu F, Ma Q, Chen J, Guo H, van Gorp PR, Wang DZ, Pu WT. Pi3kcb links Hippo-YAP and PI3K-AKT signaling pathways to promote cardiomyocyte proliferation and survival. Circ Res. 2015;116:35–45. doi: 10.1161/CIRCRESAHA.115.304457. [DOI] [PMC free article] [PubMed] [Google Scholar]
- Ling H, Vamvakas S, Gekle M, Schaefer L, Teschner M, Schaefer RM, Heidland A. Role of lysosomal cathepsin activities in cell hypertrophy induced by NH4Cl in cultured renal proximal tubule cells. J Am Soc Nephrol. 1996;7:73–80. doi: 10.1681/ASN.V7173. [DOI] [PubMed] [Google Scholar]
- Liu B, Preisig P. TGF-beta1-mediated hypertrophy involves inhibiting pRB phosphorylation by blocking activation of cyclin E kinase. Am J Physiol. 1999;277:F186–F194. doi: 10.1152/ajprenal.1999.277.2.F186. [DOI] [PubMed] [Google Scholar]
- Liu B, Preisig PA. Compensatory renal hypertrophy is mediated by a cell cycle-dependent mechanism. Kidney Int. 2002;62:1650–1658. doi: 10.1046/j.1523-1755.2002.00620.x. [DOI] [PubMed] [Google Scholar]
- Markowitz SD, Bertagnolli MM. Molecular origins of cancer: molecular basis of colorectal cancer. N Engl J Med. 2009;361:2449–2460. doi: 10.1056/NEJMra0804588. [DOI] [PMC free article] [PubMed] [Google Scholar]
- Monkawa T, Hiromura K, Wolf G, Shankland SJ. The hypertrophic effect of transforming growth factor-beta is reduced in the absence of cyclin-dependent kinase-inhibitors p21 and p27. J Am Soc Nephrol. 2002;13:1172–1178. doi: 10.1097/01.asn.0000013162.29833.45. [DOI] [PubMed] [Google Scholar]
- Montagne J, Stewart MJ, Stocker H, Hafen E, Kozma SC, Thomas G. Drosophila S6 kinase: a regulator of cell size. Science. 1999;285:2126–2129. doi: 10.1126/science.285.5436.2126. [DOI] [PubMed] [Google Scholar]
- Ohanna M, Sobering AK, Lapointe T, Lorenzo L, Praud C, Petroulakis E, Sonenberg N, Kelly PA, Sotiropoulos A, Pende M. Atrophy of S6K1(-/-) skeletal muscle cells reveals distinct mTOR effectors for cell cycle and size control. Nat Cell Biol. 2005;7:286–294. doi: 10.1038/ncb1231. [DOI] [PubMed] [Google Scholar]
- Oka T, Remue E, Meerschaert K, Vanloo B, Boucherie C, Gfeller D, Bader GD, Sidhu SS, Vandekerckhove J, Gettemans J, et al. Functional complexes between YAP2 and ZO-2 are PDZ domain-dependent, and regulate YAP2 nuclear localization and signalling. Biochem J. 2010;432:461–472. doi: 10.1042/BJ20100870. [DOI] [PubMed] [Google Scholar]
- Ouellette AJ. Messenger RNA in compensatory renal hypertrophy. Yale J Biol Med. 1978;51:413–418. [PMC free article] [PubMed] [Google Scholar]
- Quiros M, Alarcon L, Ponce A, Giannakouros T, Gonzalez-Mariscal L. The intracellular fate of zonula occludens 2 is regulated by the phosphorylation of SR repeats and the phosphorylation/O-GlcNAcylation of S257. Mol Biol Cell. 2013;24:2528–2543. doi: 10.1091/mbc.E13-04-0224. [DOI] [PMC free article] [PubMed] [Google Scholar]
- Rabkin R, Dahl DC. Factors controlling intracellular protein turnover in the kidney. Semin Nephrol. 1990;10:472–480. [PubMed] [Google Scholar]
- Shima H, Pende M, Chen Y, Fumagalli S, Thomas G, Kozma SC. Disruption of the p70(s6k)/p85(s6k) gene reveals a small mouse phenotype and a new functional S6 kinase. EMBO J. 1998;17:6649–6659. doi: 10.1093/emboj/17.22.6649. [DOI] [PMC free article] [PubMed] [Google Scholar]
- Tapia R, Huerta M, Islas S, Avila-Flores A, Lopez-Bayghen E, Weiske J, Huber O, Gonzalez-Mariscal L. Zona occludens-2 inhibits cyclin D1 expression and cell proliferation and exhibits changes in localization along the cell cycle. Mol Biol Cell. 2009;20:1102–1117. doi: 10.1091/mbc.E08-03-0277. [DOI] [PMC free article] [PubMed] [Google Scholar]
- Tumaneng K, Russell RC, Guan KL. Organ size control by Hippo and TOR pathways. Curr Biol. 2012a;22:R368–379. doi: 10.1016/j.cub.2012.03.003. [DOI] [PMC free article] [PubMed] [Google Scholar]
- Tumaneng K, Schlegelmilch K, Russell RC, Yimlamai D, Basnet H, Mahadevan N, Fitamant J, Bardeesy N, Camargo FD, Guan KL. YAP mediates crosstalk between the Hippo and PI(3)K-TOR pathways by suppressing PTEN via miR-29. Nat Cell Biol. 2012b;14:1322–1329. doi: 10.1038/ncb2615. [DOI] [PMC free article] [PubMed] [Google Scholar]
- Umeda K, Ikenouchi J, Katahira-Tayama S, Furuse K, Sasaki H, Nakayama M, Matsui T, Tsukita S, Furuse M, Tsukita S. ZO-1 and ZO-2 independently determine where claudins are polymerized in tight-junction strand formation. Cell. 2006;126:741–754. doi: 10.1016/j.cell.2006.06.043. [DOI] [PubMed] [Google Scholar]
- Van Itallie CM, Fanning AS, Bridges A, Anderson JM. ZO-1 stabilizes the tight junction solute barrier through coupling to the perijunctional cytoskeleton. Mol Biol Cell. 2009;20:3930–3940. doi: 10.1091/mbc.E09-04-0320. [DOI] [PMC free article] [PubMed] [Google Scholar]
- Van Itallie CM, Holmes J, Bridges A, Gookin JL, Coccaro MR, Proctor W, Colegio OR, Anderson JM. The density of small tight junction pores varies among cell types and is increased by expression of claudin-2. J Cell Sci. 2008;121:298–305. doi: 10.1242/jcs.021485. [DOI] [PubMed] [Google Scholar]
- von Gise A, Lin Z, Schlegelmilch K, Honor LB, Pan GM, Buck JN, Ma Q, Ishiwata T, Zhou B, Camargo FD, et al. YAP1, the nuclear target of Hippo signaling, stimulates heart growth through cardiomyocyte proliferation but not hypertrophy. Proc Natl Acad Sci USA. 2012;109:2394–2399. doi: 10.1073/pnas.1116136109. [DOI] [PMC free article] [PubMed] [Google Scholar]
- Walsh T, Pierce SB, Lenz DR, Brownstein Z, Dagan-Rosenfeld O, Shahin H, Roeb W, McCarthy S, Nord AS, Gordon CR, et al. Genomic duplication and overexpression of TJP2/ZO-2 leads to altered expression of apoptosis genes in progressive nonsyndromic hearing loss DFNA51. Am J Hum Genet. 2010;87:101–109. doi: 10.1016/j.ajhg.2010.05.011. [DOI] [PMC free article] [PubMed] [Google Scholar]
- Wittchen ES, Haskins J, Stevenson BR. Protein interactions at the tight junction. Actin has multiple binding partners, and ZO-1 forms independent complexes with ZO-2 and ZO-3. J Biol Chem. 1999;274:35179–35185. doi: 10.1074/jbc.274.49.35179. [DOI] [PubMed] [Google Scholar]
- Wolf G, Jablonski K, Schroeder R, Reinking R, Shankland SJ, Stahl RA. Angiotensin II-induced hypertrophy of proximal tubular cells requires p27Kip1. Kidney Int. 2003;64:71–81. doi: 10.1046/j.1523-1755.2003.00076.x. [DOI] [PubMed] [Google Scholar]
- Wolf G, Mueller E, Stahl RA, Ziyadeh FN. Angiotensin II-induced hypertrophy of cultured murine proximal tubular cells is mediated by endogenous transforming growth factor-beta. J Clin Invest. 1993;92:1366–1372. doi: 10.1172/JCI116710. [DOI] [PMC free article] [PubMed] [Google Scholar]
- Xin M, Kim Y, Sutherland LB, Murakami M, Qi X, McAnally J, Porrello ER, Mahmoud AI, Tan W, Shelton JM, et al. Hippo pathway effector Yap promotes cardiac regeneration. Proc Natl Acad Sci USA. 2013;110:13839–13844. doi: 10.1073/pnas.1313192110. [DOI] [PMC free article] [PubMed] [Google Scholar]
- Zhao B, Wei X, Li W, Udan RS, Yang Q, Kim J, Xie J, Ikenoue T, Yu J, Li L, et al. Inactivation of YAP oncoprotein by the Hippo pathway is involved in cell contact inhibition and tissue growth control. Genes Dev. 2007;21:2747–2761. doi: 10.1101/gad.1602907. [DOI] [PMC free article] [PubMed] [Google Scholar]