

Abstract
Traditional separation and detection of targeted compounds from complex mixtures from environmental matrices requires the use of lengthy prefractionation steps and high-resolution mass analyzers due to the large number of chemical components and their large structural diversity (highly isomeric). In the present work, selected accumulation trapped ion mobility spectrometry (SA-TIMS) is coupled to Fourier transform ion cyclotron resonance mass spectrometry (FT-ICR MS) for direct separation and characterization of targeted endocrine-disrupting compounds (EDC) from a complex environmental matrix in a single analysis. In particular, targeted identification based on high-resolution mobility (R ~ 70–120) and ultrahigh-resolution mass measurements (R > 400 000) of seven commonly targeted EDC and their isobars (e.g., bisphenol A, (Z)- and (E)-diethylstilbestrol, hexestrol, estrone, α-estradiol, and 17-ethynylestradiol) is shown from a complex mixture of water-soluble organic matter (e.g., Suwannee River Fulvic Acid Standard II) complemented with reference standard measurements and theoretical calculations (<3% error).
Graphical abstract
The persistence, bioaccumulation and fate of a variety of chemical compounds has gained substantial interest in the scientific community due to their short and long-term effects on human and animal health (e.g., environmental contaminants such as pharmaceuticals, personal-care products, surfactants, perfluorinated and perchlorinated compounds, and many other chemical classes). Typical practice includes mitigation of their emission by the identification of the anthropogenic sources and by regular monitoring of their levels; however, these analyses can be analytically challenging due to the complexity of the sample matrix. For example, the study of endocrine-disrupting compounds (EDC) requires their identification from complex environmental and biological matrices using accurate analytical methods.1,2 Standard protocols involve the use of lengthy sample preparation, prefractionation steps, and chromatographic separations (e.g., derivitization prior to gas chromatography, and liquid chromatography) followed by mass spectrometry analysis (e.g., high-resolution TOF-MS or MS/MS).3–6 Alternatively, it has been shown that ultrahigh-resolution mass spectrometry (e.g., FT-ICR MS) is a powerful technique for the identification of targeted and nontargeted components using exact mass measurements, as well as for the elucidation of potential interferences.7–13
Over the last decades, with the advent of more versatile and higher resolution forms of ion mobility separations (e.g., periodic focusing DC ion guide,14–16 segmented quadrupole drift cell,17 multistage IMS,18–20 field asymmetric IMS (FAIMS),21 traveling wave ion guide,22,23 and trapped ion mobility spectrometry24–26), progress toward the identification of molecules of interest embedded in complex matrices has been achieved by reducing the chemical noise and increasing the peak capacity and the dynamic range.27–35 Complementary studies using high-resolution IMS-MS devices and ultrahigh-resolution MS analyzers have shown their unique advantages for the separation of structural and geometrical isomers and their chemical identification from exact mass measurements.36,37 More recently, the advantage of coupling some variants of IMS separations (e.g., FAIMS) to ultrahigh-resolution mass spectrometry has been shown for online separation of structural isomers.38–45
In the present work we show for the fist time the advantages of coupling selected accumulation trapped ion mobility spectrometry to an ultrahigh-resolution mass spectrometer for targeted analysis of EDC in a complex environmental matrix and the elucidation of potential interferences. Seven endocrine disruptors (bisphenol A, (Z)- and (E)-diethylstilbestrol, hexestrol, estrone, α-estradiol, and 17-α-ethynylestradiol) were analyzed in a complex mixture of water-soluble organic matter (e.g., Suwannee River Fulvic Acid Standard II). Identity of the targeted EDC compounds was confirmed with complementary measurements using reference standards and mobility values from theoretical calculations of candidate structures.
METHODS
Seven commonly targeted EDC and their isobars (e.g., bisphenol A, (Z)- and (E)-diethylstilbestrol, hexestrol, estrone, α-estradiol, and 17-α-ethynylestradiol) were purchased from Sigma-Aldrich (St. Louis, MO) and used as received. As a complex mixture of water-soluble organic matter, a Suwannee River Fulvic Acid Standard II (SRFA) was obtained from the International Humic Substances Society (St. Paul, MN) and used as received. All solvents used in these studies were analytical grade or better and purchased from Fisher Scientific (Pittsburgh, PA). EDC were dissolved in 50/50 v/v methanol/water and added at 5 ppb to a 20 μg/mL solution of the SRFA mixture. A Tuning Mix calibration standard (TuneMix, G24221A) was purchased from Agilent Technologies (Santa Clara, CA) and used as received. Details on the Tunemix structures (e.g., m/z = 322, K0 = 1.376 cm2 V−1 s−1 and m/z = 622, K0 = 1.013 cm2 V−1 s−1) can be found elsewhere.24,46 All experiments were performed in triplicate.
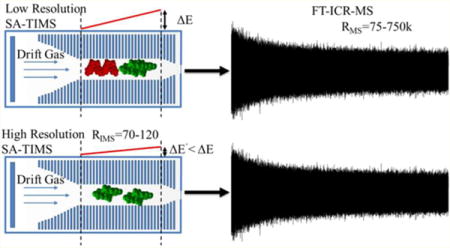
Details regarding the TIMS operation and specifics compared to traditional IMS can be found elsewhere.24,25,47–49 Briefly, the TIMS mobility separation is based on holding the ions stationary using an electric field against a moving gas. In traditional TIMS operation, multiple geometric isomers/conformers are trapped simultaneously at different E values resulting from a voltage gradient applied across the TIMS tunnel (more details in refs 47–49). The E gradient defines the IMS range that is trapped and analyzed, thus allowing low-resolution (large E gradient) and high-resolution (small E gradient) IMS separations. The possibility to separate and accumulate single isomers/conformers over time in a TIMS device relies on selecting the E gradient and by performing stepwise elutions into the mass analyzers by reducing the voltage range within a single trapping step. Multistep elutions are typically used when TIMS is coupled to fast-acquisition-rate MS analyzers (e.g., TOF-MS). However, when TIMS is coupled to slower MS analyzers (e.g., FT-ICR MS), TIMS’s operation is changed to single-step elutions (from a small E gradient that defines the IMS resolution) and sequential scanning of the E gradient range. That is, each isomer/conformer eluting from the IMS cell can be described by a E ± ΔE value; the smaller the ΔE value, the higher the IMS resolution and accuracy to determine the K0 ± Δ K0 value. This mode of operation is called selected accumulation trapped ion mobility spectrometry (SA-TIMS). SA-TIMS operation was controlled using in-house software, written in National Instruments Lab VIEW (2012, v. 12.0f3), and synchronized with the FT-ICR MS acquisition program. IMS separation was performed using nitrogen as a bath gas at ca. 300 K, and the gas flow velocity was controlled by the pressure difference between entrance funnel P1 = 2.6 mbar, and the exit funnel P2 = 1.3 mbar. P1 and P2 values were held constant for all experiments. The same RF (2020 kHz and 240Vpp) was applied to all electrodes including the entrance funnel, the mobility separating section, and the exit funnel. An electrospray ionization source (Apollo II ESI design, Bruker Daltonics, Inc., MA) was used for all the analyses. The IMS cell was operated using a fill/trap/elute/quench sequence of 250–600/90/25/10 ms, using an average of 20 IMS scans per MS spectrum and a voltage difference across the ΔE gradient of 0.5–1.0 V. Under these conditions, the average IMS resolution was 70–120. MS acquisition was optimized for highest transmission in the 200–600 m/z in the 7T Solarix FT-ICR MS spectrometer (Bruker Daltonics Inc., MA). MS spectra were acquired at 1–16 MW using half-sin apodization followed by fast-Fourier transform and broadband phase correction into absorption mode spectra with resolutions of R ~ 75–730 K at 400 m/z. External IMS and MS calibration was performed utilizing Agilent ESI-ToF tuning mix (Tunemix, G2421A, Agilent Technologies, Santa Clara, CA).
Candidate structures were proposed for each molecular ion of interest observed in the IMS-FT-ICR MS experiments.50 Theoretical ion-neutral collision cross sections were calculated using MOBCAL version for nitrogen51,52 and IMoS (v1.04b)53–55 software with a bath gas at ca. 300 K. In the IMoS calculations, 100 total rotations were performed using the diffuse hard sphere scattering method with a Maxwell distribution. Partial atomic charges were calculated using the Merz–Singh–Kollman scheme constrained to the molecular dipole moment.,56,57 All optimized geometries and partial atomic charges are provided in the Supporting Information.
RESULTS AND DISCUSSION
One of the main analytical challenges during targeted analysis in complex samples is the presence of isobaric and isomeric interferences. Ultrahigh-resolution MS analysis will routinely detect multiple molecular components at the level of nominal mass during the analysis of complex mixtures. For example, the FT-ICR MS analysis of EDC compounds from a complex mixture will typically yield 8–10 peaks per nominal mass (see Figure 1). Closer inspection of the FT-ICR MS data shows that chemical formulas for the EDC compounds (see Table 1) and the SRFA components (see Supporting Material) can be assigned with sub ppm accuracy. When FT-ICR MS analysis is complemented with orthogonal separations SA-TIMS-FTMS, an increase in peak capacity of 2–10-fold is observed per nominal mass; that is, multiple molecular signatures are observed in the 2D IMS-FTMS plot per mass signal. This result is a consequence of the structural diversity and complexity of the sample. For example, molecular compounds from the environmental matrix (SRFA standard) can be described by the generic formula CxHyN0–3O0–15S0–1, where 75% are highly conjugated oxygen containing compounds (O1–O15, see Figure S1).7–13 Inspection of the double bond equivalents (DBE) as a function of the carbon number for the oxygen containing series (CxHyO1–15) showed the large structural diversity expected from fulvic acids (see Figure S2)
Figure 1.
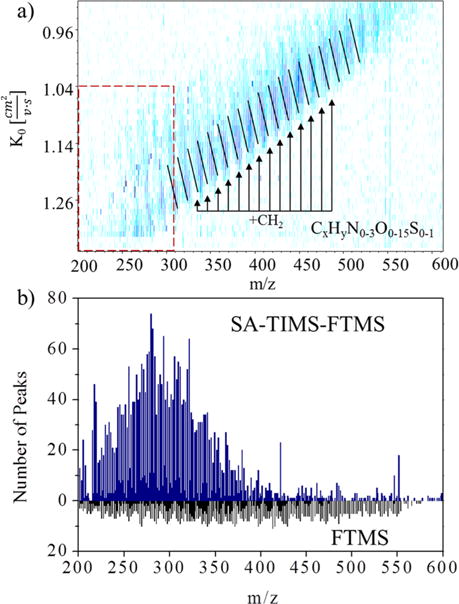
(a) 2D-IMS-FTMS contour plot of the complex mixture containing EDC compounds (dashed square) and SRFA standard. (b) Number of peaks identified at the nominal mass in SA-TIMS-FTMS and FTMS analysis.
Table 1.
Experimental SA-TIMS-FTMS and Theoretical Mass and Mobility Values for Bisphenol A, Diethylstilbestrol, Estrone, Hexestrol, α-Estradiol, and 17-α-Ethynylestradiol
| experimental
|
theoretical
|
|||||||
|---|---|---|---|---|---|---|---|---|
| exptl m/z | ion formula | theoretical mass | error (ppm) | name | K0 [cm2/v·s] | CCS [ ] |
MOBCAL TM CCS [ ] |
IMoS DHSS CCS [ ] |
| 227.10766 | C15H15O2 | 227.10775 | −0.39 | bisphenol A | 1.305 | 162 | 161 | 161 |
| 267.13924 | C18H19O2 | 267.13905 | −0.25 | diethylstilbestrol | 1.227 | 171 | 172(E) | 172(E) |
| 1.203 | 175 | 177(Z) | 175(Z) | |||||
| 269.15484 | C18H21O2 | 269.15470 | 0.09 | estrone | 1.215 | 174 | 169 | 172 |
| 269.15484 | C18H21O2 | 269.15470 | 0.09 | hexestrol | 1.191 | 177 | 177 | 180 |
| 271.17037 | C18H23O2 | 271.17035 | −0.05 | α-estradiol | 1.203 | 175 | 177 | 176 |
| 295.17011 | C20H23O2 | 295.17035 | 0.82 | 17-α-ethynylestradiol | 1.152 | 182 | 183 | 182 |
Closer inspection to the IMS-FTMS data shows that separation and identification of the EDC targeted compounds from other interferences was achieved (see Figure 2a). In particular, complementary analysis using reference standards of the EDC compounds permitted the molecular confirmation by exact mass (sub ppm) and by mobility (<3%). In the example shown, two types of interferences were considered: (i) isobaric interferences between the EDC compound and the SRFA matrix (e.g., bisphenol A, α-estradiol, and 17-α-ethynylestradiol), and (ii) simultaneous isobaric and isomeric between two EDC compounds and the SRFA matrix (e.g., estrone and hexestrol and (E)- and (Z)-diethylstilbestrol). The high resolution of the SAIMS (RIMS ~ 70–120) permitted baseline separation in both scenarios (see Figure 2 b). For example, inspection of the IMS projection of the structural isomers estrone and hexestrol (C18H22O2, δ: 0.09 ppm) showed two baseline-resolved peaks at K0 = 1.215 and 1.191 cm2 V−1 s−1, respectively. Analogously, IMS projection of diethylstilbestrol (E) and (Z) structural isomers (C15H19O2, δ: 0.25 ppm) showed two baseline-resolved peaks corresponding to the two cis/trans isomers with K0 = 1.227 and 1.203 cm2 V−1 s−1, respectively. Biological activity for endocrine disruptors varies depending on the structural isomers which can be separated.58,59
Figure 2.
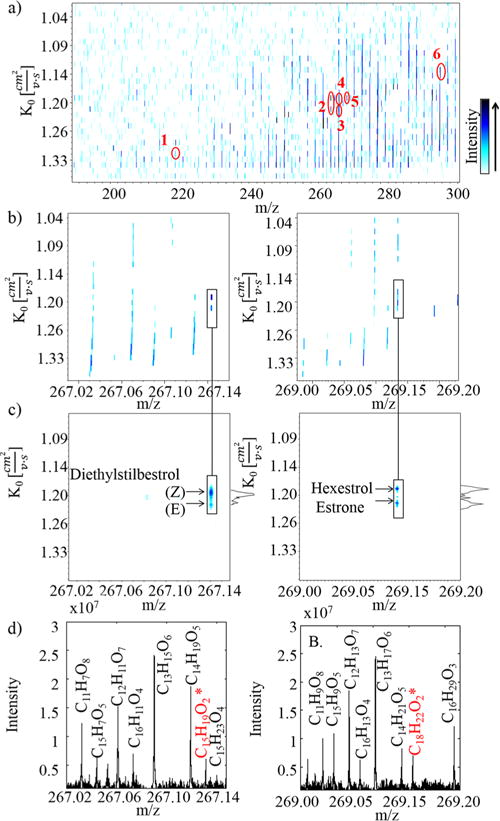
(a) 2D-IMS-FTMS contour plot of the complex organic mixture containing EDC compounds and SRFA standard. Notice the separation of (1) bisphenol A, (2) diethylstilbestrol, (3) estrone, (4) hexestrol, (5) α-estradiol, (6) 17-α-ethynylestradiol from the SRFA matrix. 2D-IMS-FTMS contour plot at the nominal mass for the structural isomers of (E)- and (Z)-diethylstilbestrol (left) and estrone and hexestrol (right) in (b) the complex sample, (c) the reference standards, and (d) the respective FTMS projections (* denotes the EDC formula).
Beside the high mobility resolution that can be achieved using SA-TIMS allowing direct identification with reference materials, it is a method of operation that also allows for direct mobility measurements.24,25,47–49 This translates into the additional potential for targeted EDC molecular assignment based on mobility values of candidate structures (see Table 1 and details on the EDC candidate structures on the Supporting Information). Comparison of experimental and theoretical mobility values for the targeted EDC compounds showed a good agreement (<3% error). Both theoretical CCS calculators yielded similar results and in good correspondence with the experimental trends. This alternative approach increases the practical value of SAIMS-FT-ICR MS when reference standards are not available.
CONCLUSIONS
The use of a novel variant SA-TIMS-FTMS for complementary, high-resolution mobility and ultrahigh-resolution mass separations is illustrated for targeted analysis of endocrine disrupting chemicals in a complex matrix. It was shown that targeted identification can be achieved based on accurate mobility and exact mass measurements and complemented with reference standard measurements and/or theoretical calculations. In particular, SA-TIMS high mobility resolution (RIMS ~ 75–120) allowed the separation of chemical interferences from the sample matrix as well as the separation of EDC structural isomers. The use of theoretical calculations may significantly reduce the cost of targeted EDC analysis and permits the assignment of molecular structures with a high degree of confidence (<3% error).
Supplementary Material
Acknowledgments
This work was supported by the National Institute of Health (Grant No. R00GM106414). The authors wish to acknowledge Dr. Desmond Kaplan from Bruker Daltonics, Inc. for the development of IMS-FT-ICR MS acquisition software. The authors would like to thank Dr. Abuzar Kabir (Florida International University), Dr. Alexander Mebel (Florida International University), and Dr. Carlos Larriba-Andaluz for helpful discussions during the theoretical calculations. The authors also acknowledge computing resources provided by the Instructional & Research Computing Center (IRCC) at Florida International University.
Footnotes
Supporting Information
Additional information as noted in the text. This material is available free of charge via the Internet at http://pubs.acs.org.
Notes
The authors declare no competing financial interest.
References
- 1.Dwivedi P, Schultz AJ, HH H., Jr Int J Mass Spectrom. 2010;298:78. doi: 10.1016/j.ijms.2010.02.007. [DOI] [PMC free article] [PubMed] [Google Scholar]
- 2.Wyttenbach T, Batka JJ, Gidden J, Bowers MT. Int J Mass Spectrom. 1999;193:143. [Google Scholar]
- 3.Busico F, Moretti G, Cartoni GP, Rosati F. J High Res Chromat. 1992;15:94. [Google Scholar]
- 4.Casademont G, Pérez B, García Regueiro JA. J Chromat B. 1996;686:189. doi: 10.1016/s0378-4347(96)00211-3. [DOI] [PubMed] [Google Scholar]
- 5.Daeseleire E, Vandeputte R, Van Peteghem C. Analyst. 1998;123:2595. doi: 10.1039/a805164j. [DOI] [PubMed] [Google Scholar]
- 6.Huang C-H, Sedlak DL. Environ Toxicol Chem. 2001;20:133. [PubMed] [Google Scholar]
- 7.Witt M, Fuchser J, Koch BP. Anal Chem. 2009;81:2688. doi: 10.1021/ac802624s. [DOI] [PubMed] [Google Scholar]
- 8.Koch BP, Ludwichowski K-U, Kattner G, Dittmar T, Witt M. Marine Chemistry. 2008;111:233. [Google Scholar]
- 9.Rostad CE, Leenheer JA. Anal Chim Acta. 2004;523:269. [Google Scholar]
- 10.Kujawinski EB, Hatcher PG, Freitas MA. Anal Chem. 2001;74:413. doi: 10.1021/ac0108313. [DOI] [PubMed] [Google Scholar]
- 11.Brown TL, Rice JA. Anal Chem. 1999;72:384. doi: 10.1021/ac9902087. [DOI] [PubMed] [Google Scholar]
- 12.Fievre A, Solouki T, Marshall AG, Cooper WT. Energy Fuels. 1997;11:554. [Google Scholar]
- 13.Stenson AC, Marshall AG, Cooper WT. Anal Chem. 2003;75:1275. doi: 10.1021/ac026106p. [DOI] [PubMed] [Google Scholar]
- 14.Gillig KJ, Russell DH. WO0165589. The Texas A & M University System: College Station, TX; Patent. 2001 Sep 7;:36.
- 15.Gillig KJ, Ruotolo BT, Stone EG, Russell DH. Int J Mass Spectrom. 2004;239:43. [Google Scholar]
- 16.Silveira JA, Gamage CM, Blase RC, Russell DH. Int J Mass Spectrom. 2010;296:36. doi: 10.1016/j.ijms.2009.10.009. [DOI] [PMC free article] [PubMed] [Google Scholar]
- 17.Guo Y, Wang J, Javahery G, Thomson BA, Siu KWM. Anal Chem. 2004;77:266. doi: 10.1021/ac048974n. [DOI] [PubMed] [Google Scholar]
- 18.Koeniger SL, Merenbloom SI, Valentine SJ, Jarrold MF, Udseth HR, Smith RD, Clemmer DE. Anal Chem. 2006;78:4161. doi: 10.1021/ac051060w. [DOI] [PubMed] [Google Scholar]
- 19.Kurulugama RT, Nachtigall FM, Lee S, Valentine SJ, Clemmer DE. J Am Soc Mass Spectrom. 2009;20:729. doi: 10.1016/j.jasms.2008.11.022. [DOI] [PMC free article] [PubMed] [Google Scholar]
- 20.Glaskin RS, Valentine SJ, Clemmer DE. Anal Chem. 2010;82:8266. doi: 10.1021/ac1017474. [DOI] [PubMed] [Google Scholar]
- 21.Kolakowski BM, Mester Z. Analyst. 2007;132:842. doi: 10.1039/b706039d. [DOI] [PubMed] [Google Scholar]
- 22.Pringle SD, Giles K, Wildgoose JL, Williams JP, Slade SE, Thalassinos K, Bateman RH, Bowers MT, Scrivens JH. Int J Mass Spectrom. 2007;261:1. [Google Scholar]
- 23.Bush MF, Hall Z, Giles K, Hoyes J, Robinson CV, Ruotolo BT. Anal Chem. 2010;82:9557. doi: 10.1021/ac1022953. [DOI] [PubMed] [Google Scholar]
- 24.Hernandez DR, DeBord JD, Ridgeway ME, Kaplan DA, Park MA, Fernandez-Lima F. Analyst. 2014;139:1913. doi: 10.1039/c3an02174b. [DOI] [PMC free article] [PubMed] [Google Scholar]
- 25.Fernandez-Lima FA, Kaplan DA, Park MA. Rev Sci Instrum. 2011;82:126106. doi: 10.1063/1.3665933. [DOI] [PMC free article] [PubMed] [Google Scholar]
- 26.Fernandez-Lima F, Kaplan D, Suetering J, Park M. Int J Ion Mobil Spec. 2011;14:93. doi: 10.1007/s12127-011-0067-8. [DOI] [PMC free article] [PubMed] [Google Scholar]
- 27.Dugourd P, Hudgins RR, Clemmer DE, Jarrold MF. Rev Sci Instrum. 1997;68:1122. [Google Scholar]
- 28.Merenbloom SI, Glaskin RS, Henson ZB, Clemmer DE. Anal Chem. 2009;81:1482. doi: 10.1021/ac801880a. [DOI] [PMC free article] [PubMed] [Google Scholar]
- 29.Kemper PR, Dupuis NF, Bowers MT. Int J Mass Spectrom. 2009;287:46. [Google Scholar]
- 30.Blase RC, Silveira JA, Gillig KJ, Gamage CM, Russell DH. Int J Mass Spectrom. 2011;301:166. [Google Scholar]
- 31.May J, Russell D. J Am Soc Mass Spectrom. 2011;22:1134. doi: 10.1007/s13361-011-0148-2. [DOI] [PubMed] [Google Scholar]
- 32.Kemper PR, Bowers MT. J Am Soc Mass Spectrom. 1990;1:197. [Google Scholar]
- 33.Wu C, Siems WF, Asbury GR, Hill HH. Anal Chem. 1998;70:4929. doi: 10.1021/ac980414z. [DOI] [PubMed] [Google Scholar]
- 34.Liu Y, Clemmer DE. Anal Chem. 1997;69:2504. doi: 10.1021/ac9701344. [DOI] [PubMed] [Google Scholar]
- 35.Jarrold MF, Constant VA. Phys Rev Lett. 1991;67:2994. doi: 10.1103/PhysRevLett.67.2994. [DOI] [PubMed] [Google Scholar]
- 36.Fernandez-Lima FA, Becker C, McKenna AM, Rodgers RP, Marshall AG, Russell DH. Anal Chem. 2009;81:9941. doi: 10.1021/ac901594f. [DOI] [PubMed] [Google Scholar]
- 37.Fasciotti M, Lalli PM, Klitzke CF, Corilo YE, Pudenzi MA, Pereira RCL, Bastos W, Daroda RJ, Eberlin MN. Energy Fuels. 2013;27:7277. [Google Scholar]
- 38.Robinson EW, Williams ER. J Am Soc Mass Spectrom. 2005;16:1427. doi: 10.1016/j.jasms.2005.04.007. [DOI] [PMC free article] [PubMed] [Google Scholar]
- 39.Robinson EW, Garcia DE, Leib RD, Williams ER. Anal Chem. 2006;78:2190. doi: 10.1021/ac051709x. [DOI] [PMC free article] [PubMed] [Google Scholar]
- 40.Robinson EW, Leib RD, Williams ER. J Am Soc Mass Spectrom. 2006;17:1470. doi: 10.1016/j.jasms.2006.06.027. [DOI] [PMC free article] [PubMed] [Google Scholar]
- 41.Robinson EW, Sellon RE, Williams ER. Int J Mass Spectrom. 2007;259:87. doi: 10.1016/j.ijms.2006.09.011. [DOI] [PMC free article] [PubMed] [Google Scholar]
- 42.Saba J, Bonneil E, Pomiès C, Eng K, Thibault P. J Prot Res. 2009;8:3355. doi: 10.1021/pr801106a. [DOI] [PubMed] [Google Scholar]
- 43.Xuan Y, Creese AJ, Horner JA, Cooper HJ. Rapid Commun Mass Spectrom. 2009;23:1963. doi: 10.1002/rcm.4101. [DOI] [PubMed] [Google Scholar]
- 44.Bridon G, Bonneil E, Muratore-Schroeder T, Caron-Lizotte O, Thibault P. J Prot Res. 2011;11:927. doi: 10.1021/pr200722s. [DOI] [PubMed] [Google Scholar]
- 45.Schrader W, Xuan Y, Gaspar A. European J Mass Spectrom. 2014;20:43. doi: 10.1255/ejms.1263. [DOI] [PubMed] [Google Scholar]
- 46.Flanagan LA. 5872357 A. Hewlett-Packard Company: Palo Alto, CA; US Patent. 1999 Feb 16;:19.
- 47.Fernandez-Lima FA, Kaplan DA, Suetering J, Park MA. Int J Ion Mobil Spec. 2011;14:93. doi: 10.1007/s12127-011-0067-8. [DOI] [PMC free article] [PubMed] [Google Scholar]
- 48.Schenk ER, Ridgeway ME, Park MA, Leng F, Fernandez-Lima F. Anal Chem. 2014;86:1210. doi: 10.1021/ac403386q. [DOI] [PMC free article] [PubMed] [Google Scholar]
- 49.Schenk ER, Mendez V, Landrum JT, Ridgeway ME, Park MA, Fernandez-Lima F. Anal Chem. 2014;86:2019. doi: 10.1021/ac403153m. [DOI] [PMC free article] [PubMed] [Google Scholar]
- 50.Fernandez-Lima FA, Wei H, Gao YQ, Russell DH. J Phys Chem A. 2009;113:8221. doi: 10.1021/jp811150q. [DOI] [PubMed] [Google Scholar]
- 51.Campuzano I, Bush MF, Robinson CV, Beaumont C, Richardson K, Kim H, Kim HI. Anal Chem. 2011;84:1026. doi: 10.1021/ac202625t. [DOI] [PubMed] [Google Scholar]
- 52.Kim HI, Kim H, Pang ES, Ryu EK, Beegle LW, Loo JA, Goddard WA, Kanik I. Anal Chem. 2009;81:8289. doi: 10.1021/ac900672a. [DOI] [PMC free article] [PubMed] [Google Scholar]
- 53.Larriba C, Hogan CJ. J Phys Chem A. 2013;117:3887. doi: 10.1021/jp312432z. [DOI] [PubMed] [Google Scholar]
- 54.Larriba C, Hogan CJ., Jr J Comput Phys. 2013;251:344. [Google Scholar]
- 55.Ouyang H, Larriba-Andaluz C, Oberreit D, Hogan C., Jr J Am Soc Mass Spectrom. 2013;24:1833. doi: 10.1007/s13361-013-0724-8. [DOI] [PubMed] [Google Scholar]
- 56.Singh UC, Kollman PA. J Comput Chem. 1984;5:129. [Google Scholar]
- 57.Besler BH, Merz KM, Kollman PA. J Comput Chem. 1990;11:431. [Google Scholar]
- 58.Winkler VW, Nyman MA, Egan RS. Steroids. 1971;17:197. doi: 10.1016/s0039-128x(71)80124-1. [DOI] [PubMed] [Google Scholar]
- 59.Katzenellenbogen JA, Carlson KE, Katzenellenbogen BS. J Steroid Biochem. 1985;22:589. doi: 10.1016/0022-4731(85)90210-9. [DOI] [PubMed] [Google Scholar]
Associated Data
This section collects any data citations, data availability statements, or supplementary materials included in this article.