

Supplemental Digital Content is available in the text
Keywords: development assistance for health, health financing, HIV/AIDS, human immunodeficiency virus, millennium development goals
Objective:
To better understand the global response to HIV/AIDS, this study tracked development assistance for HIV/AIDS at a granular, program level.
Methods:
We extracted data from the Institute for Health Metrics and Evaluation's Financing Global Health 2015 report that captured development assistance for HIV/AIDS from 1990 to 2015 for all major bilateral and multilateral aid agencies. To build on these data, we extracted additional budget data, and disaggregated development assistance for HIV/AIDS into nine program areas, including prevention, treatment, and health system support.
Results:
Since 2000, $109.8 billion of development assistance has been provided for HIV/AIDS. Between 2000 and 2010, development assistance for HIV/AIDS increased at an annualized rate of 22.8%. Since 2010, the annualized rate of growth has dropped to 1.3%. Had development assistance for HIV/AIDS continued to climb after 2010 as it had in the previous decade, $44.8 billion more in development assistance would have been available for HIV/AIDS. Since 1990, treatment and prevention were the most funded HIV/AIDS program areas receiving $24.6 billion and $22.7 billion, respectively. Since 2010, these two program areas and HIV/AIDS health system strengthening have continued to grow, marginally, with majority support from the US government and the Global Fund. An average of $252.9 of HIV/AIDS development assistance per HIV/AIDS prevalent case was disbursed between 2011 and 2013.
Conclusion:
The scale-up of development assistance for HIV/AIDS from 2000 to 2010 was unprecedented. During this period, international donors prioritized HIV/AIDS treatment, prevention, and health system support. Since 2010, funding for HIV/AIDS has plateaued.
Introduction
As the HIV/AIDS pandemic spread throughout the 1980s and 1990s, prevalence was concentrated in many low and middle-income countries [1]. In these countries, there were relatively few resources available to effectively counter the spread [2,3]. Between 1990 and 2000, the number of people living with HIV or acquired immunodeficiency syndrome (HIV/AIDS) in low and middle-income countries nearly tripled [2]. During this same period, the number of deaths caused by AIDS in those same countries more than quadrupled.
The rapid evolution of the epidemic and the concentration in poor countries propelled HIV/AIDS high on the global development agenda. Enshrined in Millennium Development Goal (MDG) 6, HIV/AIDS was identified as one of the top health priorities at the United Nations Millennium Summit in 2000 [4]. Shortly thereafter, many key international donors increased funding for the expansion or genesis of several major international organizations focusing specifically on combating HIV/AIDS. The US President's Emergency Plan for AIDS Relief (PEPFAR), the Global Fund to Fight AIDS, Tuberculosis, and Malaria (the Global Fund) and the Joint United Nations Program on HIV/AIDS (UNAIDS) stand as three major organizations that expanded or were created.
Despite the focus on preventing and treating HIV/AIDS, little is known about the international resources funding these efforts. The major sources of HIV/AIDS resource tracking, including the National AIDS Spending Assessments and the new System of Health Accounts, provide valuable information about financing flows, but are limited by challenges revolving around timeliness, level of reporting, and comparability [5–7]. To better understand international funding for HIV/AIDS, this study sets out to systematically track development assistance from all major international development agencies and split this spending into nine program areas that describe how the resources were used. This research highlights the changing priorities and investments of the international community over the last 26 years.
Methods
Development assistance for health (DAH) is defined as the in-kind and financial contributions for maintaining or improving health in low- and middle-income countries. We extracted estimates of DAH for HIV/AIDS from the Institute for Health Metrics and Evaluation's (IHME) 2015 ‘Financing Global Health’ report. This report systematically tracked DAH for nine major health focus areas, including HIV/AIDS. The research applied systematic corrections to account for poor reporting, inconsistencies across time, and potential double counting. Previous iterations of the ‘Financing Global Health’ report disaggregated DAH targeting HIV/AIDS by source of funds, intermediary channels of assistance, and country recipients, but not by program areas [8–11]. Sources of DAH are the national treasuries or private funders which provided resources, whereas intermediary channels are public and private development agencies, which actually disburse DAH, such as PEPFAR, the Global Fund, UNAIDS, and nongovernmental organizations.
Building upon IHME's research, we used key word searches of project titles and descriptions and project-level budget data for PEPFAR, the Global Fund, and UNAIDS to divide development assistance for HIV/AIDS into nine program areas: treatment, prevention (excluding prevention of mother-to-child-transmission), prevention of mother-to-child-transmission (PMTCT), orphans and vulnerable children, care and support, counseling and testing, health system strengthening (HSS), HIV/tuberculosis, and unidentified. Additional detail on methods and how development assistance for HIV/AIDS was split into program areas can be found in the supplementary documentation. To compare development assistance for HIV/AIDS to the number of HIV/AIDS prevalent cases, HIV/AIDS prevalence estimates were extracted from the Global Burden of Disease 2013 Study [2].
Results
In 1990, an estimated $332.0 million US dollars in DAH was allocated to combat HIV/AIDS. By 2010, annual disbursement of development assistance for HIV/AIDS reached $10.1 billion. Since then, development assistance for HIV/AIDS has remained roughly constant, with $10.8 billion disbursed in 2015. Most importantly, there was tremendous growth in the amount of development assistance for HIV/AIDS disbursed between 2000 and 2010. The annualized growth rate during these years was 22.8%. However, development assistance for HIV/AIDS has since grown at a substantially reduced rate of 1.3%. This change is more severe than the stagnation that has occurred in other health focus areas. Development assistance for child health, for instance, grew 4.7% annually between 2010 and 2015 [12].
Figure 1 presents the total development assistance for HIV/AIDS from 1990 to 2015 by program area. This shows that treatment, prevention, and HSS made up the majority of development assistance for HIV, estimated at $24.6 billion, $22.7 billion, and $17.9 billion, respectively, since 1990. However, across time, there has been some changes, in which program areas were prioritized. In 1990, prevention was prioritized. From 1990 through 2004, 24.9% of development assistance for HIV/AIDS was invested in prevention. However, from 2005 onward, treatment was the most substantial. In 2015, 18.3% of the $10.8 billion assistance for HIV/AIDS was focused on HSS. Development assistance for PMTCT and combined treatment of HIV/tuberculosis grew most rapidly since 2000, at 44.9 and 37.4% annually, respectively.
Fig. 1.
Development assistance for health for HIV/AIDS by program area, 1990–2015.
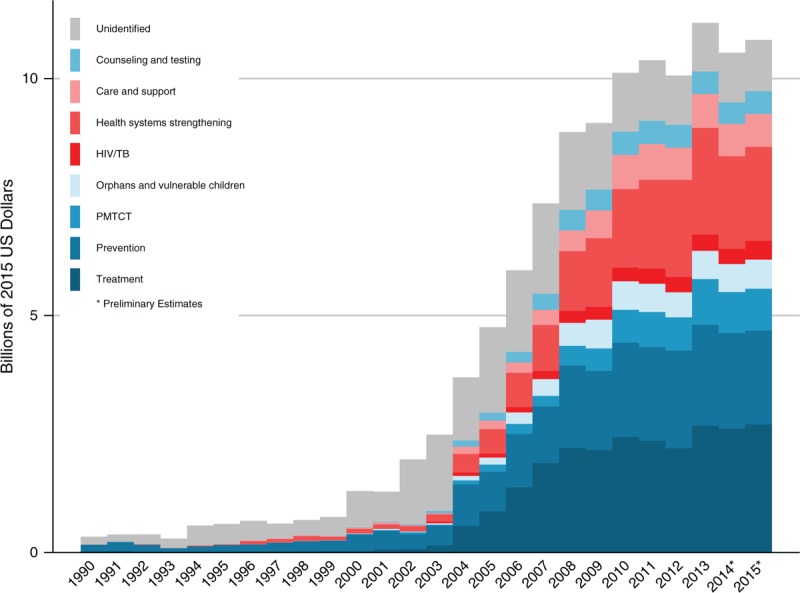
HIV/AIDS focused development assistance for health in billions of 2015 US dollars by program area from 1990 to 2015. ‘Unidentified’ corresponds to HIV/AIDS development assistance for which we do not have granular enough project-level information to parse across the HIV program areas. 2014 and 2015 are preliminary estimates.
The US government is the largest source and channel of development assistance for HIV/AIDS. As a source, the US government provided $67.4 billion (58.5% of the total) cumulatively between 1990 and 2015. US agencies, led predominately by PEPFAR, channeled $44.8 billion for HIV/AIDS. These resources primarily targeted treatment, prevention, and HSS. Between 1990 through 2015, the US government increased more than any other channel, with an annualized growth rate of 16.4%. However, Fig. 2 shows that since 2010, US agencies’ support for HIV/AIDS grew at less than 2% annually. Although this growth is substantially reduced, the US government was one of only two sources to provide more in 2015 than it did in 2010.
Fig. 2.
Changes in HIV/AIDS development assistance for health by source, channel, and program area, 2010–2015.
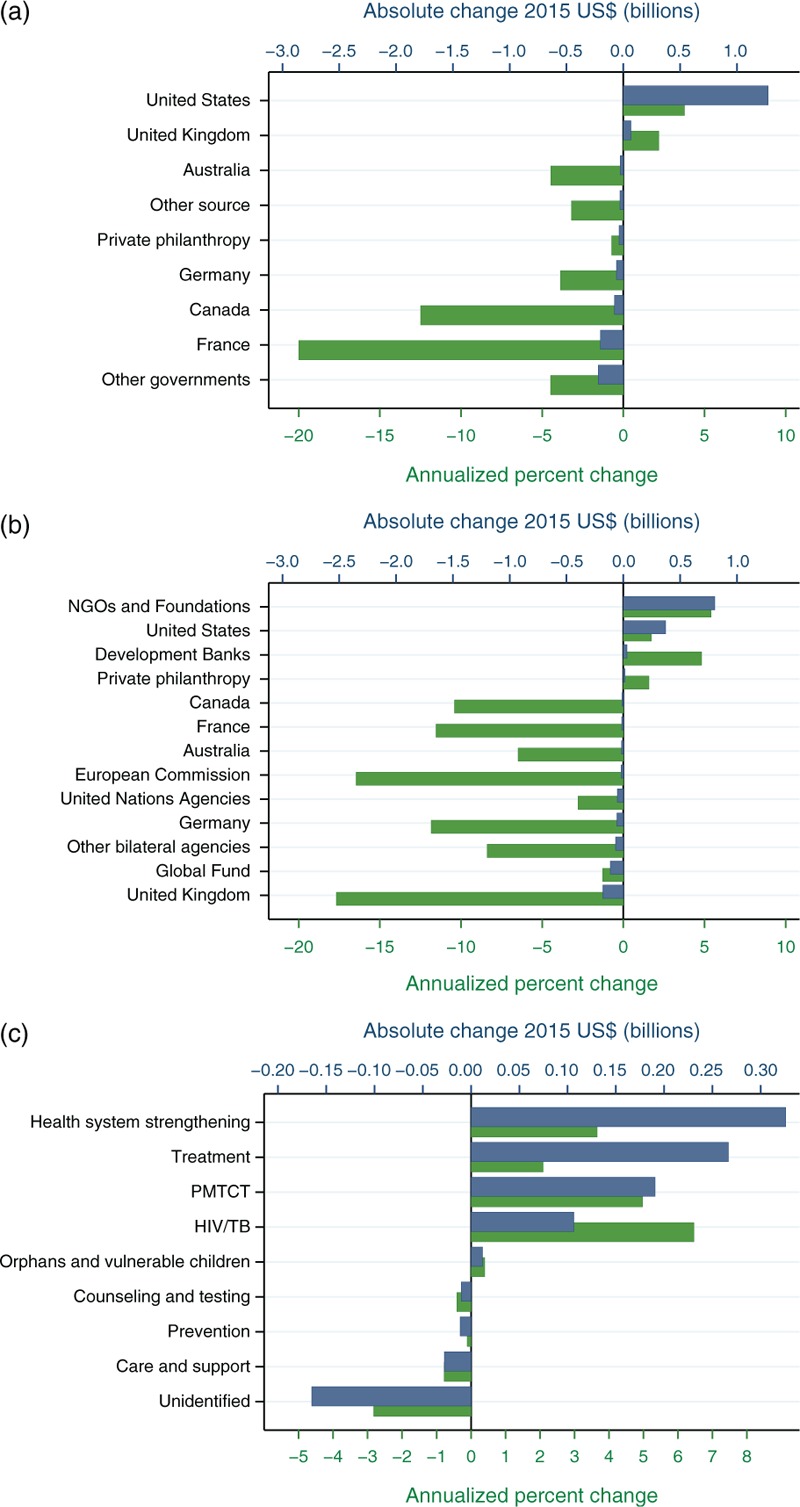
(a) Change in DAH for HIV/AIDS by source between the years of 2010 and 2015. The blue bars are the absolute change of development assistance for HIV/AIDS in billions of 2015 US dollars during this time period and relate to the top horizontal axis. The green bars represent the annual percentage change (growth) during this time period and relate to the bottom horizontal axis. (b) Change in DAH for HIV/AIDS by major channel of assistance between the years of 2010 and 2015. The blue bars are the absolute change of development assistance for HIV/AIDS in billions of 2015 US dollars during this time period and relate to the top horizontal axis. The green bars represent the annual percentage change during this time period and relate to the bottom horizontal axis. (c) Change in DAH for HIV/AIDS by program area between the years of 2010 and 2015. The blue bars are the absolute change of development assistance for HIV/AIDS in billions of 2015 US dollars during this time period and relate to the top horizontal axis. The green bars represent the annual percentage change during this time period and relate to the bottom horizontal axis. DAH, development assistance for health.
The United Kingdom was the second largest source, expending $6.7 billion from 1990 to 2015. As a channel, the UK government prioritized prevention, treatment, and counseling and testing, in addition to providing some funds which were unallocable to a program area. Along with the United States, the United Kingdom was the only other source of DAH to expand its support of HIV/AIDS between 2010 and 2015.
The German government and the Bill and Melinda Gates Foundation (the Gates Foundation), provided the third and fourth most amounts of development assistance for HIV/AIDS. The German government provided $3.5 billion since 1990, whereas the Gates Foundation provided $4.2 billion since it started providing DAH in 1999.
The agglomeration of nongovernmental organizations and foundations (excluding the Gates Foundation) make up the second largest channel of development assistance for HIV/AIDS. Together these organizations channeled $29.2 billion of development assistance for HIV/AIDS. Since 2010, these organizations have increased the most of any channel of assistance at more than 5% annualized change and totaling $17.5 billion.
The Global Fund was the largest single nonpublic intermediary channel, disbursing $18.3 billion for HIV/AIDS efforts since its inception in 2002. The Global fund has prioritized funding for HSS, treatment, and prevention. Since 2010, the Global Fund decreased the development assistance for HIV/AIDS that it disbursed by 1.3% annually.
Figure 2 also shows that the program areas of HSS, treatment, and PMTCT continued to be prioritized by the international community during the recent period of stagnation. Care and support, prevention, and counseling and testing received fewer funds from donors. As reporting improved, unidentified resources that before could not be matched to a program area decreased.
Countries that received the most development assistance for HIV/AIDS throughout the study period were South Africa, Kenya, and Nigeria, receiving $806.6, $684.3, and $600.2 million, respectively. Across all recipient countries, $252.9 of development assistance for HIV/AIDS per HIV/AIDS prevalent case was provided.
Discussion
Soon after the establishment of the MDGs, development assistance for HIV/AIDS grew at an unprecedented rate with new initiatives and organizations channeling the majority of these funds. With estimates of program area spending, we are now able to see how the increases in funding translated into action on the ground in developing countries. When the HIV/AIDS epidemic first emerged, development assistance partners focused on prevention and HSS. Prevention, including PMTCT, constituted 28.1% of development assistance for HIV/AIDS in 2000. However, since 2005, treatment has superseded prevention as the most funded program area, receiving $23.5 billion or 23.7% of development assistance for HIV/AIDS. This shift is potentially because of the increase in evidence of the impact of HIV treatment, in addition to growing evidence of the value of treatment as prevention [2,13]. Treatment is largely supported by PEPFAR, which is mandated by congress to meet certain allocative guidelines and earmarks; including 50% if its resources for placing individuals in care and on treatment [14–17].
Despite substantial growth in funding, estimates from recent years have shown that the disbursement of development assistance for HIV/AIDS has plateaued. Had HIV/AIDS funding continued to grow since 2010 as it had in the prior decade, $44.8 billion of additional resources would have been available to combat the epidemic. Addressing the unfinished agenda of HIV/AIDS will require innovative financing mechanisms to ensure efficient spending as well as to stimulate growth in the resources raised from both domestic governments and donors. For both identifying additional resources for HIV/AIDS and identifying efficient programs to invest in, measurement is key. More than ever, tracking spending from donors and domestic governments is essential. Knowing where and how those resources are being spent is paramount for identifying HIV/AIDS financing gaps. In addition, tepid growth from donors also means that every dollar spent needs to be spent to maximize effectiveness. Tracking spending for key, granular program areas can facilitate ongoing analyses to measure and compare program effectiveness. Up-to-date, comprehensive, and comparable resource tracking can be a key to empowering policymakers to make effective and efficient decisions to fight the ongoing HIV/AIDS epidemic.
Data availability and quality are the primary limitations in tracking development assistance for HIV/AIDS. Some data sources only provided audited statements up to 2013, so we used trends across time and budgeted data to make estimates for 2014 and 2015. These estimates should be considered preliminary accordingly. Because of this, we did not track development assistance to recipient countries for these years. Intermediary channels provide varying levels of detail, which, in some cases, limited our ability to track every dollar to a particular program area. Because of this, there was some development assistance for HIV/AIDS for which the program area remained unidentified. A final limitation is that we do not track government health spending for HIV/AIDS in this study. Government health spending is a major component in promoting health, especially in upper-middle-income countries.
Conclusion
In conclusion, over the last 26 years, the HIV/AIDS global health community has grown substantially. With $115.1 billion of development assistance, global health organizations funded interventions that drove down the cost of HIV prevention and treatment, strengthened the capacity of health systems, and improved the lives of millions of people living with HIV/AIDS around the world [18]. Up-to-date estimates of development assistance for HIV/AIDS, as well as other estimates capturing the efforts of the international community and domestic governments at a granular level, are key to evaluating current allocations and effectiveness.
Acknowledgements
The authors are grateful to the Bill & Melinda Gates Foundation for financial support.
M.T.S. and M.B. wrote the first draft of the article. J.L.D. managed the research project. L.S. and M.B. collected data and created databases. C.J.L.M., J.L.D., L.S., A.H., M.B., and M.T.S. contributed to developing the analytical methods. J.L.D. and M.T.S. wrote the final draft. All authors reviewed and contributed to the interpretation of results and the final draft.
Conflicts of interest
There are no conflicts of interest.
Supplementary Material
Footnotes
Supplemental digital content is available for this article. Direct URL citations appear in the printed text and are provided in the HTML and PDF versions of this article on the journal's Website (http://www.AIDSonline.com).
References
- 1.Shao Y, Williamson C. The HIV-1 epidemic: low- to middle-income countries. Cold Spring Harb Perspect Med 2012; 2:1–17. [DOI] [PMC free article] [PubMed] [Google Scholar]
- 2.Murray CJL, Ortblad KF, Guinovart C, Lim SS, Wolock TM, Roberts DA, et al. Global, regional, and national incidence and mortality for HIV, tuberculosis, and malaria during 1990-2013: a systematic analysis for the Global Burden of Disease Study 2013. Lancet Lond Engl 2014; 384:1005–1070. [DOI] [PMC free article] [PubMed] [Google Scholar]
- 3.UNAIDS. AIDSinfo. http://aidsinfo.unaids.org/. [Accessed 16 February 2016] [Google Scholar]
- 4.United Nations. United Nations Millennium Declaration. 2000. http://www.un.org/millennium/declaration/ares552e.htm. [Accessed 18 December 2015] [Google Scholar]
- 5.NASA country reports. http://www.unaids.org/en/dataanalysis/knowyourresponse/nasacountryreports. [Accessed 28 December 2015] [Google Scholar]
- 6.Health Systems 20/20 Project, the Joint United Nations Programme for HIV/AIDS (UNAIDS), World Health Organization (WHO). Linking NASA and NHA: concepts and mechanics; 2009. http://www.unaids.org/sites/default/files/en/media/unaids/contentassets/dataimport/pub/globalreport/2009/nha_nasa_crosswalk_final_en.pdf. [Accessed 18 December 2015] [Google Scholar]
- 7.WHO Health Accounts. WHO. http://www.who.int/health-accounts/en/. [Accessed 28 December 2015] [Google Scholar]
- 8.Ravishankar N, Gubbins P, Cooley RJ, Leach-Kemon K, Michaud CM, Jamison DT, et al. Financing of global health: tracking development assistance for health from 1990 to 2007. Lancet Lond Engl 2009; 373:2113–2124. [DOI] [PubMed] [Google Scholar]
- 9.Dieleman JL, Graves C, Johnson E, et al. Sources and focus of health development assistance, 1990–2014. JAMA 2015; 313:2359–2368. [DOI] [PubMed] [Google Scholar]
- 10.Financing Global Health 2013: Transition in an Age of Austerity. http://www.healthdata.org/policy-report/financing-global-health-2013-transition-age-austerity. [Accessed 18 December 2015] [Google Scholar]
- 11.Financing Global Health 2014: Shifts in Funding as the MDG Era Closes. http://www.healthdata.org/policy-report/financing-global-health-2014-shifts-funding-mdg-era-closes. [Accessed 21 December 2015] [Google Scholar]
- 12.Dieleman Joseph L, Schneider Matthew T, Haakenstad Annie, Singh Lavanya, Singh Nafis, Birger Maxwell, et al. Development assistance for health: past trends, relationships, and the future of international financial flows for health. Lancet 2016; (submitted). [DOI] [PubMed] [Google Scholar]
- 13.Walensky RP, Ross EL, Kumarasamy N, Wood R, Noubary F, Paltiel AD, et al. Cost-effectiveness of HIV treatment as prevention in serodiscordant couples. N Engl J Med 2013; 369:1715–1725. [DOI] [PMC free article] [PubMed] [Google Scholar]
- 14.Hyde H. H.R.1298-108th Congress (2003-2004): United States Leadership Against HIV/AIDS, Tuberculosis, and Malaria Act of 2003. 2003. https://www.congress.gov/bill/108th-congress/house-bill/1298. [Accessed 29 December 2015] [Google Scholar]
- 15.Berman H. H.R.5501-110th Congress (2007-2008): Tom Lantos and Henry J. Hyde United States Global Leadership Against HIV/AIDS, Tuberculosis, and Malaria Reauthorization Act of 2008. 2008. https://www.congress.gov/bill/110th-congress/house-bill/5501. [Accessed 29 December 2015] [Google Scholar]
- 16.Menendez R. S.1545-113th Congress (2013-2014): PEPFAR Stewardship and Oversight Act of 2013. 2013. https://www.congress.gov/bill/113th-congress/senate-bill/1545. [Accessed 29 December 2015] [Google Scholar]
- 17.Kaiser Family Foundation. The U.S. President's Emergency Plan for AIDS Relief (PEPFAR). 2015. http://kff.org/global-health-policy/fact-sheet/the-u-s-presidents-emergency-plan-for/. [Accessed 29 December 2015] [Google Scholar]
- 18.United Nations Development Program. World AIDS Day: record drop in cost of HIV treatment. 2015. http://www.undp.org/content/undp/en/home/presscenter/articles/2015/11/30/world-aids-day-record-drop-in-cost-of-hiv-treatment.html. [Accessed 29 December 2015] [Google Scholar]
Associated Data
This section collects any data citations, data availability statements, or supplementary materials included in this article.