Abstract
We previously established that spectroscopic microscopy can quantify subdiffraction-scale refractive index (RI) fluctuations in a label-free dielectric medium with a smooth surface. However, to study more realistic samples, such as biological cells, the effect of rough surface should be considered. In this Letter, we first report an analytical theory to synthesize microscopic images of a rough surface, validate this theory by finite-difference time-domain (FDTD) solutions of Maxwell’s equations, and characterize the spectral properties of light reflected from a rough surface. Then, we report a technique to quantify the RI fluctuations beneath a rough surface and demonstrate its efficacy on FDTD-synthesized spectroscopic microscopy images, as well as experimental data obtained from biological cells.
We have previously established that, despite the fundamental diffraction limit of optical microscopy, three-dimensional subdiffraction-scale refractive-index (RI) fluctuations internal to a linear, label-free, weakly scattered dielectric medium can be detected in the far zone with spectroscopic microscopy [1]. The light scattered from RI fluctuations within an inhomogeneous sample interferes with a strong reflection from the air-sample interface, and the resulting interferogram is recorded. The expected value of intensity variance in the spectral domain of acquired images quantifies the statistics of RI fluctuations and senses structures at any length scale, limited only by the signal-to-noise ratio [2]. Thus, can quantify the subdiffractional structures in biological cells (macromolecular complexes and organelles) that were previously inaccessible using conventional microscopy and spectroscopy techniques.
In our previous work [1,2], we have shown that quantifies internal structure within an inhomogeneous sample with a flat surface. However, in most practical cases the sample surface is not flat. In case of rough surface, the information about a sample’s internal structure contained in its reflected-light spectral signature is confounded by the spectrum of the light reflected from its rough surface (which serves as the reference wave). Hence, the effectiveness of detecting internal RI fluctuations could be limited by the sample’s surface roughness.
Although light scattering from rough surfaces has been investigated [3,4], the spectral characteristics of rough surface reflectance at a far-field image plane have not been well described. Here, we investigate how random nanoscale height variations of the sample impact the ability of spectroscopic microscopy to quantify the RI fluctuations beneath the surface. We develop a new method of signal analysis that allows measuring RI fluctuations internal to rough samples.
This Letter is presented in the following order: (1) a theoretical foundation used to synthesize spectroscopic microscope images of rough surfaces is introduced and rigorously validated by finite-difference time-domain (FDTD) computational solutions of Maxwell’s equations [5]; (2) the spectral signature of surface roughness is characterized by analyzing synthesized spectroscopic microscope images of rough surfaces with a range of roughness levels; (3) a method to measure internal RI fluctuations for media having rough surfaces is proposed; and (4) its performance is tested using FDTD simulations as well as experimental data from human buccal mucosa cells.
We first represent the sample as a homogenous dielectric medium having a refractive index n and a rough surface with random height variations. For simplicity, the spatial correlation of height variations is described by an exponential function:
| (1) |
where r represents the radial distance along the x–y plane and h represents the height. The statistics of surface roughness can be characterized by two parameters: the height variance and correlation length lch.
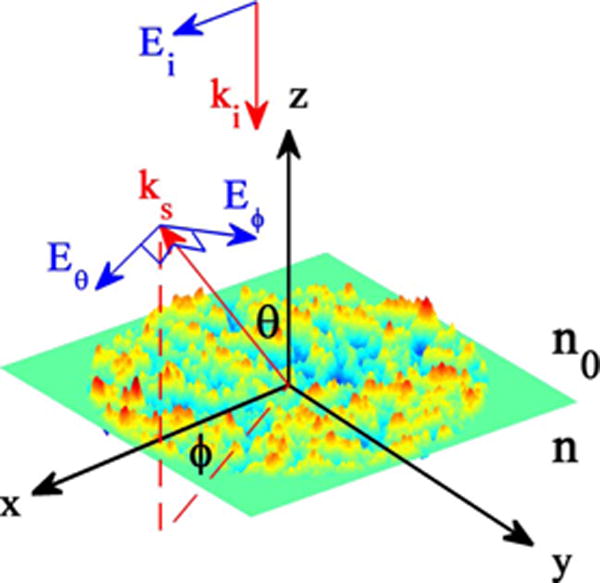
Figure 1 illustrates an example of a rough surface having random height variations generated using MATLAB. An x-polarized plane wave with wavenumber ki and electric field vector Ei impinges on the rough surface from free space and is scattered. The scattered light propagates along ks at angle (θ, ϕ) with an electric field vector Es perpendicular to ks. ki and ks form the scattering plane. Es can be decomposed to Eθ (parallel to the scattering plane) and Eϕ (perpendicular to the scattering plane).
Fig. 1.

Geometry of a rough surface.
Next, we assess the scattering amplitude by Kirchhoff approximation (KA). KA was initially used to describe scattering from surfaces with large length scales (lcs > λ) [4], but has been extended to dielectrics with subdiffractional scales (lcs < λ) [6]. The validity of KA is dependent on n, σh, lch, and the angles of illumination and observation [6]. Thus, it is unclear whether KA applies to the present circumstances (n = 1.53, σh = 10–50 nm, and lch = 60–240 cm). The ranges of σh and lch were selected to include (but not be limited to) those of human buccal mucosa cells, as measured by atomic force microscopy (AFM). Referring to Chapter 3 of [3], we note that the scattered electric field in the far zone can be calculated as
| (2) |
where A = −π|Ei| ln n is a constant, k represents the wavenumber in vacuum, sin2 χ = 1 − sin2 θ cos2 ϕ is the polarization factor, and F and Δ represent the Fourier transform and the Laplacian operators, respectively. n(r) equals n below the surface and n0 above the surface.
The scattered field is then focused onto an image plane with a moderate numerical aperture (NA) of 0.6 [7]:
| (3) |
where Eimg represents the field at the image plane (x′, y′) with wavenumber k in the vacuum, Ωimg represents the solid angle limited by the NA, and sx and sy are the direction cosines (sx, sy) = (cos ϕ sin θ ; sin ϕ sin θ). The image of the rough surface Ih(x′, y′, k) = |Eimg(x′, y′, k)|2 is normalized by that of a smooth surface with the same RI, i.e., by intensity in the absence of roughness.
To validate that KA applies to the selected roughness levels, we compared KA-predicted spectroscopic microscope images with those synthesized by FDTD solutions of Maxwell’s equations. FDTD simulations were performed using Angora [8], an open-source FDTD software package developed in our lab.
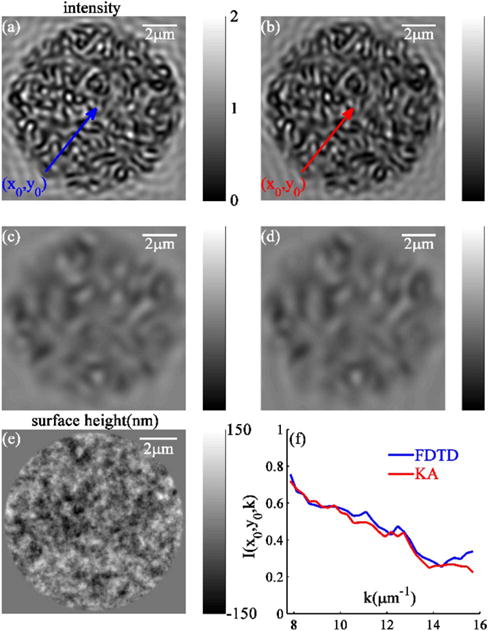
We establish that, for all tested levels of surface roughness, the KA-synthesized microscope images agreed very well with those synthesized by FDTD, with coefficients of determination (R2) exceeding 0.8. Figures 2(a)–2(d) illustrate the high level of agreement (R2 = 0.92) of the FDTD- and KA-synthesized grayscale microscope images of a rough surface (σh = 35 nm, lch = 170 nm). Moreover, an excellent pixel-specific match is observed between wavelength-dependent spectra of rough surface reflectance predicted by FDTD and KA [as illustrated in Fig. 2(f)].
Fig. 2.

Comparisons of (a), (c) FDTD-synthesized and (b), (d) KA-synthesized microscope images of a rough surface with σh = 35 nm and lch = 170 nm: λ = 400 nm for (a) and (b); λ = 800 nm for (c) and (d). (e) Height map of the same surface. (f) Comparative FDTD-and KA-synthesized center pixel (x0, y0) spectra.
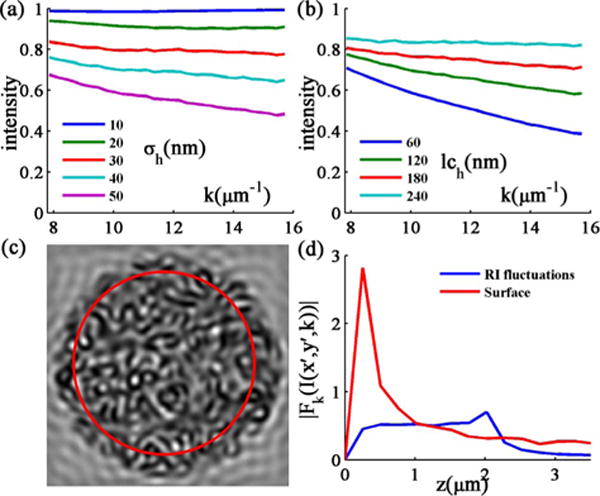
To study the spectral signature of the rough surface reflectance, we average the image spectra Ih(x′, y′, k) over the surface area and multiple samples to obtain a unique characteristic spectrum (mean spectrum) for each combination of σh and lch [Fig. 3(c)]. By analyzing the mean spectra, we observed that, regardless of surface roughness levels, the intensity decreases with k [Figs. 3(a) and 3(b)]. Further, we compared the Fourier transform of Ih(x′, y′, k) with that of In(x′, y′, k), the reflectance spectrum from a smooth inhomogeneous sample. We find that Fk{Ih(x′, y′, k)} contains predominantly low-frequency components and rapidly decays at higher frequencies, while Fk{In(x′, y′, k)} is distributed along all frequencies bounded by the thickness of the sample [Fig. 3(d)]. Analysis of these spectral characteristics of surface roughness establishes the foundation for the development of techniques to measure internal RI fluctuations in media having rough surfaces.
Fig. 3.

(a) Mean spectra for a fixed lch of 150 nm and σh from 10–50 nm. (b) Mean spectra for a fixed σh of 35 nm and lch from 60–240 nm. (c) Mean spectra are calculated by averaging over pixels in the red circle and further averaging over 10 samples. (d) Averaged Fourier transforms of Ih(x′, y′, k) (surface) and In(x′, y′, k) (RI fluctuations). The frequencies of spectra are translated into the depths from surface.
We next consider the case where a sample has RI fluctuations underlying a rough surface. The internal RI fluctuations have an exponential form of spatial correlation function, described by the correlation length lcn and variance . Our goal is to extract the spectral variance component that describes the internal RI fluctuations ( ) from the wavelength-resolved microscope image of the sample I(x′, y′, k). By estimating , we can quantify the statistics of RI fluctuations at the nanoscale. For clarity, we denote to represent the expected value of spectral variance directly measured from I(x′, y′, k) and to represent the estimation of from samples having rough surfaces.
We first present analytical equations to represent I(x′, y′, k) reflected from an inhomogeneous sample with smooth and rough surfaces. Ignoring the energy loss during light transmitting through the top surface of the sample, the microscope image intensity for a random media with a smooth surface can be expressed as
| (4) |
where Γ01 is the amplitude Fresnel reflectance coefficient and Im denotes “the imaginary part of.” n1D(r) denotes nΔ(r) (zero-mean RI fluctuations normalized by the average n) convolved with the point spread function of the microscope. The expected value of the recorded spectral variance is proportional to . For smooth surfaces, .
In the case when the surface of the inhomogeneous sample is rough, the reflectance from the air-sample interface becomes wavelength- and position-dependent. Therefore, the image intensity becomes
| (5) |
By analyzing (5), one sees that, in order to obtain , we must acquire Is(x′, y′, k) first. With a known surface profile, Is(x′, y′, k) can be accurately determined by KA or FDTD. Without surface information, one should seek a signal processing approach to estimate Is(x′, y′, k) from I(x′, y′, k). Based on our previous analysis, the first term on the right-hand side contains predominantly low-frequency components. The second term is an interference term that has higher frequency components, multiplied by . Therefore, it is possible to separate Is(x′, y′, k) by fitting I(x′, y′, k) with low-frequency functions at each individual pixel (x′, y′). Here, we propose to use second-order polynomial fitting to acquire Is(x′, y′, k). Once Is(x′, y′, k) is obtained, may be readily estimated from Eq. (5).
We then evaluate the efficacy of the proposed method via a challenge to distinguish samples with different lcn and the same surface profile. The test was performed in the following sequence. First, 2 μm thick inhomogeneous media with smooth surfaces were generated numerically with σn = 0.033, and lcn = 20 nm for one group (N =10) and 100 nm for another (N = 10). FDTD simulations were performed to obtain the spectroscopic microscopic images. For each group, was calculated and averaged over 25 pixels per sample and 10 samples per group. This is the spectral variance caused only by RI fluctuations (no influence from the rough surface), and the difference of between lcn of 20 and 100 nm represents the baseline for the power of spectroscopic microscopy to distinguish different lcn. As expected, Σn of lcn 100 nm is significantly higher than that of 20 nm [Fig. 4(b), p < 0.001].
Fig. 4.

(a) Example of image spectra from the same pixel of the same medium having smooth and rough surfaces. The dash lines represent second-order polynomial fits for Is(x′, y′, k); comparison of estimated Σn from inhomogeneous media with lcn of 20 and 100 nm, calculated from sample with smooth surfaces (b) or rough surfaces (c), without ( ) or with ( ) second-order polynomial fitting.
Thereafter, the same media were generated with rough surfaces (σh = 35 nm and lch = 170 nm). FDTD simulations were performed to obtain the spectroscopic microscopic images, and and were calculated. Figure 4(a) illustrates second-order polynomial fits to image spectra from inhomogeneous media having smooth and rough surfaces. The results showed that the proposed method ( ) allowed the difference in internal structure to be identified [Fig. 4(c), p < 0.001]. Note that this approach did not disturb the ability of distinguishing different lcn for media with smooth surfaces [Fig. 4(b), p < 0.001]. Moreover, were close to Σn [Figs. 4(b) and 4(c)] with acceptable error (11% for lcn of 20 nm and 7% for 100 nm).
We further investigated the validity of the proposed approach by evaluating from homogenous samples having rough surfaces ( ). Using the FDTD, we found that, for λ = 500–700 nm, NA = 0.6, and sample thickness L > 0.8 μm, the proposed method holds for a wide range of parameters: σh = 10–35 nm, lch = 60–240 nm, σn > 0.03, and lcn > 20 nm.
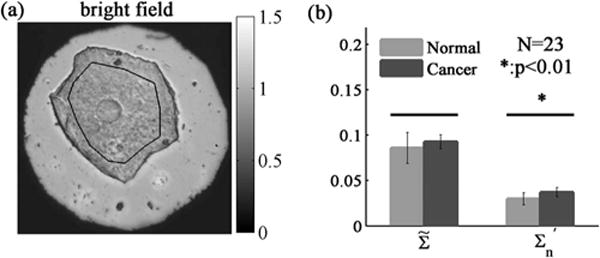
Lastly, we illustrate the efficacy of the proposed method experimentally by identifying nanoscale structural alterations within human buccal mucosa cells during development of lung cancer. Histologically (microscopically) normal buccal epithelium is known to undergo genetic and epigenetic alterations during the progression of lung cancer [9]. This implies that the buccal nanoscale organization in lung cancer patients may be distinct from that of healthy individuals. Herein, we use spectroscopic microscopy, followed by the spectral analysis method developed above, to quantify and compare the nanoscale structure within buccal cells of patients with and without lung cancer. AFM measurements on these fixed buccal cells revealed that L = 0.8–1.5 um, σh = 19.7 ± 5.1 nm, and lch = 167 ± 36 nm. σn of biological tissue is estimated 0.04–0.10 [10]. Similarly, after collecting spectroscopic microscopy images from 23 patient samples (30 cells each), and were calculated. Our results showed that the recorded spectral variance by itself is identical between the two groups. However, when the spectral contribution from the samples surface roughness is removed, a significant difference in the buccal intracellular nanoscale structures between patients with and without lung cancer is revealed ( , p < 0.01, Fig. 5).
Fig. 5.

(a) Example of bright field reflectance image of a human buccal mucosa cell. (b) Performance of and in distinguishing the buccal intracellular structure between patients with and without lung cancer. The outline within the cell in (a) indicates the region of interest.
We conclude that the second-order polynomial fitting method accurately separates the spectral variance component caused by internal RI fluctuations from that caused by the rough surface. We demonstrate that is a roughness-independent measurement of RI fluctuations within an inhomogeneous sample, which was validated by FDTD for all roughness levels tested (including smooth surface).
In this Letter, we validated the precision of KA for modeling light scattering from rough surfaces of biological cells. With the characteristic mean spectra obtained from spectroscopic microscopic images of homogenous samples having rough surfaces, we described the signature of surface roughness on the spectral component of microscopic images. Furthermore, we developed a method for detecting RI fluctuations in media with rough surfaces. This Letter enables spectroscopic microscopy measurement of nanoarchitectural alterations beneath rough surfaces in biological cells, leading to more accurate identification of multiple human cancers.
The analysis and technique reported in this Letter have two primary limitations. First, the autocorrelation of the random surface was modeled as exponential. It is possible that surfaces of biological cells have different types of autocorrelation functions. Second, the accuracy of predicting relies upon an appropriate fitting for Is(x′, y′, k). Although second-order polynomial fitting was demonstrated to have considerable accuracy, there may be more accurate methods. Potential alternatives include various types of filters and windows.
Acknowledgments
The FDTD simulations were made possible by a computational allocation from the Quest high performance computing facility at Northwestern University.
Funding. National Institutes of Health (NIH) (R01CA155284, R01CA165309, R01EB016983); National Science Foundation (NSF) (EFRI-1240416).
Footnotes
OCIS codes: (180.0180) Microscopy; (290.0290) Scattering; (300.0300) Spectroscopy; (170.1530) Cell analysis.
References
- 1.Cherkezyan L, Capoglu I, Subramanian H, Rogers JD, Damania D, Taflove A, Backman V. Phys Rev Lett. 2013;111:033903. doi: 10.1103/PhysRevLett.111.033903. [DOI] [PMC free article] [PubMed] [Google Scholar]
- 2.Cherkezyan L, Subramanian H, Backman V. Opt Lett. 2014;39:4290. doi: 10.1364/OL.39.004290. [DOI] [PMC free article] [PubMed] [Google Scholar]
- 3.Maradudin AA. Light Scattering and Nanoscale Surface Roughness. Springer; 2007. [Google Scholar]
- 4.Beckmann P, Spizzichino A. The Scattering of Electromagnetic Waves from Rough Surfaces. Macmillan; 1963. [Google Scholar]
- 5.Taflove A, Hagness SC. Computational Electrodynamics: The Finite-Difference Time-Domain Method. 3rd. Artech; 2005. [Google Scholar]
- 6.Sanchez-Gil JA, Nieto-Vesperinas M. J Opt Soc Am A. 1991;8:1270. [Google Scholar]
- 7.Goodman J. Introduction To Fourier Optics. Roberts; 2005. pp. 126–154. (McGraw-Hill Physical and Quantum Electronics Series). [Google Scholar]
- 8.Capoglu IR. ANGORA: Afree software package for finite-difference time-domain (FDTD) electromagnetic simulation. 2012 date accessed: April 2012, http://www.angorafdtd.org.
- 9.Steiling K, Ryan J, Brody JS, Spira A. Cancer Prev Res. 2008;1:396. doi: 10.1158/1940-6207.CAPR-08-0174. [DOI] [PMC free article] [PubMed] [Google Scholar]
- 10.Schmitt JM, Kumar G. Appl Opt. 1998;37:2788. doi: 10.1364/ao.37.002788. [DOI] [PubMed] [Google Scholar]


