Significance
We demonstrate that computational visualization of large-scale molecular and clinical datasets can delineate molecularly defined groups of highly similar patients that are well separated from other subgroups. We show that our approach is applicable to multiple data types (sequence, expression, DNA methylation), and that it provides the ability to discover clusters of tumors with targetable lesions. Our methods are generally applicable to all diseases and provide an intuitive means for physicians and bench scientists to work directly with “big” biomedical data.
Keywords: big data, glioma, precision medicine, visualization, biomarkers
Abstract
We show that visualizing large molecular and clinical datasets enables discovery of molecularly defined categories of highly similar patients. We generated a series of linked 2D sample similarity plots using genome-wide single nucleotide alterations (SNAs), copy number alterations (CNAs), DNA methylation, and RNA expression data. Applying this approach to the combined glioblastoma (GBM) and lower grade glioma (LGG) The Cancer Genome Atlas datasets, we find that combined CNA/SNA data divide gliomas into three highly distinct molecular groups. The mutations commonly used in clinical evaluation of these tumors are regionally distributed in these plots. One of the three groups is a mixture of GBM and LGG that shows similar methylation and survival characteristics to GBM. Altogether, our approach identifies eight molecularly defined glioma groups with distinct sequence/expression/methylation profiles. Importantly, we show that regionally clustered samples are enriched for specific drug targets.
The primary brain tumors were originally classified histologically by Bailey and Cushing in 1926 (1), named for the CNS cell types that they resembled, and subsequently graded by the appearance of histological structures such as pseudopalisades and vascular proliferation that correlated with outcome (2). More recently, those diagnoses have been embellished by additional molecular characterization, including ki67 staining for proliferation, MGMT methylation status predicting response to temozolomide (3), single copy loss of regions of ch1p and ch19q found in the oligodendrogliomas [predictive of a better outcome in lower grade glioma (LGG)] (4), IDH1 mutations that are common in LGG are predictive of a better outcome when found in glioblastoma (GBM) and associated with the CpG island methylator phenotype (CIMP) (5), and ATRX and p53 mutations that when found in IDH1 mutant tumors predict a worse outcome (6, 7). In addition, new molecularly based classification systems have emerged in the past decade such as a methylation profile-based classification of the gliomas into CIMP and non-CIMP tumors with significant differences in survival between groups and an expression-based division of the non-CIMP GBMs into three or four subclasses (8, 9).
None of the currently available molecular strategies use the entire collection of data available to classify the tumors. Rather, they build on, and modify, existing classifications. However, current technology allows the very detailed measurement of multiple types of data. In fact, the The Cancer Genome Atlas (TCGA) glioma databases provide access to measurements of whole exome sequence, copy number across the genome, whole genome methylation profiles, and RNA expression by RNA-seq in a cohort of more than 1,100 grade 4 (GBM) and LGGs (10, 11). The key obstacle to integrating all of these datasets to classify the gliomas in a meaningful way has been designing a method to relate disparate types of high-dimensional data, and the inability to visualize this kind of data across large numbers of patients simultaneously.
Here, we present a visual integration approach for multiple diverse molecular datasets across large numbers of patients in such a way as to be meaningful for researchers and clinicians who may not have immediate access to experts in computational biology (discussed in SI Appendix). We use whole genome copy number, exome sequence, gene expression, and genome-wide methylation data to classify the combined GBM and LGG datasets from the TCGA in an unbiased manner. We find that based on genome-wide sequence and methylation data, the gliomas cluster into three basic groups, and the known molecular characteristics of gliomas currently used clinically are easily reproduced by this approach. Given the ability of our approach to reproduce the known aspects of gliomas as a validation, we then use this approach to make novel observations about the fundamental molecular characteristics of gliomas.
Results
To enable intuitive exploration of high-dimensional glioma data, we used classical multidimensional scaling (12) (MDS) to visualize each data type as a series of two-dimensional scatterplots. MDS characterizes samples in terms of their similarity to each other, and preserves high-dimensional distance (dissimilarity) relationships as much as possible. Moreover, distances between samples in the full-dimensional space can be defined by a wide variety of methods, including (1-correlation)/2, Minkowski, and complex measures. This feature of MDS allows us to tailor appropriate similarity/distance measures for each type of data, and to explore the effectiveness of alternate measures. Additionally, sample similarity can be measured using global, genome-wide terms or subsets of whole-genome data (gene or probe sets). For example, patient similarity can be explored in terms of the expression of sets of genes related to specific aspects of biology. Finally, simultaneous coloring in of tumors on multiple similarity plots enables visual integration of diverse data types such as specific mutations, gene expression levels, or diagnostic categories.
Visualizing Previous Knowledge About Gliomas.
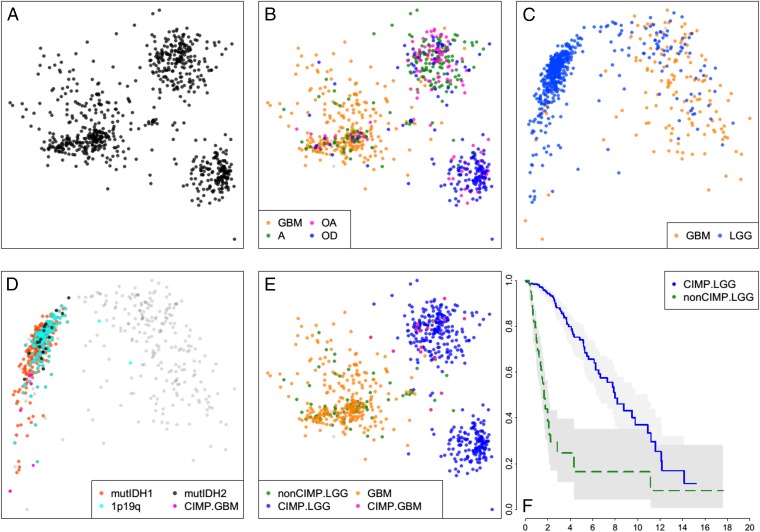
We devised distance measures for whole exome single nucleotide alterations (SNAs) and whole genome copy number alterations (CNAs), and their combination (CNA/SNA) and visualized the GBM and LGG tumors by MDS (SI Appendix). Three distinct groups or clusters were produced (Fig. 1A). Coloring the tumors by their pathologic diagnoses showed that one cluster was mostly tumors diagnosed as oligodendrogliomas (oligo cluster). A second cluster was composed of primarily astrocytomas and oligoastrocytomas (astro cluster). And the third group contained the majority of GBM admixed with some astrocytomas and oligoastrocytomas (GBM cluster) (Fig. 1B).
Fig. 1.
Sample similarity plots reveal four distinct subtypes of gliomas. (A) Two-dimensional MDS projection of sample similarities based on combined genome-wide sample SNA and CNA profiles. Three distinct sample clusters stand out. (B) Same as A, but with samples colored by their histologic subtype. The cluster on the Left is primarily GBMs, whereas the Top Right cluster is composed mostly of astrocytomas and oligoastrocytomas and the Bottom Right cluster is predominantly oligodendrogliomas. (C) Sample similarity visualized using a collection of ∼1,500 DNA methylation probes distinguishing CIMP versus non-CIMP tumors. (D) Coloring of all samples with mutations of IDH1/2, codeletions of chromosome arms 1p and 19q, and GBM samples previously shown to be G-CIMP shows that samples in the Left cluster are G-CIMP, whereas samples in the Right cluster are non-CIMP. (E) CIMP GBM samples all fall within or near the astro sample cluster in the SNA/CNA plot (B). Non-CIMP LGGs are genomically more like non-CIMP GBMs rather than like CIMP-LGGs. (F) Kaplan–Meier survival plot shows non-CIMP LGGs are much shorter-lived than CIMP-LGGs (P value ∼0).
Next, we applied the same approach to DNA methylation states using 450K methylation array data. Initially, we used the ∼1,500 probes that define CIMP (5) and observed the sample distribution shown in Fig. 1C. Coloring in the tumors with IDH1/2 mutations and deletions in 1p19q, we identified the cluster of tumors in this plot that are CIMP (Fig. 1D). Parenthetically, we also used the whole genome in-gene and in-promoter probe sets and found that these data generated very similar plots, consistent with the CIMP phenotype being common across the entire genome (SI Appendix, Fig. S1).
We used this methylation data to define CIMP status in our tumors and then colored the CNA/SNA plot with this coloring scheme (Fig. 1E). We found that the CIMP and non-CIMP tumors on the CNA/SNA plot are completely separated, indicating that the methylation status and DNA variations strongly correlate. All of the GBM that were on the CIMP side of the methylation plot were located in and around the astro cluster and none of them were mixed into the oligodendroglioma cloud, consistent with the assertion that oligodendrogliomas do not progress to grade 4 tumors (13). Finally, the survival of LGG patients in the oligo and astro clusters is significantly longer than patients with LGG tumors in the GBM cluster (Fig. 1F).
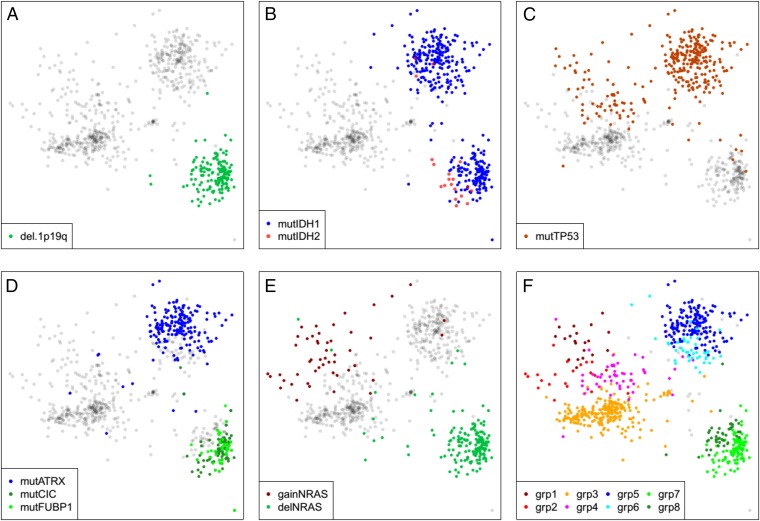
Through simultaneous exploration of methylation and CNA/SNA sample similarity plots, we were able to identify several known and expected molecular features of the glioma dataset. For example, all of the 1p19q deleted tumors are located in the oligo cluster (Fig. 2A). IDH1 mutations were located in both the oligo cluster and astro cluster, with the IDH2 mutant tumors concentrated in a particular region of the oligo cluster (Fig. 2B). Tumors with mutations in p53 were located specifically in the astro cluster and the diffuse portion of the GBM cluster (Fig. 2C). Tumors with mutations in ATRX are all located in a portion of the astro cluster, whereas tumors with CIC and FUBP1 mutations are localized in a specific region of the oligo cluster (Fig. 2D). NRAS was found commonly gained in a specific diffuse region of the GBM cluster, whereas single copy deletion of NRAS was found in all members of the oligo cluster (Fig. 2E). The sum of the above molecular alterations allowed us to define eight subregions of the plot that are notated in Fig. 2F. To assess the strength of these visually detected clusters, we use a permutation schema to compute approximate P values for visually observing these cluster patterns (all approximate P values are much less than 0.01, see SI Appendix, Fig. S2).
Fig. 2.
Genomic variations divide gliomas into eight distinct subtypes. (A) (1p,19q) codeletions occur exclusively in the Lower Right (oligo) cluster of samples. (B) IDH1 mutations occur in both astro and oligo LGG clusters, but most IDH2 mutations occur in the oligo CIMP-LGG cluster. (C) TP53 mutations are largely confined to the astro CIMP-LGG cluster and the diffuse portion of the non-CIMP cluster. (D) Mutations in ATRX primarily impact a subset of the astro cluster (Top Right), whereas CIC and FUBP1 mutations define a subset of the oligo cluster. (E) Heterozygous deletions and low-copy gains of NRAS mark the oligo cluster and a diffuse portion of the non-CIMP cluster. (F) Together, the genomic markers described in A–E define eight distinct tumor subtypes, as follows. Group1 = nonCIMP & gainNRAS & mutTP53. Group2 = nonCIMP & gainNRAS & wtTP53. Group3 = nonCIMP & wtNRAS & wtTP53. Group4 = nonCIMP & wtNRAS & mutTP53. Group5 = CIMP.LGG & not1p19q & mutATRX & mutTP53. Group6 = CIMP.LGG & not1p19q & wtATRX & mutTP53. Group7 = (CIMP.LGG & del.1p19q) & (mutCIC OR mutFUBP1). Group8 = CIMP.LGG & del.1p19q & wtCIC & wtFUBP1.
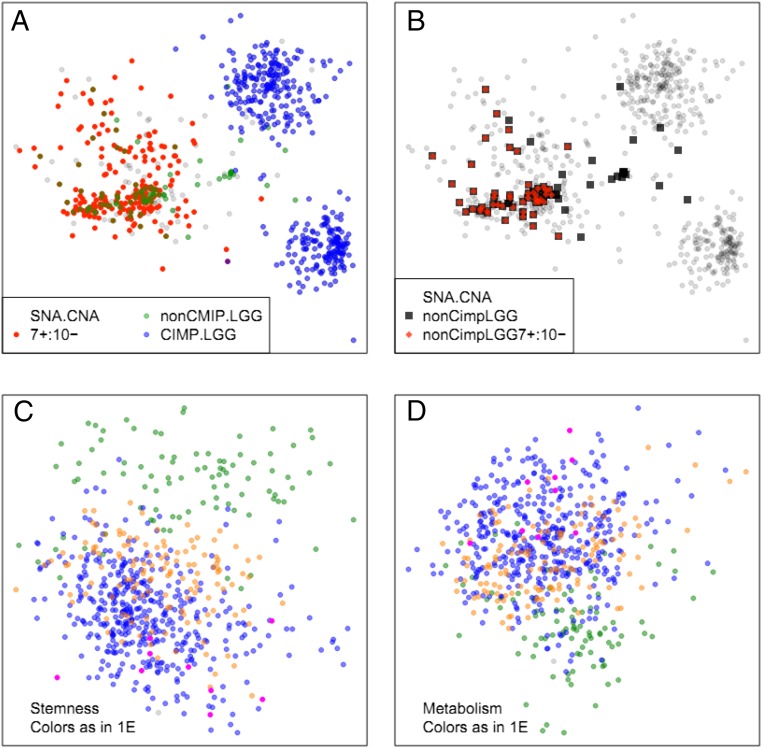
Tumors marked as having low-copy gain of ch7 and hemizygous deletion of ch10 were located in the GBM cluster, irrespective of whether they were LGG or GBM, and no CIMP-LGG showed combined ch7 gain and heterozygous ch10 deletion (Fig. 3A), whereas the majority of non-CIMP LGG showed these combined alterations, similar to non-CIMP GBM (Fig. 3B). And in fact as noted above, these non-CIMP LGGs have survival similar to GBM rather than CIMP-LGGs in the oligo or astro clusters. One possible explanation for this observation is that these non-CIMP LGGs are simply misdiagnosed GBM. However, further analysis suggests otherwise. If we distribute the same TCGA gliomas based on expression data limited to 396 genes associated with stemness (Fig. 3C and SI Appendix, Table S1) or 1,157 genes associated with metabolism (SI Appendix, Table S2 and Fig. 3D) and color the plot as in Fig. 1E we find the non-CIMP LGGs have stemness and metabolism gene expression patterns that are distinct from all other gliomas.
Fig. 3.
Co-occurrences of chromosome 7 low-copy gain, and chromosome 10 single-copy deletion (7+/10−). Samples with whole chromosome copy number changes were defined as those with more than 85% of their thresholded per gene GISTIC2.0 scores matching the expected value. (A) The 7+/10− codeletion does not occur in CIMP-LGGs. (B) Non-CIMP LGGs are highly enriched for 7+/10−. (C and D) Expression similarity plots. Although non-CIMP LGGs are genomically very similar to non-CIMP GBMs, the expression patterns of stemness (C) and metabolism (D)-associated genes are very different in non-CIMP LGGs and GBMs.
There are a few observations worth noting because of their absence. For example, as shown in SI Appendix, Fig. S3, there was no regional distribution of GBMs by their expression-based subclass (14), suggesting that although there are specific mutations that are asymmetrically distributed among the expression subclasses, these mutations are dwarfed by the overall genomic heterogeneity of the GBMs. It is also worth noting that within any of these three CNA/SNA clusters, there was not a regional distribution by tumor grade (SI Appendix, Fig. S4), suggesting that tumor grade was not correlated with specific DNA structure characteristics. Consistent with this observation, there was no regionality in expression of MKI67 or PCNA (as surrogates for proliferation) in the CNA/SNA plot (SI Appendix, Fig. S5).
Stability of the Plot Structure.
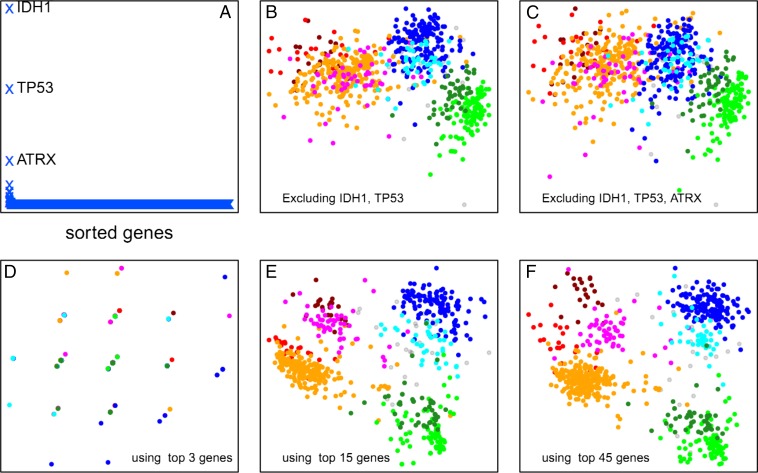
We wanted to know which genes were contributing most to the distribution of samples in the above plots, and so we performed leave-one-out recalculations of the plot and ranked each gene by its impact on the sum of intersample distances (Fig. 4A). Consistent with earlier findings by TCGA (10), the top 3 genes that noticeably impacted the layout when removed were TP53, IDH1, and ATRX. As shown in Fig. 4 B and C, removal of the top 2 or 3 genes substantially impacts the separation of the eight glioma clusters. However, when we took the mutation and copy number of the top 4 genes and used them to distribute the gliomas and then compared this to the data from the whole genome, we clearly did not get an adequate distribution (Fig. 4D). At least 15 of the top-impact genes are necessary to produce a sample similarity plot in which the eight sample clusters of Fig. 2F are spatially distinct (Fig. 4D), and as few as the 45 top-impact genes (listed in SI Appendix, Table S3) are sufficient to adequately replicate the cluster distribution seen in Fig. 2F. These data suggest that the majority of the variance across the genome in gliomas can be largely accounted for by fewer than 50 genes.
Fig. 4.
Stability of the plot structure. (A) Change in total intersample distances (y-axis, arbitrary units) when each gene in the genome is removed individually and the sample similarity plot is recalculated. Three genes (IDH1, TP53, and ATRX) have a large effect on the plot layout. (B) Coremoval of the two highest impact genes leaves the three major sample clusters largely distinct, but the subgroupings within these large clusters are lost. (C) Coremoval of the three highest-impact genes further degrades the sample clustering. However, as shown in D, the three highest-impact genes by themselves are not sufficient to reproduce any of the sample clustering. (E) The 15 highest-impact genes are sufficient to capture a large portion of the sample clustering obtained from genome-wide data. (F) The 45 highest-impact genes reasonably reproduce the clustering pattern obtained by using genome-wide data.
Next, we wanted to know how stable the distribution was with respect to adding new patients to the dataset. We first determined how well the location of any given tumor could be determined from the location of the three nearest neighbors and found that this worked well for all tumors with nearby neighbors. We then performed a leave-one-out analysis in which we removed one sample at a time, regenerated the plot distribution, and then estimated the location of the removed sample using the three most-similar samples in the plot. We found that the distribution was remarkably stable, i.e., “new samples” not used in the generation of the plot can be added in accurately based on sample similarity. (SI Appendix, Fig. S6 and associated text).
Methylation and Gene Expression Distinguish the Oligo from Astro Cluster.
The overall DNA sequence differences between the clouds are noted above, and the methylation differences between the GBM cluster and the other two clusters are well known (CIMP vs. non-CIMP). We wanted to identify the set of gene expression and methylation patterns that distinguish the two CIMP glioma clusters and use that to infer biologic processes that distinguish these two tumor types. Excluding non-CIMP samples and comparing genome-wide methylation differences between the astro and oligo clusters, we found that ∼1,000 methylation probes were sufficient to distinguish the two groups perfectly (SI Appendix, Figs. S7 and S8A). A larger number of probes are needed to distinguish the three clusters. As shown in SI Appendix, Fig. S8A, combining 3,000 of our LGG classifier probes with the 1,500 CIMP marker probes clearly identifies the three main sample clouds in Fig. 2F. Thus, DNA methylation alone is sufficient to divide gliomas into at least five distinct subtypes (CIMP/non-CIMP GBMs, non-CIMP LGGs, and two subtypes of CIMP-LGGs). We found that 111 genes are both differentially methylated and differentially expressed between the oligo and astro clusters (SI Appendix, SI Methods and Table S4). Remarkably, 22 of these genes are associated with neuronal G-protein–coupled receptor (GPCR) signaling (SI Appendix, Table S5). Further, 30 of these 111 genes are transcription factors, a threefold enrichment compared with the genome-wide ratio.
One of the transcription factors significantly both DNA methylated and down-regulated in the oligo cluster relative to the astro cluster (SI Appendix, Fig. S8 B and C) is REST (NRSF). REST, which normally represses neuronal genes in nonneuronal tissues is known to silence its target genes through both histone modifications and DNA methylation (15). Consistent with a previous report (16), we find that the expression of the ubiquitin-ligase BTRC, which degrades Rest protein, is higher in tumors where REST is transcriptionally down-regulated. Moreover, as shown in SI Appendix, Fig. S8D, expression of the REST corepressor HDAC1 is highly down-regulated in samples with low REST expression. Abnormal expression of REST in neurons blocks differentiation and leads to tumors (17), and GBMs with high REST expression are refractory to chemotherapy (16). Indeed, REST degradation has been proposed as a possible treatment option in GBM (18). Thus, our discovery of REST-high and REST-low LGG subtypes has potential clinical implications.
Regional Enrichment of Tumor Phenotypes.
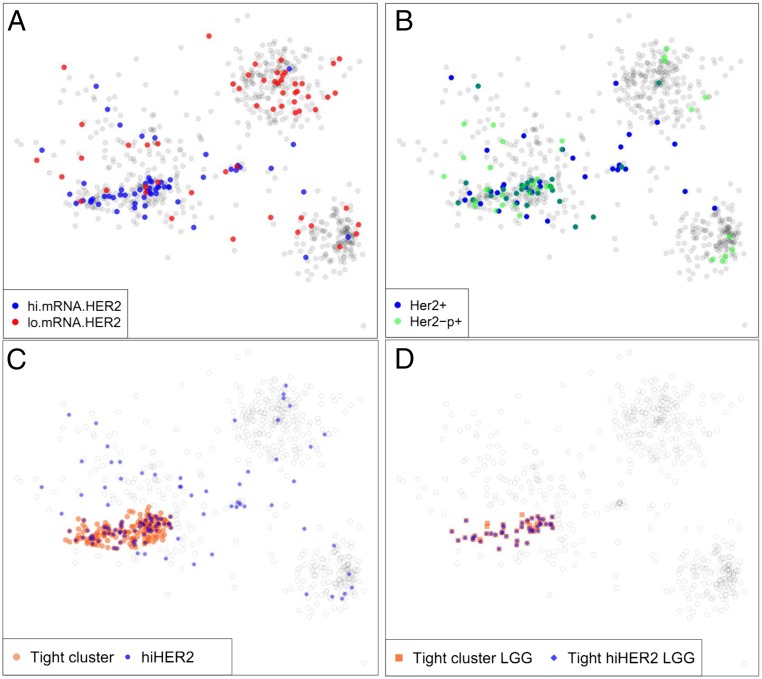
Not all tumors with specific mutations respond similarly to drugs targeting those particular genetic alterations. Presumably, the state of the rest of the genome/epigenome impacts the tumor’s response. The distribution of tumors in the SNA/CNA plot is created by genome-wide mutation and copy number data. Therefore, the regional location of tumors on the plot might provide additional information reflecting the overall biology of those tumors. As an illustration of the concept, we determined if the regional location of tumors in this plot might have therapeutic implications. We chose HER2 as an example of a potentially therapeutic target, and defined tumors as high HER2 if they had either the top 10% expression of Her2 mRNA (Fig. 5A), Her2 protein, or pHer2 (Fig. 5B). The high Her2 tumors were regionally concentrated (Fig. 5C) ranging from 4% of the LGG in the oligo and astro clusters to 33% of tumors in the tight region of the GBM cluster. Most strikingly, 84% of the group 3 tight-region LGGs were high for Her2 (Fig. 5D), accounting for 54% of all of the high Her2 gliomas in the TCGA. These findings suggest that this kind of analysis may be used to identify regions of sample similarity enriched for tumors with elevated signaling activity and potentially similar response to a specific therapy.
Fig. 5.
Tightly defined regions of the genomic sample similarity plot are highly enriched for specific drug targets. (A) Distribution of samples with high and low levels of Her2 mRNA. Here “high” and “low” are defined as the Top and Bottom decile of the samples. (B) Samples with total and phosphorylated Her2 protein levels in the Top decile are concentrated in a tight region of the non-CIMP cluster that coincides with the region of high Her2 mRNA expression. (C) Red disks mark the non-CIMP tight region of genomically highly similar samples. Blue disks mark samples with high levels of Her2 mRNA/protein/phosphorylated protein. (D) Within the tight non-CIMP sample cluster delineated in C, a large majority of LGG samples are high in Her2 mRNA/protein/phosphoprotein levels.
Discussion
Visualizing cancer big data in terms of sample similarity allows for several novel observations of the molecular and clinical features of the gliomas as a group. First, the three clouds seen in the CNA/SNA plot are very distinct from each other and have very few tumors in the intervening space between them. This observation suggests that these three diseases are distinct rather than existing as a spectrum. The distinction between GBM and the astro and oligo clusters are IDH mutation and methylation status largely, but the GBM cluster also has many unique genomic characteristics. The distinction between the oligo and astro clusters is not only due to genomic differences between the two clusters, but methylation and gene expression differences enriched with transcription factors including REST. Second, given the distinct molecular structures of these tumors, the diagnoses of these tumors are intriguing. For tumors in the oligo cluster, multiple pathologists are frequently (but not always) able to make the same diagnosis of oligodendroglioma either grade 2 or grade 3. By contrast, neuropathologists diagnose tumors in the astro cluster, as a mixture of astrocytoma, oligoastrocytoma, and oligodendroglioma grades 2 and 3, and all of the GBM with CIMP methylation status are located in this group. Finally, the GBM cluster contains tumors diagnosed as either GBM or LGG (mostly astrocytoma and oligoastroctyomas) and includes a compact region of genomically very similar tumors (by definition) and a more diffuse region. As noted above, the LGGs in the GBM cluster (non-CIMP) are much more aggressive than the LGGs of the other two clusters, but appear to be more than simply misdiagnosed GBMs. These tumors seem to have unique expression patterns related to stemness and metabolism and are highly enriched in certain potential therapeutic targets, including Her2. Our findings can be explored interactively online at oncoscape.sttrcancer.org.
TCGA recently published an updated panglioma analysis (19). The new analysis is based on a complete reprocessing of all data, making a direct comparison difficult. Moreover, the subtypes we have identified are based entirely on DNA-sequence variations, whereas the new TCGA analysis uses combined mRNA and DNA-methylation clustering to identify seven glioma subtypes. As noted earlier and illustrated in SI Appendix, Fig. S3, the TCGA expression subclasses are not correlated with sequence-based sample similarity. In terms of DNA-sequence variations, the seven TCGA clusters fall into five groups, including two LGG groups. A total of 88% of each of our LGG groups 5 and 6 fall within the TCGA cluster defined as (LGm1/2 and LGr3) and enriched for (mutATRX and mutIDH1 and mutTP53). Likewise, 66% of our oligo group fall within the TCGA cluster defined as (LGr1/2 and LGm3) and enriched for (mutIDH1 and del1p19q). Surprisingly, the non-CIMP LGG group that we identified (Fig. 1 E and F) with a markedly short survival, which has also been reported by others (20), is not among the seven TCGA groups.
Materials and Methods
Data for the TCGA LGGs and GBMs were downloaded from the University of California Santa Cruz cancer browser https://genome-cancer.ucsc.edu/ (August 2014 update). Expression data are from “RNA-seq V2” runs and methylation data are from Illumina Infinium 450K arrays. All copy number data are thresholded GISTIC2.0 scores. Expression data were batch corrected using the “ComBat” algorithm in the R package “swamp” (cran.r-project.org/web/packages/swamp). Methylation data were batch corrected using “functional normalization” from the Bioconductor package “minfi” (bioconductor.org/packages/release/bioc/html/minfi.html).
Supplementary Material
Acknowledgments
We thank Dirk Petersen [Fred Hutchinson Cancer Research Center (FHCRC) Scientific Computing] for code parallelization. This work was supported by the FHCRC Solid Tumor Translational Research Initiative and National Cancer Institute Grant U54CA143798 (to E.C.H.).
Footnotes
The authors declare no conflict of interest.
This article is a PNAS Direct Submission.
This article contains supporting information online at www.pnas.org/lookup/suppl/doi:10.1073/pnas.1601591113/-/DCSupplemental.
References
- 1.Bailey P, Cushing H. A Classification of Tumours of the Glioma Group on a Histogenic Basis. J B Lippincott; Philadelphia: 1926. [Google Scholar]
- 2.Louis DN, et al. The 2007 WHO classification of tumours of the central nervous system. Acta Neuropathol. 2007;114(2):97–109. doi: 10.1007/s00401-007-0243-4. [DOI] [PMC free article] [PubMed] [Google Scholar]
- 3.Hegi ME, et al. MGMT gene silencing and benefit from temozolomide in glioblastoma. N Engl J Med. 2005;352(10):997–1003. doi: 10.1056/NEJMoa043331. [DOI] [PubMed] [Google Scholar]
- 4.Eckel-Passow JE, et al. Glioma groups based on 1p/19q, IDH, and TERT promoter mutations in tumors. N Engl J Med. 2015;372(26):2499–2508. doi: 10.1056/NEJMoa1407279. [DOI] [PMC free article] [PubMed] [Google Scholar]
- 5.Noushmehr H, et al. Cancer Genome Atlas Research Network Identification of a CpG island methylator phenotype that defines a distinct subgroup of glioma. Cancer Cell. 2010;17(5):510–522. doi: 10.1016/j.ccr.2010.03.017. [DOI] [PMC free article] [PubMed] [Google Scholar]
- 6.Liu XY, et al. Frequent ATRX mutations and loss of expression in adult diffuse astrocytic tumors carrying IDH1/IDH2 and TP53 mutations. Acta Neuropathol. 2012;124(5):615–625. doi: 10.1007/s00401-012-1031-3. [DOI] [PubMed] [Google Scholar]
- 7.Jiao Y, et al. Frequent ATRX, CIC, FUBP1 and IDH1 mutations refine the classification of malignant gliomas. Oncotarget. 2012;3(7):709–722. doi: 10.18632/oncotarget.588. [DOI] [PMC free article] [PubMed] [Google Scholar]
- 8.Phillips HS, et al. Molecular subclasses of high-grade glioma predict prognosis, delineate a pattern of disease progression, and resemble stages in neurogenesis. Cancer Cell. 2006;9(3):157–173. doi: 10.1016/j.ccr.2006.02.019. [DOI] [PubMed] [Google Scholar]
- 9.Cancer Genome Atlas Research Network Comprehensive genomic characterization defines human glioblastoma genes and core pathways. Nature. 2008;455(7216):1061–1068. doi: 10.1038/nature07385. [DOI] [PMC free article] [PubMed] [Google Scholar]
- 10.Cancer Genome Atlas Research Network Comprehensive, integrative genomic analysis of diffuse lower-grade gliomas. N Engl J Med. 2015;372(26):2481–2498. doi: 10.1056/NEJMoa1402121. [DOI] [PMC free article] [PubMed] [Google Scholar]
- 11.Brennan CW, et al. TCGA Research Network The somatic genomic landscape of glioblastoma. Cell. 2013;155(2):462–477. doi: 10.1016/j.cell.2013.09.034. [DOI] [PMC free article] [PubMed] [Google Scholar]
- 12.Buja A, Cook D, Swayne DF. Interactive high-dimensional data visualization. J Comput Graph Stat. 1996;5:78–99. [Google Scholar]
- 13.Huse JT, Holland EC. Targeting brain cancer: Advances in the molecular pathology of malignant glioma and medulloblastoma. Nat Rev Cancer. 2010;10(5):319–331. doi: 10.1038/nrc2818. [DOI] [PubMed] [Google Scholar]
- 14.Verhaak RG, et al. Cancer Genome Atlas Research Network Integrated genomic analysis identifies clinically relevant subtypes of glioblastoma characterized by abnormalities in PDGFRA, IDH1, EGFR, and NF1. Cancer Cell. 2010;17(1):98–110. doi: 10.1016/j.ccr.2009.12.020. [DOI] [PMC free article] [PubMed] [Google Scholar]
- 15.Lunyak VV, et al. Corepressor-dependent silencing of chromosomal regions encoding neuronal genes. Science. 2002;298(5599):1747–1752. doi: 10.1126/science.1076469. [DOI] [PubMed] [Google Scholar]
- 16.Wagoner MP, Roopra A. A REST derived gene signature stratifies glioblastomas into chemotherapy resistant and responsive disease. BMC Genomics. 2012;13:686. doi: 10.1186/1471-2164-13-686. [DOI] [PMC free article] [PubMed] [Google Scholar]
- 17.Su X, et al. Abnormal expression of REST/NRSF and Myc in neural stem/progenitor cells causes cerebellar tumors by blocking neuronal differentiation. Mol Cell Biol. 2006;26(5):1666–1678. doi: 10.1128/MCB.26.5.1666-1678.2006. [DOI] [PMC free article] [PubMed] [Google Scholar]
- 18.Zhang P, Lathia JD, Flavahan WA, Rich JN, Mattson MP. Squelching glioblastoma stem cells by targeting REST for proteasomal degradation. Trends Neurosci. 2009;32(11):559–565. doi: 10.1016/j.tins.2009.07.005. [DOI] [PMC free article] [PubMed] [Google Scholar]
- 19.Ceccarelli M, et al. TCGA Research Network Molecular profiling reveals biologically discrete subsets and pathways of progression in diffuse glioma. Cell. 2016;164(3):550–563. doi: 10.1016/j.cell.2015.12.028. [DOI] [PMC free article] [PubMed] [Google Scholar]
- 20.Sabha N, et al. Analysis of IDH mutation, 1p/19q deletion, and PTEN loss delineates prognosis in clinical low-grade diffuse gliomas. Neuro Oncol. 2014;16(7):914–923. doi: 10.1093/neuonc/not299. [DOI] [PMC free article] [PubMed] [Google Scholar]
Associated Data
This section collects any data citations, data availability statements, or supplementary materials included in this article.


