Significance
Neurons concentrate voltage-gated sodium channels (VGSCs) in axons while limiting VGSCs in the somatodendritic compartment. This axonal concentration is important for efficient generation of the action potential, but it remains unclear what limits the concentration of VGSCs in the somatodendritic compartment. Here, we report that two highly similar molecules, FGF13 and FGF14, collaborate to maintain proper VGSC localization. FGF13 is a critical mediator of the process that keeps VGSCs low in the somatodendritic compartment, whereas FGF14 is an important regulator of VGSC localization to the axon.
Keywords: voltage-gated sodium channels, FGF homologous factors, FGF13, FGF14
Abstract
Clustering of voltage-gated sodium channels (VGSCs) within the neuronal axon initial segment (AIS) is critical for efficient action potential initiation. Although initially inserted into both somatodendritic and axonal membranes, VGSCs are concentrated within the axon through mechanisms that include preferential axonal targeting and selective somatodendritic endocytosis. How the endocytic machinery specifically targets somatic VGSCs is unknown. Here, using knockdown strategies, we show that noncanonical FGF13 binds directly to VGSCs in hippocampal neurons to limit their somatodendritic surface expression, although exerting little effect on VGSCs within the AIS. In contrast, homologous FGF14, which is highly concentrated in the proximal axon, binds directly to VGSCs to promote their axonal localization. Single-point mutations in FGF13 or FGF14 abrogating VGSC interaction in vitro cannot support these specific functions in neurons. Thus, our data show how the concerted actions of FGF13 and FGF14 regulate the polarized localization of VGSCs that supports efficient action potential initiation.
The voltage-gated sodium channel (VGSC) family has nine well-characterized isoforms (NaV1.1–NaV1.9) in mammalian cells (1). In most primary neurons, efficient action potential initiation depends on the clustering of VGSCs at the axon initial segment (AIS) (2–4). VGSC density within the AIS is ∼10- to 80-fold higher than in the somatodendritic compartment (5, 6), even though VGSCs are initially inserted into both somatodendritic and axonal membranes (7). Several mechanisms contribute to VGSC concentration in the AIS. Work in hippocampal neurons with reporter constructs of NaV1.2 domains showed that most VGSCs that are trafficked to the somatodendritic plasma membrane are endocytosed (8, 9). Additionally, those VGSCs trafficked to the AIS are trapped there via association with the cortical cytoskeleton (3, 4, 10, 11). The cytoplasmic II-III linker within the pore-forming α-subunit of VGSCs contains a binding motif for the cytoskeletal scaffolding molecule ankyrin-G, and thereby serves as a critical determinant for localization within the AIS (10–12). Even though the ankyrin-G binding site in VGSCs is highly conserved between different VGSCs (13), their subcellular localization is not identical (6). This observation raises the question of whether there are additional regulators for the subcellular localization of VGSCs. Importantly, are there factors specific to somatic VGSCs that limit their surface expression to levels much lower than other somatic membrane proteins (e.g., somatic KV channels)?
A promising pool from which such regulators may be found is the set of VGSC auxiliary proteins known to associate with the pore-forming α-subunit (14). Among the intracellular VGSC regulators are the FGF homologous factors (FHFs), noncanonical members of the FGF superfamily that are neither secreted nor appear to function as growth factors (15–18). Rather, the four FHFs (FGF11–FGF14) each contain a VGSC interaction site within a homologous FGF-like core domain (19, 20) and exert variable effects on VGSC functional properties (21–23). The importance of FHFs is underscored by loss-of-function or dominant negative mutations in specific FHFs associated with various neurological disorders, which have been attributed, at least in part, to VGSC dysfunction. Haploinsufficiency for FGF14 or the expression of a dominant negative FGF14 mutant causes spinocerebellar ataxia (SCA27), and Fgf14−/− mice recapitulate many of the phenotypes observed in patients who have SCA27, including cognitive impairment as well as ataxia (24–27). In neurons isolated from Fgf14−/− mice, VGSC currents and excitability are both reduced (23). As for FGF13, it has been implicated in disorders such as Borjeson–Forssman–Lehmann syndrome, X-linked SCA5, and epilepsy (28–30). Given their homology within their core VGSC binding domain (79% identity) and in their ascribed functions, it is puzzling why these two FHFs differentially contribute to disease. Although discrepancies in expression patterns throughout the brain are a likely contributor, other differences may exist to explain the differential pathological consequences within regions, such as the hippocampus, in which both are present.
Here, we demonstrate that FGF13 limits VGSC cell surface expression within the somatodendritic compartment and FGF14 increases VGSC surface expression, and consequently affects localization of VGSCs to the AIS. Consistent with these roles, FGF14 is concentrated in the AIS, whereas FGF13 is abundant in the somatodendritic compartment. These effects are likely due to direct binding of the FHFs to VGSCs because point mutations that abrogate FHF–VGSC interaction in vitro impair FHF regulation of VGSCs. Given the high degree of homology between FGF13 and FGF14, particularly within their VGSC binding domains, these differential effects are unexpected and reveal previously unappreciated diversity in the FHF family. Thus, the FHFs are essential VGSC regulators that control not only channel function but also the processes that localize VGSCs to the AIS, while limiting their presence within the somatodendritic compartment.
Results
FGF13 and FGF14 Are Differentially Localized Within Hippocampal Neurons.
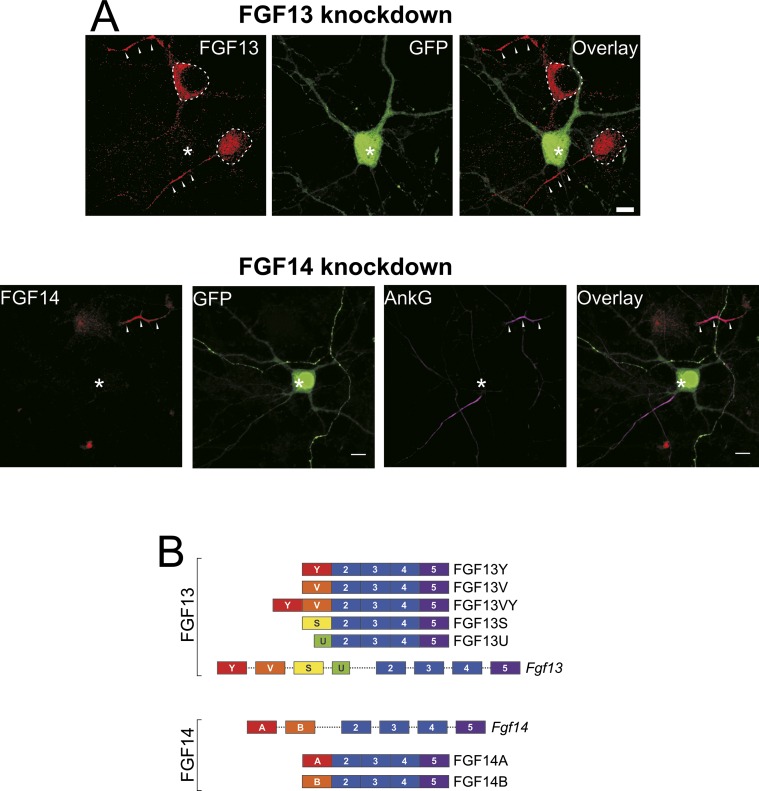
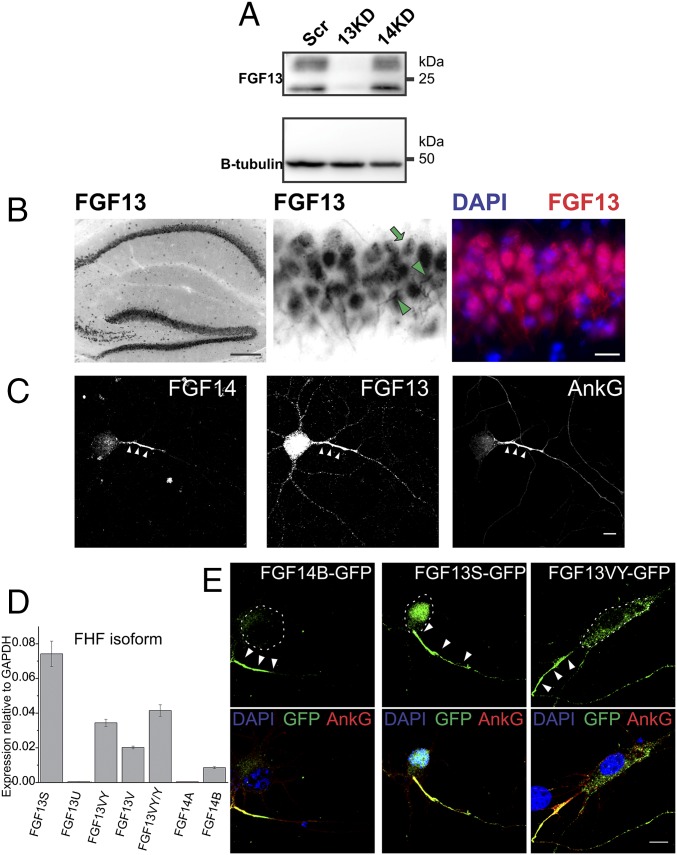
To gain insight into possible regulatory roles for FGF13 and FGF14, we first examined their neuronal localizations. Although the localization of FGF14 to the axons of neurons has been well studied (23, 31, 32), the localization of FGF13 in the CNS has not been as extensively detailed. We have previously used a custom-made FGF13 Ab and FGF13 shRNA to examine FGF13 function in cardiomyocytes (33, 34). Here, we validated these tools in hippocampal neurons with immunocytochemistry (Fig. S1A) and Western blotting (Fig. 1A). WT neurons exhibited robust immunoreactivity in the somatodendritic compartment (Fig. S1A, dashed lines) and axon (Fig. S1A, arrowheads). The FGF13 signal in the soma could be seen in the cytoplasm and often in the nucleus. The nuclear localization of FGF13 is consistent with previous reports that one isoform of FGF13 has a nuclear localization signal (15). Neurons transfected with the FGF13 shRNA (Fig. S1A, asterisks) display very little immunoreactivity to the FGF13 Ab compared with neurons on the same coverslips that are untransfected. Having thus validated the specificity of our Ab, we observed FGF13 localization in the hippocampus in brain slices, wherein the FGF13 signal is prominent in pyramidal neurons (Fig. 1B, Left), a cell population in which FGF14 is also highly expressed (31, 32). As in cultured hippocampal neurons, FGF13 localized to axons (Fig. 1B, Middle, arrowheads) and in the soma, often displaying a prominent nuclear signal (Fig. 1B, Middle, arrow). An initial clue that these VGSC regulators may have distinct, nonredundant roles came from their strikingly dissimilar subcellular distributions within the same neuron. As expected by its localization to the axons of cerebellar granule neurons (23) and previous work in hippocampal neurons (31, 32), FGF14 was concentrated in the axons of cultured hippocampal neurons (Fig. 1C, Left). In contrast, the FGF13 signal was high in the somatodendritic regions of neurons as well as within the axon (Fig. 1C, Middle). To confirm the observed patterns for FGF13 and FGF14 detected by immunohistochemistry, we analyzed the distribution of GFP-fused isoforms of FGF13 and FGF14 expressed in cultured hippocampal neurons. Each FHF gene generates several transcripts by use of alternate promoters and alternative splicing of a first exon onto exons 2–5 (18) (Fig. S1B). Therefore, to choose appropriate isoforms for this study, we first determined by quantitative RT-PCR that FGF13S and FGF13VY were the most abundant FGF13 transcripts and FGF14B was the most abundant FGF14 transcript in cultured hippocampal neurons (Fig. 1D), consistent with what we previously observed for whole brain (33). Having defined the appropriate transcripts for analysis, we observed that the cellular distributions of these three GFP-fused FHFs recapitulated what we observed for the endogenous FHFs by immunohistochemistry. All these VGSC binding partners were enriched in the axon (Fig. 1E, white arrowheads), as defined by the AIS marker ankyrin-G, but both FGF13S-GFP and FGF13VY-GFP were also abundant in the somatodendritic compartments (Fig. 1E, dashed lines). FGF13S was highly concentrated in the nucleus, consistent with the nuclear localization signal found in this isoform (18), whereas FGF13VY was abundant in the somatodendritic compartment. This somatodendritic localization contrasted with FGF14B-GFP, for which little signal was found in the somatodendritic compartment and was, instead, mostly found in the AIS. Although the axon-restricted localization of FGF14 is similar to previous observations and consistent with its role in VGSC regulation, the somatodendritic subcellular distribution of FGF13 within hippocampal pyramidal neurons suggested roles for FGF13 regulation of VGSCs beyond direct modulation of VGSCs in the AIS.
Fig. S1.
Efficacy of FHF knockdown and schematic of FHF isoforms. (A, Upper) Immunocytochemistry of FGF13 in isolated hippocampal neurons. FGF13 is localized to axons (arrowheads) and to neuronal soma (dashed lines), often, but not always, including the nucleus. Transfection of hippocampal neurons with FGF13 shRNA (asterisk) abolishes most of the immunoreactive signal to the FGF13 Ab. (Scale bar: 10 μm.) (A, Lower) Similarly, the immunoreactive signal for FGF14, which is localized most prominently to axons (arrowheads) is lost when neurons are treated with FGF14 shRNA (asterisk). (Scale bar: 10 μm.) AnkG, ankyrin-G. (B) Schematic diagram of the various isoforms of FGF13 and FGF14. Each isoform differs only in its N-terminal component as encoded by different first exons from alternative promoter use. Exon and intron lengths are not drawn to scale.
Fig. 1.
FGF13 and FGF14 are present in hippocampal neurons but have distinct subcellular localizations. (A) Immunoblotting for FGF13 in neurons infected with viruses transducing Scr shRNA (Scr), FGF13 knockdown shRNA (13KD), or FGF14 knockdown shRNA (14KD). The FGF13 shRNA, but not the Scr or FGF14 shRNA, eliminates virtually all immunoreactivity to the FGF13 Ab. Various isoforms of FGF13 have different molecular weights, but, notably, all bands are reduced by the FGF13 shRNA targeted to knock down all isoforms. (B) Immunohistochemistry of FGF13 in hippocampal brain slices shows abundant expression in pyramidal cell axons (arrowheads) and soma, often including the nucleus (arrow). (Scale bars: Left, 200 μm; Middle and Right, 20 μm.) (C) Subcellular localizations of FGF14 and FGF13 differ in cultured hippocampal neurons. Whereas FGF14 is mostly localized to the AIS marked by ankyrin-G, FGF13 is widely distributed in both the axon and the somatodendritic compartment. (D) qPCR of FGF13 and FGF14 isoforms in cultured hippocampal neurons. FGF13S and FGF13VY were the most abundant FGF13 isoforms, whereas FGF14B was the only FGF14 isoform expressed. (E) GFP-fused reporter constructs of FGF14B, FGF13S, and FGF13VY expressed in cultured hippocampal neurons all localized to the axon (white arrowheads), as marked by ankyrin-G (AnkG), Although FGF14B was axonally restricted, FGF13S and FGF13VY were both abundant in the somatodendritic compartment. (Scale bar: 10 μm.) The dashed lines demarcate the soma associated with the axon indicated by arrowheads.
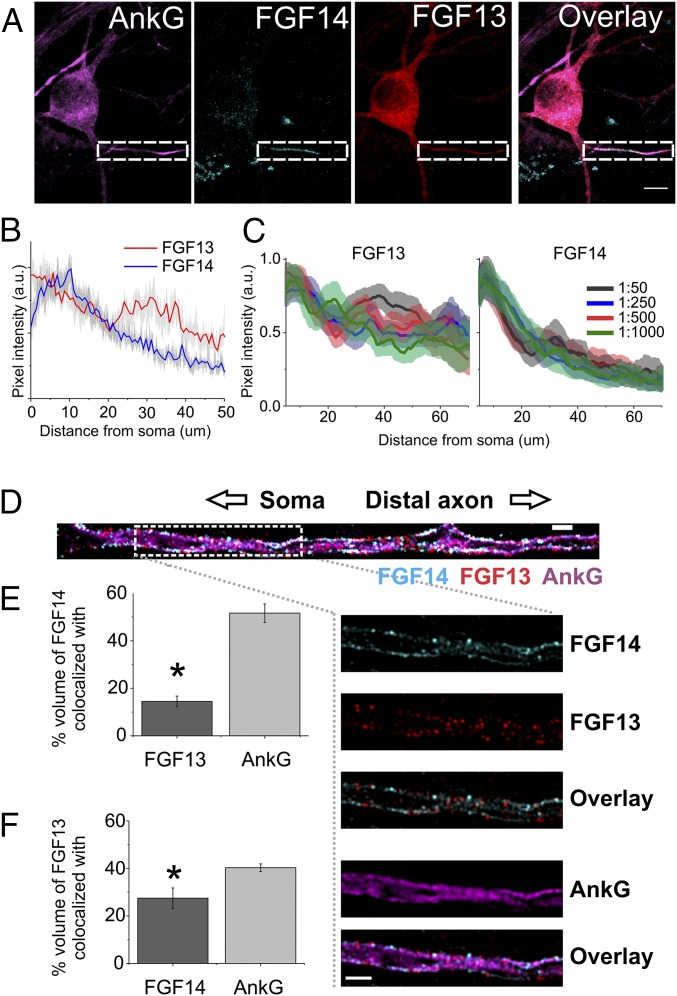
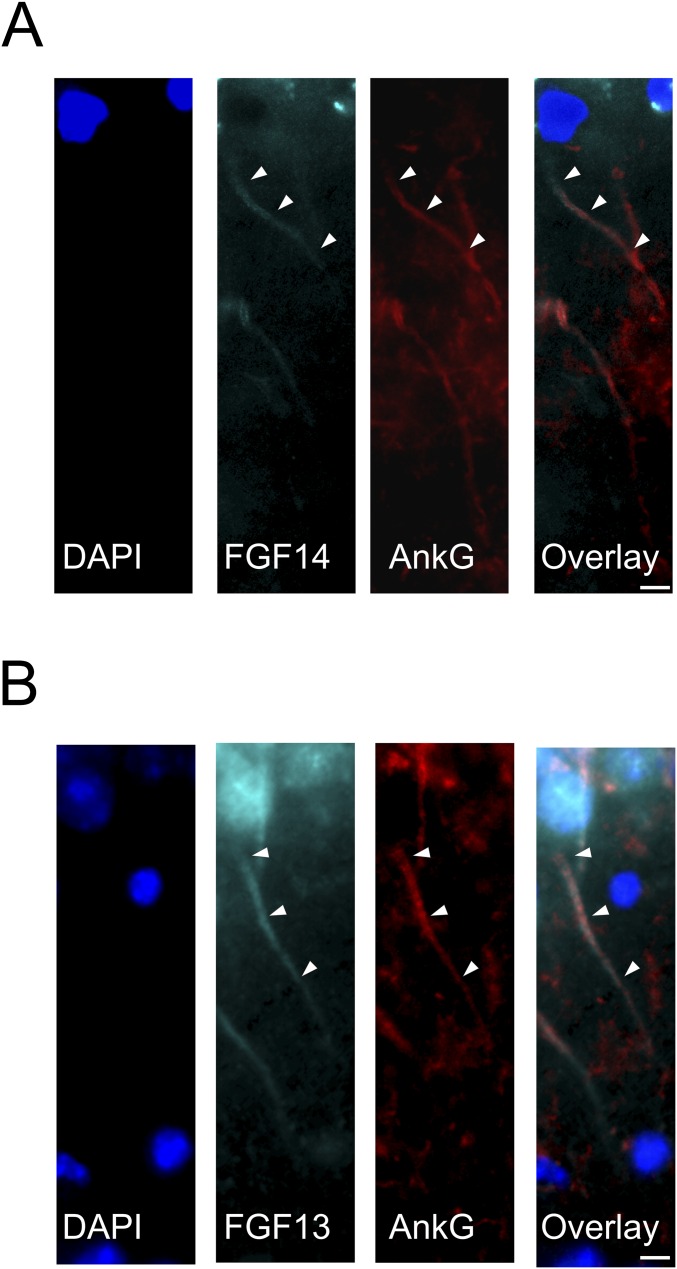
To obtain more detailed analysis of the localization of endogenous FGF13 and FGF14 in cultured hippocampal neurons, we analyzed their distributions within the axon where both are found. Using the ankyrin-G–positive region of the axon to define the AIS, FGF14 was almost entirely localized to the proximal AIS, whereas FGF13 was present both in the proximal AIS and more distally (Fig. 2A). A similar pattern of FGF13 and FGF14 distribution relative to ankyrin-G was also seen in immunostained sections of adult hippocampus (Fig. S2). We quantified the relative difference between the FGF13 and FGF14 signals along the axons with line scans in cultured neurons double-labeled for FGF13 and FGF14 and plotted the normalized pixel intensity against distance from the soma (Fig. 2B). This analysis showed that FGF13 and FGF14 were both abundant within the first ∼20 μm of the AIS, but there was relatively more FGF13 than FGF14 beyond 20 μm. Importantly, although the precise locations of FGF13 and FGF14 immunoreactivity differed between neurons, this qualitative observation held true for every neuron examined. Moreover, this pattern was consistent when the analysis was performed over a range of Ab concentrations (Fig. 2C), suggesting that this pattern was not due to an artifact of Ab dilution. Thus, even in the restricted subcellular locale of the AIS where VGSCs are concentrated, these two homologous FHFs show distinct patterns.
Fig. 2.
Differential FGF13 and FGF14 localization within the AIS of cultured hippocampal pyramidal neurons. (A) Immunocytochemistry of endogenous FGF13 and FGF14. The boxed areas highlight the AIS (identified by ankyrin-G staining). (Scale bar: 10 μm.) (B) Quantification of FGF13 and FGF14 signal intensity within the AIS in 19 neurons. Pixel values are normalized to maximum pixel values for each dataset (red and blue lines show average, gray indicates SEM). FGF13 extended further distally than FGF14 within the AIS. (C) FGF13 immunoreactivity (Left) in the axon plotted as pixel intensity vs. distance from the soma for Ab dilutions of 1:50, 1:250, 1:500, and 1:1,000; FGF13 immunoreactivity extends further than FGF14 immunoreactivity (Right) in the axon for the same range of Ab dilutions. (D) Representative SIM images of endogenous FGF13 and FGF14 within the AIS membrane delineated by the AIS marker ankyrin-G. (Scale bar: 1 μm.) (Insets) Area marked by the dashed white box is enlarged. (E and F) Colocalization analysis of SIM images. FGF14 (*P = 9.1E-7 compared with colocalization with ankyrin-G; n = 9) (E) and FGF13 (*P = 0.015 compared with colocalization with ankyrin-G; n = 9) (F) both showed less colocalization with each other than with ankyrin-G.
Fig. S2.
FGF13 and FGF14 distributions are also different in hippocampal slices. Magnified immunohistochemistry images of hippocampal slices from adult mouse brains show the distribution of FGF14 (A) or FGF13 (B). The AIS is marked (AnkG). The subcellular distribution in adult hippocampal neurons of FGF13 and FGF14 is similar to what we observed for neurons in culture. Note that the FHFs and ankyrin-G do not exhibit complete colocalization. (Scale bars: 10 μm.)
Structured illumination microscopy (SIM) confirmed that FGF13 extended more distally than FGF14 within the AIS, and colocalization analyses also showed that the FGF13 and FGF14 signals displayed limited overlap (Fig. 2 D–F). In contrast, both FGF13 and FGF14 displayed a relatively high overlap with ankyrin-G (Fig. 2 D–F). These data suggest different targeting sites for FGF13 and FGF14 within the AIS, which is remarkable, given the degree of sequence similarity between these two FHFs, particularly within their FGF-like core domains that contain their VGSC binding sites (19, 35, 36). Together, the distinct localization patterns of FGF13 and FGF14 suggested different roles for these FHFs within hippocampal neurons.
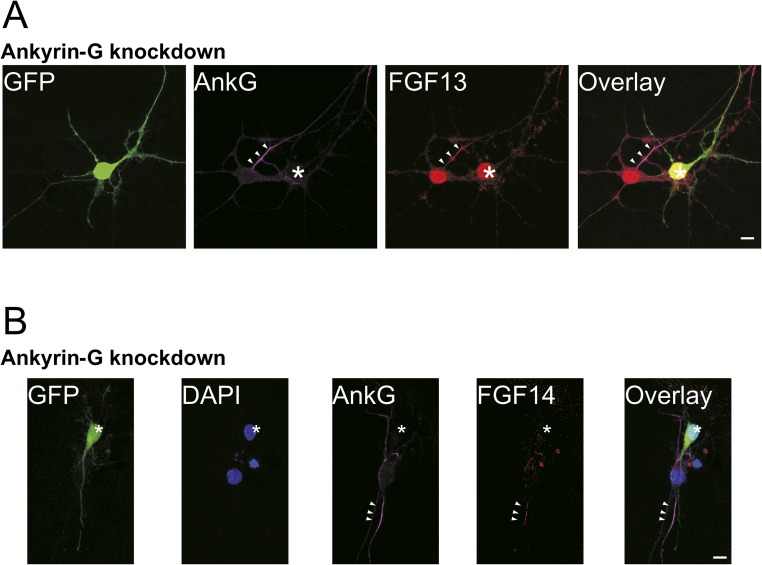
Because ankyrin-G is a known critical cytoskeletal component of the AIS, we also asked whether FGF14 and FGF13 axonal localization depended on ankyrin-G by examining the consequences of ankyrin-G knockdown. As shown in Fig. S3, both FHFs required ankyrin-G to localize properly to the AIS because the amount of FHF in the AIS was markedly reduced after ankyrin-G knockdown. This result is consistent with previous observations that the loss of ankyrin-G results in a loss of neuronal polarity and the mislocalization of major AIS proteins, such as VGSCs, neurofascin, and βIV spectrin (3, 37, 38).
Fig. S3.
Ankyrin-G is required for the AIS localization of both FGF13 and FGF14. (A) Neurons transfected with shRNA targeting ankyrin-G (GFP signal, white asterisk) have dramatically reduced levels of ankyrin-G and, as a consequence, lose the localization of FGF13 in the AIS compared with neighboring untransfected cells (white arrowheads). (Scale bar: 10 μm.) (B) Neurons transfected with shRNA targeting ankyrin-G (GFP signal, white asterisk) have dramatically reduced levels of ankyrin-G and, as a consequence, lose the localization of FGF14 in the AIS compared with neighboring untransfected cells (white arrowheads). (Scale bars: 10 μm.)
Endogenous FHFs Differentially Affect VGSC Localization Within the AIS.
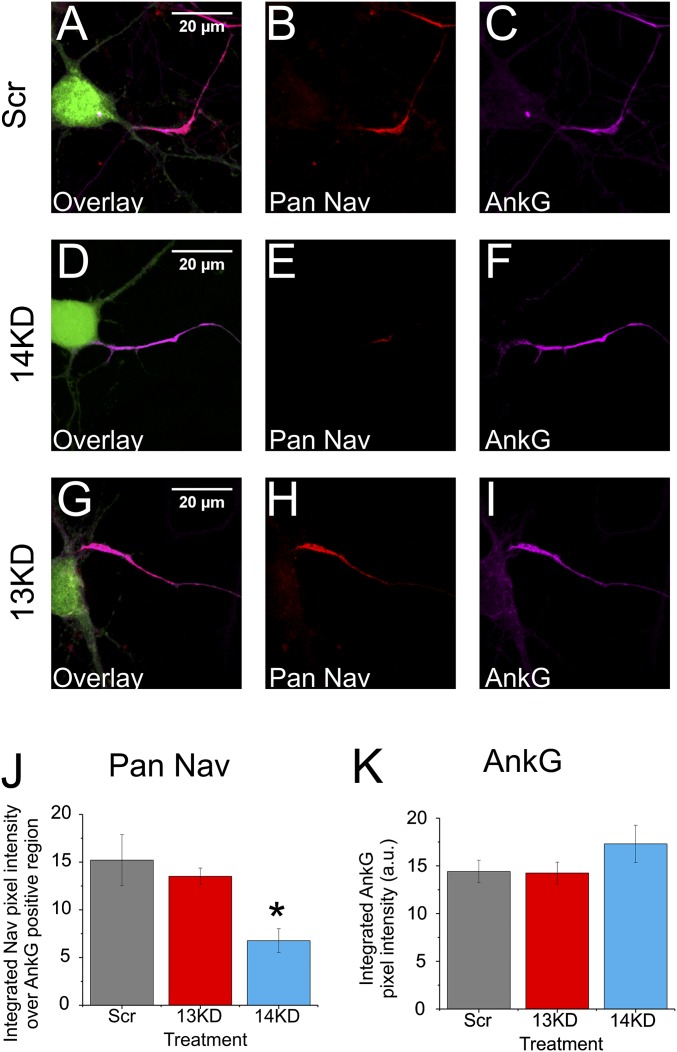
Because VGSC modulation is the most established role for FHFs, we focused on whether FGF13 and FGF14 differed in their effects upon regulation of VGSCs within hippocampal pyramidal neurons. We used a shRNA-mediated knockdown approach and first assessed the consequences of FGF13 (13KD) or FGF14 (14KD) knockdown on VGSC localization. With a mAb designed to detect all VGSC isoforms (Pan NaV), we visualized VGSCs in cultured hippocampal neurons after transfection of shRNA targeting either FGF13 or FGF14. Coexpression of GFP allowed us to identify neurons transfected with the relevant shRNAs. The VGSC signal within the AIS was significantly lower after FGF14 knockdown than after treatment with a scrambled (Scr) control shRNA (Fig. 3 A–F and J). Ankyrin-G localization and intensity were unperturbed, however, indicating that FGF14 knockdown affects VGSC localization to the AIS without grossly affecting critical structural elements of the AIS (Fig. 3K). Similar to results with FGF14 knockdown, the ankyrin-G signal intensity was unchanged after FGF13 knockdown (Fig. 3 I and K). In contrast to FGF14 knockdown, however, silencing FGF13 did not affect the VGSCs in the AIS (Fig. 3 H and J), suggesting that major regulation of VGSCs by FGF13 lay outside of the AIS.
Fig. 3.
FGF14 knockdown, but not FGF13 knockdown, reduces axonal VGSCs. (A–I) Immunocytochemistry for VGSCs and ankyrin-G in cultured hippocampal neurons after transfection with Scr shRNA, 14KD shRNA, or 13KD shRNA. VGSCs were visualized using a pan-VGSC Ab (Pan NaV). GFP (green in overlay) identified transfected neurons. (J and K) Quantifications of integrated pixel intensity along line scans down the ankyrin-G–defined AIS (*P = 0.0011; Scr, n = 11; 13KD, n = 17; 14KD, n = 12; four coverslips each). Knockdown of FGF14, but not FGF13, reduced the levels of VGSCs in the AIS. Ankyrin-G levels remained unchanged (not significant by ANOVA, P > F = 0.26448). a.u., rescaled integrated pixel intensity values.
Endogenous FGF13 and FGF14 Differentially Regulate the Levels of Functional VGSCs.
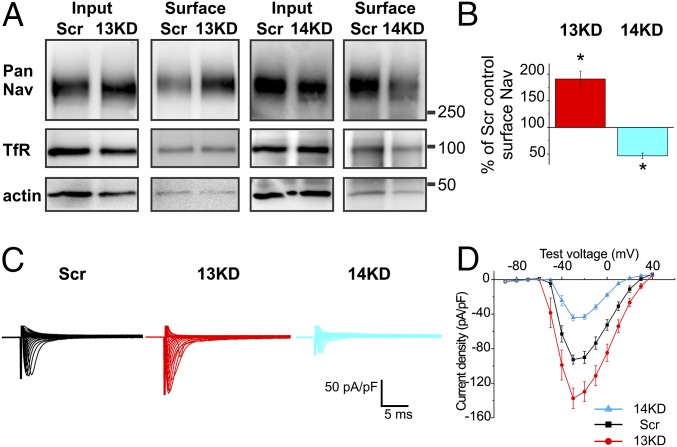
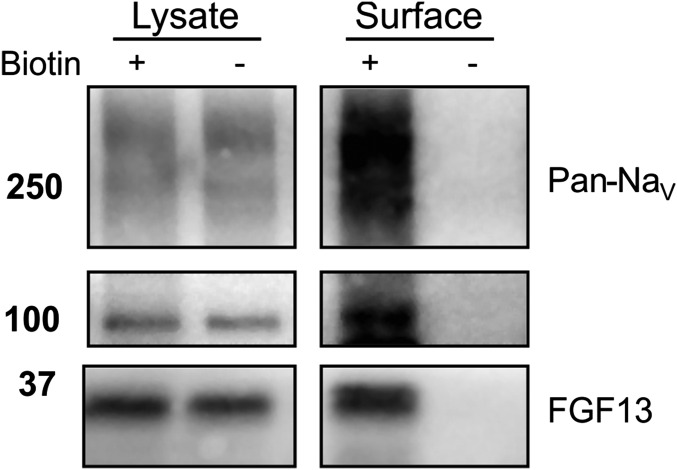
We quantified the overall effects of FGF13 or FGF14 knockdown on VGSC expression by first measuring the resultant total VGSC protein at the cell surface. Here, we performed knockdown by lentiviral infection (providing more efficient expression to obtain sufficient material for biochemical analysis) and exposed infected neurons to activated biotin before cell lysis to label proteins at the cell surface. Surface VGSCs were then detected by immunoblotting and quantified relative to total VGSC levels in cell lysate. Actin served as a loading control, and its relative absence after avidin pull-down also provided an indicator of effective separation of surface from cytoplasmic proteins (Fig. 4A). Additionally, when cells were not exposed to biotin, we detected no VGSC protein after avidin pull-down (Fig. S4). Under these conditions total VGSC protein remained unchanged after either FGF13 or FGF14 knockdown. However, the surface VGSC signal decreased by ∼50% after FGF14 knockdown, whereas we observed a near doubling in surface VGSCs after silencing FGF13 (Fig. 4 A and B). The plasma membrane protein transferrin receptor (TfR), which we have previously reported to be unaffected by FGF13 knockdown in cardiomyocytes (33, 34), was statistically unaffected by either FGF13 or FGF14 loss in hippocampal neurons (Fig. 4A; percentage of change compared with Scr control: 13KD = 38 ± 23%, P = 0.24; 14KD = 1.6 ± 13%, P = 0.91). However, variability in the data, especially for FGF13 knockdown, prevented exclusion of the null hypothesis implying no effect on TfR. Thus, it is possible that FGF13 has some effect on TfR levels, although this effect did not seem to be reproducible. VGSC currents recorded in whole-cell voltage-clamp recordings demonstrated that the observed opposing changes in VGSC surface levels after FGF13 or FGF14 knockdown translated directly into opposing functional changes. Consistent with the reduction in surface VGSC protein observed after FGF14 knockdown, VGSC current density was significantly reduced after FGF14 knockdown compared with treatment with Scr shRNA (Fig. 4 C and D). In contrast, VGSC current density increased after FGF13 knockdown (Fig. 4 C and D). Thus, the effects upon VGSC current density after FGF13 or FGF14 knockdown aligned with the observed amounts of VGSC protein at the surface membrane. Due to the differences between surface biotinylation and voltage-clamp recordings, magnitudes of the observed effects would be expected to vary. However, the relative increase or reduction in VGSC current density paralleled the increase or reduction in the amount of VGSC protein at the cell surface, suggesting that the change in the functional readout (VGSC current density) after FHF knockdown results from a change in the amount of VGSC protein at the cell surface. Additionally, although the mode of delivery of the shRNA differed between experiments measuring surface biotinylation (viral infection) and VGSC currents (transfection), the efficacy of FHF knockdown appeared similar. The decreases in total protein quantified by Western blot densitometry (73 ± 7% decrease in 13KD-infected cultures: n = 4 independent cultures, P = 0.0001; 78 ± 12% decrease in 14KD-infected cultures: n = 3 independent cultures, P = 0.01) correlate well with the decreased expression in individually transfected cells based on immunofluorescence quantification (75 ± 2% decrease for 13KD: control, n = 6; 13KD, n = 10, P = 0.0058; 79 ± 6% decrease for 14KD: control, n = 6; 14KD, n = 6, P = 6.5E-6).
Fig. 4.
FGF13 and FGF14 knockdown differentially affect VGSC membrane protein and current density. (A) Immunoblots of total levels of VGSCs or TfRs from lysates (Input, 10 μg) or biotinylated surface proteins after streptavidin pulldown (Surface, 400 μg) from cultured hippocampal neurons infected with viruses to transduce either Scr shRNA, 13KD shRNA, or 14KD shRNA. (B) Quantification of surface VGSCs (13KD, *P = 0.025; 14KD, *P = 0.0096; n = 3 independent cultures, each at 10 DIV) revealed a decrease in membrane VGSCs upon FGF14 knockdown, whereas FGF13 knockdown increased the amount of VGSCs at the membrane surface. (C) Exemplar VGSC currents after transfection of Scr shRNA, 13KD shRNA, or 14KD shRNA. (D) Summarized current–voltage curve (Scr, n = 16; 13KD, n = 18; 14KD, n = 15). FGF14 knockdown reduced VGSC current density, whereas FGF13 knockdown increased it (maximum current density: Scr = −93.65 pA/pF, 13KD = −137.50 pA/pF, *P = 0.00015; 14KD = −45.52 pA/pF, *P = 7.3E-5).
Fig. S4.
Avidin pull-down of VGSCs requires biotinylation. Immunoblots of total levels of VGSCs (Pan-NaV), Tfrs, or FGF13 from cellular lysates (Lysate) or after biotinylation (+) or control (−, no biotin added) followed by avidin pull-down (Surface). When biotin was not added (−), no proteins were detected in the avidin pull-down.
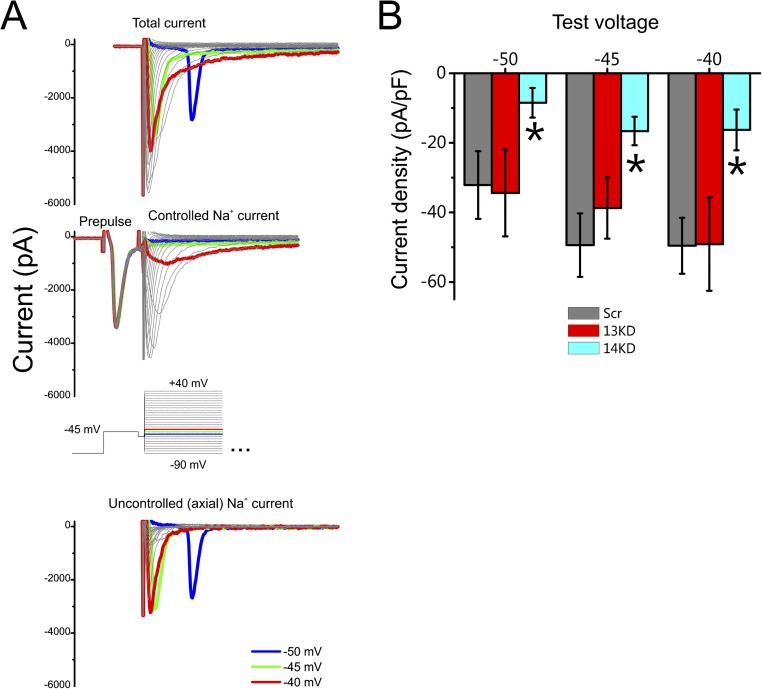
Having confirmed that FGF13 knockdown increased the total surface levels of VGSCs (Fig. 4) without affecting the VGSC signal at the AIS (Fig. 3), we tested the resultant inference that FGF13 does not affect the function of VGSCs in the AIS. As a measure of whether this hypothesis might be true, we exploited a prepulse protocol designed to inactivate axonal VGSCs selectively (39) (Fig. S5; details are provided in Methods), thereby providing the means to separate uncontrolled axial VGSC currents from well-controlled VGSC somatic currents. Subtraction of the total VGSC current after application of the prepulse from total VGSC currents without a prepulse leaves the axial component (Fig. S5A). Applying this approach in FGF13 and FGF14 knockdown neurons provided contrasting results. Consistent with our hypothesis that FGF13 did not affect axial VGSCs, FGF13 knockdown had no effect on the axial component remaining after subtraction compared with Scr control, whereas FGF14 decreased the axial component by >67% (Fig. S5B). This prepulse protocol was not designed for quantitative assessment of the axial component; thus, we used it here simply for comparative purposes. There is a clear difference between FGF13 knockdown, which increases total VGSC current density but does not increase the axial component, and FGF14 knockdown, which decreases both total VGSC current as well as the axial component. This observation is strikingly concordant with the results from the immunocytochemical experiments in Fig. 3, and, taken together, they suggest that FGF13 has limited influence on VGSCs in the axon. It is unlikely that electrical heterogeneity was a confounding factor in this analysis because cells were chosen based on their pyramidal morphology and similar somatic sizes, as measured by capacitance measurements made from the recording pipette in the soma [in picofarads (pF); Scr = 46.20 ± 4.07, 13KD = 47.50 ± 4.08, 14KD = 45.23 ± 3.99].
Fig. S5.
13KD does not affect axial current. (A) Exemplar current traces without (Top) and with (Middle) a prepulse protocol to remove axial escape spikes generated by axonal VGSCs. (Bottom) Subtraction of the currents obtained with the prepulse from the total currents yields the axial component of current. (Inset) Voltage protocol is shown. (B) Peak axial currents were decreased by 14KD, but not by 13KD, compared with a Scr control (*P < 0.05 by ANOVA followed by Fisher’s least significant difference post hoc test) (Scr, n = 12; 13KD, n = 9; 14KD, n = 11).
FGF13VY Isoform Limits VGSC Current Density.
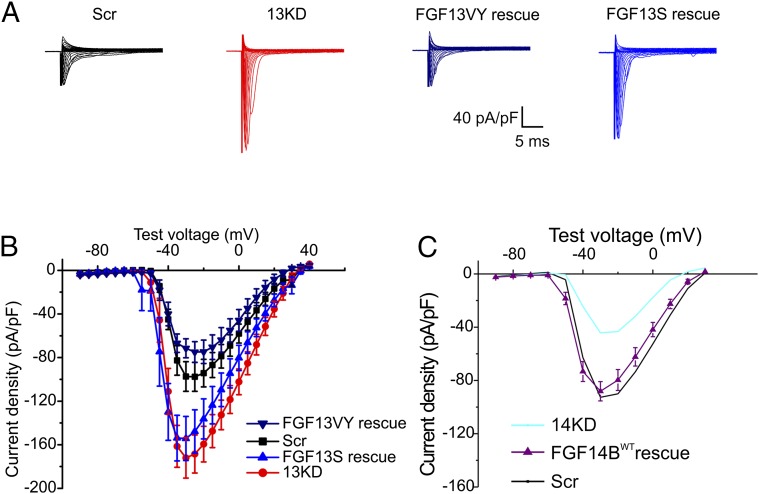
Having established that FGF13 limits the surface expression of VGSCs predominantly within the somatodendritic compartment in hippocampal neurons, we sought to determine which FGF13 isoform(s) participated in this process. Because FGF13S and FGF13VY isoforms were the most abundant transcripts (Fig. 1D), we tested whether expression of an shRNA-resistant FGF13S and/or FGF13VY could “rescue” the effects of FGF13 knockdown (of all isoforms). In the context of FGF13 knockdown, expression of FGF13VY, but not FGF13S, restored VGSC current density to control levels (Fig. 5 A and B) [maximum current density in picoamperes (pA)/pF, Scr = −97.68 ± 13.35, 13KD = −172.05 ± 18.56, FGF13VY rescue = −74.99 ± 9.56, FGF13S rescue = −154.26 ± 20.19; Scr vs. FGF13VY rescue not significant (N.S.), P = 0.36; Scr vs. FGF13S rescue, P = 0.02; 13KD vs. FGF13S rescue N.S., P = 0.46]. These data suggest that FGF13VY, and not FGF13S, is responsible for the observed FGF13 regulation of the VGSC current density and surface protein in hippocampal neurons. We confirmed that the failure of FGF13S to rescue the effects of FGF13 knockdown was not due to an inability to express exogenous FGF13S in mammalian cells (Fig. 1E). The selective rescue of FGF13 knockdown by expression of shRNA-resistant FGF13VY also provided evidence that the effects of our FGF13 shRNA are on-target.
Fig. 5.
FGF13VY limits VGSC current density, whereas FGF14B increases it. (A) Exemplar current traces from cultured hippocampal neurons treated with Scr shRNA, 13KD shRNA, FGF13 shRNA plus shRNA-resistant FGF13VY (FGF13VY rescue), or FGF13 shRNA plus shRNA-resistant WT FGF13S (FGF13S rescue). (B) Current–voltage relationships for Scr shRNA, 13KD shRNA, FGF13VY, and FGF13S rescue (Scr: n = 16; 13KD, n = 16; FGF13VY rescue, n = 10; FGF13S rescue, n = 11). FGF13VY is capable of reversing the increase in current density seen upon knockdown of all FGF13 isoforms [maximum current density: Scr = −97.68 ± 13.35 pA/pF, 13KD = −172.05 ± 18.56 pA/pF, FGF13VY rescue = −74.99 ± 9.56 pA/pF; Scr and FGF13VY rescue, not significant (N.S.); P = 0.36]. FGF13S did not restore the 13KD-mediated increase in current density (maximum current density: Scr = −97.68 ± 13.35 pA/pF, 13KD = −172.05 ± 18.56 pA/pF, FGF13S rescue = −154.26 ± 20.19 pA/pF; *P = 0.02; 13KD and FGF13S rescue, N.S.; P = 0.46). (C) Current–voltage relationship from cultured hippocampal neurons treated with FGF14 plus shRNA-resistant WT FGF14 (FGF14BWT rescue, n = 15). These experiments were conducted in conjunction with the experiments from Fig. 4, so the Scr shRNA and 14KD shRNA current–voltage relationships from Fig. 4 are repeated for comparison. The deficit in current density caused by 14KD could be rescued by FGF14BWT, indicating that FGF14B promotes VGSC surface expression (maximum current density: Scr = −93.65 ± 6.17 pA/pF, 14KD = −45.52 ± 3.22 pA/pF, FGF14B rescue = −88.12 ± 7.24 pA/pF; *P = 7.3E-5; Scr and FGF14B rescue, N.S.; P = 0.20).
FGF14B Increases VGSC Current Density.
Although Fgf14 encodes two transcripts, FGF14A and FGF14B, we did not detect FGF14A in hippocampal neurons (Fig. 1D). Therefore, we tested whether expression of an shRNA-insensitive FGF14B provided rescue of FGF14 knockdown. Indeed, expression of FGF14B completely restored the FGF14 knockdown-induced reduction in VGSC current density (maximum current density in picoamperes per picofarads: Scr = −93.65 ± 6.17, 14KD = −45.52 ± 3.22, FGF14B rescue = −88.12 ± 7.24; Scr vs. 14KD, P = 7.3E-5; Scr vs. FGF14B rescue N.S., P = 0.20) (Fig. 5C), providing confirmation that our FGF14 shRNA is also on-target.
FGF13 Regulates Somatodendritic VGSC Endocytosis.
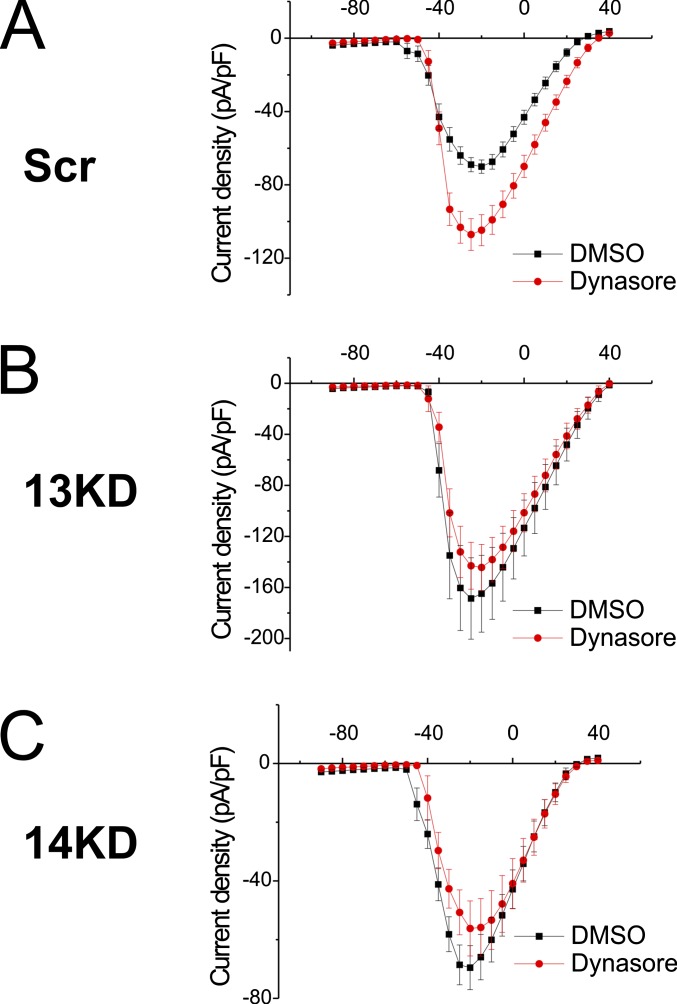
The increase in VGSC surface expression (Fig. 4 A and B) and current density (Fig. 4 C and D) after FGF13 knockdown led us to hypothesize that FGF13 promoted VGSC endocytosis from the soma. We tested this idea by analyzing the effects of the dynamin inhibitor dynasore in the context of FGF13 knockdown. As expected after inhibition of endocytosis by treatment with dynasore, current density increased in Scr control neurons (Fig. S6A) (maximum current density in picoamperes per picofarads: Scr + DMSO = −70.1 ± 3.6, Scr + dynasore = −107.1 ± 8.7; P = 0.0008). After FGF13 knockdown however, we did not observe a dynasore-mediated increase in current density (Fig. S6B) (maximum current density in picoamperes per picofarads: 13KD + DMSO = −168.5 ± 31.9, 13KD + dynasore = −144.2 ± 18.0; P = 0.55), suggesting endocytosis was already maximally inhibited by FGF13 knockdown. In FGF14 knockdown neurons, dynasore treatment did not increase current density, consistent with our hypothesis that FGF14 affects the trafficking of VGSCs to the membrane (Fig. S6C) (maximum current density in picoamperes per picofarads: 14KD + DMSO = −69.1 ± 6.1, 14KD + dynasore = −56.2 ± 9.4; P = 0.24). Knockdown of FGF14 thus deprives the membrane of sodium channels (as illustrated in Fig. 4) and renders the inhibition of endocytosis mostly ineffective in increasing membrane VGSCs.
Fig. S6.
Inhibition of endocytosis is not additive to 13KD and does not oppose 14KD. (A) Dynasore treatment increases current density (DMSO, n = 16; dynasore, n = 19; P = 0.0008) in Scr neurons compared with DMSO-treated controls. (B) Dynasore treatment does not increase the current density (DMSO, n = 9, dynasore, n = 7; P = 0.55) of 13KD neurons. (C) Dynasore treatment does not increase the current density (DMSO, n = 10, dynasore, n = 9; P = 0.24) of 14KD neurons.
FGF13VY-Dependent and FGF14B-Dependent Effects on VGSCs Require Direct Binding to VGSCs.
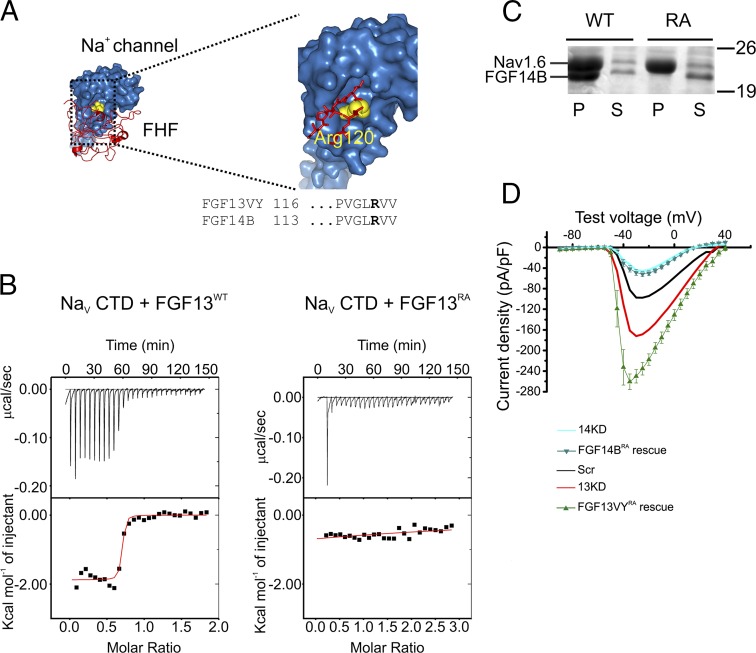
Because we had shown in a previous study in cerebellar Purkinje neurons that a direct interaction between FGF14B and the VGSC C-terminal domain (CTD) was required for complete FGF14-dependent regulation (40), we tested whether a direct interaction was also required for FGF13VY- and FGF14B-dependent regulation of VGSC localization in cultured hippocampal neurons. Based on analysis of a crystal structure of a complex containing an FHF and VGSC CTD (FGF13 and NaV1.2 CTD, respectively), we identified a highly conserved Arg in FHFs (R120 in FGF13VY or R117 in FGF14B) that inserts into a highly conserved depression on the VGSC CTD surface (Fig. 6A). We previously showed through coimmunoprecipitation experiments that mutation of this Arg to an Ala abrogates the ability of FGF14B to interact with VGSCs (40). Here, we tested the interaction directly with purified proteins. Isothermal titration calorimetry (ITC) of WT FGF13 and a VGSC CTD produces a robust binding curve and yields a Kd = 123 ± 2 nM. However, mutation of the relevant Arg to an Ala leads to a complete loss of binding (Fig. 6B). To validate further that the R→A mutation removes FGF14 interaction with VGSCs, we coexpressed either WT or mutant FGF14 and a 6× His-tagged NaV1.6 CTD in Escherichia coli. Metal affinity chromatography purification of the 6× His-tagged NaV1.6 CTD yielded copurification of the WT FGF14B but not of the R→A mutant (Fig. 6C). We then asked whether direct interaction with VGSCs was required for rescue of both FGF13VY and FGF14B. Mutation of R120 in FGF13VY to an Ala (FGF13VYRA) rendered FGF13VY incapable of restoring the FGF13 knockdown-mediated increase in current density back to control levels (maximum current density in picoamperes per picofarads: FGF13VY rescue = −74.99 ± 9.56, FGF13VYR/A rescue = −260.79 ± 15.12; *P = 6.4E-9) (Fig. 6D). Instead, the recorded currents were even larger than FGF13 knockdown alone, perhaps reflecting a dominant negative effect of the noninteracting FGF13VYRA construct. The shRNA-insensitive R117A mutant FGF14B (FGF14BRA) also failed to rescue the decrease in VGSC current density after FGF14 knockdown (maximum current density in picoamperes per picofarads: FGF14B rescue = −88.12 ± 7.24, FGF14BRA rescue = −51.76 ± 4.90; *P = 0.026), in contrast to the successful rescue with WT FGF14B. These experiments show that direct binding of FGF13VY and FGF14B, as suggested by in vitro experiments, is required to reduce (for FGF13VY) or increase (for FGF14B) VGSC current density in neurons.
Fig. 6.
FGF13VY and FGF14B directly bind VGSCs to regulate their surface expression. (A) Crystal structure of the NaV1.2 CTD (blue) bound to FGF13 (red). The critical Arg in FGF13 (equivalent to R120 in FGF13VY and R117 in FGF14) is indicated in yellow, seen in the enlarged image as embedded in a NaV1.2 pocket. (B) ITC with the recombinant CTD of NaV1.5 (NaV1.5 was used because it is highly similar to NaV1.2 and NaV1.6 and allows for direct comparison with our previous studies) and FGF13 shows robust binding for the WT FGF13 (Left, Kd = 123 ± 2 nM), but almost complete elimination of binding for the R→A mutant (Right, Kd cannot be determined). (C) Copurification experiments with recombinant NaV1.6 CTD and WT FGF14 or an R→A mutant (RA). Both FGF14 constructs express as seen in the supernatant (S), but only the WT copurifies with a His-tagged VGSC CTD upon metal affinity purification (P). Thus, the single-point mutation is sufficient to abrogate binding. (D) Increase in current density caused by 13KD could not be restored to control levels by shRNA-resistant FGF13VY R120A (FGF13VYRA rescue, n = 9) showing that FGF13VY requires an interaction with VGSCs to regulate their surface expression (maximum current density: FGF13VY rescue = −74.99 ± 9.56 pA/pF, FGF13VYR/A rescue = −260.79 ± 15.12 pA/pF; P = 6.4E-9). These experiments were conducted in conjunction with the experiments from Fig. 5, so the Scr shRNA and 13KD shRNA current–voltage relationships from Fig. 5 are repeated for comparison. The deficit in current density caused by 14KD could not be rescued by shRNA-resistant FGF14 R117A (FGF14BRA rescue, n = 14), indicating that FGF14 requires direct binding to VGSCs (maximum current density: FGF14B rescue = −88.12 ± 7.24 pA/pF, FGF14BRA rescue = −51.76 ± 4.90 pA/pF; P = 0.026). These experiments were conducted in conjunction with the experiments from Fig. 4, so the 14KD shRNA current–voltage relationship from Fig. 4 is repeated for comparison.
Discussion
Work with chimeric constructs of CD4 and various NaV1.2 intracellular domains in cultured hippocampal neurons led to a hypothesis that clustering of VGSCs in the AIS is accomplished by VGSCs initially inserting into both axonal and somatodendritic domains, followed by preferential endocytosis from the somatodendritic membrane (8, 9). Our experiments implicate the VGSC-binding protein FGF13 as a novel regulator of the process by which VGSCs are selectively endocytosed from the somatodendritic compartment, thereby fostering the effective concentration of VGSCs within the AIS. These data fit also with our observation that a significant fraction of FGF13 localizes to the somatodendritic compartment. Additionally, the inability of the FGF13VYRA to rescue the increased current phenotype (Fig. 6) supports a mechanism in which FGF13VY interacts directly with VGSCs to affect VGSC internalization. In neurons in which FGF13 is not expressed [e.g., cerebellar granule neurons (41)], a different FHF (e.g., FGF12) may serve a homologous role.
Moreover, our data provide previously unidentified details about the molecular mechanisms by which VGSCs are subsequently concentrated at the AIS in hippocampal neurons. Previous studies have defined specific intracellular domains within VGSCs that bind directly with the cytoskeletal adaptor molecule ankyrin-G and promote the concentration of VGSCs in the AIS (7, 10, 11). The localization of ankyrin-G is not significantly changed by either knockdown treatment (Fig. 3 F, I, and K), suggesting that effects of FHFs are likely affecting VGSC targeting to the AIS. Among the AIS targeting domains in VGSCs, the II-III linker appears to have an especially prominent role (10, 11), yet it alone cannot explain how VGSCs are targeted within the AIS. The critical region of the II-III linker is conserved among VGSC isoforms (13) even though different VGSCs have distinct subcellular distributions (6), thus hinting at additional regulatory mechanisms. Together with our data, these observations suggest that FGF13 and FGF14 may be components of such additional mechanisms. One intriguing hypothesis is that the VGSC cytoplasmic CTD, identified as a key determinant within VGSCs that promotes VGSC targeting to the axon (9, 42), acts through its binding to FGF14. Perhaps the FGF14 interaction with the CTD stabilizes the interaction between the VGSC II-III intracellular linker and ankyrin-G. Another possibility is that direct binding between FGF14 and VGSCs is required because FGF14 accompanies VGSCs throughout some portion of their trafficking to the plasma membrane. Because FGF14 knockdown decreases surface VGSCs without affecting total levels of VGSCs, the resulting changes in functional VGSCs are not due to a perturbation of VGSC gene expression or protein translation. One possibility is that after FGF14 knockdown, VGSCs are trapped in the endosomal system. Indeed, FGF14 knockdown decreased VGSC current density as well as exerting specific effects within the axon (Figs. 3 and 4). In our relatively young hippocampal cultures, we did not detect significant axonal NaV1.6 using immunocytochemistry, which is in agreement with others (7). Thus, the localization deficit in Fig. 3 is likely reflective of NaV1.2.
Together, our data provide a mechanism by which FGF13 and FGF14 operate differently yet cooperatively to promote the high concentration of VGSCs within the AIS of hippocampal neurons. Their different subcellular distributions (broadly distributed for FGF13, axonally restricted for FGF14) provide some basis for their disparate effects on VGSC functions. However, even in the restricted locale of the AIS, in which both FHFs are present in overlapping but distinct distributions, our data point to inherent differences in their modulatory effects on axonal VGSCs. FGF13 has very limited influence on AIS-localized VGSCs, which are almost exclusively modulated by FGF14. It seems unlikely that the absence of a clear FGF13-dependent effect upon VGSCs within the AIS will be explained by a higher affinity of VGSC CTDs for FGF14 than FGF13. Although others (35) and we (36) have previously demonstrated pairwise differences in affinities between specific VGSC CTDs and distinct FHFs, the measured affinity between FGF13 and any specific VGSC CTD is at least as high, if not higher, than between FGF14 and any specific VGSC CTD.
Because the underlying reasons for the distinct effects of FGF13 and FGF14 within the AIS are unlikely to be explained by differences within their conserved VGSC binding sites, the regions that differ markedly between FGF13 and FGF14, or between FGF13 isoforms, will be likely targets for future studies examining the precise bases for this specificity. The FHFs contain a modular architecture in which the core domain is critical to docking on a VGSC, and thus highly conserved throughout the family, whereas the divergent regions may dictate the particular effects that a specific FHF will then exert on its target.
Although our experiments suggest that the AIS-localized FGF13 does not regulate VGSCs, they do not yet provide insight into alternative FGF13-dependent functions within the AIS. Perhaps FGF13 in the AIS serves to regulate other ion channels, consistent with the relatively low colocalization between FGF13 and FGF14 (Fig. 2) and our observations that FGF13 can affect other ion channels, such as voltage-gated Ca2+ channels in cardiac myocytes (34). Another possibility is that the FGF13 within the AIS is in transition to developing nodes of Ranvier, because FGF13 has been found concentrated in nodes of Ranvier in dorsal root ganglion neurons (43). Nevertheless, the different roles for FGF13 and FGF14 in hippocampal neurons are consistent with the importance of cellular context in determining the actions of any specific FHF (44), a phenomenon that is also highlighted by the opposing effects of FGF13 in hippocampal neurons compared with the heart. Although FGF13 knockdown led to an increase in surface VGSCs and in VGSC current density in these hippocampal neuron experiments, we previously observed that FGF13 knockdown in cardiac myocytes leads to a reduction in surface VGSCs and in VGSC current density (33, 45).
Finally, our data add to an increased understanding of the multiple neuronal roles of FHFs and provide insight into the molecular mechanisms for how mutations in FGF13 or FGF14 contribute to various complex neurological disorders, such as SCA27, SCAX5, and Borjeson–Forssman–Lehmann syndrome.
Materials and Methods
Primary Hippocampal Culture and Transfection.
Primary dissociated hippocampal cultures were prepared as described (46), with minor modifications. Briefly, the hippocampus from P2 male or female Sprague–Dawley rat pups was dissected on ice, digested with 0.25% trypsin for 20 min at 37 °C with DMEM (Sigma), and dissociated into single cells by gentle trituration. The cells were seeded at a density of 2.5–3.0 × 10⁵ cells per coverslip (12 × 12-mm coverslips) in Neurobasal-A (Sigma) supplemented with 10% (vol/vol) heat-inactivated FBS onto coverslips previously coated with 50 μg/mL poly-d-lysine (Sigma) overnight at 4 °C and 25 μg/mL laminin (Sigma) for 2 h at 37 °C. The cells were maintained in a humidified incubator in 5% CO2 at 37 °C. After 24 h, the medium was replaced with Neurobasal-A supplemented with 2% B27 (Invitrogen), 1% FBS, 25 μM Urd, and 70 μM 5-fluorodeoxyuridine. After 5 d of in vitro (DIV) culture, the neurons were transiently transfected with 0.2 μg of plasmid DNA per coverslip using Lipofectamine-2000 (Invitrogen) according to the manufacturer’s instructions. Experiments were carried out 4–7 d after transfection. The shRNA constructs used for either transfections or infections have been extensively validated and previously reported (33, 34, 40, 47).
Immunohistochemistry.
This study was performed in strict accordance with the recommendations in the Guide for the Care and Use of Laboratory Animals of the National Institutes of Health. All of the animals were handled according to approved Institutional Animal Care and Use Committee (IACUC) of Duke University (protocol #A292-13-11). WT mice were anesthetized and transcardially perfused with 4% paraformaldehyde in 0.1 M PBS. Brains were postfixed in 4% paraformaldehyde/PBS overnight and then equilibrated in 30% sucrose/PBS overnight before obtaining 40-μm sections on a cryostat. Sections were incubated with primary Abs overnight at 4 °C and with fluorescent-conjugated secondary Abs for 1 h at room temperature. Nuclei were labeled with Hoechst dye (Sigma) to facilitate anatomical localization of structures. The images shown here were taken from the dentate gyrus. Sections were mounted on coverslips, and fluorescent images were captured on a fluorescence microscope. We used a validated commercially available FGF14 Ab (32) from NeuroMab (1:500) and a custom-made Ab to FGF13 (1:250) that we previously characterized extensively (33, 34).
Immunocytochemistry and Quantification.
Cultured hippocampal cells were fixed for 20 min with 2% paraformaldehyde, washed three times with PBS, and then incubated for 30 min in a solution of 5% fish skin gelatin and 0.1% Triton in PBS. Cells were incubated at room temperature for 2 h in the primary Ab solution and for 45 min with the secondary Ab solution. Each incubation was followed by three washes in PBS for 10 min each. Abs were diluted in 5% fish skin gelatin and 0.1% Triton in PBS. Abs used were NeuroMab monoclonal anti-FGF14 (1:500), Sigma monoclonal anti-Pan NaV (1:100), polyclonal goat anti–ankyrin-G (1:1,000), and rabbit polyclonal anti-FGF13 (1:250). Imaging was performed with a Zeiss LSM 510 or 780 confocal microscope using an oil immersion 40× or 63× objective. All images were collected at a 1,024 × 1,024-pixel resolution. For quantification using NIH ImageJ software, line scans down the axon defined the region of interest and the pixel intensity was extracted. Sliding averages of the pixel values within a 5-μm window were then normalized to the maximum value and plotted vs. distance from the soma. AISs were identified as ankyrin-G–positive processes with clear axon-like morphology. SIM imaging was conducted on a DeltaVision OMX microscope (GE Health Sciences). All samples were prepared as for confocal microscopy (described above) with coverslip-grown neurons mounted on glass slides. Specific oil refractive indices used during the acquisition were optimized using test samples. Z-stack images were taken with a 60× objective in three channels (FGF13, FGF14, and ankyrin-G) with three interference patterns per channel to extract nondiffraction limited spatial information. Calibration with fluorescent beads showed a resolution of up to 100 μm. All reconstruction was performed at the DeltaVision OMX workstation using automated GE proprietary software. We quantified colocalization as the percent volume [images were reconstructed in 3D space using Imaris software (Bitplane)] overlap between all pairwise combinations of immunoreactive signals from FGF13, FGF14, or ankyrin-G. In all image analysis, the experimenter was blinded to the identity of the confocal channels. Quantification was performed with a range of Ab dilutions for both FGF13 and FGF14, with nearly identical results.
Biotinylation and Western Blotting.
Cultured hippocampal neurons in 60-mm dishes were infected with lentivirus containing shRNA constructs at 5 DIV. After 5 d, cells were washed twice with cold PBS and incubated with 1 mg/mL EZ-Link Sulfo NHS-SS Biotinylation (Pierce) in cold PBS for 30 min. The reactions were quenched with 10 mM Gly in PBS for 5 min, and cells were then lysed. Biotinylated proteins were incubated with NeutrAvidin beads (Pierce) overnight and then washed three times with lysis buffer (150 mM NaCl, 50 mM Tris, 1% sodium deoxycholate, and 1% Triton) followed by elution in 2× LDS Sample Buffer (Life Technologies) plus 10 mM DTT. The biotinylated proteins and whole-cell lysate were run on 8–16% Tris⋅Gly SDS/PAGE and transferred to PVDF membranes. Primary Abs used were rabbit polyclonal Pan NaV (1:200), mouse monoclonal anti-TfR (1:1,000; Life Technologies), mouse monoclonal anti–β-actin (1:5,000; Sigma), and rabbit polyclonal anti-FGF13 (1:200). Blotting for β-actin demonstrated if successful separation between surface and total protein was achieved. TfR was used as a surface loading control. For Dynasore experiments, infected hippocampal neurons were treated for 2 h with either DMSO or 100 μM dynasore before biotinylation.
Electrophysiological Recordings.
Whole-cell voltage-clamp recordings were obtained from cultured hippocampal cells using an Axopatch 200B amplifier (Axon Instruments, Inc.), with a 5-kHz bandwidth filter. Data were acquired using a DigiData 1322A (Axon Instruments, Inc.) digitizer and analyzed with pClamp software, version 10. Patch pipettes with 3–5 MΩ resistances were filled with internal solution containing 100 mM CsCl, 30 mM CsF, 10 mM NaCl, 0.5 mM CaCl2, 1 mM MgCl2, 10 mM Hepes, 10 mM EGTA, 4 mM Mg-ATP, and 0.4 mM Na-GTP (pH 7.3), with CsOH (290–300 mOsm). The bath solution contained115 mM NaCl, 30 mM tetraethylammonium-Cl, 5 mM 4-aminopyrine, 5 mM Hepes, 10 mM glucose, 0.5 mM CdCl2, and 1 mM BaCl2 (pH 7.3), with NaOH (300–310 mOsm). A brief 5-mV depolarizing step was used to monitor series resistance, capacitance, and leak current throughout the experiment. Cells were rejected from analysis if the series resistance changed by >15%.
Sodium currents were obtained by 40-ms step depolarizations from a holding potential of −90 to +40 mV. The current amplitude was normalized to each cell’s capacitance to obtain a measure of current density (picoamperes per picofarads). Current density-to-voltage relationships were plotted (I–V relationship). The prepulse protocol to separate axonal and somatic currents was performed as described previously (39). A prepulse from the holding potential of −90 mV to −45 mV for 4 ms was followed by a brief recovery phase at −55 mV for 0.5 ms. The prepulse serves to inactivate axonal channels selectively, thus turning the axon from an active component capable of generating uncontrolled spikes into a passive structure. The same voltage step depolarization protocol (−90 to +40 mV) was then applied. Channels that were under good voltage control, and thus protected from inactivation, will remain available for activation. The resulting currents were then subtracted from currents obtained without the prepulse to isolate the axial component. Subtraction was done with pClamp software by taking the onset of the step protocol from −90 to +40 mV as the origin of the currents either with or without the prepulse. If the currents after the prepulse were less than 80% of currents obtained without the prepulse, this situation was taken as an indication of insufficient separation between somatic and axonal VGSCs, and the cell was excluded from analysis. For dynasore experiments, transfected hippocampal neurons were treated for 2 h with either DMSO or 100 μM dynasore before recording. A lower 25 μM concentration of dynasore was kept in the perfusion lines to avoid the possibility of activity-dependent endocytosis.
Molecular Biology.
FGF13 and FGF14 constructs used for rescue experiments were cloned into pCDNA3.1 in which a p2A-TdTomato cassette had previously been cloned to facilitate the identification of transfected neurons. The shRNA sequences for both molecules were cloned into the pLVTHM plasmid (a gift from Didier Trono, École Polytechnique Fédérale de Lausanne, Switzerland, via Addgene) and have been described previously (33, 47). For FGF13, the primers used were 5′ CCACGCGTGCACTTACACTCTGTTTAATTCAAGAGATTAAACAGAGTGTAAGTGCTTTTTTATCGATGG 3′ and 5′ CCATCGATAAAAAAGCACTTACACTCTGTTTAATCTCTTGAATTAAACAGAGTGTAAGTGCACGCGTGG 3′.
For FGF14, the primers used were 5′ CGCGTGGAGGCAAACCAGTCAACAAGTGCATTCAAGAGATGCACTTGTTGACTGGTTTGCCTCCTTTTTTAT 3′ and 5′ CGATAAAAAAGGAGGCAAACCAGTCAACAAGTGCATCTCTTGAATGCACTTGTTGACTGGTTTGCCTCCA 3′.
For ankyrin-G knockdown, we adapted a well-established shRNA sequence (37, 38) for cloning into the pLVTHM plasmid. The primers we used were 5′ CGCGTGCCGTCAGTACCATCTTCTTTCAAGAGAAGAAGATGGTACTGACGGCTTTTTTAT 3′ and 5′ CGATAAAAAAGCCGTCAGTACCATCTTCTTCTCTTGAAAGAAGATGGTACTGACGGCA 3′.
Mutations to confer shRNA resistance were introduced using the QuikChange II XL Site-Directed Mutagenesis Kit (Agilent Technologies) according to the manufacturer’s instructions. The shRNA resistance mutagenesis primers used for FGF13 were 5′ CACCAAAGATGAGGACAGTACCTATACCCTATTCAAT CTCATCCCTGTGGGTCTG 3′ and 5′ CAGACCCACAGGGATGAGATTGAATAGGGTATAGGTACTGTCCTCATCTTTGGTG 3′. The shRNA resistance mutagenesis primers used for FGF14 were 5′ GCAATAATGAATGGAGGCAAACCAGTCAATAAATGTAAGACCACA 3′ and 5′ TGTGGTCTTACATTTATTGACTGGTTTGCCTCCATTCATTATTGC 3′.
GFP fusion constructs of the FHFs were generated by cloning the appropriate isoform into pEGFP-N3. RNA isolation, cDNA synthesis, and quantitative real-time RT-PCR (qPCR) were performed as described previously (33). Total RNA was isolated from cultured rat hippocampal neurons. Cells were scraped off dishes and lysed using the RNeasy Plus Mini Kit (Qiagen) following the manufacturer’s instructions. The concentration of total RNA for each sample was determined by a Nanodrop ND-1000 Spectrophotometer (Thermo Scientific). RT was performed using the iScript cDNA Synthesis Kit (Bio-Rad) for synthesis of cDNA according to the manufacturer’s instructions. qPCR was performed using the iCycler iQ Real-Time PCR Detection System (Bio-Rad). Each sample was run in triplicate. Three controls aimed at detecting DNA contamination in the RNA samples or during the RT or qPCR reactions, as well as the specificity of the primer pairs, were always included: an RT mixture without reverse transcriptase, an RT mixture including the enzyme reverse transcriptase but no RNA, and a water-only control (reaction mixture with water instead of the cDNA template). The data were collected and analyzed using iCycler Software (Bio-Rad). GAPDH was used as an internal control. Relative quantification was performed using the comparative threshold (CT) method, and FHF isoform abundance is reported relative to GAPDH CT values. The primer pairs used were FGF13-S: 5′, CGAGAAATCCAATGCCTGC and 3′, CACCACCCGAAGACCCACAG; FGF13-U: 5′, GTTAAGGAAGTCATATTCAGAGC and 3′, CACCACCCGAAGACCCACAG; FGF13-V: 5′, GCTTCTAAGGAGCCTCAGC and 3′, CACCACCCGAAGACCCACAG; FGF13-VY: 5′, GCTTCTAAGGTTCTGGATGAC and 3′, CACCACCCGAAGACCCACAG; FGF13-VY/Y: 5′, CACAGAACCCGAAGAGCCTCAG and 3′, CACCACCCGAAGACCCACAG; FGF14-A: 5′, GAGCAGCCCCAGCAAGAAC and 3′, GTGGAATTGGTGCTGTCATC; FGF14-B: 5′, CCCAAATCAATGTGGTTTC and 3′, GTGGAATTGGTGCTGTCATC; and GAPDH: 5′, TGTCAGCAATGCATCCTGCA and 3′, CCGTTCAGCTCTGGGATGAC.
Recombinant Protein Expression and Copurification.
Human NaV1.6 CTD (amino acids 1,766–1,926) was cloned into pET28 (Novagen). Mouse FGF14B ΔNT (amino acids 70–252) or FHF14B ΔNT R117A was cloned into the MCS2 in pETDuet-1 (Novagen). The plasmids were electroporated into BL-21 (DE3) cells. Protein expression was induced by 1 mM isopropyl-1-thio-β-d-galactopyranoside (IPTG) for 64 h at 16 °C. The protein was purified by metal affinity chromatography as previously described (48), with slight changes. Briefly, cells were harvested, and protein was extracted by means of an Avestin homogenizer (Emulsiflex-C5) in buffer with 300 mM NaCl, 20 mM Tris⋅HCl, and 5 mM imidazole (pH 7.5) with EDTA-free protease inhibitor mixture (Roche). The lysate was spun down at 38,000 × g for 30 min at 4 °C, and the resultant supernatant was passed through a preequilibrated cobalt affinity column, which was then washed extensively. The proteins were eluted by 300 mM imidazole in the above lysis buffer and visualized via SDS/PAGE.
ITC.
ITC was used to quantify binding affinity between purified recombinant proteins by measuring the change in heat upon binding. Human NaV1.5 CTD (amino acids 1,773–1,940), human FGF13U, and FGF13UR57A were cloned into pET28 separately. The proteins were expressed in BL21 E. coli by 1 mM IPTG induction. The affinity purification was performed with cobalt beads as described above, followed by size exclusion chromatography with a Superdex 75 10/300 (GE Healthcare Life Sciences). The ITC experiments were performed with the VP-ITC (MicroCal) at 20 °C. NaV1.5 CTD (30–40 μM) was titrated with injections of FGF13U or FGF13UR57A mutant (300–413 μM) 28 times. ITC experiments were repeated with different preparations and slightly varying concentrations at least three times. The binding isotherms were analyzed with a single-site binding model using the Microcal Origin version 7.0 software package (Originlab Corporation), yielding binding enthalpy (ΔH), stoichiometry (n), entropy (ΔS), and the association constant (Ka).
Statistical Analyses.
Results are presented as means ± SEM; statistical significance of differences between more than two groups (e.g., Scr, 13KD, 14KD) was assessed using one-way ANOVA, followed by Fisher’s least significant difference as a post hoc test (pairwise comparisons between groups analyzed by ANOVA). Comparisons between two groups were assessed using the Student’s t test. The cutoff for statistical significance was set at P < 0.05.
Acknowledgments
We thank the GE Healthcare staff, especially Dr. P. Pellett, for their help in acquisition of the SIM images; the Duke University core facility, especially Dr. S. Johnson, for their help with image analysis; and Vann Bennett (Duke University) for helpful discussions and the ankyrin-G Ab. We also thank Jörg Grandl (Duke University) and Eric Wei (Duke University) for insightful comments on the manuscript. James Wu (Duke University) helped with the FGF13VY-GFP cloning. This work was supported by NIH Grants R01 HL112918 and HL122967 (to G.S.P.).
Footnotes
The authors declare no conflict of interest.
This article is a PNAS Direct Submission.
See Commentary on page 5147.
This article contains supporting information online at www.pnas.org/lookup/suppl/doi:10.1073/pnas.1521194113/-/DCSupplemental.
References
- 1.Catterall WA, Goldin AL, Waxman SG. International Union of Pharmacology. XLVII. Nomenclature and structure-function relationships of voltage-gated sodium channels. Pharmacol Rev. 2005;57(4):397–409. doi: 10.1124/pr.57.4.4. [DOI] [PubMed] [Google Scholar]
- 2.Baranauskas G, David Y, Fleidervish IA. Spatial mismatch between the Na+ flux and spike initiation in axon initial segment. Proc Natl Acad Sci USA. 2013;110(10):4051–4056. doi: 10.1073/pnas.1215125110. [DOI] [PMC free article] [PubMed] [Google Scholar]
- 3.Jenkins PM, et al. Giant ankyrin-G: A critical innovation in vertebrate evolution of fast and integrated neuronal signaling. Proc Natl Acad Sci USA. 2015;112(4):957–964. doi: 10.1073/pnas.1416544112. [DOI] [PMC free article] [PubMed] [Google Scholar]
- 4.Zhou D, et al. AnkyrinG is required for clustering of voltage-gated Na channels at axon initial segments and for normal action potential firing. J Cell Biol. 1998;143(5):1295–1304. doi: 10.1083/jcb.143.5.1295. [DOI] [PMC free article] [PubMed] [Google Scholar]
- 5.Lorincz A, Nusser Z. Molecular identity of dendritic voltage-gated sodium channels. Science. 2010;328(5980):906–909. doi: 10.1126/science.1187958. [DOI] [PMC free article] [PubMed] [Google Scholar]
- 6.Hu W, et al. Distinct contributions of Na(v)1.6 and Na(v)1.2 in action potential initiation and backpropagation. Nat Neurosci. 2009;12(8):996–1002. doi: 10.1038/nn.2359. [DOI] [PubMed] [Google Scholar]
- 7.Akin EJ, Solé L, Dib-Hajj SD, Waxman SG, Tamkun MM. Preferential targeting of Nav1.6 voltage-gated Na+ Channels to the axon initial segment during development. PLoS One. 2015;10(4):e0124397. doi: 10.1371/journal.pone.0124397. [DOI] [PMC free article] [PubMed] [Google Scholar]
- 8.Fache MP, et al. Endocytotic elimination and domain-selective tethering constitute a potential mechanism of protein segregation at the axonal initial segment. J Cell Biol. 2004;166(4):571–578. doi: 10.1083/jcb.200312155. [DOI] [PMC free article] [PubMed] [Google Scholar]
- 9.Garrido JJ, et al. Identification of an axonal determinant in the C-terminus of the sodium channel Na(v)1.2. EMBO J. 2001;20(21):5950–5961. doi: 10.1093/emboj/20.21.5950. [DOI] [PMC free article] [PubMed] [Google Scholar]
- 10.Garrido JJ, et al. A targeting motif involved in sodium channel clustering at the axonal initial segment. Science. 2003;300(5628):2091–2094. doi: 10.1126/science.1085167. [DOI] [PubMed] [Google Scholar]
- 11.Gasser A, et al. An ankyrinG-binding motif is necessary and sufficient for targeting Nav1.6 sodium channels to axon initial segments and nodes of Ranvier. J Neurosci. 2012;32(21):7232–7243. doi: 10.1523/JNEUROSCI.5434-11.2012. [DOI] [PMC free article] [PubMed] [Google Scholar]
- 12.Garrido JJ, et al. Dynamic compartmentalization of the voltage-gated sodium channels in axons. Biol Cell. 2003;95(7):437–445. doi: 10.1016/s0248-4900(03)00091-1. [DOI] [PubMed] [Google Scholar]
- 13.Lemaillet G, Walker B, Lambert S. Identification of a conserved ankyrin-binding motif in the family of sodium channel alpha subunits. J Biol Chem. 2003;278(30):27333–27339. doi: 10.1074/jbc.M303327200. [DOI] [PubMed] [Google Scholar]
- 14.Goldfarb M. Voltage-gated sodium channel-associated proteins and alternative mechanisms of inactivation and block. Cell Mol Life Sci. 2012;69(7):1067–1076. doi: 10.1007/s00018-011-0832-1. [DOI] [PMC free article] [PubMed] [Google Scholar]
- 15.Smallwood PM, et al. Fibroblast growth factor (FGF) homologous factors: New members of the FGF family implicated in nervous system development. Proc Natl Acad Sci USA. 1996;93(18):9850–9857. doi: 10.1073/pnas.93.18.9850. [DOI] [PMC free article] [PubMed] [Google Scholar]
- 16.Olsen SK, et al. Fibroblast growth factor (FGF) homologous factors share structural but not functional homology with FGFs. J Biol Chem. 2003;278(36):34226–34236. doi: 10.1074/jbc.M303183200. [DOI] [PubMed] [Google Scholar]
- 17.Lou JY, et al. Fibroblast growth factor 14 is an intracellular modulator of voltage-gated sodium channels. J Physiol. 2005;569(Pt 1):179–193. doi: 10.1113/jphysiol.2005.097220. [DOI] [PMC free article] [PubMed] [Google Scholar]
- 18.Munoz-Sanjuan I, Smallwood PM, Nathans J. Isoform diversity among fibroblast growth factor homologous factors is generated by alternative promoter usage and differential splicing. J Biol Chem. 2000;275(4):2589–2597. doi: 10.1074/jbc.275.4.2589. [DOI] [PubMed] [Google Scholar]
- 19.Wang C, Chung BC, Yan H, Lee SY, Pitt GS. Crystal structure of the ternary complex of a NaV C-terminal domain, a fibroblast growth factor homologous factor, and calmodulin. Structure. 2012;20(7):1167–1176. doi: 10.1016/j.str.2012.05.001. [DOI] [PMC free article] [PubMed] [Google Scholar]
- 20.Liu Cj, Dib-Hajj SD, Waxman SG. Fibroblast growth factor homologous factor 1B binds to the C terminus of the tetrodotoxin-resistant sodium channel rNav1.9a (NaN) J Biol Chem. 2001;276(22):18925–18933. doi: 10.1074/jbc.M101606200. [DOI] [PubMed] [Google Scholar]
- 21.Laezza F, et al. FGF14 N-terminal splice variants differentially modulate Nav1.2 and Nav1.6-encoded sodium channels. Mol Cell Neurosci. 2009;42(2):90–101. doi: 10.1016/j.mcn.2009.05.007. [DOI] [PMC free article] [PubMed] [Google Scholar]
- 22.Rush AM, et al. Differential modulation of sodium channel Na(v)1.6 by two members of the fibroblast growth factor homologous factor 2 subfamily. Eur J Neurosci. 2006;23(10):2551–2562. doi: 10.1111/j.1460-9568.2006.04789.x. [DOI] [PubMed] [Google Scholar]
- 23.Goldfarb M, et al. Fibroblast growth factor homologous factors control neuronal excitability through modulation of voltage-gated sodium channels. Neuron. 2007;55(3):449–463. doi: 10.1016/j.neuron.2007.07.006. [DOI] [PMC free article] [PubMed] [Google Scholar]
- 24.Wang Q, et al. Ataxia and paroxysmal dyskinesia in mice lacking axonally transported FGF14. Neuron. 2002;35(1):25–38. doi: 10.1016/s0896-6273(02)00744-4. [DOI] [PubMed] [Google Scholar]
- 25.van Swieten JC, et al. A mutation in the fibroblast growth factor 14 gene is associated with autosomal dominant cerebellar ataxia [corrected] Am J Hum Genet. 2003;72(1):191–199. doi: 10.1086/345488. [DOI] [PMC free article] [PubMed] [Google Scholar]
- 26.Wozniak DF, Xiao M, Xu L, Yamada KA, Ornitz DM. Impaired spatial learning and defective theta burst induced LTP in mice lacking fibroblast growth factor 14. Neurobiol Dis. 2007;26(1):14–26. doi: 10.1016/j.nbd.2006.11.014. [DOI] [PMC free article] [PubMed] [Google Scholar]
- 27.Xiao M, et al. Impaired hippocampal synaptic transmission and plasticity in mice lacking fibroblast growth factor 14. Mol Cell Neurosci. 2007;34(3):366–377. doi: 10.1016/j.mcn.2006.11.020. [DOI] [PubMed] [Google Scholar]
- 28.Gecz J, et al. Fibroblast growth factor homologous factor 2 (FHF2): Gene structure, expression and mapping to the Börjeson-Forssman-Lehmann syndrome region in Xq26 delineated by a duplication breakpoint in a BFLS-like patient. Hum Genet. 1999;104(1):56–63. doi: 10.1007/s004390050910. [DOI] [PubMed] [Google Scholar]
- 29.Zanni G, et al. X-linked congenital ataxia: A new locus maps to Xq25-q27.1. Am J Med Genet A. 2008;146A(5):593–600. doi: 10.1002/ajmg.a.32186. [DOI] [PubMed] [Google Scholar]
- 30.Puranam RS, et al. Disruption of Fgf13 causes synaptic excitatory-inhibitory imbalance and genetic epilepsy and febrile seizures plus. J Neurosci. 2015;35(23):8866–8881. doi: 10.1523/JNEUROSCI.3470-14.2015. [DOI] [PMC free article] [PubMed] [Google Scholar]
- 31.Kaphzan H, Buffington SA, Jung JI, Rasband MN, Klann E. Alterations in intrinsic membrane properties and the axon initial segment in a mouse model of Angelman syndrome. J Neurosci. 2011;31(48):17637–17648. doi: 10.1523/JNEUROSCI.4162-11.2011. [DOI] [PMC free article] [PubMed] [Google Scholar]
- 32.Laezza F, et al. The FGF14(F145S) mutation disrupts the interaction of FGF14 with voltage-gated Na+ channels and impairs neuronal excitability. J Neurosci. 2007;27(44):12033–12044. doi: 10.1523/JNEUROSCI.2282-07.2007. [DOI] [PMC free article] [PubMed] [Google Scholar]
- 33.Wang C, et al. Fibroblast growth factor homologous factor 13 regulates Na+ channels and conduction velocity in murine hearts. Circ Res. 2011;109(7):775–782. doi: 10.1161/CIRCRESAHA.111.247957. [DOI] [PMC free article] [PubMed] [Google Scholar]
- 34.Hennessey JA, Wei EQ, Pitt GS. Fibroblast growth factor homologous factors modulate cardiac calcium channels. Circ Res. 2013;113(4):381–388. doi: 10.1161/CIRCRESAHA.113.301215. [DOI] [PMC free article] [PubMed] [Google Scholar]
- 35.Goetz R, et al. Crystal structure of a fibroblast growth factor homologous factor (FHF) defines a conserved surface on FHFs for binding and modulation of voltage-gated sodium channels. J Biol Chem. 2009;284(26):17883–17896. doi: 10.1074/jbc.M109.001842. [DOI] [PMC free article] [PubMed] [Google Scholar]
- 36.Wang C, Wang C, Hoch EG, Pitt GS. Identification of novel interaction sites that determine specificity between fibroblast growth factor homologous factors and voltage-gated sodium channels. J Biol Chem. 2011;286(27):24253–24263. doi: 10.1074/jbc.M111.245803. [DOI] [PMC free article] [PubMed] [Google Scholar]
- 37.Hedstrom KL, Ogawa Y, Rasband MN. AnkyrinG is required for maintenance of the axon initial segment and neuronal polarity. J Cell Biol. 2008;183(4):635–640. doi: 10.1083/jcb.200806112. [DOI] [PMC free article] [PubMed] [Google Scholar]
- 38.Hedstrom KL, et al. Neurofascin assembles a specialized extracellular matrix at the axon initial segment. J Cell Biol. 2007;178(5):875–886. doi: 10.1083/jcb.200705119. [DOI] [PMC free article] [PubMed] [Google Scholar]
- 39.Milescu LS, Bean BP, Smith JC. Isolation of somatic Na+ currents by selective inactivation of axonal channels with a voltage prepulse. J Neurosci. 2010;30(22):7740–7748. doi: 10.1523/JNEUROSCI.6136-09.2010. [DOI] [PMC free article] [PubMed] [Google Scholar]
- 40.Yan H, Pablo JL, Wang C, Pitt GS. FGF14 modulates resurgent sodium current in mouse cerebellar Purkinje neurons. eLife. 2014;3:e04193. doi: 10.7554/eLife.04193. [DOI] [PMC free article] [PubMed] [Google Scholar]
- 41.Goldfarb M. Fibroblast growth factor homologous factors: Evolution, structure, and function. Cytokine Growth Factor Rev. 2005;16(2):215–220. doi: 10.1016/j.cytogfr.2005.02.002. [DOI] [PMC free article] [PubMed] [Google Scholar]
- 42.Lee A, Goldin AL. Role of the terminal domains in sodium channel localization. Channels (Austin) 2009;3(3):171–180. doi: 10.4161/chan.3.3.8854. [DOI] [PMC free article] [PubMed] [Google Scholar]
- 43.Wittmack EK, et al. Fibroblast growth factor homologous factor 2B: Association with Nav1.6 and selective colocalization at nodes of Ranvier of dorsal root axons. J Neurosci. 2004;24(30):6765–6775. doi: 10.1523/JNEUROSCI.1628-04.2004. [DOI] [PMC free article] [PubMed] [Google Scholar]
- 44.Pablo JL, Pitt GS. Fibroblast growth factor homologous factors: New roles in neuronal health and disease. Neuroscientist. 2014;22(1):19–25. doi: 10.1177/1073858414562217. [DOI] [PMC free article] [PubMed] [Google Scholar]
- 45.Hennessey JA, et al. FGF12 is a candidate Brugada syndrome locus. Heart Rhythm. 2013;10(12):1886–1894. doi: 10.1016/j.hrthm.2013.09.064. [DOI] [PMC free article] [PubMed] [Google Scholar]
- 46.Wang HG, George MS, Kim J, Wang C, Pitt GS. Ca2+/calmodulin regulates trafficking of Ca(V)1.2 Ca2+ channels in cultured hippocampal neurons. J Neurosci. 2007;27(34):9086–9093. doi: 10.1523/JNEUROSCI.1720-07.2007. [DOI] [PMC free article] [PubMed] [Google Scholar]
- 47.Yan H, Pablo JL, Pitt GS. FGF14 regulates presynaptic Ca2+ channels and synaptic transmission. Cell Reports. 2013;4(1):66–75. doi: 10.1016/j.celrep.2013.06.012. [DOI] [PMC free article] [PubMed] [Google Scholar]
- 48.Wang C, Wang HG, Xie H, Pitt GS. Ca2+/CaM controls Ca2+-dependent inactivation of NMDA receptors by dimerizing the NR1 C termini. J Neurosci. 2008;28(8):1865–1870. doi: 10.1523/JNEUROSCI.5417-07.2008. [DOI] [PMC free article] [PubMed] [Google Scholar]


