Significance
Erythropoietin is used to treat anemia but has prothrombotic side effects that limit its use. We have demonstrated in vivo the ability to target erythropoietin to red blood cell precursors and away from platelet precursors, thereby potentially avoiding off-target effects. We have systematically determined the protein design features required for in vivo success of the engineered protein. Our results reveal how rational engineering of protein drugs can be used to reduce side effects, with broad implications for designers of therapeutic signaling systems.
Keywords: protein engineering, drug targeting, platelet, scFv
Abstract
The design of cell-targeted protein therapeutics can be informed by natural protein–protein interactions that use cooperative physical contacts to achieve cell type specificity. Here we applied this approach in vivo to the anemia drug erythropoietin (EPO), to direct its activity to EPO receptors (EPO-Rs) on red blood cell (RBC) precursors and prevent interaction with EPO-Rs on nonerythroid cells, such as platelets. Our engineered EPO molecule was mutated to weaken its affinity for EPO-R, but its avidity for RBC precursors was rescued via tethering to an antibody fragment that specifically binds the human RBC marker glycophorin A (huGYPA). We systematically tested the impact of these engineering steps on in vivo markers of efficacy, side effects, and pharmacokinetics. huGYPA transgenic mice dosed with targeted EPO exhibited elevated RBC levels, with only minimal platelet effects. This in vivo selectivity depended on the weakening EPO mutation, fusion to the RBC-specific antibody, and expression of huGYPA. The terminal plasma half-life of targeted EPO was ∼28.3 h in transgenic mice vs. ∼15.5 h in nontransgenic mice, indicating that huGYPA on mature RBCs acted as a significant drug sink but did not inhibit efficacy. In a therapeutic context, our targeting approach may allow higher restorative doses of EPO without platelet-mediated side effects, and also may improve drug pharmacokinetics. These results demonstrate how rational drug design can improve in vivo specificity, with potential application to diverse protein therapeutics.
An ongoing challenge in therapeutic protein design is specificity of action. The receptor for a protein drug may exist on diverse cell types, resulting in undesired signaling. Numerous engineering strategies have been used to minimize side effects (1–7). One approach is to tether a protein drug to a cell-specific antibody or antibody fragment. This method can still produce unwanted signaling, however. Even when fused to an antibody, a ligand can still bind to its receptor on cells that cause side effects (8).
Natural signaling systems often use multicomponent receptor complexes to enable ligands to distinguish between the same receptor on two different cells. For example, ciliary neurotrophic factor (CNTF) first binds a nonsignaling receptor, CNTFRα, that is expressed solely by neurons, followed by a second binding event with the LIFRβ/gp130 signaling receptor complex (9). CNTF has poor affinity for LIFRβ/gp130 and will activate it only on cells that also express CNTFRα. CNTFRα serves to anchor CNTF on a subset of cells, placing it in a high local concentration near LIFRβ and gp130. Thus, CNTF and other cytokines reveal that cell specificity can be created through binding to a high-affinity, nonsignaling surface protein that positions the signaling molecule in physical proximity with low-affinity signaling receptors.
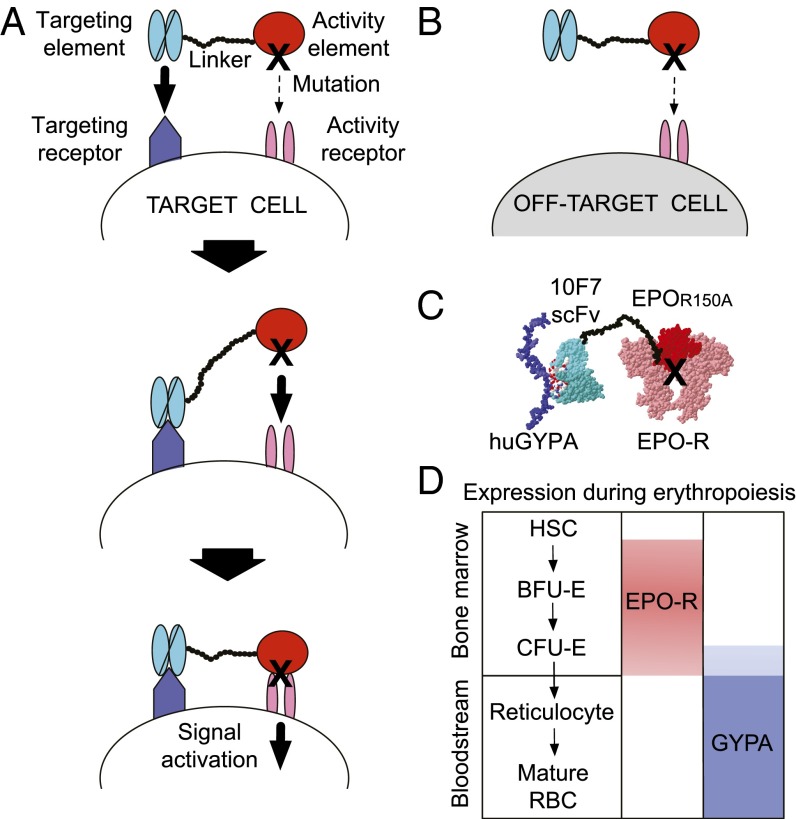
Earlier work defined a class of engineered proteins, termed “chimeric activators,” that can direct signaling to one cell type in vitro (Fig. 1) (10–12). These fusion proteins contain a “targeting element” (e.g., an antibody fragment) that binds a cell-specific surface marker (Fig. 1A, Top) and is tethered to a mutated “activity element” (e.g., a hormone or cytokine) by a flexible peptide linker that permits simultaneous binding of both elements to the same cell surface. The targeting element anchors the mutated activity element to the desired cell surface (Fig. 1A, Middle), thereby creating a high local concentration and driving receptor binding despite the mutation (Fig. 1A, Bottom). Off-target signaling should be minimal (Fig. 1B) and should decrease in proportion to the mutation strength.
Fig. 1.
Targeting EPO to RBC precursors with a chimeric activator. (A, Top) Chimeric activator schematic illustrating a targeting element (light blue) tethered by a linker (black circles) to a mutated activity element (red, black X = mutation). The chimeric activator initially binds (bold arrow) a target cell receptor (dark blue) via the targeting element, whereas the mutated activity element has a low affinity (dashed arrow) for its own receptor (pink). (A, Middle) Increased local concentration of the activity element overcomes its receptor-binding deficit and facilitates interaction (bold arrow). (A, Bottom) This interaction results in signaling via the activity receptor (bold arrow). (B) On off-target cells lacking a receptor for the targeting element, the activity element has little effect (dashed arrow), owing to its mutation. (C) Schematic molecular model of 10F7-EPOR150A showing the 10F7 scFv bound to huGYPA and EPO binding to EPO-R. (D) Predicted expression pattern of EPO-R (pink) and huGYPA (blue) on RBCs during erythropoiesis, illustrating a period of expression overlap in the bone marrow.
Here we tested the chimeric activator strategy in vivo using erythropoietin (EPO) as the drug to be targeted. EPO is a pleiotropic hormone that signals in diverse cell types (13). EPO promotes the differentiation of RBC precursors, and recombinant EPO is used to treat anemia due to chronic kidney disease and myelosuppressive cancer chemotherapy (13); however, EPO also signals on megakaryocytes, capillary endothelial cells, and tumor cells, which may promote the thrombosis and tumor progression that have been documented in clinical trials and have led to the inclusion of “black box” warnings on EPO-based products (13–16). The goal of the present work was to engineer a form of EPO that, by analogy to CNTF, depends on a nonsignaling surface marker restricted to RBC precursors and cannot activate cells that may cause EPO side effects.
Drug targeting schemes demonstrated in vitro often fail owing to the demands of in vivo function. Targeted surface receptors might not be restricted to desired tissues; in particular, no known surface proteins are expressed solely on RBC precursors. In vivo expression of targeted receptors may differ from that on immortalized cells used in in vitro experiments. Finally, undesired pharmacokinetics, distribution, and elimination can prevent targeted therapies from reaching desired tissues in adequate levels (17). We addressed these issues by systematically testing the design features of an EPO-based chimeric activator for their impact on therapeutic outcomes, side effects, and pharmacokinetics.
Results
Rationale for the Experimental Design.
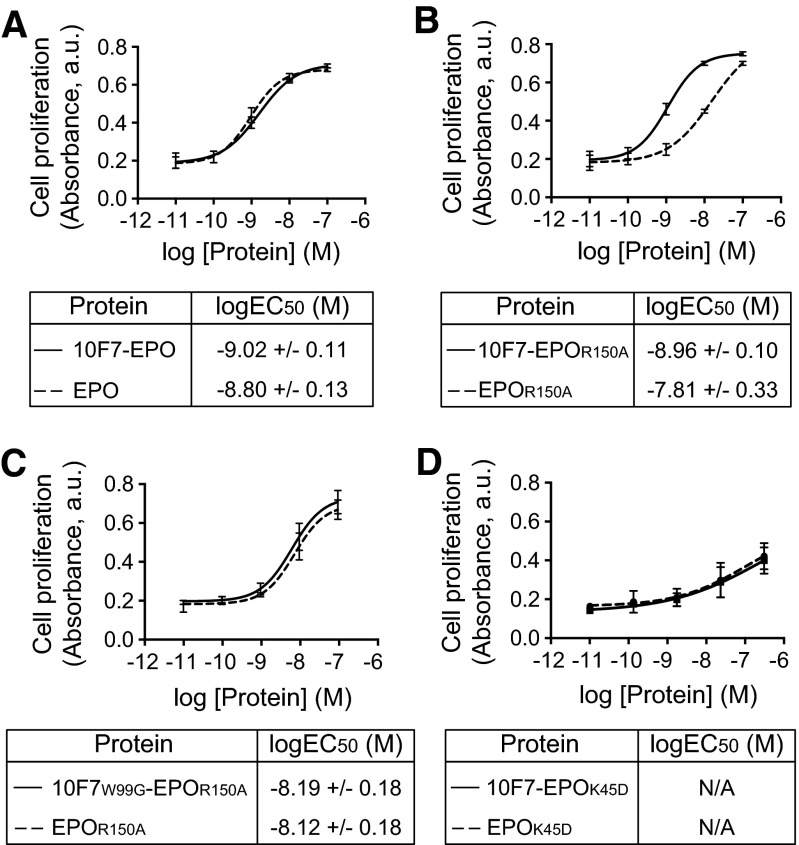
The design features of the chimeric activator 10F7-EPOR150A were chosen to direct human EPO activity to RBC precursors using a single-chain variable fragment (scFv) from the antibody 10F7 (18, 19) (Fig. 1C). Antibody 10F7 binds the common variants of human glycophorin A (huGYPA) (Fig. 1C), which is restricted to the RBC lineage and expressed at ∼800,000 copies on mature RBCs (20, 21). Several characteristics of huGYPA make it a desirable receptor to target: (i) it has a small extracellular domain (18), such that an scFv-EPO fusion protein likely can bind simultaneously to both huGYPA and EPO-R; (ii) sequences of the 10F7 V regions are available (GenBank AAK85 297.1); and (iii) loss of huGYPA is phenotypically silent (22), so binding to huGYPA is unlikely to cause side effects. 10F7 was tethered via a flexible 35-aa glycine/serine linker to a form of EPO mutated at position 150 from arginine to alanine (EPOR150A) (11, 23). This mutation changes a surface residue that makes a strong contact with EPO-R, reduces binding by ∼12-fold, and does not affect protein folding. The resulting 10F7-EPOR150A protein showed in vitro activity that was enhanced relative to EPOR150A alone by 10- to 27-fold on erythroleukemic cell lines expressing EPO-R and huGYPA (Fig. S1) (11).
Fig. S1.
In vitro verification of chimeric activator activity. Erythroleukemia TF-1 cells were treated with 10F7-EPO variants or unfused control proteins and allowed to proliferate for 72 h before the addition of WST-1 reagent. Proliferation was plotted against protein concentration. (A) 10F7-EPO vs. EPO. (B) 10F7-EPOR150A vs. EPOR150A. (C) 10F7W99G-EPOR150A vs. EPOR150A. (D) 10F7-EPOK45D vs. EPOK45D. Plots were fitted by nonlinear regression to determine logEC50 values. Graphs display mean ± SEM (n = 3). N/A, not applicable; it was not possible to calculate a logEC50 for proteins containing the K45D mutation because saturation was not achieved. Note that the shift in EC50 values comparing EPO with EPOR150A (∼10-fold) (Fig. S1 A vs. B) corresponds roughly to the decreased binding of EPO vs. EPOR150A to EPO-R (∼12-fold) (Fig. 2B).
We inferred that huGYPA and EPO-R are coexpressed on RBC precursors in vivo (Fig. 1D). Late RBC precursors (BFU-E descendants) express huGYPA approximately 5 d before maturing into erythrocytes (24), whereas EPO-R binding events on cultured late-stage precursor cells (CFU-E) can be detected as late as 24 h before the cells mature into reticulocytes or RBCs (25). These results suggest that EPO-R and huGYPA are coexpressed during late erythropoiesis, although this idea has not been previously addressed directly in vivo.
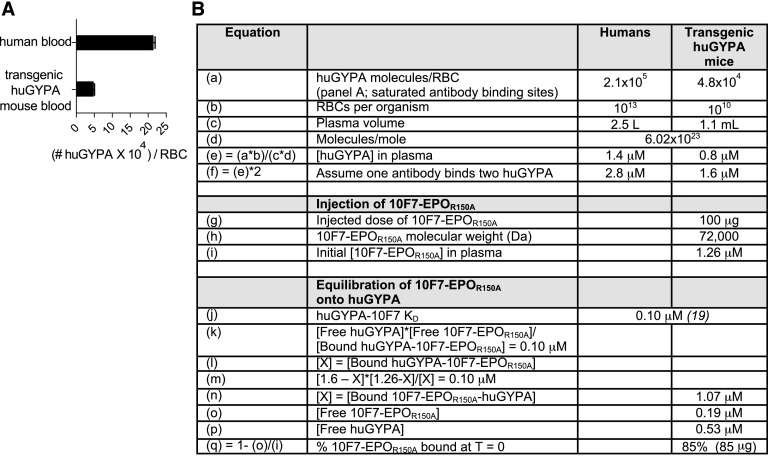
We tested 10F7-EPOR150A and control variants in huGYPA transgenic mice (26) because 10F7 does not cross-react with murine GYPA (27), and human EPO activates murine EPO-Rs (13). This animal model reflects the normal expression pattern of huGYPA (26). Transgenic RBCs express less huGYPA than human RBCs (Fig. S2A); 1.6 μM huGYPA is exposed to plasma in transgenic mice vs. 2.8 μM in humans (Fig. S2B). Treatment of huGYPA transgenic mice with 10F7-EPOR150A should stimulate erythropoiesis, and this production should depend on huGYPA expression and a functional 10F7 element.
Fig. S2.
huGYPA expression on human RBCs vs. transgenic mouse RBCs. (A) Expression was determined by flow cytometry using a PE-conjugated anti-huGYPA antibody and BD Quantibrite PE beads (BD Biosciences). The graph displays mean ± SEM (n = 2). (B) Based on experimental and known values, we calculated the predicted percentage of 10F7-EPOR150A bound to RBCs upon injection. We previously determined the density of huGYPA and EPO-R on human erythroleukemia TF-1 and UT-7 cells. The estimates were ∼3,860 huGYPA/cell and ∼1,620 EPO-R/cell on TF-1 cells, and ∼28,100 huGYPA/cell and ∼7,880 EPO-R/cell on UT-7 cells (11). EPO-R expression on CFU-E erythroid progenitors has been previously estimated at ∼1,000 sites/cell (13). The following calculations indicate that initial binding to huGYPA is a plausible mechanism by which EPO activity could be concentrated in the neighborhood of EPO-R on RBC precursors. We previously performed similar calculations that take into account the space that is physically explored via constrained Brownian motion by a cytokine tethered by a linker to a targeting element, and the resulting effects on receptor-mediated endocytosis and degradation (46). If we assume a quantity of 5 × 10⁴ GYPA molecules per RBC precursor with a 103 μm2 surface area, and also assume that the 35-aa linker in 10F7-EPOR150A constrains the EPOR150A element to within 140 (35 × 4) Å (14 nm) of the cell surface, then 5 × 10⁴ GYPA molecules are in a relevant volume of 14 μm3, or 14 × 10−15 L; i.e., [GYPA] in this volume is ∼3.5 × 10¹⁸ molecules/L, or ∼6 μM. Let us further assume a 100 pM concentration of 10F7-EPOR150A in the bone marrow extracellular space (a minimum based in part on the pharmacokinetic profile of 10F7-EPOR150A). Because the KD of 10F7 for GYPA is 100 nM, [EPOR150A] on the cell surface (bound via 10F7 and exploring a space limited by the linker length) would be ∼6 nM. (Regardless of the exact concentration of 10F7-EPOR150A, if the effective GYPA concentration is 6 μM and the KD of 10F7 for GYPA is 100 nM, there will be a 60-fold concentration of EPOR150A on the cell surface relative to the bone marrow extracellular space.) Another point of comparison is that the mutation R150A in EPO reduces its KD for EPO-R to ∼85 nM, which is comparable to the ∼100 nM KD of 10F7 for GYPA. However, the number of GYPA molecules in the CFU-E population is much larger than the concentration of EPO-R, so initial attachment to the cell surface is plausibly driven by binding to GYPA. EPO/EPO-R internalization as a result of receptor-mediated endocytosis occurs in ∼15 min (47). GYPA internalization has not been studied but is expected to occur even more slowly because it is not a signaling receptor.
In Vitro Characterization of Chimeric Activator Variants.
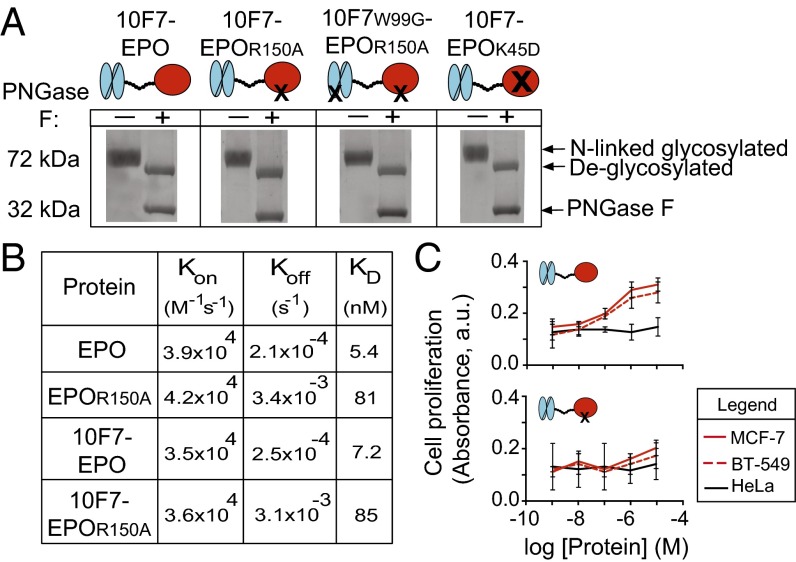
Our experimental strategy was designed to identify the chimeric activator features required for the desired in vivo behavior: RBC expansion in the absence of platelet production. We compared 10F7-EPOR150A with variants in which EPO was not mutated (10F7-EPO), 10F7 was mutated to mitigate huGYPA binding (10F7W99G-EPOR150A), and EPO was mutated to eliminate EPO-R affinity (10F7-EPOK45D). Darbepoetin alfa (Aranesp) was used as a nontargeted form of EPO (28). Fig. 2A shows engineered protein schematics and verification of their size and N-linked glycosylation.
Fig. 2.
In vitro characterization of chimeric activator variants. (A) Fusion proteins were analyzed by SDS/PAGE to determine purity, presence of full-length protein (72 kDa), potential degradation products, and release of N-linked carbohydrate chains on treatment with (+) or without (–) PNGase F enzyme. PNGase F runs at 32 kDa. (B) Results of in vitro kinetic analysis of interaction between EPO-R and unfused EPO, EPOR150A, 10F7-EPO, or 10F7-EPOR150A. (C) In vitro proliferation of EPO-R–positive MCF-7 and BT-549 cells vs. EPO-R–negative HeLa cells after treatment with 10F7-EPO or 10F7-EPOR150A. Graphs display mean ± SEM (n = 3).
We quantified the effect of the R150A mutation on the interaction between EPO and EPO-R (Fig. 2B). EPO and 10F7-EPO had similar binding kinetics (KD = 5.4 and 7.2 nM, respectively) in accordance with published values (29), indicating that the 10F7 element does not interfere with EPO binding to EPO-R. EPOR150A and 10F7-EPOR150A exhibited similar binding kinetics (KD = 81 and 85 nM, respectively). These results confirm that the R150A mutation weakens the interaction between EPO and EPO-R; whereas on-rates of 10F7-EPO and 10F7-EPOR150A were similar (3.5 × 10⁴ M−1⋅s−1 vs. 3.6 × 10⁴ M−1⋅s−1), their off-rates differed by 12-fold (2.5 × 10⁻⁴ s−1 vs. 3.1 × 10⁻³ s−1).
Mutations in 10F7 and EPO showed predicted effects in cell-based assays. In vitro activity was measured via proliferation of TF-1 erythroleukemia cells that express huGYPA and EPO-R (11) (Fig. S1). Fusion of 10F7 to wild-type EPO enhanced in vitro activity by 1.7-fold relative to EPO alone (Fig. S1A). In contrast, fusion of 10F7 to EPOR150A improved in vitro activity by 12-fold relative to EPOR150A alone (Fig. S1B), in agreement with previous in vitro testing (11). 10F7W99G-EPOR150A and EPOR150A had similar in vitro activity (Fig. S1C), implying that W99G weakens the affinity of 10F7 for huGYPA. Neither 10F7-EPOK45D nor EPOK45D alone was active in vitro (Fig. S1D), in agreement with previous work indicating that K45D is a null mutation (23).
In a separate in vitro assay, we determined that the EPO mutation R150A prevents enhanced proliferation of EPO-R–positive tumor cells (Fig. 2C). EPO can stimulate the growth of EPO-R–positive tumor cells and thereby enhance patient tumorigenesis (30, 31). In response to chimeric activator exposure, we compared proliferation of EPO-R–positive MCF-7 and BT-549 cells with EPO-R–negative HeLa cells (30, 31). MCF-7 and BT-549 cell lines responded to 10F7-EPO (logEC50 = −6.7 M) but not 10F7-EPOR150A; HeLa cells did not significantly respond to either protein. These results indicate that the mutation R150A mitigates undesired EPO activity on nonerythroid cells.
Pharmacodynamics of Chimeric Activator Variants.
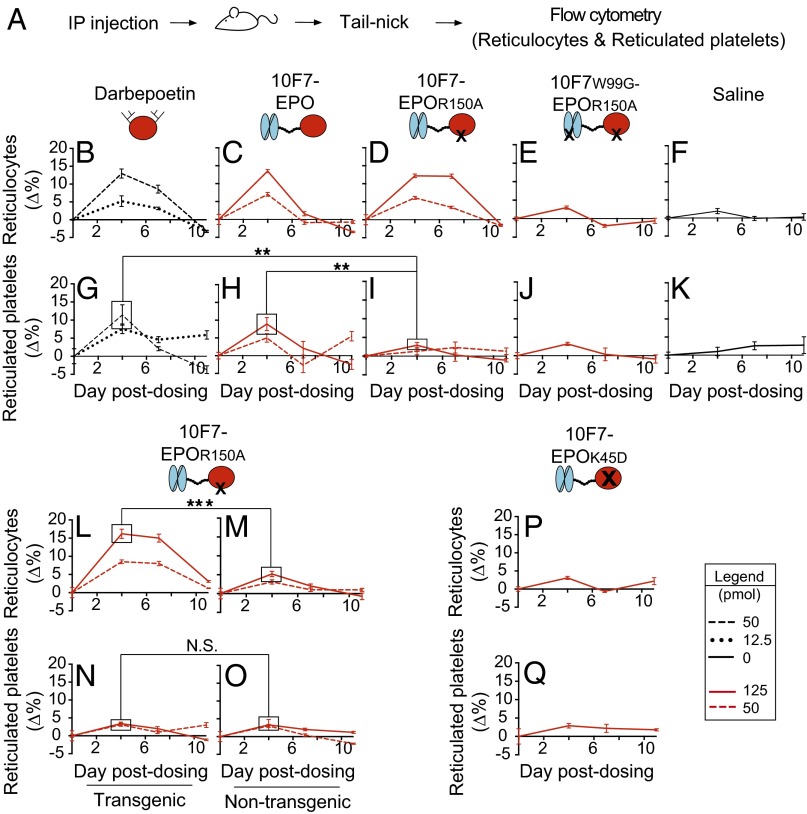
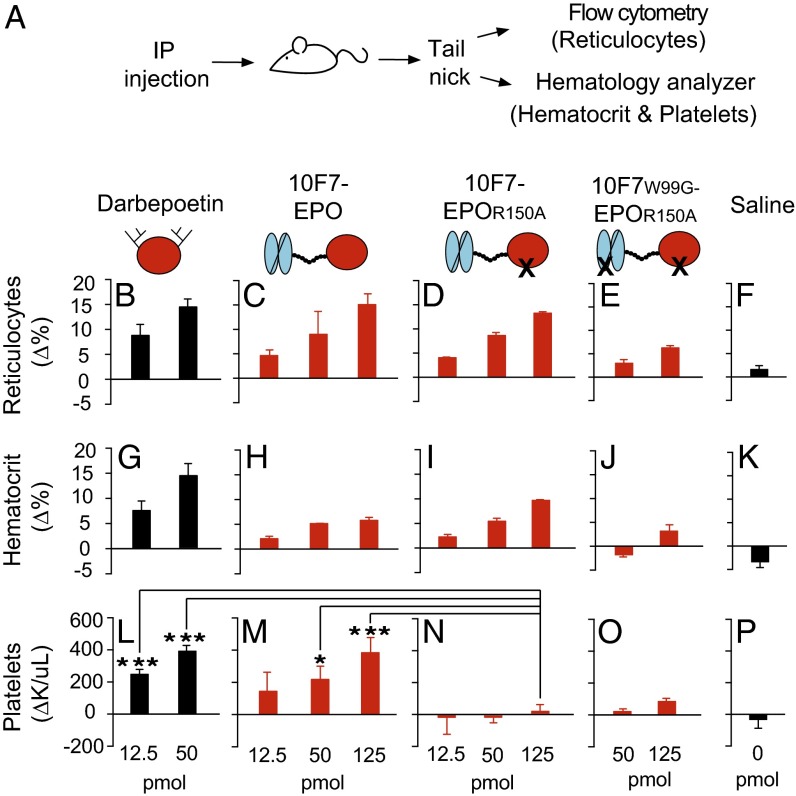
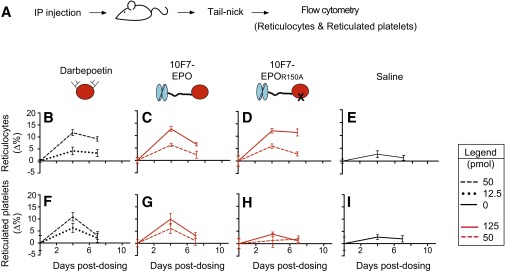
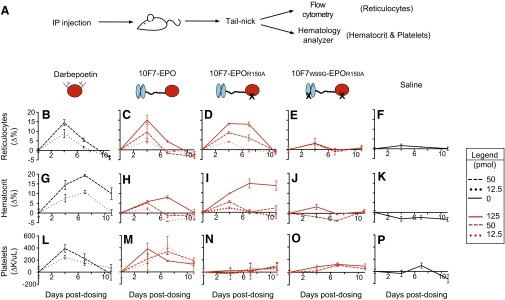
Animal testing indicated that 10F7-EPOR150A targets EPO activity to RBCs, and that the structural features of chimeric activators are essential for the desired in vivo behavior (Figs. 3 and 4 and Figs. S3–S6). We compared 10F7-EPOR150A with darbepoetin, control proteins, and saline. Pharmacodynamics will be a function of receptor on-rates and off-rates, plasma half-lives, and sequestration onto RBCs. Accordingly, to fairly assess the corresponding impact on platelets, we compared proteins at doses that achieved similar effects on RBC expansion (e.g., 50 pmol of darbepoetin vs. 125 pmol of chimeric activator). We assessed reticulocytes (RBC precursors as a percentage of total RBCs), hematocrit values (volume percentage of total RBCs), reticulated platelets (platelet precursors as a percentage of total platelets), and platelets (total platelet count per whole blood volume). Reticulocytes and reticulated platelets are <24 h old and thus measure new cell production (32, 33). Animals received a single i.p. injection, and responses were measured at 4, 7, and 11 d postdosing, with 4 d being roughly when a robust reticulocyte response can first be observed (Figs. 3A and 4A). All raw data are provided in Dataset S1.
Fig. 3.
Pharmacodynamic effects of chimeric activator variants on reticulocytes and reticulated platelets. (A) huGYPA transgenic mice received a single i.p. injection of darbepoetin, 10F7-EPO variants, or saline at the indicated concentrations (1 pmol darbepoetin = 37 ng; 1 pmol 10F7-EPO variant = 72 ng). Blood was obtained by tail-nick on days 0, 4, 7, and 11. (B–K) Parameters measured by flow cytometry were reticulocyte fraction of total RBCs (B–F) and reticulated platelet fraction of total platelets (G–K). (L–O) huGYPA transgenic or nontransgenic mice received a single i.p. injection of 10F7-EPOR150A, and reticulocytes (L and M) and reticulated platelets (N and O) were measured as in B–K. (P and Q) huGYPA transgenic mice received a single i.p. injection of 10F7-EPOK45D, and reticulocytes (P) and reticulated platelets (Q) were measured as in B–K. Measurements were baseline-subtracted relative to day 0. Graphs display mean ± SEM (n = 4). Comparisons between treatments were done using Student’s t test. N.S., not significant; **P < 0.05; ***P < 0.005.
Fig. 4.
Pharmacodynamic effects of chimeric activator variants on reticulocytes, hematocrit, and total platelets. (A) huGYPA transgenic mice received a single i.p. injection of darbepoetin, 10F7-EPO variant, or saline at the indicated concentrations (1 pmol darbepoetin = 37 ng; 1 pmol 10F7-EPO variant = 72 ng). Blood was obtained by tail-nick on days 0, 4, 7, and 11; the bar graphs indicate day 4 measurements. Measured parameters were reticulocyte fraction of whole blood by flow cytometry (B–F), and hematocrit (G–K) and total platelet counts (L–P) by hematology analyzer. Measurements were baseline-subtracted relative to day 0. Graphs display mean ± SEM (n = 4). Comparisons between treatments were done using Student’s t test. *P < 0.1; ***P < 0.005.
Fig. S3.
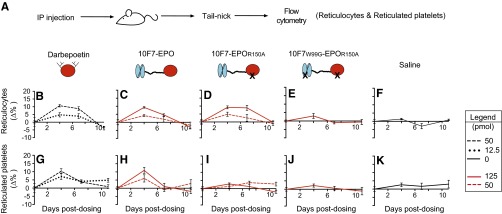
Pharmacodynamic effects of chimeric activator variants on reticulocytes and reticulated platelets in huGYPA transgenic and nontransgenic mice. This experiment is a repeat of that in Fig. 3, except that proteins were made from stable cell lines, not transient transfections. (A) huGYPA transgenic mice received a single i.p. injection of darbepoetin, 10F7-EPO variant, or saline vehicle at the indicated concentrations (1 pmol darbepoetin = 37 ng; 1 pmol 10F7-EPO variant = 72 ng). Blood samples were removed on days 0, 4, 7, and 11 postdosing. Hematologic parameters measured by flow cytometry were reticulocyte fraction (B–F) and reticulated platelet fraction (G–K). Measurements were background-subtracted relative to day 0. Graphs display mean ± SEM (n = 3).
Fig. S6.
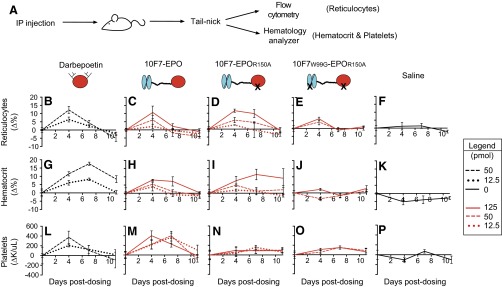
Pharmacodynamic effects of chimeric activator variants on reticulocytes, hematocrit, and total platelets in huGYPA transgenic and nontransgenic mice. This experiment is a repeat of that in Fig. 4, except that proteins were made from stable cell lines, not transient transfections. (A) Transgenic mice received a single i.p. injection of darbepoetin, 10F7-EPO variant, or saline at the indicated concentrations (1 pmol darbepoetin = 37 ng; 1 pmol 10F7-EPO variant = 72 ng). Blood samples were removed by tail-nick on days 0, 4, 7, and 11 postdosing. Measured hematologic parameters were reticulocyte fraction by flow cytometry (B–F) and hematocrit (G–K) and total platelet counts (L–P) by hematology analyzer. Measurements were background-subtracted relative to day 0. Graphs display mean ± SEM (n = 3).
In huGYPA transgenic mice, 10F7-EPOR150A stimulated expansion of reticulocytes, but not of reticulated platelets (Fig. 3 and Figs. S3 and S4). Average baseline reticulocyte and reticulated platelet counts were ∼5.9% and ∼17.6%, respectively. At the highest doses, darbepoetin, 10F7-EPO, and 10F7-EPOR150A raised reticulocytes by 12–14% by day 4 (Fig. 3 B–D). Darbepoetin and 10F7-EPO also strongly impacted reticulated platelets, by 12% (Fig. 3G) and 9.1% (Fig. 3H), respectively. Only 10F7-EPOR150A had a specific effect on reticulocytes relative to reticulated platelets (Fig. 3 D and I), causing a marginal 3.1% increase in reticulated platelets by day 4, comparable to the effect of 10F7W99G-EPOR150A or saline (Fig. 3 J and K: ∆4.9% and ∆2.8%, respectively). These trends were similar for all tested doses.
Fig. S4.
Pharmacodynamic effects of chimeric activator variants on reticulocytes and reticulated platelets in huGYPA transgenic mice. This experiment is another repeat of that in Fig. 3 but with six mice per dose group. (A) huGYPA transgenic mice received a single i.p. injection of darbepoetin, 10F7-EPO variant, or saline vehicle at the indicated concentrations (1 pmol darbepoetin = 37 ng; 1 pmol 10F7-EPO variant = 72 ng). Blood samples were removed on days 0, 4, and 7 postdosing. Hematologic parameters measured by flow cytometry were reticulocyte fraction (B–E) and reticulated platelet fraction (F–I). Measurements were background-subtracted relative to day 0. Graphs display mean ± SEM (n = 6).
The synthesis of reticulated platelets by darbepoetin and 10F7-EPOR150A was not due to treatment with saturating doses. By day 4, treatment with a low dose of darbepoetin caused a 5.2% increase in reticulocytes (Fig. 3B), whereas a high dose of 10F7-EPOR150A increased reticulocytes by 12.2% (Fig. 3D). However, at these same doses, darbepoetin increased reticulated platelets by 7.6% (Fig. 3G), whereas 10F7-EPOR150A increased reticulated platelets by only 2.9% (Fig. 3I). Thus, compared with darbepoetin, 10F7-EPOR150A caused greater stimulation of reticulocytes but less stimulation of reticulated platelets.
The pharmacodynamics of 10F7-EPOR150A depended on huGYPA expression. At all doses, 10F7-EPOR150A produced a lasting reticulocyte response in transgenic mice (Fig. 3L), but had little effect in nontransgenic mice (Fig. 3M). No effect on reticulated platelets was observed in either group (Fig. 3 N and O). Furthermore, the 10F7 element does not signal on its own; 10F7-EPOK45D, in which EPO is completely nonfunctional, had no effect on reticulocytes or reticulated platelets (Fig. 3 P and Q).
In huGYPA transgenic mice, 10F7-EPOR150A stimulated RBC proliferation but not total platelets (Fig. 4 and Figs. S5 and S6). Average baseline reticulocyte, hematocrit, and platelet counts were ∼6.1%, ∼51%, and ∼1.1 × 10⁶/μL, respectively. Reticulocytes increased by 13–15% at the highest doses of darbepoetin, 10F7-EPO, and 10F7-EPOR150A (Fig. 4 B–D), as mirrored by hematocrit changes (Fig. 4 G–I). These effects were dose-dependent. Platelets had a different response pattern; darbepoetin and 10F7-EPO caused platelet counts to significantly increase from baseline at all tested doses (Fig. 4 L and M), whereas 10F7-EPOR150A had little or no effect on platelet counts at any dose (Fig. 4N). Thus, this differential effect on RBCs vs. platelets depended on the mutation in EPO. In all experiments, 10F7W99G-EPOR150A (Fig. 4 E, J, and O) and saline (Fig. 4 F, K, and P) had minimal effects.
Fig. S5.
Pharmacodynamic effects of chimeric activator variants on reticulocytes, hematocrit, and total platelets in huGYPA transgenic and nontransgenic mice. This figure presents the complete data from Fig. 4, showing all experimental time points. (A) Transgenic mice received a single i.p. injection of darbepoetin, 10F7-EPO variant, or saline at the indicated concentrations (1 pmol darbepoetin = 37 ng; 1 pmol 10F7-EPO variant = 72 ng). Blood samples were obtained by tail-nick on days 0, 4, 7, and 11 postdosing. Measured hematologic parameters were reticulocyte fraction by flow cytometry (B–F) and hematocrit (G–K) and total platelet counts (L–P) by hematology analyzer. Measurements were background-subtracted relative to day 0. Graphs display mean ± SEM (n = 4).
Only 10F7-EPOR150A caused a specific increase in reticulocytes and RBCs without a concomitant increase in reticulated and mature platelets. This specificity required a weakened EPO element, a functional 10F7 targeting element, and expression of the targeted receptor huGYPA. These results illustrate how cell-specific signaling can be achieved with targeted fusion proteins that have modulated binding properties.
Pharmacokinetics of Chimeric Activator Variants.
Binding of 10F7-EPOR150A to huGYPA reduces its maximal plasma concentration (Cmax) and increases its terminal plasma half-life. EPO pharmacokinetics can be influenced by receptor binding, glycosylation, and molecular weight, which affect clearance through receptor-mediated endocytosis by EPO-Rs, liver asialoglycoprotein receptors, and kidney filtration, respectively (13, 29, 34). Moreover, binding to huGYPA on mature RBCs is expected to create a sink effect (35), through which most of 10F7-EPOR150A should equilibrate with the free plasma state.
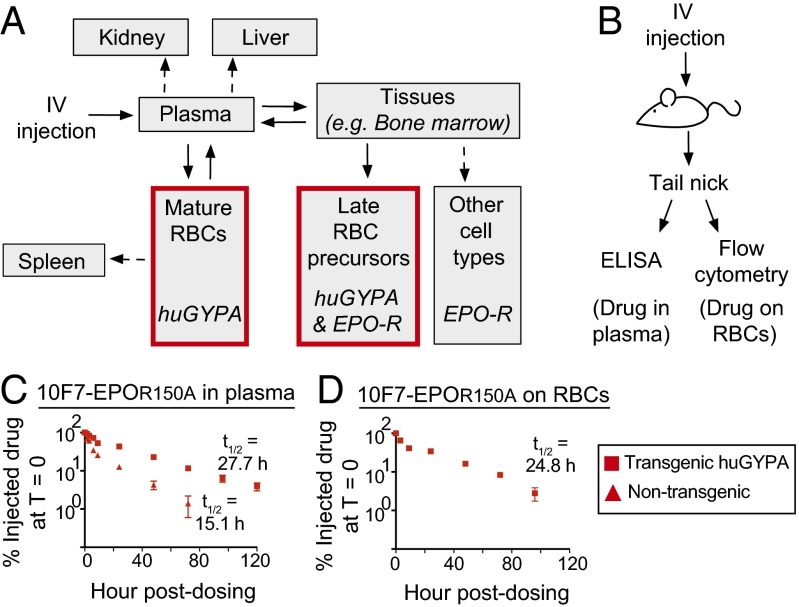
Fig. 5A illustrates a biodistribution compartment model for 10F7-EPOR150A. Clearance should occur mainly through binding of EPO-Rs on late RBC precursors. Kidney clearance should be minimal owing to the molecular size. Binding to nonerythroid EPO-R should be reduced owing to the R150A EPO mutation, and binding to asialoglycoprotein receptors should remove only a subpopulation of drug molecules (29). Finally, clearance of RBC-bound drug via splenic apoptosis should be slow (36).
Fig. 5.
Pharmacokinetics of chimeric activator 10F7-EPOR150A. (A) Compartment model of the expected biodistribution and elimination of 10F7-EPOR150A. Drug enters the plasma, where it immediately binds mature huGYPA-expressing RBCs (red box) that act as a drug sink. Free drug in the plasma can enter other tissues to stimulate expansion of late RBC precursors (red box) or other EPO-R–positive cell types. (B) huGYPA transgenic or nontransgenic mice were given a single i.v. 100-μg dose of 10F7-EPOR150A. (C and D) Blood was collected in a time course to measure drug in plasma by ELISA (C) or RBC-bound drug by flow cytometry (D). Measurements are relative to amount of drug detected at T = 0 (100%). Graphs display mean ± SEM (n = 2) and the terminal plasma and RBC-bound half-lives of 10F7-EPOR150A in huGYPA transgenic and nontransgenic mice.
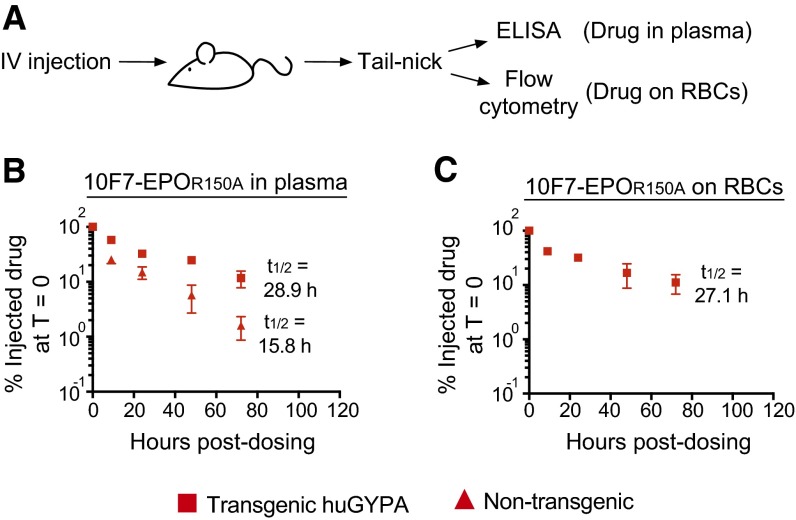
The Cmax of 10F7-EPOR150A was strongly influenced by binding to huGYPA. To measure the protein’s terminal plasma and RBC-bound half-lives, huGYPA transgenic and nontransgenic mice were injected with 100 μg (1.39 nmol) (Fig. 5B) or 25 μg (0.35 nmol) (Fig. S7A) of 10F7-EPOR150A, and plasma or whole blood was collected in a 5-d time course. In nontransgenic mice injected with 100 μg of 10F7-EPOR150A, the initial plasma concentration of 10F7-EPOR150A was 82 μg/mL, which corresponds to the injected dose in a plasma volume of 1.1 mL (Fig. S2B). In contrast, the initial plasma concentration in transgenic mice was 16 μg/mL, suggesting that ∼80% of the injected protein immediately bound to huGYPA on mature RBCs. Similar results were obtained after an initial injection of 25 μg. These conclusions agree with the predicted effect of 10F7-EPOR150A binding to huGYPA based on a 100-μg injection (Fig. S2B).
Fig. S7.
Pharmacokinetics of chimeric activator 10F7-EPOR150A. (A) huGYPA transgenic or nontransgenic mice were given a single 25-μg dose of 10F7-EPOR150A i.v. (B and C) Blood was collected in a 72-h time course to measure drug in plasma by ELISA (B) or RBC-bound drug by flow cytometry (C). Measurements are relative to the amount of drug detected at T = 0 (100%). Graphs display mean ± SEM (n = 2) and the terminal plasma and RBC-bound half-lives of 10F7-EPOR150A in huGYPA transgenic and nontransgenic mice.
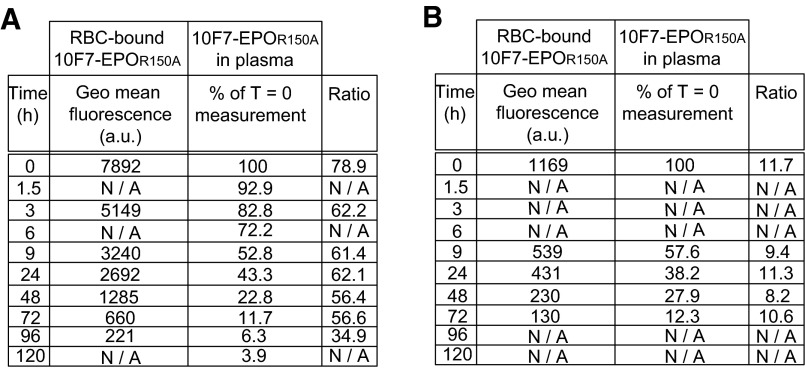
The terminal plasma half-life of 10F7-EPOR150A was extended by binding to huGYPA on mature RBCs. In transgenic mice, 10F7-EPOR150A had terminal plasma and RBC-bound half-lives of ∼28.3 h (Fig. 5C and Fig. S7B) and ∼26.0 h (Fig. 5D and Fig. S7C), respectively. The ratio of 10F7-EPOR150A in plasma to that bound to RBCs was roughly constant at all time points (Fig. S8), consistent with a rapid equilibration between the bound and unbound states. In comparison, 10F7-EPOR150A had a terminal plasma half-life of ∼15.5 h in nontransgenic mice (Fig. 5C and Fig. S7B), and meaningful RBC binding was not detected. These results suggest that binding to huGYPA extends the plasma half-life and reduces the Cmax of 10F7-EPOR150A.
Fig. S8.
Ratios of RBC-bound 10F7-EPOR150A to plasma at time points postdosing. huGYPA transgenic mice were injected i.v. with (A) 100 μg (n = 2) or (B) 25 μg (n = 2) of 10F7-EPOR150A, and drug bound to RBCs or free in plasma was measured using flow cytometry (geometric mean fluorescence) or ELISA (% of T = 0 measurement), respectively.
Discussion
Recombinant DNA technology has enabled strategies for targeting drug activity to specific cells or tissues. Some approaches, such as antibody-dependent prodrug therapy and chimeric antigen receptors, have been challenging to develop for quantitative reasons (2, 5). These methods use wild-type versions of natural proteins and antibodies, without optimization of the different elements relative to one another. Moreover, engineered therapeutic systems may fail in vivo owing to distribution and pharmacokinetic issues that cannot be addressed in vitro, and rules for success in vivo have not been explored systematically. Data presented here indicate how rational protein design can be used to reduce side effects and identify protein features critical for improving in vivo specificity and pharmacokinetics.
To minimize the in vivo side effects of EPO, we used a protein format termed “chimeric activators,” composed of a mutated activity element tethered to a targeting element (10, 11). Although EPO ameliorates anemia due to kidney failure or cancer chemotherapy, recent clinical trials have shown that EPO enhances mortality in part through thrombotic side effects (37, 38). Our strategy was to target EPO to RBC precursors, so as to minimize the action on platelet precursors and other nonerythroid cell types. We tethered the mutant protein EPOR150A by a glycine-serine linker to the scFv 10F7 to produce the molecule 10F7-EPOR150A, which binds the RBC surface marker huGYPA. The EPO mutation R150A reduces EPO-R binding by ∼12-fold, and the linker length allows both elements of 10F7-EPOR150A to bind to EPO-R and huGYPA simultaneously (Fig. 1).
Targeting 10F7-EPOR150A to RBC precursors in huGYPA transgenic mice stimulated RBC expansion with minimized effects on platelet production. This RBC-specific activity contrasted with that of darbepoetin and 10F7-EPO. For example, a 50 pmol dose of darbepoetin increased reticulocytes by 13.0% (Fig. 3B) and reticulated platelets by 11.4% (Fig. 3G). Similar effects were observed when comparing hematocrit (Fig. 4G) and total platelet (Fig. 4L) values. In contrast, 125 pmol of 10F7-EPOR150A stimulated both reticulocytes (Fig. 4D) and hematocrit (Fig. 4I), but had minimal effects on reticulated platelets (Fig. 3I) and total platelets (Fig. 4N). Thus, stimulation of RBCs and platelet expansion can be separated using the protein 10F7-EPOR150A.
RBC and platelet responses in mice treated with control fusions of 10F7 to EPO indicated that all chimeric activator features are required for targeting. For example, 10F7-EPO stimulated reticulated (Fig. 3H) and total platelet (Fig. 4M) proliferation, similarly to darbepoetin (Figs. 3G and 4L). These results show that simply attaching a targeting element to EPO does not prevent off-target signaling activity. Comparing 10F7-EPO and 10F7-EPOR150A indicated that the mutation in EPO mitigates platelet production (Fig. 4 M and N), whereas RBC production is preserved (Fig. 4 C and D). Loss of targeting, either by mutation of 10F7 (Fig. 4 E and J) or by testing in nontransgenic mice (Fig. 3 M and O), dramatically decreased the molecule’s ability to stimulate RBC expansion. These results indicate that the addition of a targeting element alone is insufficient for cell type specificity in vivo, and that quantitative tuning by mutation is crucial.
Binding to huGYPA profoundly affected the pharmacokinetics of 10F7-EPOR150A (Fig. 5 C and D). Previous work has shown that the plasma half-lives of liposomes and ovalbumin can be extended via fusion to anti-RBC antibodies (39) or peptides (40). Our molecule exhibited a similarly extended terminal plasma half-life, which was nearly twice as long in huGYPA transgenic mice compared with nontransgenic mice (28.3 h vs. 15.5 h) (Fig. 5C). We also found that ∼80% of injected 10F7-EPOR150A was bound to RBCs, as was predicted (Fig. S2B). Thus, binding to huGYPA effectively increases plasma half-life and reduces Cmax, which are useful features in an injected drug whose therapeutic effects occur in response to the duration of exposure, rather than to maximal injected levels.
Our results indicate that EPO-mediated platelet production in mice is likely a direct effect on platelet precursors, and not, for example, an indirect effect resulting from RBC production (41, 42). This is presumably mediated via EPO-Rs on maturing megakaryocytes (43). EPO treatment is associated with several prothrombotic activities, including elevated total platelet and reticulated platelet counts, platelet activation, E-selectin on endothelial cells, P-selectin on platelets, von Willebrand factor, and/or up-regulation of the renin-angiotensin system (44). We hypothesize that these off-target effects may additively create a prothrombotic physiological state. Because elevated reticulated and total platelet counts are potential prothrombotic indicators, 10F7-EPOR150A may serve as a lead compound in the development of an EPO agent with reduced thrombotic side effects.
Immunogenicity is a potential challenge in the clinical development of any EPO-based protein drug. Neutralizing antidrug antibodies can cross-react with endogenous EPO and render a patient transfusion-dependent (45). Fortunately, immunogenicity of RBC-bound protein drugs should be minimized because RBC-bound proteins are presented in a noninflammatory manner to the immune system during RBC apoptosis (40).
EPO is generally described as an erythropoietic hormone. Our results, along with extensive previous work by others documenting nonerythroid EPO activities (44), lead us to hypothesize that EPO naturally orchestrates an integrated, adaptive response to hemorrhage. The diverse effects of EPO—including the production of blood components and protection of tissues against the activation of hypoxia and thrombotic pathways (44)—may be overall adaptive as transient responses to wounding or internal bleeding, but could be maladaptive during long-term EPO treatment.
Methods
Cell Culture.
Human erythroleukemia TF-1 cells [American Type Culture Collection (ATCC)], FreeStyle Chinese Hamster Ovary (CHO-S) cells (Life Technologies), CHO DG44 cells (Life Technologies), human breast cancer MCF-7 cells (ATCC), and cervical cancer HeLa cells (ATCC) were cultured according to standard procedures. Detailed information is provided in SI Methods.
Construction of Chimeric Activator Variants.
Detailed descriptions of construct designs are provided in SI Methods.
Expression and Purification of Chimeric Activator Variants.
Transient and stable protein expression was carried out using FreeStyle CHO-S cells (Life Technologies) and CHO DG44 cells (Life Technologies), respectively, following standard procedures. Proteins were purified by a two-step process. Details are provided in SI Methods.
In Vitro Characterization of Chimeric Activator Variants.
A kinetic analysis of EPO-R binding by protein variants was performed using the BLItz system (ForteBio) according to the manufacturer’s instructions. In brief, an EPO-R N-terminally fused to Fc (R&D Systems) was immobilized onto Protein A Dip and Read Biosensors (ForteBio), and test proteins were added to measure association and dissociation constants. Details are provided in SI Methods.
Stimulation of TF-1, MCF-7, BT-549, and HeLa cell proliferation by a given protein was tested as described in SI Methods. Data represent the average ± SE of three replicates.
Animal Model.
The huGYPA transgenic FVB mice (26) were generously donated by Emory University’s Hendrickson Laboratory. Pups were screened for transgene expression by detecting huGYPA expression on RBCs via flow cytometry. Details are provided in SI Methods.
Pharmacodynamics and Pharmacokinetics of Chimeric Activator Variants.
Measurements were performed in accordance with guidelines of the Institutional Animal Care and Use Committee of Harvard Medical School (Protocol 04998) and the National Heart, Blood, and Lung Institute of the National Institutes of Health. Data represent the average ± SE of four biological replicates. Detailed information is provided in SI Methods.
SI Methods
Cell Culture.
FreeStyle Chinese hamster ovary (CHO-S) cells were cultured in FreeStyle CHO Expression Medium (Life Technologies), and CHO DG44 cells were cultured in complete DG44 Medium (Life Technologies). Human erythroleukemia TF-1 cells (ATCC) were cultured in RPMI-1640 medium with 10% (vol/vol) FBS, 100 U/mL penicillin, 100 U/mL streptomycin, and 2 ng/mL recombinant human granulocyte macrophage colony-stimulating factor (GM-CSF; Life Technologies) unless specified otherwise. Human breast cancer MCF-7 cells were cultured in Eagle’s MEM (ATCC), 10% (vol/vol) FBS, and 1% insulin. Human breast cancer BT-549 cells were cultured in RPMI-1640 medium (ATCC), 10% (vol/vol) FBS, and 0.023 IU/mL insulin. Human cervical cancer HeLa cells were cultured in Eagle’s MEM (ATCC) and 10% FBS. CHO-S and CHO DG44 cells were cultured at 37 °C in 8% (vol/vol) CO2 with shaking at 2.35 × g. TF-1, MCF-7, BT-549, and HeLa cells were cultured at 37 °C in 5% (vol/vol) CO2.
Construction of Chimeric Activator Variants.
Chimeric activator coding sequences have been deposited in GenBank (accession nos. KX026660–KX026663). The general structure is as follows. The 10F7 scFv linked by a 35-aa glycine/serine linker to human EPO; unfused EPO variants were created as well. Constructs were subcloned into pSecTag2A and pOptiVEC vectors (Life Technologies) for transient and stable expression, respectively. These vectors contain a CMV promoter, murine Ig k-chain leader sequence, and a C-terminal c-myc epitope and His6 tag for purification.
The mutation EPOK45D was designed based on published site-directed mutagenesis results (23) and inspection of the EPO:EPO-R crystal structure. EPO mutation 10F7W99G alters CDR3 of the heavy chain and was designed as follows. A model of 10F7 V regions was constructed using the Rosetta online server, and a BLAST alignment of 10F7 heavy and light chains was performed to identify common CDR substitutions in closely related antibodies. The 10F7W99G was tested based on inspection of the structural model and alignments. The construct 10F7W99G-EPOR150A was well expressed and exhibited the desired lack of activity in a TF-1 cell proliferation assay (Fig. S1C).
Expression and Purification of Chimeric Activator Variants.
For transient expression, Freestyle CHO-S cells (Life Technologies) were transfected with pSecTag2A plasmid according to the supplier’s protocol. After 5 d of culture, cells were pelleted by centrifugation at 500 × g, and supernatant protein expression was confirmed by SDS/PAGE using Coomassie Fluor Orange protein gel stain (Life Technologies).
For stable expression, CHO DG44 cells were transfected with pOptiVec plasmid according to the supplier’s protocol. After 2 d of culture, cells were moved to complete dihydrofolate reductase (DHFR)-negative CD OptiCHO medium (Life Technologies) for selection. Selection continued until cells recovered to >90% viability. Expression was assayed as described above. To enhance expression, each stable pool underwent one round of methotrexate amplification, after which expression was again assayed as described above.
Proteins derived from transient transfection or stable cell lines were purified as follows. Supernatant was concentrated to 7 mL using a Macrosep Advance centrifugal device (Pall Corp.) or tangential flow filtration (Labscale TFF Lab System; EMD Millipore). Concentrated protein was bound to 700 μL of ProBond nickel chelating resin (Life Technologies) for 1 h at 4 °C while rotating in a 15-mL Falcon tube, washed three times with native purification buffer (50 mM NaH2PO4 and 0.5 M NaCl, pH 8.0) plus 20 mM imidazole, and eluted with native purification buffer plus increasing imidazole concentrations: 50 mM, 100 mM, 250 mM. Eluted proteins were desalted (Econo-Pac 10DG columns; Bio-Rad) into 1× PBS (Teknova: 137 mM NaCL, 1.4 mM KH2PO4, 4.3 mM Na2HPO4, and 2.7 mM KCl, pH 7.4) and then concentrated to 1 mL. Contaminating proteins were removed by size-exclusion chromatography on Superdex 200 10/300 GL columns (GE Healthcare) using an AKTA FPLC system (GE Healthcare). Desired protein fractions were pooled, concentrated to <1 mL, and quantified by the Pierce BCA Protein Assay Kit (Thermo Scientific).
Protein concentration and purity (>95%) were verified by Coomassie-SDS/PAGE, and N-linked glycosylation was verified with PNGase F (New England Biolabs) according to the supplier’s protocol. Proteins were stored at 4 °C throughout the described process, ultimately stored as aliquots at −80 °C, and thawed once before use. Only endotoxin-free reagents were used.
In Vitro Characterization of Chimeric Activator Variants.
A kinetic analysis of EPO-R binding by protein variants was performed using the BLItz system (ForteBio). The extracellular moiety of EPO-R N-terminally fused to Fc (R&D Systems) was diluted to 50 μg/mL in 1× BLItz kinetic buffer (ForteBio). Protein A Dip and Read Biosensors (ForteBio) were hydrated in kinetic buffer for 10 min, and a baseline reading in the kinetic buffer was taken for 30 s. Then 4 μL of EPO-R-Fc protein was immobilized to biosensors for 120 s, followed by a 30-s wash in kinetic buffer to remove unbound protein. Biosensors were then exposed to 4 μL of varying concentrations of protein variants for 200 s to measure protein association, followed by a 200-s dissociation step in kinetic buffer. Binding constants were quantified using BLItz software.
To test stimulation of TF-1 cell proliferation by a given protein, 104 cells per well were seeded in a 96-well plate in 100 μL of RPMI-1640 with serum and antibiotics (without GM-CSF). Cells were incubated with 10-fold serial dilutions (10−11 to 10−7 M) of engineered proteins for 72 h. Proliferation was determined by the addition of 5 μL of WST-1 Cell Proliferation Reagent (Roche). After a 4-h incubation with dye, proliferation was measured by reading absorbance at 450 nm, with background subtraction at 650 nm, on a BioTek Synergy Neo HTS microplate reader. The resulting data were plotted and fitted with nonlinear regression using Prism GraphPad, from which EC50 values were obtained. Reported data represent the average ± SE of three replicates.
Stimulation of MCF-7, BT-549, and HeLa cell proliferation by a given protein was tested as follows. First, 104 cells were seeded in a 96-well plate in 100 μL of growth medium. Cells were allowed to adhere for 24 h, after which the medium was replaced with medium lacking serum or insulin, and cells were incubated with 10-fold serial dilutions (10−7 to 10−3 M) of engineered proteins for 72 h. Proliferation was measured as described above. Reported data represent the average ± SE of three replicates.
Animal Model.
The huGYPA transgenic FVB mice were generously donated by the Hendrickson Laboratory at Emory University (26). This strain underwent embryo rederivation at Charles River Laboratories. Homozygous huGYPA transgene expression is embryo-lethal. Pups were screened for heterozygous transgene expression by measuring huGYPA expression on RBCs via flow cytometry. A <10 μL blood sample was collected by tail-nick in EDTA-coated capillary tubes (Sarstedt), and 1 μL was diluted 1:1,000 in FACS buffer (R&D Systems) at room temperature. On a 96-well plate, 100 μL of diluted blood was incubated with 5 μL of anti–huGYPA-PE antibody (R&D Systems) per well for 40 min in the dark at room temperature. Cells were washed three times with FACS buffer and then either assayed immediately or stored at 4 °C for <24 h before FACS analysis.
huGYPA expression on transgenic mouse and human RBCs was quantified using the BD Quantibrite Phycoerythrin Fluorescence Quantitation kit (BD Biosciences) with PE beads. Fresh whole human blood was obtained from Research Blood Components in EDTA vacutainers. Fresh whole huGYPA transgenic mouse blood was collected as described above. Cells were washed twice with FACS buffer (R&D Systems). On a 96-well plate, 106 cells in a volume of 100 μL were labeled with PE-conjugated anti-huGYPA antibody (R&D Systems) or PE-conjugated IgG isotype control (R&D Systems). Cells were washed three times with FACS buffer, fixed in 1% paraformaldehyde, and then stored at 4 °C for <24 h before FACS analysis. Reported data represent the average ± SE of two biological replicates.
Pharmacodynamics of Chimeric Activator Variants.
Four mice (two males and two females, age 12–16 wk) (Figs. 3 and 4 and Fig. S5), three mice (one male and two females, age 12–16 wk) (Figs. S3 and S6), or six mice (three males and three females, age 12–16 wk) (Fig. S4) received a single i.p. injection with a given protein at varying concentrations in a 250 μL volume, and <50 μL of whole blood was collected by tail-nick in EDTA-coated tubes (Sarstedt) on days 0, 4, 7, and 11 postinjection. Blood was analyzed within 3 h of collection. Total RBC and platelet counts were determined using a hematology analyzer (Hemavet 950; Drew Scientific). Reticulocyte counts were determined by standard flow cytometry. A stock solution (1 mg/mL) of thiazole orange (Sigma-Aldrich) was prepared in methanol and diluted 1:10,000 in PBS. Whole blood was diluted 1:2,000 in the working solution and then incubated for 30 min in the dark at room temperature. Then 200 μL of stained blood per sample was added to a 96-well plate, fixed in 1% paraformaldehyde, and stored at 4 °C for <24 h before FACS analysis. Reported data represent the average ± SE of biological replicates (n = 3, 4, or 6).
In a separate experiment, reticulocytes and reticulated platelets were determined as described above by flow cytometry, including a costain with anti–CD41-PE antibody (BD Pharmingen). Samples were examined by two-color analysis of thiazole orange and anti–CD41-PE (compared with the internal standard of platelets labeled only with CD41-PE). Reported data represent the average ± SE of biological replicates (n = 3, 4, or 6).
Pharmacokinetics of 10F7-EPOR150A.
Pharmacokinetic profiling of plasma concentrations and RBC-associated protein was performed in two different ways. In the first experiment (Fig. 5), four huGYPA transgenic and four nontransgenic mice (all females, age 12–16 wk) were injected with 100 μg of 10F7-EPOR150A. Two transgenic and two nontransgenic mice were used for a plasma assay, and the other two transgenic and two nontransgenic mice were used for an RBC-bound assay. In the second experiment (Fig. S7), two transgenic or two nontransgenic mice (all females, age 12–16 wk) were injected with 25 μg of 10F7-EPOR150A, and all mice were used for both plasma and RBC-bound assays.
Plasma concentrations of 10F7-EPOR150A were detected by ELISA. A <20-μL sample of whole blood was collected by tail-nick in EDTA-coated tubes (Sarstedt) in a 120-h time course. Immediately after collection, blood was centrifuged at 2,000 × g for 5 min, after which plasma was collected and transferred to a new tube on ice and ultimately frozen at −20 °C until analysis. Plasma was analyzed using a human EPO ELISA Kit (R&D Systems). Data were plotted on a log10 scale, and terminal plasma half-lives were determined by fitting the terminal time points to an exponential curve using Prism GraphPad. Data represent the average ± SE of two biological replicates.
RBC-bound 10F7-EPOR150A was detected by flow cytometry. Whole blood was collected as described above in a 120-h time course. Blood was diluted 100-fold into 10 mM EDTA/PBS and then washed twice with FACS buffer (R&D Systems). On a 96-well plate, 106 cells in a 100-μL volume were labeled using PE-conjugated anti-6xHis tag antibody (Abcam) or PE-conjugated IgG isotype control (R&D Systems). Cells were washed three times with FACS buffer, fixed in 1% paraformaldehyde, and stored at 4 °C for <24 h before FACS analysis. Data were plotted on a log10 scale, and terminal half-lives were determined by fitting the terminal time points to an exponential curve using Prism GraphPad. Reported data represent the average ± SE of two biological replicates.
Flow Cytometry.
Samples were analyzed on a LSRFortessa SORP flow cytometer equipped with an optional HTS sampler (BD Biosciences) using the following filter configuration: FITC excitation, 488 nm/100 mW; emission filter, BP 515/20; PE excitation, 561/50 mW; emission filter, BP 582/15. Data were analyzed using FlowJo (Tree Star).
Supplementary Material
Acknowledgments
We thank the Hendrickson Laboratory (Emory University) for generously donating the huGYPA transgenic mouse strain; A. Graveline for veterinary expertise; B. Turczyk for cell culture assistance; K. Pardee, the Wyss Institute Sepsis Team, A. Robinson-Mosher, G. Webster, L. Certain, N. Cohen, B. Dusel, A. Chavez, P. Bendapudi, P. Fraenkel, F. Bunn, and M. Goldberg for experimental advice; G. Cuneo for flow cytometry assistance; and R. Ward, N. Cohen, L. Certain, and A. Robinson-Mosher for manuscript editing. This work was supported by funds from the Wyss Institute for Biologically Inspired Engineering, the Boston Biomedical Innovation Center (Pilot Award 112475), the Defense Advanced Research Projects Agency (Grant W911NF-11-2-0056), and the National Institutes of Health (Grant R01 GM036373). D.R.B. was the recipient of a Ruth L. Kirschstein National Research Service Award from the National Institutes of Health (5F32HL122007-02).
Footnotes
Conflict of interest statement: D.R.B., P.A.S., and J.C.W. are listed as inventors on patent applications relating to targeted erythropoietin fusion proteins.
This article is a PNAS Direct Submission.
Data deposition: The sequences reported in this paper have been deposited in the GenBank database (accession nos. KX026660–KX026663).
This article contains supporting information online at www.pnas.org/lookup/suppl/doi:10.1073/pnas.1525388113/-/DCSupplemental.
References
- 1.Liu Y, et al. The antimelanoma immunocytokine scFvMEL/TNF shows reduced toxicity and potent antitumor activity against human tumor xenografts. Neoplasia. 2006;8(5):384–393. doi: 10.1593/neo.06121. [DOI] [PMC free article] [PubMed] [Google Scholar]
- 2.Bagshawe KD. Targeting: The ADEPT story so far. Curr Drug Targets. 2009;10(2):152–157. doi: 10.2174/138945009787354520. [DOI] [PubMed] [Google Scholar]
- 3.Kreitman RJ, Pastan I. Antibody fusion proteins: Anti-CD22 recombinant immunotoxin moxetumomab pasudotox. Clin Cancer Res. 2011;17(20):6398–6405. doi: 10.1158/1078-0432.CCR-11-0487. [DOI] [PMC free article] [PubMed] [Google Scholar]
- 4.Gillies SD. A new platform for constructing antibody-cytokine fusion proteins (immunocytokines) with improved biological properties and adaptable cytokine activity. Protein Eng Des Sel. 2013;26(10):561–569. doi: 10.1093/protein/gzt045. [DOI] [PubMed] [Google Scholar]
- 5.Sadelain M, Brentjens R, Rivière I. The basic principles of chimeric antigen receptor design. Cancer Discov. 2013;3(4):388–398. doi: 10.1158/2159-8290.CD-12-0548. [DOI] [PMC free article] [PubMed] [Google Scholar]
- 6.Huehls AM, Coupet TA, Sentman CL. Bispecific T-cell engagers for cancer immunotherapy. Immunol Cell Biol. 2015;93(3):290–296. doi: 10.1038/icb.2014.93. [DOI] [PMC free article] [PubMed] [Google Scholar]
- 7.Moraga I, et al. Tuning cytokine receptor signaling by re-orienting dimer geometry with surrogate ligands. Cell. 2015;160(6):1196–1208. doi: 10.1016/j.cell.2015.02.011. [DOI] [PMC free article] [PubMed] [Google Scholar]
- 8.Lauffenburger DA, Fallon EM, Haugh JM. Scratching the (cell) surface: Cytokine engineering for improved ligand/receptor trafficking dynamics. Chem Biol. 1998;5(10):R257–R263. doi: 10.1016/s1074-5521(98)90110-7. [DOI] [PubMed] [Google Scholar]
- 9.Inoue M, Nakayama C, Noguchi H. Activating mechanism of CNTF and related cytokines. Mol Neurobiol. 1996;12(3):195–209. doi: 10.1007/BF02755588. [DOI] [PubMed] [Google Scholar]
- 10.Cironi P, Swinburne IA, Silver PA. Enhancement of cell type specificity by quantitative modulation of a chimeric ligand. J Biol Chem. 2008;283(13):8469–8476. doi: 10.1074/jbc.M708502200. [DOI] [PMC free article] [PubMed] [Google Scholar]
- 11.Taylor ND, Way JC, Silver PA, Cironi P. Anti-glycophorin single-chain Fv fusion to low-affinity mutant erythropoietin improves red blood cell-lineage specificity. Protein Eng Des Sel. 2010;23(4):251–260. doi: 10.1093/protein/gzp085. [DOI] [PubMed] [Google Scholar]
- 12.Garcin G, et al. High efficiency cell-specific targeting of cytokine activity. Nat Commun. 2014;5(3016):1–9. doi: 10.1038/ncomms4016. [DOI] [PubMed] [Google Scholar]
- 13.Bunn HF. Erythropoietin. Cold Spring Harb Perspect Med. 2013;3(3):a011619. doi: 10.1101/cshperspect.a011619. [DOI] [PMC free article] [PubMed] [Google Scholar]
- 14.Anagnostou A, et al. Erythropoietin receptor mRNA expression in human endothelial cells. Proc Natl Acad Sci USA. 1994;91(9):3974–3978. doi: 10.1073/pnas.91.9.3974. [DOI] [PMC free article] [PubMed] [Google Scholar]
- 15.Jelkmann W, Wagner K. Beneficial and ominous aspects of the pleiotropic action of erythropoietin. Ann Hematol. 2004;83(11):673–686. doi: 10.1007/s00277-004-0911-6. [DOI] [PubMed] [Google Scholar]
- 16.Jelkmann W, Elliott S. Erythropoietin and the vascular wall: The controversy continues. Nutr Metab Cardiovasc Dis. 2013;23(Suppl 1):S37–S43. doi: 10.1016/j.numecd.2012.04.002. [DOI] [PubMed] [Google Scholar]
- 17.Thurber GM, Schmidt MM, Wittrup KD. Antibody tumor penetration: Transport opposed by systemic and antigen-mediated clearance. Adv Drug Deliv Rev. 2008;60(12):1421–1434. doi: 10.1016/j.addr.2008.04.012. [DOI] [PMC free article] [PubMed] [Google Scholar]
- 18.Bigbee WL, Vanderlaan M, Fong SS, Jensen RH. Monoclonal antibodies specific for the M- and N-forms of human glycophorin A. Mol Immunol. 1983;20(12):1353–1362. doi: 10.1016/0161-5890(83)90166-9. [DOI] [PubMed] [Google Scholar]
- 19.Catimel B, Wilson KM, Kemp BE. Kinetics of the autologous red cell agglutination test. J Immunol Methods. 1993;165(2):183–192. doi: 10.1016/0022-1759(93)90344-7. [DOI] [PubMed] [Google Scholar]
- 20.Merry AH, Hodson C, Thomson E, Mallinson G, Anstee DJ. The use of monoclonal antibodies to quantify the levels of sialoglycoproteins alpha and delta and variant sialoglycoproteins in human erythrocyte membranes. Biochem J. 1986;233(1):93–98. doi: 10.1042/bj2330093. [DOI] [PMC free article] [PubMed] [Google Scholar]
- 21.Loken MR, Shah VO, Dattilio KL, Civin CI. Flow cytometric analysis of human bone marrow, I: Normal erythroid development. Blood. 1987;69(1):255–263. [PubMed] [Google Scholar]
- 22.Rahuel C, et al. Alteration of the genes for glycophorin A and B in glycophorin A-deficient individuals. Eur J Biochem. 1988;177(3):605–614. doi: 10.1111/j.1432-1033.1988.tb14413.x. [DOI] [PubMed] [Google Scholar]
- 23.Elliott S, Lorenzini T, Chang D, Barzilay J, Delorme E. Mapping of the active site of recombinant human erythropoietin. Blood. 1997;89(2):493–502. [PubMed] [Google Scholar]
- 24.Okumura N, Tsuji K, Nakahata T. Changes in cell surface antigen expressions during proliferation and differentiation of human erythroid progenitors. Blood. 1992;80(3):642–650. [PubMed] [Google Scholar]
- 25.Landschulz KT, Boyer SH, Noyes AN, Rogers OC, Frelin LP. Onset of erythropoietin response in murine erythroid colony-forming units: Assignment to early S-phase in a specific cell generation. Blood. 1992;79(10):2749–2758. [PubMed] [Google Scholar]
- 26.Auffray I, et al. Glycophorin A dimerization and band 3 interaction during erythroid membrane biogenesis: In vivo studies in human glycophorin A transgenic mice. Blood. 2001;97(9):2872–2878. doi: 10.1182/blood.v97.9.2872. [DOI] [PubMed] [Google Scholar]
- 27.Rearden A. Evolution of glycophorin A in the hominoid primates studied with monoclonal antibodies, and description of a sialoglycoprotein analogous to human glycophorin B in chimpanzee. J Immunol. 1986;136(7):2504–2509. [PubMed] [Google Scholar]
- 28.Egrie JC, Dwyer E, Browne JK, Hitz A, Lykos MA. Darbepoetin alfa has a longer circulating half-life and greater in vivo potency than recombinant human erythropoietin. Exp Hematol. 2003;31(4):290–299. doi: 10.1016/s0301-472x(03)00006-7. [DOI] [PubMed] [Google Scholar]
- 29.Way JC, et al. Improvement of Fc-erythropoietin structure and pharmacokinetics by modification at a disulfide bond. Protein Eng Des Sel. 2005;18(3):111–118. doi: 10.1093/protein/gzi021. [DOI] [PubMed] [Google Scholar]
- 30.Trost N, et al. Recombinant human erythropoietin alters gene expression and stimulates proliferation of MCF-7 breast cancer cells. Radiol Oncol. 2013;47(4):382–389. doi: 10.2478/raon-2013-0056. [DOI] [PMC free article] [PubMed] [Google Scholar]
- 31.Acs G, et al. Erythropoietin and erythropoietin receptor expression in human cancer. Cancer Res. 2001;61(9):3561–3565. [PubMed] [Google Scholar]
- 32.Wiczling P, Krzyzanski W. Method of determination of the reticulocyte age distribution from flow cytometry count by a structured-population model. Cytometry A. 2007;71(7):460–467. doi: 10.1002/cyto.a.20408. [DOI] [PubMed] [Google Scholar]
- 33.McBane RD, 2nd, Gonzalez C, Hodge DO, Wysokinski WE. Propensity for young reticulated platelet recruitment into arterial thrombi. J Thromb Thrombolysis. 2014;37(2):148–154. doi: 10.1007/s11239-013-0932-x. [DOI] [PubMed] [Google Scholar]
- 34.Macdougall IC. Optimizing the use of erythropoietic agents: Pharmacokinetic and pharmacodynamic considerations. Nephrol Dial Transplant. 2002;17(Suppl 5):66–70. doi: 10.1093/ndt/17.suppl_5.66. [DOI] [PubMed] [Google Scholar]
- 35.Kontos S, Hubbell JA. Improving protein pharmacokinetics by engineering erythrocyte affinity. Mol Pharm. 2010;7(6):2141–2147. doi: 10.1021/mp1001697. [DOI] [PubMed] [Google Scholar]
- 36.Khandelwal S, Saxena RK. Assessment of survival of aging erythrocyte in circulation and attendant changes in size and CD147 expression by a novel two-step biotinylation method. Exp Gerontol. 2006;41(9):855–861. doi: 10.1016/j.exger.2006.06.045. [DOI] [PubMed] [Google Scholar]
- 37.Pfeffer MA, et al. TREAT Investigators A trial of darbepoetin alfa in type 2 diabetes and chronic kidney disease. N Engl J Med. 2009;361(21):2019–2032. doi: 10.1056/NEJMoa0907845. [DOI] [PubMed] [Google Scholar]
- 38.Swedberg K, et al. RED-HF Committees; RED-HF Investigators Treatment of anemia with darbepoetin alfa in systolic heart failure. N Engl J Med. 2013;368(13):1210–1219. doi: 10.1056/NEJMoa1214865. [DOI] [PubMed] [Google Scholar]
- 39.Singhal A, Gupta CM. Antibody-mediated targeting of liposomes to red cells in vivo. FEBS Lett. 1986;201(2):321–326. doi: 10.1016/0014-5793(86)80632-9. [DOI] [PubMed] [Google Scholar]
- 40.Kontos S, Kourtis IC, Dane KY, Hubbell JA. Engineering antigens for in situ erythrocyte binding induces T-cell deletion. Proc Natl Acad Sci USA. 2013;110(1):E60–E68. doi: 10.1073/pnas.1216353110. [DOI] [PMC free article] [PubMed] [Google Scholar]
- 41.Vogel J, et al. Transgenic mice overexpressing erythropoietin adapt to excessive erythrocytosis by regulating blood viscosity. Blood. 2003;102(6):2278–2284. doi: 10.1182/blood-2003-01-0283. [DOI] [PubMed] [Google Scholar]
- 42.Jeong S-K, Cho YI, Duey M, Rosenson RS. Cardiovascular risks of anemia correction with erythrocyte stimulating agents: Should blood viscosity be monitored for risk assessment? Cardiovasc Drugs Ther. 2010;24(2):151–160. doi: 10.1007/s10557-010-6239-7. [DOI] [PubMed] [Google Scholar]
- 43.Ishibashi T, Koziol JA, Burstein SA. Human recombinant erythropoietin promotes differentiation of murine megakaryocytes in vitro. J Clin Invest. 1987;79(1):286–289. doi: 10.1172/JCI112796. [DOI] [PMC free article] [PubMed] [Google Scholar]
- 44.Vaziri ND, Zhou XJ. Potential mechanisms of adverse outcomes in trials of anemia correction with erythropoietin in chronic kidney disease. Nephrol Dial Transplant. 2009;24(4):1082–1088. doi: 10.1093/ndt/gfn601. [DOI] [PubMed] [Google Scholar]
- 45.Casadevall N, et al. Pure red-cell aplasia and antierythropoietin antibodies in patients treated with recombinant erythropoietin. N Engl J Med. 2002;346(7):469–475. doi: 10.1056/NEJMoa011931. [DOI] [PubMed] [Google Scholar]
- 46.Robinson-Mosher A, Chen JH, Way J, Silver PA. Designing cell-targeted therapeutic proteins reveals the interplay between domain connectivity and cell binding. Biophys J. 2014;107(10):2456–2466. doi: 10.1016/j.bpj.2014.10.007. [DOI] [PMC free article] [PubMed] [Google Scholar]
- 47.Gross AW, Lodish HF. Cellular trafficking and degradation of erythropoietin and novel erythropoiesis-stimulating protein (NESP) J Biol Chem. 2006;281(4):2024–2032. doi: 10.1074/jbc.M510493200. [DOI] [PubMed] [Google Scholar]
Associated Data
This section collects any data citations, data availability statements, or supplementary materials included in this article.


