Abstract
Synaptic ribbons are large proteinaceous scaffolds at the active zone of ribbon synapses that are specialized for rapid sustained synaptic vesicles exocytosis. A single ribbon‐specific protein is known, RIBEYE, suggesting that ribbons may be constructed from RIBEYE protein. RIBEYE knockdown in zebrafish, however, only reduced but did not eliminate ribbons, indicating a more ancillary role. Here, we show in mice that full deletion of RIBEYE abolishes all presynaptic ribbons in retina synapses. Using paired recordings in acute retina slices, we demonstrate that deletion of RIBEYE severely impaired fast and sustained neurotransmitter release at bipolar neuron/AII amacrine cell synapses and rendered spontaneous miniature release sensitive to the slow Ca2+‐buffer EGTA, suggesting that synaptic ribbons mediate nano‐domain coupling of Ca2+ channels to synaptic vesicle exocytosis. Our results show that RIBEYE is essential for synaptic ribbons as such, and may organize presynaptic nano‐domains that position release‐ready synaptic vesicles adjacent to Ca2+ channels.
Keywords: CtBP2, GCamP3, photoreceptors, RIBEYE knockout, tonic release
Subject Categories: Neuroscience
Introduction
Ribbon synapses transmit wide‐spectrum sensory information in the visual and auditory system by evolving a unique organelle at the presynaptic active zone, the synaptic ribbon. The synaptic ribbon is a proteinaceous organelle that is anchored orthogonally to the presynaptic membrane and characterized by a halo of tethered synaptic vesicles. Synaptic ribbons are thought to facilitate continuous vesicle release for sustained periods, thereby maintaining a large pool of release‐ready vesicles (Heidelberger et al, 2005; Matthews & Fuchs, 2010). In photoreceptor synapses of the retina, the synaptic ribbon is a large, plate‐like structure with a horseshoe‐shaped appearance that characteristically appears bar‐shaped in cross sections (Schmitz, 2009; Zanazzi & Matthews, 2009). Ribbons of bipolar cells are typically smaller and can also adopt a spherical shape similar to hair cells of the inner ear. Retinal ribbon synapses contain most of the components characteristic of chemical synapses, such as the SNARE protein synaptobrevin‐2, the SM‐protein Munc18‐1, and the active zone proteins RIM and bassoon, but differ from standard chemical synapses in that release is triggered by opening of slowly inactivating voltage‐gated L‐type instead of N‐ or P/Q‐type Ca2+ channels and is mediated by the t‐SNARE syntaxin‐3 instead of syntaxin‐1 (Wang et al, 1997; tom Dieck et al, 2005; for review, see Matthews & Fuchs, 2010; Mercer & Thoreson, 2011).
Although synaptic ribbons vary in shape, size, and number in different retina and hair cell synapses, all synaptic ribbons contain copious amounts of a unique scaffolding protein called RIBEYE (Schmitz et al, 2000). RIBEYE consists of a large N‐terminal A‐domain that is specific for RIBEYE and a C‐terminal B‐domain that is largely identical with the transcription factor CtBP2, with only the N‐terminal 20 residues of CtBP2 being absent from RIBEYE. The unique large N‐terminal A‐domain of RIBEYE that is absent from CtBP2 is encoded by a single large exon that is located in the first intron of the CtBP2 gene. In contrast, the unique N‐terminal 20 residues of CtBP2 that are absent from RIBEYE are encoded by a separate CtBP2‐specific 5′ exon that is located upstream of the RIBEYE‐specific 5′ exon (Schmitz et al, 2000). The A‐domain of RIBEYE has been proposed to perform a structural role, while the B‐domain of RIBEYE binds NAD(H) similar to CtBP2 and likely interacts with multiple proteins in the presynaptic terminal (Schmitz et al, 2000; tom Dieck et al, 2005; Alpadi et al, 2008; Magupalli et al, 2008; Venkatesan et al, 2010; Dembla et al, 2014).
RIBEYE is the only known ribbon‐specific protein. In goldfish bipolar cells, synaptic ribbons were estimated to contain 4,000 RIBEYE molecules (Zenisek et al, 2004). By immunocytochemistry, RIBEYE is present throughout the synaptic ribbon (Schmitz et al, 2000), suggesting that RIBEYE may be central to the formation of synaptic ribbons. However, morpholino knockdown of RIBEYE in zebrafish caused only a significant decrease in synaptic ribbons but did not completely eliminate the ribbons (Wan et al, 2005; Lv et al, 2012). Thus, it remained unclear whether RIBEYE is essential for ribbons as such, or whether RIBEYE is an ancillary component that simply assists in ribbon formation without being actually required for it.
Significant evidence suggests that synaptic ribbons perform critical functions in neurotransmission at sensory synapses (Matthews & Fuchs, 2010). It has been proposed that synaptic ribbons may act as a conveyor belt to deliver vesicles continuously for tonic release, as a mechanism to coordinate multivesicular release, or as a timing belt to restrain replenishment of readily releasable pools (Singer et al, 2004; Jackman et al, 2009). Ribbons have been proposed to organize the active zone and presynaptic Ca2+ channels for precisely timed release (Zenisek et al, 2003; Khimich et al, 2005; Frank et al, 2010; Zabouri & Haverkamp, 2013; Jing et al, 2013; Wong et al, 2014; for review, see Kim et al, 2013). Furthermore, acute photo‐damage of the synaptic ribbon revealed a role for the ribbon in vesicle priming (Snellman et al, 2011). However, currently no manipulation is available to selectively and completely abolish ribbons in sensory synapses, and the precise function of synaptic ribbons and of RIBEYE in release remains enigmatic.
Previous studies on CtBP2 knockout (KO) mice showed that deletion of CtBP2 (which also deletes RIBEYE) resulted in embryonic lethality at embryonic day 10.5, probably because of a fundamental role of CtBP2 in transcription (Hildebrand & Soriano, 2002). To specifically analyze the function of RIBEYE but not of CtBP2, we here generated KO mice in which only the RIBEYE A‐domain (which is not present in CtBP2) is deleted. We show by electron microscopy that synaptic ribbons could no longer be detected after deletion of RIBEYE. Moreover, using paired recordings from rod bipolar cell/AII amacrine cell synapses, we demonstrate that evoked release was impaired upon deletion of RIBEYE and elimination of synaptic ribbons. Spontaneous mini release, however, was maintained normally, but exhibited an increased sensitivity to the slow high‐affinity Ca2+‐buffer EGTA. Our data suggest that RIBEYE is essential for formation of synaptic ribbons as such, and that ablating synaptic ribbons causes a major impairment in Ca2+‐triggered release and in nano‐domain coupling of Ca2+ channels to release sites. Thus, our data support a model whereby synaptic ribbons perform a conveyor belt function in recruiting synaptic vesicles for fast Ca2+‐triggered neurotransmitter release adjacent to presynaptic Ca2+ channels at the active zone (Matthews & Fuchs, 2010).
Results
Generation of RIBEYE knockin (KI) and KO mice
The large 5′ exon that encodes the unique N‐terminal A‐domain of RIBEYE is located in the first intron of the CtBP2 gene, 3′ of the small CtBP2 exon that encodes the unique N‐terminal 20 residues of CtBP2 (Schmitz et al, 2000). Both the CtBP2‐ and RIBEYE‐specific 5′ exons then splice into the shared downstream CtBP2/RIBEYE exons. To specifically manipulate RIBEYE expression without affecting CtBP2 expression, we focused on the unique 5′ A‐domain exon of RIBEYE (Fig 1A). We designed RIBEYE KI mice that express a fusion protein (referred to as RIB‐G3) composed of the RIBEYE A‐domain joined to the genetically encoded Ca2+‐sensor GCamP3, but lacking the C‐terminal RIBEYE B‐domain (Fig 1A). This strategy was developed based on elegant studies showing that RIBEYE‐mCherry fusion protein localizes to synaptic ribbons (West & McDermott, 2011). In addition, we flanked the unique RIBEYE A‐domain exon with loxP sites to allow excision of the entire exon by Cre‐recombinase and conversion of RIBEYE KI mice into RIBEYE‐specific KO mice.
Figure 1. Generation of RIBEYE knockin and KO mice.
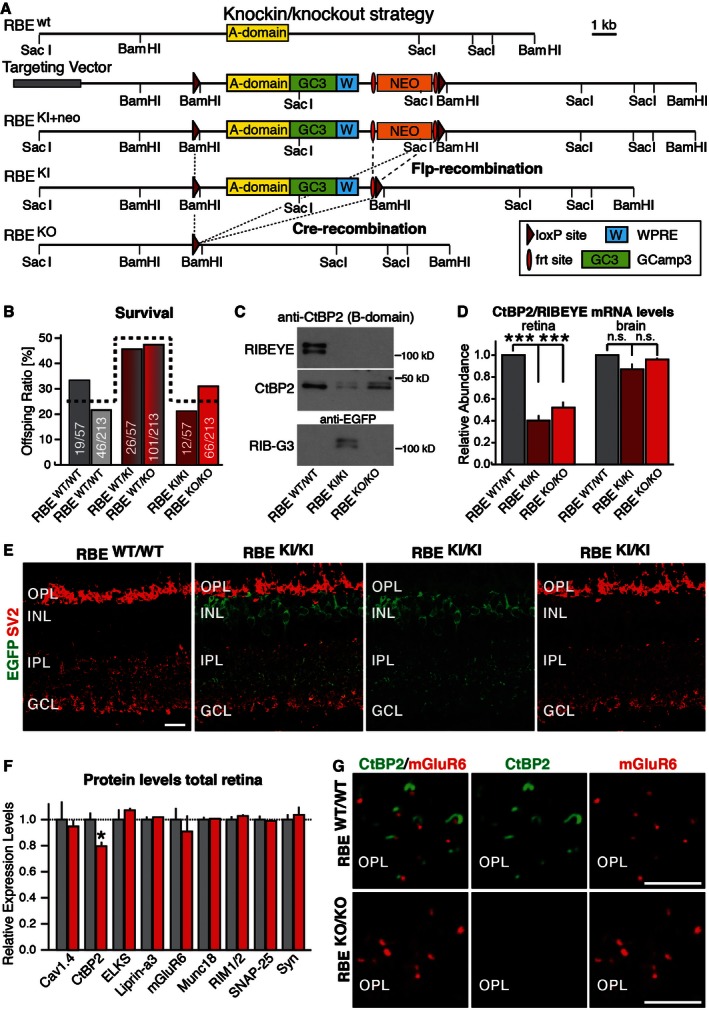
- Schematic of the targeting vector. In the vector, the RIBEYE‐specific A‐domain (yellow) is fused to the genetically encoded Ca2+‐sensor GCamP3 (green), followed by a stop codon and the woodchuck hepatitis virus posttranscriptional regulatory element (WPRE, blue) and a PGK‐neomycin resistance cassette (orange) that is flanked by frt sites (red ovals). This entire DNA sequence is flanked by loxP sites (dark red triangles). After homologous recombination into the RIBEYE locus (RBE KI+neo), Flp‐recombinase (introduced via transgenic expression) removes the selection cassette to generate the RBE KI allele. Subsequently, Cre‐recombinase excises the entire A‐domain and its accompanying sequences to produce the KO allele (RBE KO). Selected restriction sites are shown.
- RIBEYE mutations do not alter mouse survival. Data show surviving postweaning mice (at > P21) derived from matings between mice heterozygous for the RBE KI allele (dark red) or the RBE KO allele (bright red) normalized for the total number of mice (absolute numbers per genotype/absolute number of all mice per respective breeding strategy). The expected Mendelian ratio is indicated by the dashed line. Statistical analysis using the chi‐square test revealed no statistical difference between wild‐type and mutant mice (RBE KI allele P = 0.33; RBE KO allele P = 0.11).
- Representative immunoblot of retina homogenates from homozygous RBE WT/WT, RBE KI/KI and RBE KO/KO mice probed with antibodies to CtBP2 (to detect the B‐domain of RIBEYE and CtBP2) and to EGFP (to detect GCamP3 in the RIBEYE A‐domain GCamP3 fusion protein referred to as RIB‐G3).
- Measurements by RT–PCR of the relative abundance of CtBP2 and RIBEYE mRNAs using an assay that simultaneously measures both mRNAs in retina and in brain from control wild‐type mice (RBE WT/WT), KI mice expressing the RIBEYE A‐domain fusion protein with GCamP3 (RBE KI/KI), and KO mice (RBE KO/KO). These measurements were performed to test the relative expression of RIBEYE and CtBP2 in retina and to examine whether the RIBEYE A‐domain KO impairs CtBP2 expression in brain, which expresses little RIBEYE. Assays are based on a qRT–PCR strategy detecting mRNAs containing the spliced connection between exons 2 and 3 which is common to both transcript isoforms (RIBEYE and CtBP2). Statistical analyses were performed using Student's t‐test; data are presented as mean ± SEM (***P < 0.001; n = 4 mice per genotype).
- Representative immunofluorescence labeling of cryostat sections from littermate wild‐type and RBE KI/KI mice for EGFP (green, to detect GCamP3 in RIB‐G3) and SV2 (red, to label synapses) demonstrates expression of the A‐domain/GCamP3 fusion protein in knockin mice (OPL, outer plexiform layer; INL, inner nuclear layer; IPL, inner plexiform layer; GCL, granule cell layer). Scale bar: 5 μm.
- Levels of CtBP2 and of synaptic proteins in retina homogenates from littermate RBE WT/WT and RBE KO/KO mice. Levels were determined by quantitative immunoblotting using fluorescently labeled secondary antibodies; results are normalized to loading controls depending on molecular weights (actin, fodrin, VCP, and GDI) and to wild‐type controls. Statistical analyses were performed using Student's t‐test; data are presented as mean ± SEM (*P < 0.05; n = 4 mice per genotype).
- Immunofluorescence labeling for CtBP2 (green, to label RIBEYE) and mGluR6 (red, to label photoreceptor synapses) in cryostat sections from littermate RBE WT/WT and RBE KO/KO mouse retinas demonstrates that the KO abolishes RIBEYE expression (OPL, outer plexiform layer). Scale bars: 5 μm.
We constructed a targeting vector that incorporated these features for homologous recombination in embryonic stem cells, and additionally included a neomycin resistance cassette for positive selection. The neomycin cassette was flanked by frt sites for excision by Flp‐recombinase. Using homologous recombination, we generated mutant embryonic stem cells with the correctly targeted RIBEYE allele. We produced from these embryonic stem cells mice in which the mutant RIBEYE allele still contains the neomycin resistance cassette (RBE KI+neo mice), and excised the neomycin resistance cassette from the RBE KI+neo mice using transgenically expressed Flp‐recombinase. The resulting offspring constitutively expressed the RIBEYE A‐domain/GCamP3 fusion protein “RIB‐G3” under control of the endogenous RIBEYE promoter (RBE KI mice). Finally, we crossed the RBE KI mice to Cre‐recombinase‐expressing mice to generate constitutive RIBEYE KO (RBE KO) mice.
All three mouse lines (RBE KI+neo, RBE KI, and RBE KO) were bred to homozygosity and validated by Southern blot analysis (Fig EV1). All homozygous RIBEYE mutant mice were viable and fertile and displayed no obvious phenotypic abnormalities. Moreover, when we analyzed matings of heterozygous RBE KI mice or RBE KO mice to detect potential survival phenotypes, we observed no deviation of the number of surviving offspring from expected Mendelian distributions (Fig 1B). Thus, RIBEYE inactivation does not significantly impair mouse survival or reproduction.
Figure EV1. Southern blotting analysis of homologous recombination.
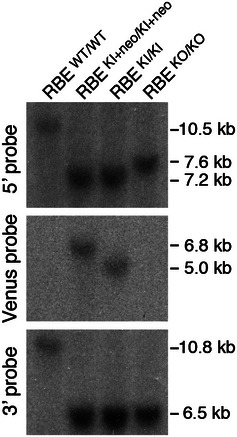
Southern blot analysis of genomic DNA from homozygous wild‐type (RBE wt) and mutated alleles of RIBEYE (RBE KI+neo, RBE KI, and RBE KO; see Fig 1A). Correct recombination events were confirmed using outside probes hybridizing to the 5′ (SacI‐digested genomic DNA) and the 3′ homology region (BamHI digested) and to the GFP‐coding portion of GCamP3 (Venus probe; BamHI digested). Positions of size markers are indicated on the right.
We next analyzed retinas from littermate RBE KI, RBE KO, and wild‐type mice by immunoblotting, quantitative RT–PCR, and immunocytochemistry (Fig 1C–G). RBE KI mice lacked RIBEYE with a B‐domain and contained the RIB‐G3 protein which was labeled with an EGFP antibody both on immunoblots (Fig 1C) and in retina sections by double immunofluorescence labeling (Fig 1E). RBE KI mice exhibited a significant decrease in CtBP2 protein and mRNA levels in the retina but not in brain (Fig 1C, D and F). This apparent decrease may be due at least in part to the decrease in RIBEYE since an interference of CtBP2 synthesis by the RIBEYE KI should also operate in brain, and the full survival of RIBEYE KI and KO mice suggests that CtBP2 expression is not greatly impaired in these mice. In retina of RBE KI mice, RIB‐G3 was abundantly present in bipolar neurons but not in photoreceptors, possibly because it is not stable in the latter cells (Fig 1E). Viewed together, these experiments demonstrate that RIBEYE KI mice express RIB‐G3 fusion protein in at least a subset of RIBEYE‐expressing neurons, but exhibit a decrease in CtBP2 levels.
RBE KO mice also lack RIBEYE but exhibited only a small decrease in CtBP2 protein levels in retina (Fig 1C and F). CtBP2 mRNA levels were decreased much more in retina from RBE KO mice than CtBP2 protein levels (Fig 1D), likely because the CtBP2 mRNA but not protein measurements also monitor RIBEYE mRNAs which are absent from RBE KO mice. Immunoblotting analyses and mRNA measurements of a series of synaptic proteins in retina from RBE KO mice revealed no other significant changes (Figs 1F and EV2). Immunocytochemistry of RBE KO mice showed that the RIBEYE KO abolished presynaptic RIBEYE expression without causing a major redistribution of postsynaptic mGluR6 receptor clusters (Fig 1G). Thus, the RIBEYE KO blocks RIBEYE expression but has no major effect on CtBP2 expression or the composition of retina synapses.
Figure EV2. Protein and mRNA expression analysis of RIBEYE mutant mice.
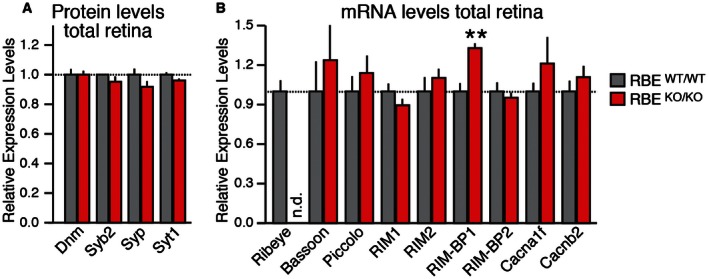
- Levels of additional synaptic proteins in retina homogenates from littermate RBE WT/WT and RBE KO/KO mice complementing those shown in Fig 1F. Levels were determined by quantitative immunoblotting using fluorescently labeled secondary antibodies; results are normalized to loading controls depending on molecular weights (actin, VCP, and GDI) and to wild‐type controls.
- Quantitative RT–PCR analysis of a series of presynaptic proteins in total retina from littermate RBE WT/WT and RBE KO/KO mice. Levels were standardized on actin transcript levels and relative to wild type.
RIBEYE deletion does not affect the overall organization and synaptic connectivity of the retina
To determine the impact of the RIBEYE deletion on the retina, we performed immunofluorescence analyses for RIBEYE (A‐domain) and RIBEYE/CtBP2 (B‐domain) as well as co‐markers SV2 and PSD95 on vertical, 0.5‐μm (semi‐thin) retina sections from RBE WT and RBE KO mice (Figs 2A and EV3). In wild‐type sections, we observed co‐labeling for RIBEYE with SV2 in photoreceptor synapses of the outer plexiform layer and in bipolar/AII amacrine cell synapses of the inner plexiform layer. The RIBEYE KO abolished the RIBEYE signal as expected, but did not change SV2 labeling (Fig 2A). Similar results were obtained with co‐labeling experiments for CtBP2 (which corresponds to the B‐domain of RIBEYE) and PSD95 (Fig EV3).
Figure 2. RIBEYE KO does not impair synaptic organization of the retina.
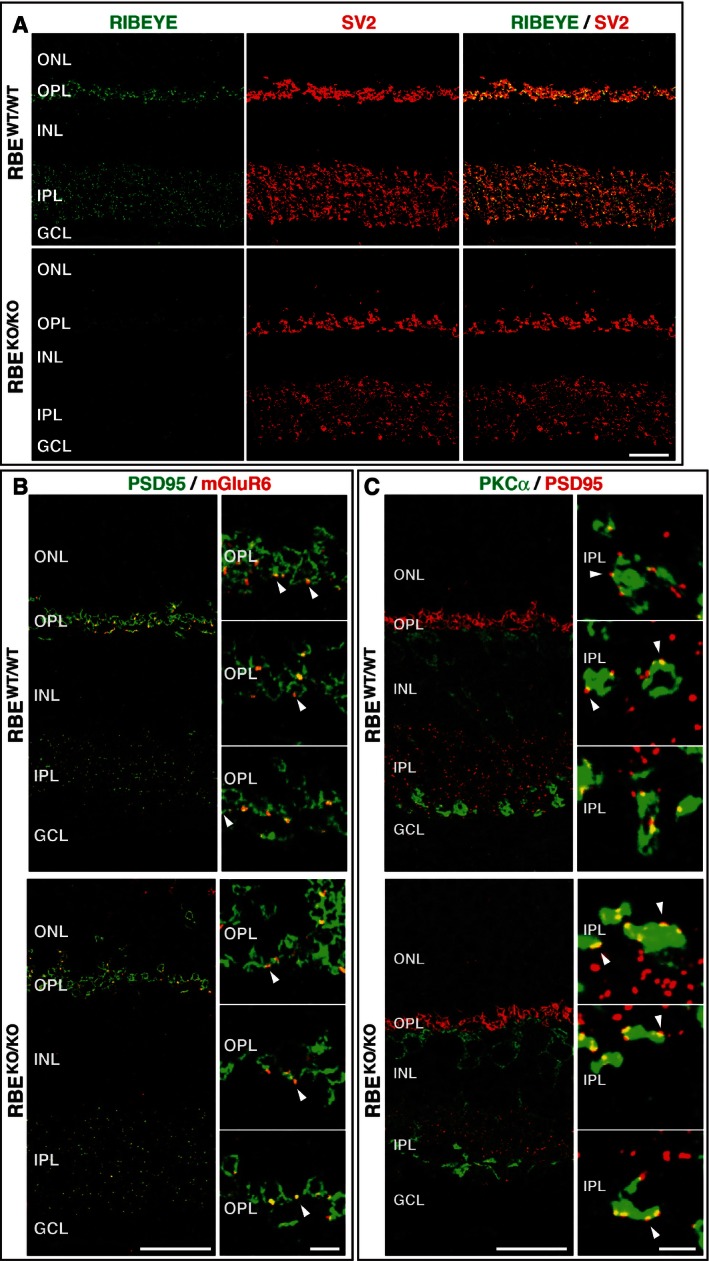
- Overview of the synaptic organization of the retina in RBE WT/WT and RBE KO/KO mice. Cryostat sections from littermate mice were labeled by double immunofluorescence for the RIBEYE B‐domain (CtBP2; green) and SV2. Scale bar: 20 μm; abbreviations: ONL, outer nuclear layer; OPL, outer plexiform layer; INL, inner nuclear layer; IPL, inner plexiform layer; GCL, ganglion cell layer.
- Double immunofluorescence staining of retinas from RBE WT/WT and RBE KO/KO mice for PSD95 (green, to label postsynaptic specializations) and mGluR6 (red, to label specifically postsynaptic sites formed by bipolar neurons in photoreceptor synapses). White arrowheads identify mGluR6‐positive puncta at photoreceptor/bipolar cell synapses in the OPL. Abbreviations are as in (A). Scale bars: 20 μm (overview), 5 μm (panel magnification).
- Same as (B), except that retinas were stained for PKCα (green, to label bipolar neurons) and PSD95 (red, to label amacrine cells). White arrowheads identify PSD95‐positive puncta at rod bipolar cell synapses in the IPL. Scale bars: 20 μm (overview), 2 μm (panel magnification).
Figure EV3. Immunofluorescence staining of RIBEYE/CtBP2 and PSD95 in wild‐type and RIBEYE KO retina.
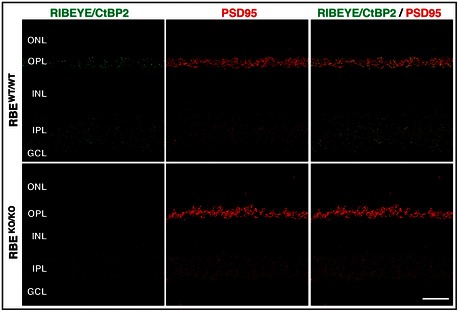
Representative double immunofluorescence labeling of RIBEYE/CtBP2 (green, to label the B‐domain common to both splice forms) and PSD95 (red) in semi‐thin sections of RBE WT/WT and RBE KO/KO retina. The RBE KO/KO retina clearly shows a lack of RIBEYE in photoreceptor terminals in the outer plexiform layer and bipolar cell terminals in the inner plexiform layer compared to wild‐type retina. Scale bar: 20 μm; abbreviations: ONL, outer nuclear layer; OPL, outer plexiform layer; INL, inner nuclear layer; IPL, inner plexiform layer; GCL, ganglion cell layer.
Since the synaptic layers of the retina appeared to be generally unaltered, we further investigated whether synapse formation was affected by the RIBEYE KO. To study synapses in the outer plexiform layer, we labeled presynaptic photoreceptor terminals with antibodies to PSD95 (which is presynaptic in photoreceptor terminals; Koulen et al, 1998), and postsynaptic specializations in bipolar neurons with antibodies to mGluR6 (Fig 2B, left panels). The RIBEYE KO caused no change in the juxtaposition of PSD95‐labeled presynaptic terminals with mGluR6‐labeled postsynaptic specializations. Next, we examined synapses between bipolar and amacrine cells in the inner plexiform layer. Staining with antibodies to protein kinase Cα (PKCα) filled the entire cytoplasm of bipolar cells, including their branching axons and bulging presynaptic terminals, while staining with antibodies to PSD95 now labeled the postsynaptic side of AII amacrine cells (Fig 2B, right panels). Compared to the relatively big presynaptic terminals of PKCα‐positive bipolar cells, smaller PSD95‐positive postsynaptic sites nicely decorated bipolar cell terminals in wild‐type, RBE WT, and RBE KO retinas. Taken together, these results show that RIBEYE deficiency had no obvious effect on the presence of synapses between photoreceptors and bipolar cells in the outer plexiform layer (OPL) or bipolar cells and amacrine cells in the inner plexiform layer (IPL).
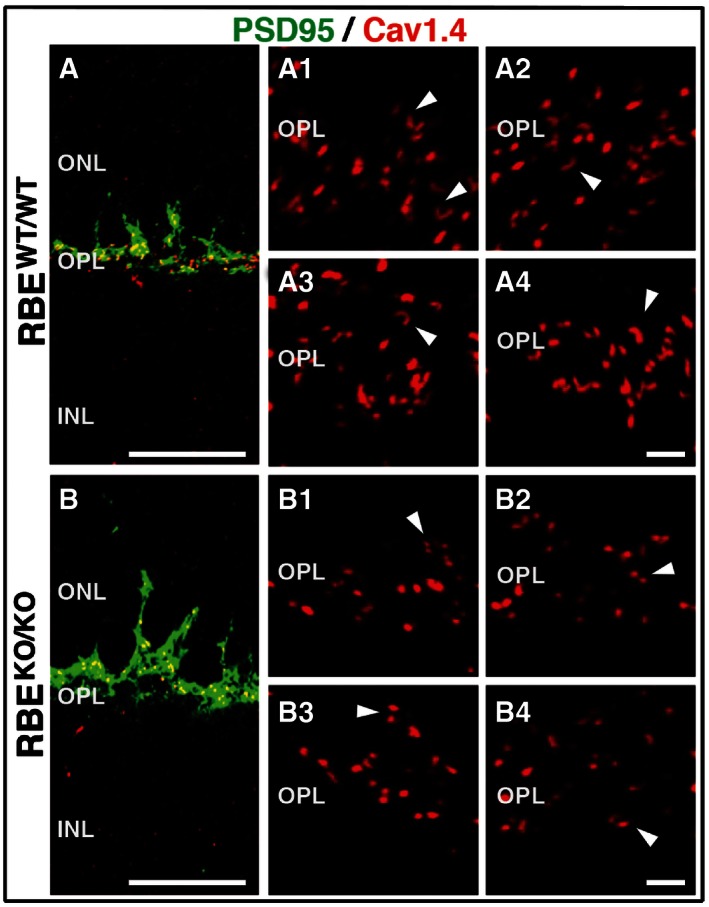
We next examined the effect of the RIBEYE KO on Ca2+ channel (Cav1.4) distribution (Fig 3). In wild‐type photoreceptor synapses, Cav1.4 labeling was present in immediate vicinity to the synaptic ribbon and often produced a similar horseshoe‐shaped pattern (Fig 3A1 to A4). In contrast, in RIBEYE KO photoreceptor synapses Cav1.4 appeared mislocalized or dispersed into smaller clusters (Fig 3B1 to B4).
Figure 3. RIBEYE KO results in altered Cav1.4 localization.
-
A, BDouble immunofluorescence staining of retinas from RBE WT/WT and RBE KO/KO mice, respectively, for PSD95 (green, to label presynaptic photoreceptor terminals) and Cav1.4 (red, to label presynaptic Ca2+ channel). Scale bar: 20 μm; abbreviations: ONL, outer nuclear layer; OPL, outer plexiform layer; INL, inner nuclear layer. Magnified images: Magnification of Cav1.4 staining in the outer plexiform layer (OPL) in the retina of (A1–A4) RBE WT/WT and (B1‐B4) RBE KO/KO mice. White arrowheads indicate Ca2+ channel distribution at selected synapses. Images represent 2‐μm z‐stack projections. Scale bar: 2 μm.
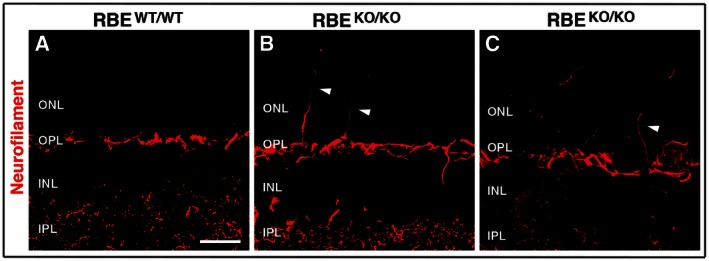
Immunolabeling with anti‐neurofilament antibodies that stain horizontal cell processes in the outer retina (Schmitz et al, 2006) demonstrated discrete sprouting of horizontal cell processes into the outer nuclear layer (ONL) in RIBEYE KO but not control mice (Fig EV4). This finding indicates that some reorganization may take place in the outer retina of RIBEYE KO mice, possibly as a consequence of impaired synaptic signaling at photoreceptor ribbon synapses (see below). The degree of reorganization in the ONL of RIBEYE knockout mice, however, is relatively mild in comparison with mouse models of retinal neurodegeneration (Schmitz et al, 2006).
Figure EV4. Aberrant sprouting of horizontal cell processes in the ONL of RBE KO/KO mice.
-
ARepresentative immunofluorescence staining of neurofilament (red) in the OPL and IPL of retinas in RBE WT/WT. Scale bar: 2 μm.
-
B, CExamples of aberrant processes of horizontal cells sprouting into the ONL of RBE KO/KO mice (white arrowheads). Images are 4‐μm z‐stack projections.
RIBEYE KO causes loss of synaptic ribbons in retina
An ultrastructural hallmark of cone and rod photoreceptor synapses is the synaptic ribbon. Since its initial characterization, the uniform labeling of entire ribbons by immuno‐electron microscopy (immuno‐EM) for RIBEYE had suggested that RIBEYE may form the matrix of the ribbon (Schmitz et al, 2000). This hypothesis predicts that RIBEYE is essential for synaptic ribbons. Thus, to test this hypothesis, we examined photoreceptor synapses of wild‐type and RIBEYE KO mice by EM (Fig 4A).
Figure 4. Electron microscopy (EM) shows that RIBEYE KO abolishes synaptic ribbons in retinal synapses formed by photoreceptor and bipolar cells.
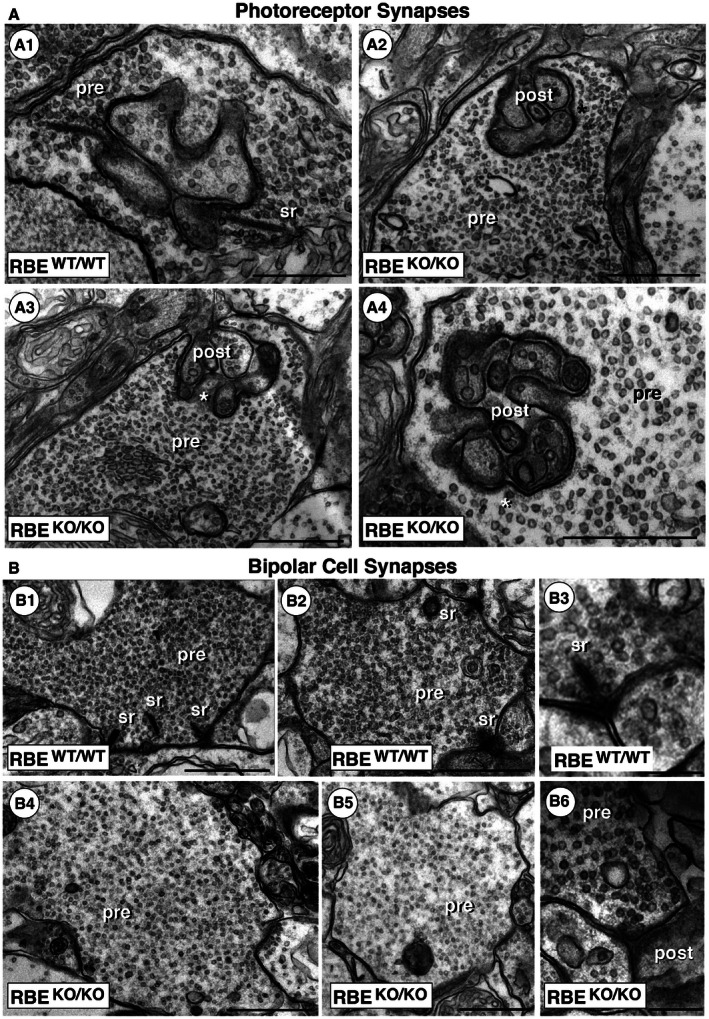
- Transmission EM demonstrates the absence of synaptic ribbons in presynaptic terminals of photoreceptor ribbon synapses in RBE KO/KO mice, while synaptic ribbons are readily visible in the terminals of RBE WT/WT mice. Asterisks in (A2) and (A3) denote photoreceptor active zones of RBE KO/KO mice in which the synaptic ribbon is absent. Except for the absence of synaptic ribbons, the ultrastructural appearance of the presynaptic terminals is comparable to that of RBE WT/WT mice. Abbreviations: sr, synaptic ribbon; pre, presynaptic; post, postsynaptic. Scale bars: 500 nm.
- Transmission EM demonstrates the absence of synaptic ribbons in presynaptic terminals of bipolar cell ribbon synapses in RBE KO/KO mice, while synaptic ribbons are readily visible in the terminals of RBE WT/WT mice. Except for the absence of synaptic ribbons, the ultrastructural appearance of the presynaptic terminals is comparable to RBE WT/WT mice. Abbreviations are the same as in (A). Scale bars: 1 μm (B1, B2, B4, B5); 300 nm (B3, B6).
Whereas in control mice synaptic ribbons were observed as expected in all photoreceptor synapses, synaptic ribbons were entirely absent in all RIBEYE KO photoreceptor terminals analyzed (Fig 4A). Synaptic ribbons were not only missing from synaptic junctions, but also absent from the entire presynaptic cytosol—no “floating” ribbons were detected that are observed with multiple other mutations in synaptic genes (Libby et al, 1999; Allwardt et al, 2001; Dick et al, 2003; Van Epps et al, 2004; Reim et al, 2009; Xu et al, 2012; Soto et al, 2013). Thus, RIBEYE is essential for the very formation of synaptic ribbons in photoreceptor synapses.
We next examined whether synaptic ribbons were present in bipolar cell synapses (Fig 4B). Although rod bipolar cell synapses contain ribbons similar to photoreceptor synapses, rod bipolar cell synapses include only a single postsynaptic cell type (amacrine cells) that is generally associated with multiple presynaptic ribbons in close proximity (Fig 4B1 and B2). Again, we observed that the RIBEYE KO completely eliminated all synaptic ribbons not only from the synaptic contacts, but also from the presynaptic cytosol (Fig 4B3 to B5). In randomly selected synaptic terminals of 90 rod bipolar cells, we did not observe a single ribbon in RIBEYE KO terminals. In contrast, we detected synaptic ribbons in 88 of 90 randomly selected wild‐type terminals. These data confirm that RIBEYE is essential for synaptic ribbons in retina synapses.
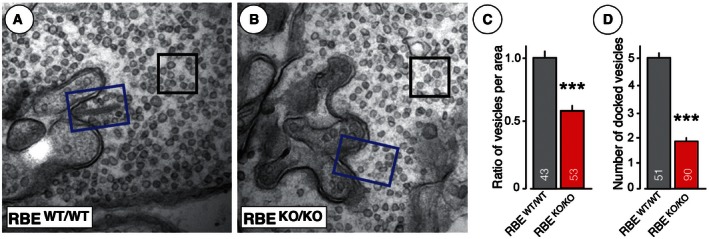
It has been proposed that synaptic ribbons serve to facilitate tonic exocytosis of neurotransmitters and could be considered a molecular scaffold for readily releasable vesicles (Heidelberger et al, 2005; Matthews & Fuchs, 2010; Mercer & Thoreson, 2011). This hypothesis implies that the deletion of RIBEYE and consequently of synaptic ribbons should decrease the number of vesicles close to synaptic junctions. To test this prediction, we determined the density of synaptic vesicles in two areas of presynaptic photoreceptor terminals: vesicles close to the synaptic junction which likely represent readily releasable vesicles and vesicles in the cytosol away from the synaptic junction which likely represent “reserve” vesicles (Fig 5A and B). We found that the RIBEYE KO did not alter the “reserve” vesicle density in the cytosol, but significantly reduced the density of vesicles at synaptic junctions (~41%; Figs 5C and EV5). In line with this observation, we saw an approximately threefold reduction of the number of docked vesicles. Specifically, we observed ~4.9 docked vesicles per synapse in wild‐type photoreceptor terminals vs. ~1.75 docked vesicles per synapse in RIBEYE KO terminals (Fig 5D). This result strongly supports the hypothesis that synaptic ribbons normally recruit synaptic vesicles to the active zone.
Figure 5. RIBEYE KO causes a loss of synaptic vesicles in the vicinity of the active zone of photoreceptor ribbon synapses.
-
A, BRepresentative transmission EM pictures of RBE WT/WT (A) and RBE KO/KO (B) photoreceptor ribbon synapses (blue rectangles, area adjacent to synaptic junction used for measuring junction‐associated vesicle density [size = 200 nm × 300 nm]; black squares, area in the presynaptic cytosol used to measure cytosolic synaptic vesicles [size = 200 nm × 200 nm]).
-
CAverage vesicle ratio expressed as vesicle numbers in the area adjacent to synaptic junctions (blue rectangle) or the cytosol (black square) normalized to RBE WT/WT.
-
DAverage number of docked vesicles within a 150‐nm range in the vicinity of the active zone.
Figure EV5. RIBEYE KO causes a loss of synaptic vesicles.
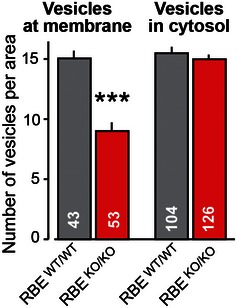
Average vesicle density (expressed as vesicle numbers per rectangle or square, respectively, see Fig 5A and B) in the area adjacent to synaptic junctions or the cytosol. Statistical analyses were performed using Student's t‐test; data are presented as mean ± SEM (***P < 0.001; numbers of analyzed synapses are indicated in the bars).
RIBEYE KO severely impairs evoked neurotransmitter release at rod bipolar neuron/AII amacrine cell synapses
Synaptic ribbons are thought to perform an essential role in rapid sustained synaptic transmission at ribbon synapses by enabling the fast and continuous supply of synaptic vesicles for release (Matthews & Fuchs, 2010; Snellman et al, 2011). However, previously it had not been possible to test this role directly because no mutation was available that eliminated synaptic ribbons without affecting the synaptic vesicle fusion machinery. With the RIBEYE KO mice, we now can explore how neurotransmitter release is altered at a “ribbon” synapse without ribbons.
To this end, we performed paired whole‐cell voltage‐clamp recordings of rod bipolar and AII amacrine cells in acute retina slices from wild‐type and RIBEYE KO mice. Synaptic connections between rod bipolar and AII amacrine cells are well characterized and represent an excellent experimental preparation to study the physiology of ribbon synapses (Singer & Diamond, 2003; Oesch & Diamond, 2011; Snellman et al, 2011). AII amacrine cells were patched first and displayed characteristically high rates of miniature excitatory postsynaptic currents (mEPSCs; Singer & Diamond, 2003; Veruki et al, 2003). After achieving stable mEPSC recordings for 2–3 min, a potentially connected rod bipolar cell was identified near the recorded AII amacrine cell, patched and tested for connectivity by evoking excitatory postsynaptic currents (EPSCs) via presynaptic depolarizations. Only pairs of connected rod bipolar and AII amacrine cells that exhibited stable fast EPSCs during repeated trials were included for analysis. Note that this recording strategy excludes synapses that are very weak. Thus, this strategy underestimates the phenotype since synaptic pairs in RIBEYE KO mice with dramatically reduced synaptic transmission would be overlooked.
To induce neurotransmitter release at rod bipolar/AII cell synapses, we depolarized presynaptic rod bipolar cells for 500 ms from a holding membrane potential of −70 to −10 mV and held the postsynaptic AII amacrine cell at −70 mV (Fig 6A; Luo et al, 2015). The presynaptic depolarization opens L‐type voltage‐gated Ca2+ channels whose currents can be readily measured, and which are located exclusively at the nerve terminals of rod bipolar cells (Protti & Llano, 1998). Therefore, Ca2+‐currents recorded by the patch pipette in the rod bipolar cell soma primarily reflect Ca2+‐influx into presynaptic terminals. Interestingly, the amplitude and density of presynaptic Ca2+‐currents were unchanged in RIBEYE KO rod bipolar cells, suggesting that the RIBEYE KO does not impair Ca2+ channel function as such (Fig 6B).
Figure 6. RIBEYE KO severely impairs neurotransmitter release at bipolar cell/AII amacrine cell synapses as monitored by paired recordings in acute retina slices.
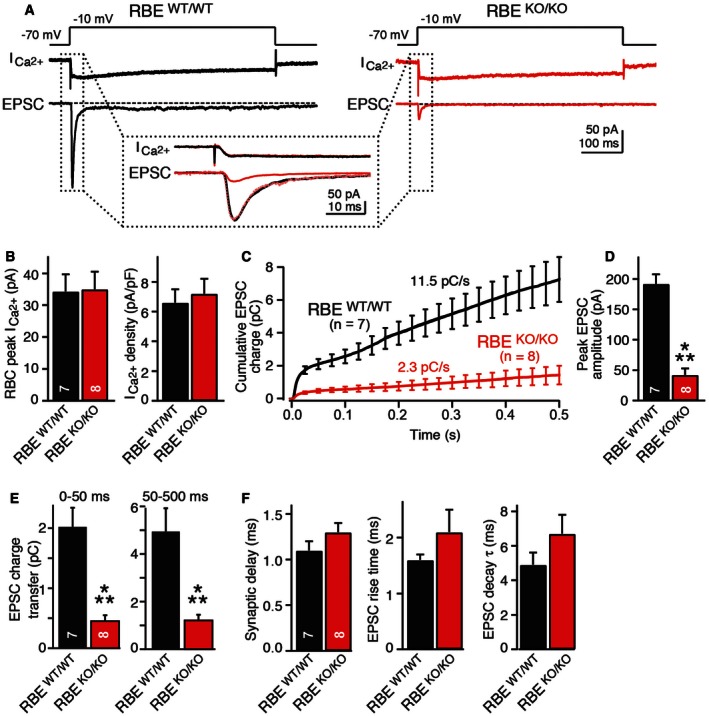
- Experimental design and representative traces for analysis of synaptic transmission in retinas from wild‐type (black) and RIBEYE KO mice (red). Presynaptic bipolar neurons were depolarized in voltage‐clamp mode from −70 to −10 mV for 0.5 s as indicated on top to open Ca2+ channels and trigger release. Presynaptic Ca2+‐currents and postsynaptic EPSCs were measured simultaneously as indicated in the traces; dotted box displays an expansion of the initial Ca2+‐currents and EPSCs.
- RIBEYE KO does not alter presynaptic Ca2+‐currents. Summary graphs show average peak Ca2+‐currents and Ca2+‐current.
- RIBEYE KO severely impairs EPSCs triggered by presynaptic depolarization. Plot shows integrated EPSC charge as a function of time; both initial and sustained neurotransmitter releases are impaired.
- RIBEYE KO strongly reduces initial synchronous release induced by presynaptic depolarization as indicated by the summary graph of the peak EPSC amplitude.
- RIBEYE KO suppresses both the initial synchronous and the sustained phase of release induced by presynaptic depolarization. Summary graphs display integrated EPSC charges for the initial phase (0–50 ms) and the sustained phase (50–500 ms).
- RIBEYE KO does not alter the kinetics of EPSCs. Summary graphs depict the mean synaptic delays (left), rise times (center), and decay time constants (right) of EPSCs.
Consistent with previous reports (Singer & Diamond, 2003; Oesch & Diamond, 2011), the sustained Ca2+‐influx induced by the depolarization of rod bipolar cells triggered a large and fast transient EPSC in AII amacrine cells from wild‐type mice, followed by a smaller sustained EPSC (Fig 6A and C). The transient EPSC is likely caused by rapid exocytosis of vesicles that are primed in the readily releasable pool, whereas the sustained EPSC derives from exocytosis of vesicles that are being replenished during prolonged depolarization and are thought to be rapidly delivered to the release sites by sliding down the synaptic ribbons (Oesch & Diamond, 2011). The RIBEYE KO greatly decreased not only the transient, but also the sustained EPSC, reducing both to ~20% (Fig 6D and E). Thus, RIBEYE and synaptic ribbons likely perform a critical function in organizing fast and sustained synaptic vesicle exocytosis at ribbon synapse. It is of interest to note here that we found no changes in release kinetics or synaptic delay (Fig 6F). In addition, no changes in input resistance and membrane capacitance of AII amacrine cells were observed (Fig EV6). These results, together with the lack of a change in Ca2+‐currents, suggest that ablation of synaptic ribbons by the RIBEYE KO caused a loss of all forms of fast neurotransmitter release, affirming the hypothesis that synaptic ribbons organize fast release reactions (Oesch & Diamond, 2011; Snellman et al, 2011).
Figure EV6. Capacitance and input resistance values of patched retinal AII amacrine cells.
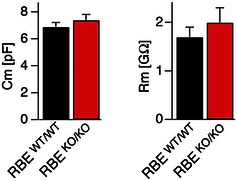
Neuronal capacitance (left) and input resistance (right) recorded from AII amacrine cells of RBE WT/WT and RBE KO/KO mice. Data are presented as mean ± SEM; numbers of cells analyzed are the same as for Fig 6. No statistical significance was observed between wild‐type and KO cells as assessed by Student's t‐test.
Spontaneous neurotransmitter release persists in ribbon‐less synapses but is disconnected from Ca2+‐influx sites
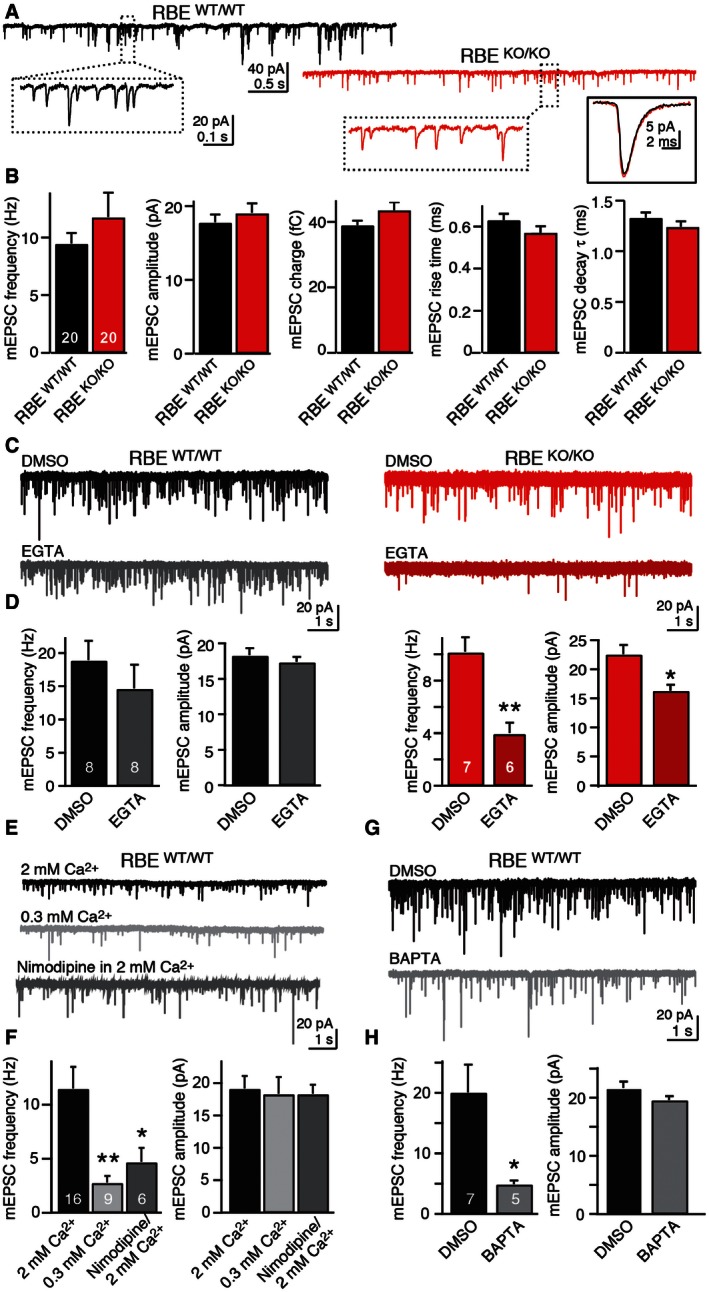
Synaptically connected neurons typically display miniature synaptic events produced by spontaneous release of neurotransmitter quanta from presynaptic terminals (Truckenbrodt & Rizzoli, 2014; Kaeser & Regehr, 2014; Kavalali, 2015). In AII amacrine cells, spontaneous glutamate release from presynaptic rod bipolar cells (manifesting as mEPSCs in postsynaptic AII amacrine cells) exhibits features similar to spontaneous release in other neurons, although the frequency of mEPSCs is higher than that observed in most neurons (Singer & Diamond, 2003; Veruki et al, 2003). Different from evoked EPSCs, however, we detected no significant impairment in spontaneous mEPSCs in AII amacrine cells in RIBEYE KO mice, with no changes in the mESPC frequency, amplitude, or kinetic properties (Fig 7A and B).
Figure 7. RIBEYE KO alters the sensitivity of spontaneous mEPSCs to a slow Ca2+‐buffer at bipolar cell/AII amacrine cell synapses.
-
ARepresentative mEPSCs recorded from AII cells in wild‐type (black) and RIBEYE KO mice (red). The insets in dashed boxes show mEPSCs on expanded scales, while the inset in a continuous box on the right shows the averaged mEPSC waveforms (average of 100–200 isolated mini events) of the example cells. Calibration bars apply to wild‐type and mutant EPSCs.
-
BRIBEYE KO does not alter fundamental parameters of mEPSCs. Summary graphs show mean mEPSC frequency, amplitude, integrated charge, rise time, and decay time constant. Note that the only excitatory inputs into AII amacrine cells are provided by bipolar cell synapses.
-
C, DRIBEYE KO renders mEPSCs sensitive to the slow Ca2+‐buffer EGTA (C, representative mEPSCs traces recorded from AII cells after 30‐min incubation in DMSO or EGTA‐AM [0.2 mM]; D, summary graphs of the mean mEPSC frequency (left) and amplitude (right) after incubation in DMSO or EGTA‐AM).
-
E, FmEPSCs in AII amacrine cells are largely triggered by Ca2+‐influx via presynaptic L‐type Ca2+ channels (E, representative mEPSCs traces recorded in regular [2 mM] or reduced extracellular Ca2+‐concentration [0.3 mM], or in the presence of nimodipine [50 μM] in regular Ca2+; F, summary graphs of the mean mEPSC frequency and amplitude under the conditions described for E).
-
G, HmEPSCs in AII amacrine cells are suppressed by the fast Ca2+‐buffer BAPTA (G, representative mEPSCs traces recorded after 30 min incubation with DMSO or BAPTA‐AM [30 μM]; H, summary graphs of the mean mEPSC frequency and amplitude under the conditions described for G).
This observation suggests that synaptic vesicle fusion overall proceeds normally in RIBEYE KO rod bipolar cells, but does not rule out the possibility that the underlying mechanisms for spontaneous release may differ. To explore this possibility, we incubated acute retina slices in 200 μM EGTA‐AM for 30 min. Strikingly, we found that EGTA‐AM treatment, when compared to control incubations with 0.1% DMSO, had no significant effect on mEPSC frequency or amplitude in wild‐type AII amacrine cells. In RIBEYE KO AII amacrine cells, however, EGTA‐AM caused a dramatic decline in mEPSC frequency (~44%) and additionally induced a significant decrease in mEPSC amplitude (~25%; Fig 7C and D).
Most spontaneous release is induced by Ca2+, either stochastically by resting Ca2+‐levels or by random openings of plasma membrane or ER Ca2+ channels (Xu et al, 2009). The differential effect of EGTA on mEPSCs in wild‐type and RIBEYE KO AII amacrine cells could plausibly be explained by the hypothesis that in wild‐type rod bipolar cells, spontaneous release is induced by stochastic L‐type Ca2+ channel opening, and that in the RIBEYE KO, the distance of the Ca2+ channels to release sites is increased. This hypothesis would account for the relatively high mEPSC frequency in AII amacrine cells since classical chemical synapses with lower mEPSC frequencies use other types of Ca2+ channels. Moreover, this hypothesis implies that in wild‐type rod bipolar cells, spontaneous release involves Ca2+‐influx from the extracellular space, and would predict that mEPSCs should be suppressed in wild‐type synapses by decreasing the extracellular Ca2+‐concentration or by blocking L‐type Ca2+ channels (which are responsible for release in rod bipolar cells as discussed above; Tachibana et al, 1993).
To test these predictions, we measured mEPSCs in wild‐type synapses after either lowering the extracellular Ca2+‐concentration or blocking L‐type Ca2+ channels with nimodipine (Fig 7E and F). We found that both treatments strongly decreased the mEPSC frequency in wild‐type AII amacrine cells. Moreover, we tested application of BAPTA‐AM, a membrane‐permeable Ca2+‐chelator that exhibits much faster binding kinetics than EGTA. We also observed a large decrease in mEPSC frequency in wild‐type synapses after BAPTA‐AM treatments (Fig 7G and H). These results strongly suggest that spontaneous miniature release from presynaptic rod bipolar cells, monitored as mEPSCs in postsynaptic AII amacrine cells, is normally controlled by tightly coupled Ca2+‐influx through voltage‐gated Ca2+ channels adjacent to synaptic ribbons, and that this tight coupling is impaired in RIBEYE KO mice.
Discussion
Synaptic ribbons constitute a defining feature of sensory synapses in the auditory and visual system. Previous studies showed that synaptic ribbons contain large amounts of a unique scaffolding protein called RIBEYE that constitutes the only known ribbon‐specific protein and that synaptic ribbons are important for fast sustained release from sensory synapses. However, the function of RIBEYE in ribbon synapses and the role of synaptic ribbons in neurotransmitter release are incompletely understood. In the present study, we generated KI mice that express from the endogenous RIBEYE promoter a fusion protein of the N‐terminal RIBEYE‐specific A‐domain with the genetically encoded Ca2+‐indicator GCamP3 as a reporter of RIBEYE expression, and KO mice that lack RIBEYE because they contain a deletion of the RIBEYE‐specific A‐domain. Using these mice, we examined the expression of RIBEYE in the retina, tested the effect of the RIBEYE KO on synaptic ribbons and ribbon synapses, and explored the role of RIBEYE and synaptic ribbons in neurotransmitter release. Our results suggest that synaptic ribbons are assembled from RIBEYE and that RIBEYE (and thus synaptic ribbons) are essential for normal evoked neurotransmitter release at sensory synapses. Mechanistically, our results are best accounted for by the hypothesis that self‐assembly of RIBEYE into ribbons is responsible for ribbon formation, and that RIBEYE‐dependent protein–protein interactions then mediate rapid vesicle delivery to the presynaptic active zone and organize nano‐domain coupling of L‐type Ca2+ channels to release‐ready vesicles.
RIBEYE as the central building block of synaptic ribbons
Arguably the most striking result of our experiments is the finding that the RIBEYE KO abolishes all synaptic ribbons as analyzed by EM (Fig 4). Although several genetic manipulations have dislodged synaptic ribbons from synaptic junctions and produced “floating ribbons” (Libby et al, 1999; Allwardt et al, 2001; Van Epps et al, 2004; tom Dieck et al, 2005; Reim et al, 2009; Xu et al, 2012; Soto et al, 2013), no previous genetic manipulation has actually ablated synaptic ribbons. Our data show that RIBEYE is essential for synaptic ribbons as such, and support the notion that RIBEYE assembly into large multimers generates synaptic ribbons (Schmitz et al, 2000; Magupalli et al, 2008). These results are consistent with a parsimonious model of synaptic ribbons whereby the ribbons simply result from the self‐assembly of RIBEYE multimers that are then decorated on the surface by specific binding proteins which in turn recruit synaptic vesicles. This simple model posits that the core of synaptic ribbons is only composed of RIBEYE, although it is possible that other, as yet unidentified ribbon‐specific components contribute to the formation of synaptic ribbons. An alternative model for RIBEYE function that would account for its essential role in synaptic ribbon formation would be that RIBEYE catalyzes the assembly of synaptic ribbons from other, possibly cytoskeletal proteins. However, this alternative model is improbable because RIBEYE antibodies decorate the entire synaptic ribbon, and a large number of RIBEYE molecules were shown to be associated with synaptic ribbons (Schmitz et al, 2000; Zenisek et al, 2004).
Synaptic ribbons orchestrate nano‐domain coupling of L‐type Ca2+ channels to rapid vesicle delivery at the active zone of sensory synapses
Previously available model systems used to study ribbon function, such as photo‐ablation of synaptic ribbons (Snellman et al, 2011), bassoon KO mice with non‐anchored “floating” ribbons (Buran et al, 2010; Frank et al, 2010), and hibernating ground squirrels whose retinas exhibit a strong reduction in the number of synaptic ribbons (Mehta et al, 2013), suggested an important role for synaptic ribbons in synaptic transmission. Similarly, nrc mutants in zebrafish with gene defects in synaptojanin displayed defects in vision and a loss of ribbons (Allwardt et al, 2001; Van Epps et al, 2004), and animals with diurnal changes of synaptic ribbon number show strong differences in visual performance (Hull et al, 2006). However, the specific contribution of ribbons and RIBEYE to synaptic transmission remained unclear because the synaptic ribbon could not be selectively targeted in these experiments, specific ablation of ribbons was not possible, and additional effects could have contributed to the observed phenotypes.
Our paired recordings from rod bipolar/AII amacrine cell synapses of RIBEYE KO mice demonstrate that RIBEYE and synaptic ribbons are essential for both fast phasic and sustained neurotransmitter release from ribbon synapses, but are not required for synaptic vesicle fusion itself (Fig 6). The latter conclusion is also supported by the fact that under control conditions, spontaneous fusion events are normal in RIBEYE‐deficient bipolar neuron synapses (Fig 7). Moreover, our EM results demonstrated that the RIBEYE KO leads to a redistribution of synaptic vesicles away from synaptic junctions, supporting a role for RIBEYE and synaptic ribbons upstream of fusion (Fig 5). Thus, consistent with earlier studies (Heidelberger et al, 2005; Matthews & Fuchs, 2010), our data suggest that synaptic ribbons organize the rapid supply of synaptic vesicles at the active zone and allow continuous and fast but graded release of neurotransmitters from ribbon synapses in sensory neurons.
The fact that spontaneous release under control conditions is not affected by the RIBEYE KO, whereas evoked release is almost eliminated, agrees well with the notion that these two types of release are mechanistically different (Kaeser & Regehr, 2014; Truckenbrodt & Rizzoli, 2014; Kavalali, 2015). Ribbon synapses utilize L‐type Ca2+ channels to mediate depolarization‐dependent Ca2+‐influx into presynaptic terminals (Heidelberger et al, 2005). The L‐type Ca2+ channels are localized at the point where the synaptic ribbon contacts the active zone (Zenisek et al, 2003; tom Dieck et al, 2005), and vesicle release is tightly coupled to presynaptic Ca2+ channel opening in presynaptic terminals of rod bipolar cells (Jarsky et al, 2010). We found that although spontaneous mEPSCs produced by ribbon synapses were normal in RIBEYE KO retina under control conditions, EGTA‐AM selectively suppressed mEPSCs in RIBEYE KO but not wild‐type synapses (Fig 7). A plausible explanation for this observation is that mEPSCs in rod bipolar cell synapses are mediated by stochastic opening of Ca2+ channels at the active zone, and that because of the localization of these Ca2+ channels at release sites, they are tightly coupled (“nano‐domain coupling”) to synaptic vesicle exocytosis. In RIBEYE KO synapses, such coupling is presumably lost because synaptic ribbons are ablated. Consistent with this hypothesis, we observed that mEPSCs in wild‐type synapses are decreased by the fast Ca2+‐chelator BAPTA‐AM even though they are not affected by the slow Ca2+‐chelator EGTA. Moreover, we found that mEPSCs in wild‐type synapses are suppressed by decreasing the external Ca2+‐concentration or by addition of the L‐type Ca2+ channel antagonist nimodipine.
Viewed together, these observations indicate that wild‐type rod bipolar cell synapses exhibit a high rate of spontaneous release because stochastic Ca2+ channel opening triggers exocytosis of vesicles in a ribbon‐independent manner and that the deletion of ribbons in RIBEYE KO mice causes no change in this process as such, but increases the distance of Ca2+ channels to the vesicles that are spontaneously released (which are likely different from those subject to evoked release). Thus, the RIBEYE KO appears to impair nano‐domain coupling of L‐type Ca2+ channels to exocytosis at least for spontaneously released vesicles, presumably by ablating the normal ribbon‐based mechanism that concentrates release‐ready vesicles and Ca2+ channels at the active zone, as also supported by immunocytochemical localization of Ca2+ channels (Fig 3). This conclusion is consistent with previous analyses of bassoon KO mice which contain non‐anchored, “floating” ribbons and of RIBEYE knockdown and overexpression experiments in zebrafish that also suggested a close spatial relation between synaptic ribbons and presynaptic voltage‐gated Ca2+ channels in afferent inner hair cell ribbon synapses (Frank et al, 2010; Sheets et al, 2011, 2012).
Outlook
Our data provide the first direct evidence for the hypothesis that synaptic ribbons are primarily assembled from RIBEYE molecules and that synaptic ribbons function as organizers for rapid and sustained synaptic vesicle exocytosis. Moreover, our data show that the relatively high rate of spontaneous exocytosis in wild‐type synapses depends on the localization of L‐type Ca2+ channels at the active zone and that RIBEYE and synaptic ribbons are not required for spontaneous synaptic vesicle exocytosis but for the nano‐domain coupling of Ca2+ channels to vesicles undergoing spontaneous exocytosis. The key challenges now will be to precisely map the atomic nature of RIBEYE complexes in synaptic ribbons and their mechanisms of action. The availability of the mice we report here will help in meeting these exciting challenges.
Material and Methods
Generation of RIBEYE mutant mice
Generation of RIBEYE KI GCamP3 (RBE KI+neo allele)‐mutated mice was performed using standard procedures. Briefly, the alternative exon 1b of the mouse CtBP2 gene comprising the A‐domain of the CtBP2 splice version RIBEYE was fused in frame with a cDNA encoding for the Ca2+‐indicator GCamP3 (Tian et al, 2009). The coding sequence (~3 kb) for the chimeric protein RIB‐G3 (A‐domain/GCamP3) was flanked downstream by a ~600‐base‐long WPRE sequence (woodchuck hepatitis virus, WHP, posttranscriptional regulatory element) allowing for posttranscriptional stabilization of the mRNA transcript (Lee et al, 2005) and a ~1.8‐kilobase (kb)‐large frt/site‐flanked neomycin selection cassette under control of the phosphoglycerate (PGK) promoter. About 1 kb upstream of the start codon and immediately 3 prime of the selection cassette, we introduced loxP recombination sites to allow for Cre/loxP‐mediated deletion of RIB‐G3. The loxP sites have been flanked with 3.1 kb (5′) and 4.2 kb (3′) homology regions to allow for homologous recombination into a 129S6xC57BL/6J hybrid mouse embryonic stem cell line. Gene targeting was performed by Dr. C. Guo in the Transgenic Facility at Janelia Farms HHMI Campus, Ashburn, VA, USA.
Our targeting strategy aimed to generate mice in which the RIB‐G3 fusion protein is expressed constitutively (RBE KI allele) under the control of the endogenous RIBEYE promoter. By further breeding to mice expressing Cre‐recombinase, the loxP‐site‐flanked chimeric gene will be deleted to generate mice in which the fusion protein is absent (RBE KO allele) but allowing the transcription of endogenous CtBP2. The original mouse line (RBE KI+neo allele) has been submitted to the Jackson Laboratory Mouse Repository for distribution (JAX Stock number: 023399).
Positive homologous recombination and recombination after breeding to Flp‐deleter (Rodríguez et al, 2000) and CMV‐Cre‐deleter mice (Schwenk et al, 1995) have been confirmed by Southern blotting and PCR. The mice were backcrossed with C57BL/6 mice for 5 generations. The following oligo combinations were used to test for the presence of different allelic combinations (amplicon size): MX11611/626 RBE WT (237 bp) and RBE KI (331 bp), MX11611/612 RBE KO (412 bp). Southern blot probes have been generated by PCR using the following oligo combinations: MX08166/167 (5′), MX09422/423 (3′), and MX10508/509 (Venus, nearly identical to parts of GCamP3). All oligos have been purchased from IDT (Integrated DNA Technologies). A detailed list can be found in Table EV1.
We generated homozygous lines for both alleles to facilitate maintenance of mutated lines. Mice were weaned at 21 days of age and housed in groups of 2–5 on a 12‐h light/dark cycle with food and water ad libitum. All animal procedures conformed to National Institutes of Health Guidelines for the Care and Use of Laboratory Animals and were approved by the Stanford University Administrative Panel on Laboratory Animal Care (IACUC committee). Homburg Animal Housing Facility: All animal procedures with mice housed at the University of Saarland, Germany, were performed in accordance with German legislation on the protection of animals and approved by the Saarland's Institutional Animal Care and Use Committee.
Electrophysiological analyses and immunofluorescence analyses were performed by a “blinded” experimenter without information about genotypes; all other experiments were performed on samples with known genotypes. Due to our breeding strategy that was based on the use of heterozygous parents to transmit the mutated alleles, we statistically generated in average one or two mice within any litter that were either homozygous wild‐type or homozygous RIBEYE KO mice. In experiments that used four or more mice per genotype, such as qRT–PCR, quantitative immunoblotting, and electrophysiology, we used mice of either genotype and sex of closely related litters that had been born at about the same time. We assured close relationships by using sisters that were set up in harem breedings resulting in litters with the same father. For qualitative comparisons such as immunofluorescence analyses and EM, we compared at least three mice per group and genotype for any given experiment. During the course of these analyses, we assured that any staining procedure had always been performed on sets of wild‐type and KO mice that were from the same litter.
qRT–PCR analysis
For qRT–PCR analysis pairs of retinas and brains of adult, age‐matched mice (n = 4 per group) have been dissected and immediately collected in TRIzol reagent (Invitrogen). Brain RNA was isolated according to manufacturer's protocol (Invitrogen). Due to small tissue volume RNA from retina was isolated using the Direct‐zol™ RNA MiniPrep kit (Zymo Research). RNA concentration was quantified using a ND‐1000 spectrophotometer (NanoDrop, ThermoScientific). Brain RNA was diluted to 100 ng/μl, and RNA isolated from retina generally had a yield in the order of 100 ng/μl and was used as is in their respective amount as isolated. Transcript levels of genes of interest were determined using 1 μl of respective RNA sample, 1 μl of 20× FAM‐dye‐coupled detection assays, 8 μl RNase‐free H2O, and 10 μl of 2× VeriQuest Probe one‐step qRT–PCR master mix with ROX dye (Affymetrix Inc.). All detection assays have been purchased from IDT (Coralville, IO, USA) except for mouse ACTB (4352933E, Applied Biosystems). Each sample was loaded in triplicate onto an ABI7900 fast RT–PCR machine (Applied Biosystems). Temperature protocol and data collection were performed as has been described previously (Boucard et al, 2014). The following assays (IDT) have been used to determine transcript levels of the respective genes: Piccolo (Mm.PT.56a.6138490), RIM1 (Rims1, Mm.PT.51.6225614.g), RIM2 (Rims2, Mm.PT.56a.13225980.g), RIM‐BP1 (Bzrap1, Mm.PT.51.10894886.g), RIM‐BP2 (Mm.PT.51.12905703), Cacna1f (Mm.PT.56a.13034178), and Cacnb2 (Mm.PT.56a.8071914); sequences of custom assays for Bassoon, RIBEYE, and CtBP2 (all isoforms) can be found in Table EV2.
Immunoblotting
Protein analysis was performed as described previously (Kaeser et al, 2011). Pairs of retinas of adult, age‐matched mice (n = 4 per group) were transferred to test tubes and solubilized in 200 μl PBS supplemented with protease inhibitor cocktail, Complete® (Roche Diagnostics) by sonification. Cell debris was collected by a short spin at 2,650 g for 30 s at 4°C and supernatant was removed and supplemented with loading buffer for SDS‐gel electrophoresis with a final concentration of 1 μg/μl. A total of 15 μg per sample of either RBE WT/WT or RBE KO/KO retinas were separated on a SDS‐gel. Gel concentration was adjusted depending on protein sizes that needed to be detected. Protein on gels were blotted onto nitrocellulose membranes (Protran 0.45 μm, GE Healthcare) and incubated for 1 h in blocking solution containing 5% (wt/vol) milk powder in TBST (0.05 mM Tris, 0.150 mM NaCl, 0.05% (vol/vol) Tween‐20, pH 7.6). Primary antibody was added at respective dilution to the blocking solution and incubated overnight under gentle agitation. After three washes for 5 min in TBST blots where incubated in blocking solution containing the secondary antibody and incubated for further 2 h. When testing for Cav1.4 and mGluR6 expression, we prepared a membrane‐enriched fraction from both retinas per mouse and genotype and analyzed their protein composition by SDS–PAGE (for details see Grabner et al, 2015). Subsequent immunoblotting experiments were essentially performed as described above but using PBS instead of TBST. All blots that were quantified using the LI‐COR System were washed three times for 5 min in TBST or PBS, respectively, and then scanned with an Odyssey Infrared Imager and Odyssey software (LI‐COR Biosciences). Analysis of intensities of protein bands was performed using Fiji (ImageJ, NIH), and statistical differences were assessed using a two‐tailed Student's t‐test. Blots that were used for ECL detection were incubated in Amersham ECL (GE Healthcare) according to manufacturer's protocol.
Transmission electron microscopy
Transmission electron microscopy was performed largely as previously described (Katiyar et al, 2015). In brief, posterior eyecups were dissected from isolated mouse eyes within 5 min postmortem. Lens and vitreous body were removed from the eyecups to promote optimal access of the fixative to the retina. The dissected posterior eyecups were fixed with 4% (wt/vol) paraformaldehyde (in PBS) and 2.5% (vol/vol) glutaraldehyde (in PBS) (12 h each, at 4°C). Samples were equilibrated with 100 mM cacodylate buffer and osmicated with 1% (wt/vol) OsO4, 1.5% (wt/vol) K4[Fe(CN)6] × 3H2O in 100 mM cacodylate buffer for 1 h at 4°C. After several washes with buffer, samples were treated with 2% (wt/vol) uranylacetate (UA) in 50 mM Na‐maleate buffer (pH 5.0) for 3 h at 4°C. UA‐treated samples were dehydrated in an ascending concentration series of ethanol and were finally equilibrated with pure acetone (20 min each ethanol/acetone step, at RT). Acetone was gradually replaced by Epon resin using acetone/Epon mixtures with increasing amounts of Epon (3/1, 1/1, 1/3 (v/v); 3 h each, at RT). After infiltration with pure Epon (for 12 h), Epon was changed twice and left on the samples for 12 h each. Epon‐infiltrated samples were polymerized at 60°C for approximately 36 h.
Immunolabeling of semi‐thin resin sections and cryosections
All immunolabeling experiments on retinal tissue have been performed using 0.5‐μm semi‐thin resin sections unless stated differently. A detailed description of the procedure to generate these resin sections including the preparation and embedding of tissue, the collection of sections using an ultramicrotome, and the removal of Epon from the tissue has been published recently (Wahl et al, 2013). After Epon removal, coverslips with tissue sections were stored in PBS for 30 min before they were incubated with primary antibodies overnight at 4°C in a humidified chamber. Note that immunolabeling of semi‐thin section does not require blocking prior to antibody labeling. On the following day, all sections were washed three times for 10 min with PBS and secondary antibodies were applied for 2 h at room temperature. Excess antibodies were removed by three washes of PBS before the coverslips were mounted on glass slides. For anti‐GFP (RIB‐G3) labeling alternatively cryosections of PFA‐fixed retinas have been used. Shortly, eyes were dissected in ice‐cold PBS and the cornea and lens were removed to allow proper penetration of 4% PFA into the eyecup. Fixation was continued in 4% PFA overnight at 4°C. On the next day, samples were transferred into a 30% (wt/vol) sucrose solution in PBS and incubated overnight to allow for cryoprotection. Samples were mounted in NEG‐50 (Thermo Scientific), and 10‐μm sections were collected on Superfrost slides (Menzel), using a cryostat LC1950 (Leica). Prior to antibody staining, sections were incubated in 4% PFA for 10 min at room temperature, washed three times in PBS (5 min each), and blocked in 0.5% BSA and 0.2% Triton X‐100 for 1 h. Primary and secondary antibodies were diluted in blocking solution. Primary antibody application was performed at 4°C overnight, and secondary antibodies were applied at room temperature for 2 h. Slides were washed in PBS (3 times) in between and after the secondary antibody application before they were mounted and inspected by confocal microscopy.
Microscope image acquisition
Transmission electron microscope images were inspected using a Tecnai 12 Biotwin (FEI) with magnifications ranging between 10,000× and 60,000×, and images of photoreceptor and bipolar cell synapses (Figs 4 and 5A and B) were acquired with a Megaview III digital camera and iTEM acquisition software. Images in Figs 1E and G, 2, 3, EV3 and EV4 were acquired using a Nikon confocal microscope A1R‐MP with an Plan Apo VC 60X/1.40 Oil objective. All fluorochromes are listed in the respective “Antibodies” section. Images have been adjusted for presentation using Adobe Photoshop and Adobe Illustrator CS6 software.
Antibodies
The following primary and secondary antibodies have been used for different applications, such as immunofluorescence analysis (IF) and immunoblotting (IB). The respective dilution, application, species, and source are mentioned in brackets. Asterisks indicate antibodies and respective applications that have been published previously from our laboratories. For commercially available antibodies, the sources and order numbers are mentioned. Primary antibodies: actin (1:4,000 IB, rabbit, Sigma‐Aldrich), Cav1.4 (1:100 IF, mouse, directed against the amino‐terminal 20 amino acids (aa) of mouse Cav1.4 (Cav1.4 KO‐verified in IF), clone 5F6, S. Wahl et al, unpublished), Cav1.4 (1:5,000 IB, rabbit, raised against a GST‐fusion protein encoding aa1–121 of mouse Cav1.4, P. Kumar et al, unpublished), CtBP2 (1:1,000 IF, mouse, 612044, BD Biosciences), dynamin (1:2,000 IB, mouse, 05‐319, Millipore), Elks* (1:1,000 IB, rabbit, P224), GDI (1:3,000 IB, Synaptic Systems), GFP (1:1,000 IF, 1:2,000 IB, rabbit, A‐11122, Invitrogen), fodrin (1:5,000 IB, mouse, MAB1622, Millipore), Liprin3α* (1:5,000 IB, rabbit, 4396), mGluR6 (1:1,000 IF, rabbit, 1205, Katiyar et al, 2015), mGluR6 (1:2,000 IB, rabbit, RA13105, Acris), Munc18 (1:2,000 IB, mouse, clone 31, BD Biosciences), neurofilament NR4 (1:2,000 IF, mouse, N5139, Sigma‐Aldrich), PKCα (1:1,000 IF, mouse, 5704, Sigma‐Aldrich), PSD95 (1:1,000 IF, rabbit, Wahl et al, 2013), PSD95 (1:500 IF, mouse, NeuroMAB clone K28/43), Rab3A/B* (1:1,000 IB, mouse, 42.1), RIBEYE/CtBP2* (1:5,000 IB, rabbit, raised against the B‐domain, U2656), Rim1* (1:2,000 IB, rabbit, R809), SNAP25* (1:2,000 IB, rabbit, 439B), SV2 (1:50 IF, mouse, DSHB), synapsin* (1:1,000 IB, rabbit, E208), synaptobrevin* (1:2,000 IB, rabbit, P939), synaptophysin* (1:5,000 IB, mouse, clone 7.2), synaptotagmin1* (1:2,000 IB, rabbit, V216), tau‐RIBEYE (1:1,000 IF, rabbit, raised against the A‐domain of RIBEYE; K. Schwarz, F. Schmitz, unpublished), VCP* (1:1,000 IB, rabbit, K330). Secondary antibodies: Alexa Fluor® 488 goat anti‐rabbit (1:1,000 IF, A‐11034), Alexa Fluor® 488 chicken anti‐mouse (1:1,000, IF, A‐21200, Invitrogen), Alexa Fluor® 546 donkey anti‐goat (1:1,000 IF, A‐11056, Invitrogen), Alexa Fluor® 568 donkey anti‐rabbit (1:1,000 IF, A‐10042, Invitrogen), AlexaFluor®647 donkey anti‐rabbit (1:1,000 IF, A‐31573, Invitrogen), peroxidase‐coupled goat anti‐rabbit, (1:5,000 IB, MP Biomedicals), and donkey anti‐mouse IRDye 800CW, donkey anti‐rabbit IRDye 800CW, donkey anti‐mouse IRDye 680LT, donkey anti‐rabbit IRDye 680LT (all 1:15,000 IB, LI‐COR Biosciences).
Electrophysiology
All experiments were performed using postnatal days 21–28 old mice, without knowing the genotype. Briefly, either RBE WT/WT or RBE KO/KO mice were light‐adapted, anesthetized with isoflurane (Henry Schein Animal Health), and decapitated immediately. The eyes were enucleated, and the retinas were isolated in oxygenated ACSF (artificial cerebrospinal fluid) containing 119 mM NaCl, 26 mM NaHCO3, 10 mM glucose, 1.25 mM NaH2PO4, 2.5 mM KCl, 2 mM CaCl2, 1 mM MgCl2, 2 mM Na‐pyruvate, and 0.5 mM ascorbic acid. Isolated retinas were embedded in low melting agar (2% (wt/vol) in ACSF with HEPES substituted for NaHCO3), and 200 μm slices from mid‐temporal retina were cut using a Vibratome VT1200s (Leica). Slices were incubated for 1 h at 32°C and then stored at ~22°C for experiments.
Paired whole‐cell patch clamp recordings were made from synaptically connected rod bipolar cells (RBC) and AII amacrine cells (AII), which were visually identified under infrared differential interference contrast (IR‐DIC) video microscopy Axioskop 2 (Zeiss; Singer & Diamond, 2003; Veruki et al, 2003). Patch pipettes of resistance 5–7 MΩ were pulled using borosilicate glass (World Precision Instruments) on a two‐stage vertical puller (Narishige). The input and series resistances of AII cells were approximately 2 GΩ and 13–20 MΩ, respectively. Cells were discarded if the series resistance exceeded 40 MΩ, or if the holding current changed abruptly.
The rod bipolar cell Ca2+‐currents were evoked by 500 ms step depolarization from −70 mV to −10 mV and isolated using the following pipette internal solution: 120 mM Cs‐gluconate, 20 mM TEA‐Cl, 20 mM HEPES, 5 mM EGTA, 4 mM MgATP, 0.4 mM NaGTP, and 10 mM phosphocreatine. Presynaptic Ca2+‐currents were leak‐subtracted using the P/4 protocol. EPSCs were recorded from AII amacrine cells in ACSF containing picrotoxin (100 μM), strychnine (0.5 μM), and tetrodotoxin (TTX, 0.5 μM) to block GABAA receptor, glycine receptors, and voltage‐gated Na+ channels, respectively. All reagents were purchased from Tocris unless otherwise specified.
Data were acquired using PatchMaster (Heka Instruments) and analyzed using Igor Pro (Wavematrics) and MiniAnalysis software (Synaptosoft). Statistics were performed using an unpaired Student's t‐test.
Author contributions
SM, FL, AT, and FS performed the experiments, and SM, FL, FS, and TCS planned and analyzed the experiments and wrote the article.
Conflict of interest
The authors declare that they have no conflict of interest.
Supporting information
Expanded View Figures PDF
Table EV1
Table EV2
Review Process File
Acknowledgements
We thank G. Kiefer, I. Krüger, S. Brundaler, and N. Huang for excellent technical assistance. This work was supported by grants from NINDS and NIMH (to TCS) and the DFG (SFB894 and SCHM797/8‐1 to FS).
The EMBO Journal (2016) 35: 1098–1114
See also: T Moser (May 2016)
References
- Allwardt BA, Lall AB, Broeckerhoff S, Dowling JE (2001) Synapse formation is arrested in retinal photoreceptors of the zebrafish nrc mutant. J Neurosci 21: 2330–2342 [DOI] [PMC free article] [PubMed] [Google Scholar]
- Alpadi K, Magupalli VG, Käppel S, Köblitz L, Schwarz K, Seigel GM, Sung CH, Schmitz F (2008) RIBEYE recruits Munc119, a mammalian ortholog of the Caenorhabditis elegans protein unc119, to synaptic ribbons of photoreceptor synapses. J Biol Chem 283: 26461–26467 [DOI] [PMC free article] [PubMed] [Google Scholar]
- Boucard AA, Maxeiner S, Südhof TC (2014) Latrophilins function as heterophilic cell‐adhesion molecules by binding to teneurins: regulation by alternative splicing. J Biol Chem 289: 387–402 [DOI] [PMC free article] [PubMed] [Google Scholar]
- Buran BN, Strenzke N, Neef A, Gundelfinger ED, Moser T, Liberman MC (2010) Onset coding is degraded in auditory nerve fibers from mutant mice lacking synaptic ribbons. J Neurosci 30: 7587–7597 [DOI] [PMC free article] [PubMed] [Google Scholar]
- Dembla M, Wahl S, Katiyar R, Schmitz F (2014) ArfGAP3 is a component of the photoreceptor synaptic ribbon complex and forms an NAD(H)‐regulated, redox‐sensitive complex with RIBEYE that is important for endocytosis. J Neurosci 34: 5245–5260 [DOI] [PMC free article] [PubMed] [Google Scholar]
- Dick O, tom Dieck S, Altrock WD, Ammermüller J, Weiler R, Garner CC, Gundelfinger ED, Brandstätter JH (2003) The presynaptic active zone protein bassoon is essential for ribbon synapse formation in the retina. Neuron 37: 775–786 [DOI] [PubMed] [Google Scholar]
- tom Dieck S, Altrock WD, Kessels MM, Qualmann B, Regus H, Brauner D, Fejtova A, Bracko O, Gundelfinger ED, Brandstätter JH (2005) Molecular dissection of the photoreceptor ribbon synapse: physical interaction of Bassoon and RIBEYE is essential for the assembly of the ribbon complex. J Cell Biol 168: 825–836 [DOI] [PMC free article] [PubMed] [Google Scholar]
- Frank T, Rutherford MA, Strenzke N, Neef A, Pangršič T, Khimich D, Fejtova A, Gundelfinger ED, Liberman MC, Harke B, Bryan KE, Lee A, Egner A, Riedel D, Moser T (2010) Bassoon and the synaptic ribbon organize Ca2+‐channels and vesicles to add release sites and promote refilling. Neuron 68: 724–738 [DOI] [PMC free article] [PubMed] [Google Scholar]
- Grabner CP, Gandini MA, Rehak R, Le Y, Zamponi GW, Schmitz F (2015) RIM1/2‐mediated facilitation of Cav1.4 channel opening is required for Ca2+‐stimulated release in mouse rod photoreceptors. J Neurosci 38: 13133–13147 [DOI] [PMC free article] [PubMed] [Google Scholar]
- Heidelberger R, Thoreson WB, Witkovsky P (2005) Synaptic transmission at retinal ribbon synapses. Prog Retin Eye Res 24: 682–720 [DOI] [PMC free article] [PubMed] [Google Scholar]
- Hildebrand JD, Soriano P (2002) Overlapping and unique roles for C‐terminal binding protein 1 (CtBP1) and CtBP2 during mouse development. Mol Cell Biol 22: 5296–5307 [DOI] [PMC free article] [PubMed] [Google Scholar]
- Hull C, Studholme K, Yazulla S, von Gersdorff H (2006) Diurnal changes in exocytosis and the number of synaptic ribbons at active zones of an ON‐type bipolar cell terminal. J Neurophysiol 96: 2015–2033 [DOI] [PMC free article] [PubMed] [Google Scholar]
- Jackman SL, Choi SY, Thoreson WB, Rabl K, Bartoletti TM, Kramer RH (2009) Role of the synaptic ribbon in transmitting the cone light response. Nature Neurosci 12: 303–310 [DOI] [PMC free article] [PubMed] [Google Scholar]
- Jarsky T, Tian M, Singer JH (2010) Nanodomain coupling of exocytosis is responsible for the signaling capability of a retinal ribbon synapse. J Neurosci 30: 11885–11895 [DOI] [PMC free article] [PubMed] [Google Scholar]
- Jing Z, Rutherford MA, Takago H, Frank T, Fejtova A, Khimich D, Moser T, Strenzke N (2013) Disruption of the presynaptic cytomatrix protein bassoon degrades ribbon anchorage, multiquantal release and sound encoding at the hair cell afferent synapse. J Neurosci 33: 4456–4467 [DOI] [PMC free article] [PubMed] [Google Scholar]
- Kaeser PS, Deng L, Wang Y, Dulubova I, Liu X, Rizo J, Südhof TC (2011) RIM proteins tether Ca2+‐channels to presynaptic active zones via a direct PDZ‐domain interaction. Cell 144: 282–295 [DOI] [PMC free article] [PubMed] [Google Scholar]
- Kaeser PS, Regehr WG (2014) Molecular mechanisms for synchronous, asynchronous, and spontaneous neurotransmitter release. Annu Rev Physiol 76: 333–363 [DOI] [PMC free article] [PubMed] [Google Scholar]
- Katiyar R, Weissgerber P, Roth E, Dörr J, Sothilingam V, Garcia Garrido M, Beck SC, Seeliger M, Beck A, Schmitz F, Flockerzi V (2015) Influence of the β2‐subunit of L‐type voltage‐gated Cav channels on the structural and functional development of photoreceptor ribbon synapses. Invest Ophthalmol Vis Sci 15: 2312–2324 [DOI] [PubMed] [Google Scholar]
- Kavalali ET (2015) The mechanisms and functions of spontaneous neurotransmitter release. Nat Rev Neurosci 16: 5–16 [DOI] [PubMed] [Google Scholar]
- Khimich D, Nouvian R, Pujol R, tom Dieck S, Egner A, Gundelfinger ED, Moser T (2005) Hair cell synaptic ribbons are essential for synchronous auditory signalling. Nature 434: 889–894 [DOI] [PubMed] [Google Scholar]
- Kim MH, Li GL, von Gersdorff H (2013) Single Ca2+channels and exocytosis at sensory synapses. J Physiol 591: 3167–3178 [DOI] [PMC free article] [PubMed] [Google Scholar]
- Koulen P, Fletcher EL, Craven SE, Bredt DS, Wässle H (1998) Immunocytochemical localization of the postsynaptic density protein PSD‐95 in the mammalian retina. J Neurosci 18: 10136–10149 [DOI] [PMC free article] [PubMed] [Google Scholar]
- Lee YB, Glover CP, Cosgrave AS, Bienemann A, Uney JB (2005) Optimizing regulatable gene expression using adenoviral vectors. Exp Physiol 90: 33–37 [DOI] [PubMed] [Google Scholar]
- Libby RT, Lavallee CR, Balkema GW, Brunken WJ, Hunter DD (1999) Disruption of laminin b2‐chain production causes alterations in morphology and function of CNS. J Neurosci 19: 9399–9411 [DOI] [PMC free article] [PubMed] [Google Scholar]
- Luo F, Bacaj T, Südhof TC (2015) Synaptotagmin‐7 is essential for Ca2+‐triggered delayed asynchronous release but not for Ca2+‐dependent vesicle priming in retinal ribbon synapses. J Neurosci 35: 11024–11033 [DOI] [PMC free article] [PubMed] [Google Scholar]
- Lv C, Gould TJ, Bewersdorf J, Zenisek D (2012) High‐resolution optical imaging of zebrafish larval ribbon synapse protein RIBEYE, RIM2, and CaV 1.4 by stimulation emission depletion microscopy. Microsc Microanal 18: 745–752 [DOI] [PMC free article] [PubMed] [Google Scholar]
- Magupalli VG, Schwarz K, Alpadi K, Natarajan S, Seigel GM, Schmitz F (2008) Multiple RIBEYE‐RIBEYE interactions create a dynamic scaffold for the formation of synaptic ribbons. J Neurosci 28: 7954–7967 [DOI] [PMC free article] [PubMed] [Google Scholar]
- Matthews G, Fuchs P (2010) The diverse roles of ribbon synapses in sensory neurotransmission. Nat Rev Neurosci 11: 812–822 [DOI] [PMC free article] [PubMed] [Google Scholar]
- Mehta B, Snellman J, Chen S, Li W, Zenisek D (2013) Synaptic ribbons influence the size and frequency of miniature‐like evoked postsynaptic currents. Neuron 77: 516–527 [DOI] [PMC free article] [PubMed] [Google Scholar]
- Mercer AJ, Thoreson WB (2011) The dynamic architecture of photoreceptor ribbon synapses: cytoskeletal, extracellular matrix, and intramembrane proteins. Vis Neurosci 28: 453–471 [DOI] [PMC free article] [PubMed] [Google Scholar]
- Oesch NW, Diamond JS (2011) Ribbon synapses compute temporal contrast and encode luminance in retinal rod bipolar cells. Nat Neurosci 14: 1555–1561 [DOI] [PMC free article] [PubMed] [Google Scholar]
- Protti DA, Llano I (1998) Calcium currents and calcium signaling in rod bipolar cells of rat retinal slices. J Neurosci 18: 3715–3724 [DOI] [PMC free article] [PubMed] [Google Scholar]
- Reim K, Regus‐Leidig H, Ammermüller J, El‐Kordi A, Radyushkin K, Ehrenreich H, Brandstätter JH, Brose N (2009) Aberrant function and structure of retinal ribbon synapses in the absence of complexin3 and complexin4. J Cell Science 122: 1352–1361 [DOI] [PubMed] [Google Scholar]
- Rodríguez CI, Buchholz F, Galloway J, Sequerra R, Kasper J, Ayala R, Stewart AF, Dymecki SM (2000) High‐efficiency deleter mice show that FLPe is an alternative to Cre‐loxP. Nat Genet 25: 139–140 [DOI] [PubMed] [Google Scholar]
- Schmitz F (2009) The making of synaptic ribbons: how they are built and what they do. Neuroscientist 15: 611–624 [DOI] [PubMed] [Google Scholar]
- Schmitz F, Königstorfer A, Südhof TC (2000) RIBEYE, a component of synaptic ribbons: a protein's journey through evolution provides insight into synaptic ribbon function. Neuron 8: 857–872 [DOI] [PubMed] [Google Scholar]
- Schmitz F, Tabares L, Khimich D, Strenzke N, de la Villa‐Polo P, Castellano‐Muñoz M, Bulankina A, Moser T, Fernández‐Chacón R, Südhof TC (2006) CSPalpha‐deficiency causes massive and rapid photoreceptor degeneration. Proc Natl Acad Sci USA 103: 2926–2931 [DOI] [PMC free article] [PubMed] [Google Scholar]
- Schwenk F, Baron U, Rajewsky K (1995) A cre‐transgenic mouse strain for the ubiquitous deletion of loxP‐flanked gene segments including deletion in germ cells. Nucleic Acids Res 23: 5080–5081 [DOI] [PMC free article] [PubMed] [Google Scholar]
- Sheets L, Kindt KS, Nicolson T (2012) CaV1.3 channels regulate synaptic ribbon size and are required for synaptic maintenance in sensory hair cells. J Neurosci 32: 17273–17286 [DOI] [PMC free article] [PubMed] [Google Scholar]
- Sheets L, Trapani JG, Mo W, Obholzer N, Nicolson T (2011) Ribeye is required for presynaptic Ca(V)1.3a channel localization and afferent innervation of sensory hair cells. Development 138: 1309–1319 [DOI] [PMC free article] [PubMed] [Google Scholar]
- Singer JH, Diamond JS (2003) Sustained Ca2+ entry elicits transient postsynaptic currents at a retinal ribbon synapse. J Neurosci 23: 10923–10933 [DOI] [PMC free article] [PubMed] [Google Scholar]
- Singer JH, Lassova L, Vardi N, Diamond JS (2004) Coordinated multivesicular release at a mammalian ribbon synapse. Nature Neurosci 7: 826–833 [DOI] [PubMed] [Google Scholar]
- Snellman J, Mehta B, Babai N, Bartoletti TM, Akmentin W, Francis A, Matthews G, Thoreson W, Zenisek D (2011) Acute destruction of the synaptic ribbon reveals a role for the ribbon in vesicle priming. Nat Neurosci 14: 1135–1141 [DOI] [PMC free article] [PubMed] [Google Scholar]
- Soto F, Watkins KL, Johnson RE, Schottler F, Kerschensteiner D (2013) NGL‐2 regulates pathway‐specific neurite growth and lamination, synapse formation, and signal transmission in the retina. J Neurosci 33: 11949–11959 [DOI] [PMC free article] [PubMed] [Google Scholar]
- Tachibana M, Okada T, Arimura T, Kobayashi K, Piccolino M (1993) Dihydropyridine‐sensitive calcium current mediates neurotransmitter release from bipolar cells of the goldfish retina. J Neurosci 13: 2898–2909 [DOI] [PMC free article] [PubMed] [Google Scholar]
- Tian L, Hires SA, Mao T, Huber D, Chiappe ME, Chalasani SH, Petrean L, Akerboom J, McKinney SA, Schreiter ER, Bargmann CI, Jayaraman V, Svoboda K, Looger LL (2009) Imaging neural activity in worms, flies and mice with improved GCaMP calcium indicators. Nat Methods 6: 875–881 [DOI] [PMC free article] [PubMed] [Google Scholar]
- Truckenbrodt S, Rizzoli SO (2014) Spontaneous vesicle recycling in the synaptic bouton. Front Cell Neurosci 8: 409 [DOI] [PMC free article] [PubMed] [Google Scholar]
- Van Epps HA, Hayashi M, Lucast L, Stearns GW, Hurley JB, De Camilli P, Brockerhoff SE (2004) The zebrafish nrc mutant reveals a role for the polyphosphoinositide phosphatase synaptojanin1 in cone photoreceptor ribbon anchoring. J Neurosci 24: 8641–8650 [DOI] [PMC free article] [PubMed] [Google Scholar]
- Venkatesan JK, Natarajan S, Schwarz K, Mayer SI, Alpadi K, Magupalli VG, Sung CH, Schmitz F (2010) Nicotinamide adenine dinucleotide‐dependent binding of the neuronal Ca2+ sensor protein GCAP2 to photoreceptor synaptic ribbons. J Neurosci 30: 6559–6576 [DOI] [PMC free article] [PubMed] [Google Scholar]
- Veruki ML, Mørkve SH, Hartveit E (2003) Functional properties of spontaneous EPSCs and non‐NMDA receptors in rod amacrine (AII) cells in the rat retina. J Physiol 549: 759–774 [DOI] [PMC free article] [PubMed] [Google Scholar]
- Wahl S, Katiyar R, Schmitz F (2013) A local, periactive zone endocytic machinery at photoreceptor synapses in close vicinity to synaptic ribbons. J Neurosci 33: 10278–10300 [DOI] [PMC free article] [PubMed] [Google Scholar]
- Wan L, Almers W, Chen W (2005) Two ribeye genes in teleosts: the role of RIBEYE in ribbon formation and bipolar cell development. J Neurosci 25: 941–949 [DOI] [PMC free article] [PubMed] [Google Scholar]
- Wang Y, Okamoto M, Schmitz F, Hofmann K, Südhof TC (1997) Rim is a putative Rab3 effector in regulating synaptic‐vesicle fusion. Nature 388: 593–598 [DOI] [PubMed] [Google Scholar]
- West MC, McDermott BM Jr (2011) RIBEYE a‐mCherry fusion protein: a novel tool for labeling synaptic ribbons of the hair cell. J Neurosci Methods 197: 274–278 [DOI] [PubMed] [Google Scholar]
- Wong AB, Rutherford MA, Gabrielaitis M, Pangrsic T, Götfert F, Frank T, Michanski S, Hell S, Wolf S, Wichmann C, Moser T (2014) Developmental refinement of hair cell synapses tightens the coupling of Ca2+ influx to exocytosis. EMBO J 33: 247–264 [DOI] [PMC free article] [PubMed] [Google Scholar]
- Xu J, Morris LM, Michalakis S, Biel M, Fliesler SJ, Sherry DM, Ding XQ (2012) CNGA3 deficiency affects cone synaptic terminal structure and function and leads to secondary rod dysfunction and degeneration. Invest Opthalmol Vis Sci 53: 1117–1129 [DOI] [PMC free article] [PubMed] [Google Scholar]
- Xu J, Pang ZP, Shin OH, Südhof TC (2009) Synaptotagmin‐1 functions as a Ca2+ sensor for spontaneous release. Nat Neurosci 12: 759–766 [DOI] [PMC free article] [PubMed] [Google Scholar]
- Zabouri N, Haverkamp S (2013) Calcium channel‐dependent molecular maturation of photoreceptor synapses. PLoS ONE 8: e63853 [DOI] [PMC free article] [PubMed] [Google Scholar]
- Zanazzi G, Matthews G (2009) The molecular architecture of ribbon presynaptic terminals. Mol Neurobiol 39: 130–148 [DOI] [PMC free article] [PubMed] [Google Scholar]
- Zenisek D, Davila V, Wan L, Almers W (2003) Imaging calcium entry sites and ribbon structures in two presynaptic cells. J Neurosci 23: 2538–2548 [DOI] [PMC free article] [PubMed] [Google Scholar]
- Zenisek D, Horst NK, Merrifield C, Sterling P, Matthews G (2004) Visualizing synaptic ribbons in the living cell. J Neurosci 24: 9752–9759 [DOI] [PMC free article] [PubMed] [Google Scholar]
Associated Data
This section collects any data citations, data availability statements, or supplementary materials included in this article.
Supplementary Materials
Expanded View Figures PDF
Table EV1
Table EV2
Review Process File


